Transportation Accessibility and Location Choice of Japanese-Funded Electronic Information Manufacturing Firms in Shanghai

1
College of Geography and Environmental Sciences, Zhejiang Normal University, Jinhua 321004, China
2
Key Laboratory of Regional Sustainable Development Modeling, CAS, Beijing 100101, China
3
Institute of Geographic Science and Natural Resources Research, CAS, Beijing 100101, China
4
Department of Geography, University of Lethbridge, Lethbridge, AB T1K 3M4, Canada
*
Author to whom correspondence should be addressed.
Sustainability 2018, 10(2), 390; https://doi.org/10.3390/su10020390
Submission received: 25 October 2017
/
Revised: 29 January 2018
/
Accepted: 30 January 2018
/
Published: 2 February 2018
(This article belongs to the Section Environmental Sustainability and Applications)
Abstract
:With the rapid development of globalization, information communication and transportation, it is argued that the effect of transportation accessibility in the location choice of manufacturing firms has diminished. However, comprehensive and systematic research on the impact of transportation accessibility on firm location choice in cities remains scarce. Taking Shanghai as the research area, this paper uses a catalog of Japanese-funded electronic information manufacturing firms to explore the influence of transportation accessibility on their location choice. The paper first describes firm distribution using the nuclear density estimation method. The Poisson regression model is then used to estimate the significance of transportation accessibility in influencing firm location. The empirical results show that most of the firms are concentrated in the inner suburbs of Shanghai, with only a small number in the outer suburban areas. The spatial coupling relationship between firm distribution and transportation accessibility is significant. These firms tend to choose areas with good accessibility to transportation infrastructure, and, in particular, the effect of airport accessibility is significant. Compared with the joint venture enterprises, wholly-owned Japanese enterprises are more inclined to be in areas with better transportation accessibility.
1. Introduction
In the literature on classical location theory, modern location theory, and new economic geography, it is not difficult to find that changes in transportation costs influence the flow of economic factors, and consequently, the agglomeration and development of economic activities [1]. The accessibility of transportation infrastructure is an important indicator for measuring regional transportation costs. Hansen (1959) first proposed the concept of accessibility and defined it as the chance of interactions between nodes in a transportation network [2]. In the context of urban planning, Morriss et al. (1979) further defined the concept as the ease that economic activity can move from one place to another through a certain transportation network [3]. From the perspective of urbanization economies, accessibility is often conceptualized as the benefits arising from well-developed transportation infrastructure, along with better access to larger labor pools, potential customers and suppliers, and universities and research institutions [4]. Urbanization economies, therefore, refer largely to transport or production cost benefits derived from good market accessibility [5]. Good accessibility of transportation infrastructure can create necessary opportunities for individuals or firms to expand business [6].
With the rapid development of informalization and modern transportation facilities, the commute time and transport cost between two regions have reduced significantly. Does this mean that distance and transportation accessibility no longer influence the location selection of manufacturing firms? This has become one of the focuses in the current academic debate. Some scholars have confirmed that the accessibility of transportation infrastructure is still an important factor affecting the location of the high-tech industry. For example, Atzema (2001) found that accessibility by car was a decisive factor and that, even in an era dominated by electronic communication, physical accessibility remained an important explanatory factor for the location decisions of firms [7]. Other scholars, however, believe that distance is no longer a determinant of the cost in the era of electronic communications. Cairncross (2001), for example, argued that new communications technologies were rapidly obliterating distance as a relevant factor in how we conduct our business and personal lives [8]. Therefore, it is imperative to provide empirical evidence on whether the accessibility of transportation infrastructure plays an important role in the location choice of manufacturing firms [9].
The literature on the impact of transportation accessibility on the location choice of firms focuses predominantly on two aspects. The first is the impact of accessibility on the location choice of service and logistics enterprises [10,11]. The second is the influence of the accessibility of certain transportation facilities, such as airports, railway stations and subway stations, on the location of surrounding firms [12]. Compared with the electronic information manufacturing industry, producer services and logistics firms are, in general, more attracted to physically accessible locations [4,13]. This does not mean, however, that the accessibility of transportation facilities plays little or no role in the location choice of the electronic information manufacturing industry [5]. The studies by Atzema (2001) and Sargent (1987) revealed that metropolitan areas seem to be more attractive to the electronic information manufacturing firms because of their higher accessibility to public transportation [7,14].
There are several limitations in the literature on the relationship between transportation accessibility and manufacturing firm location. First, there is a lack of comprehensive and systematic analysis on how transportation accessibility affects firm location choices in the high-tech industry. Second, the location choice studies concerning electronic information manufacturing firms, especially those that are foreign-owned, often neglect the effect of the accessibility of transportation facilities in a city. Third, the regional accessibility is often measured by the index of Euclidean distance or road network density [15]. The effects of transportation networks, road class factors, as well as the freight volume for passenger and freightage of different traffic modes, are hardly quantified [16]. Fourth, the existing studies on the location choice of the electronic information industry tend to focus on global [17], national or regional scales [14,18]. Yet, how transportation accessibility affects the location choice in a metropolitan scale, receives little attention. Therefore, there is a need to explore further how transportation accessibility influences firm location choices in the high-tech industry across different scales, especially at a city level.
This paper aims to provide new insights into the determining factors of the location decision of electronic information manufacturing firms, and to quantify the relative importance of the accessibility to different types of transportation facilities in Shanghai. The data on firm location and ownership were derived from the catalog of Japanese Electronic Information Manufacturing Enterprises. Using Arc GIS software and adopting the weighted average travel time indicator, this paper undertakes a quantitative analysis of the accessibility of Shanghai’s important transportation facilities based on ground transportation networks. The Poisson regression model is used to measure the influence of the accessibility of different transportation facilities on the distribution of Japanese-funded electronic information manufacturing firms in Shanghai.
The following section reviews the relevant literature to position this study in the context of earlier theoretical and empirical studies on the topics of location choice and dynamic mechanisms of electronic information manufacturing firms. Then, the methodology for the empirical study is described. The empirical results are presented in the following section. This paper is concluded by discussing the empirical results in relation to the relevant literature.
2. Literature Review
The electronic information manufacturing industry could be considered to be one of the most globalized industries. While its production chain links are dispersed globally, its firm locations are often clustered in specific localities. Studying the locations of electronic information manufacturing firms is an important research area in economic geography. The existing research on this subject has been differentiated mainly by three firm types. The first is to explore the location choice of producer service firms, especially software firms [19,20,21]. The second is to analyze the location decisions of information firms, including service firms and manufacturing firms [22]. The third is to investigate the location choices of the electronic information manufacturing industry, including the semiconductor manufacturing industry [14], ICT manufacturing industry [18,23] and electronic communications equipment manufacturing industries [24]. In the literature, accessibility is believed to have a significant impact on the distribution of the electronic information manufacturing industry. Given the focus of this research, the following review focuses on the literature regarding the location choice of electronic information manufacturing firms, specifically aiming to elaborate the relationship between accessibility and industrial location theory, the location choice path and its dynamic mechanisms.
2.1. The Relationship between Accessibility and Industrial Location Theory
Location theory suggests that accessibility is an important determinant of industrial location [25]. Classical industrial location models analyze the locations of firms by minimizing the cost of access to different resources [26,27,28]. Traditional studies of industrial locations indicate the significance of accessibility to the central business district (CBD) and transportation infrastructure [29,30], asserting there is a high correlation between the accessibility of transportation facilities and the location choice of industrial locations. Henderson (2001) found that the construction of transportation facilities could effectively optimize local accessibility, resulting in a massive drop in transportation costs, which was beneficial for attracting firms [31]. On this basis, Krugman (1991) proposed “the core-edge” mode and put forth that the transportation cost of manufactured goods followed the principle of the “iceberg transportation cost hypothesis”, so that when the transportation cost went down, manufacturing firms tended to agglomerate in the same area, developing into a regional manufacturing center [32].
This line of argument differs from the neoclassical location theory, in which the accessibility of transportation facilities has varied effects on industrial location, based on different spatial scales. This means the relationship between the accessibility of transportation facilities and industrial locations is complex and not just a single directional impact of the former on the latter [25]. On a national scale, Buurman and Rietveld (1999) concluded that there was a positive influence of the accessibility to transportation facilities on a manufacturing firm’s location in Thailand, but the effect’s intensity was small [33]. Similar findings can be seen in Holl’s studies of Portugal [34,35]. Contrary to these studies, Guzman-Anaya (2017) found that the accessibility of transportation facilities seemed to be a deterrent for a Japanese firm’s location, possibly as a result of a preference for Greenfield location sites [36]. Furthermore, at an inner-city scale, other scholars found a positive influence of proximity to the CBD, airports, and supporting services on the location choice of foreign direct investment (FDI) in major coastal cities, such as Guangzhou [37] and Shanghai [38], while Wei et al., (2010) found that proximity to the railway station was a negative factor for foreign direct investment (FDI) in Nanjing [39]. Comparing different industries, although the effect of the accessibility of transportation facilities was smaller on the electronic information manufacturing industry than on the producer services and logistics firms, Bok and Oort (2011) [4], Atzema (2001) [7], and Weterings (2002) [18] all agreed that accessibility still has a significant impact on the location of the electronic information manufacturing industry. These conflicting empirical findings indicate there is a need to study further the effects of the accessibility to transportation infrastructures on industrial location. On one hand, the current studies have shown that varied effects of transportation accessibility may be due to the complexity of urban structure and local institutions. On the other hand, these studies are context-specific and fail to produce generalizable results because of unique regional and local contexts, on different scales and in different industries.
2.2. Location Choice Route of Electronic Information Manufacturing Firms
Based on the spatial scale perspective, the literature on the location choice of electronic information manufacturing firms has examined three different scales: the global scale, the national or regional scale, and the city scale.
2.2.1. Global Scale
At a global level, empirical evidence suggests that ICT-led growth is strongly localized geographically in locations such as Silicon Valley, Dresden, and Bangalore [40]. Scholars typically consider the semiconductor industry, computer industry, and electronic communication equipment manufacturing industry as examples, and examine them from the perspective of value chain separation. They have found that different links of value chains tend to select different locations. The high-end links of value chains are mainly concentrated in the developed countries and regions of the west, while the low-end links are distributed across developing countries and regions. Peter Dickens’ early study took the semiconductor industry as an example, and found that the technology-intensive design sectors were mainly concentrated in the United States, Japan, and other regions [23]. Capital-intensive sectors of chip manufacturing were mainly concentrated in the United States, Japan, China, and Taiwan, while labor-intensive assembly and packaging links were mainly concentrated in Southeast Asia, a region rich in resources and low in cost.
Amid the continuous advancement of economic globalization and the sharp increases in Chinese innovation capabilities, some scholars in China have conducted further analyses of the location selection tendency for different links in the value chain. They have found that in addition to the assembly link, the ordinary parts of the manufacturing process have been gradually shifting to developing countries. Scholars, such as Sun and Grimes [41], found that although Western technology corporations continue to dominate the most innovative work that is shaping the trajectory of internet-related activities, the center of gravity of much of the manufacturing and assembly work for key products and devices has shifted to Asia, with China playing an increasingly important role in production.
2.2.2. National or Regional Scale
At a national or regional level, most scholars have concluded that electronic information manufacturing firms, whose spatial distribution is very uneven but significantly agglomerated, are mainly concentrated in a few metropolitan areas, developed provinces and large cities. Such a distribution pattern can be seen in both developed and the developing countries. For example, in studying electronic and communications equipment manufacturing firms in China, scholars concluded that the manufacturing sector has had a strong tendency to concentrate in five city-regions along the Eastern coast, with the highest concentration being in Guangdong province [42]. They argued that electronic communications equipment manufacturing firms in China formed three convergent areas, including the Yangtze River Delta, Pearl River Delta and Bohai Rim region. Taking the Netherlands as the study area, Oort and Atzema (2004) found that larger cities have acted as breeding grounds for new ICT firms and entrepreneurship, due to localized knowledge spillovers [43]. Firms, especially new firms, have thus been inclined to locate in large cities. Weterings and Boschma (2002) also considered the Netherlands, and came to a similar conclusion—that the ICT industry in the Netherlands has gradually spread from a strong metropolitan concentration in the Randstad, to the rest of the country [18]. Sargent (1987) took Japan as an example and demonstrated empirically that there were two major concentrations of Japanese semiconductor manufacturers, one in the capital region, and the other on the island of Kyushu in Southernmost Japan [14].
The above studies tend to assume that there is no heterogeneity between firms, which is not in accordance with reality. In contrast to the homogeneity assumption, taking the Dutch ICT manufacturing industry as an example, Atzema (2001) identified some differences in the clustering characteristics of electronic information manufacturing firms depending on their scale and type [7]. He concluded that large ICT manufacturing firms were inclined to locate within a large city, and many of them preferred a location outside the city center but near the suburban residential locations of their core workers. Comparing the internet and media subsectors, ICT firms producing hardware were less concentrated. Wang and Lin (2008) also confirmed that the ICT manufacturing sector presented a very different spatial pattern from that of the ICT service sector [42].
2.2.3. City Scale
Compared to the study of the above-mentioned global, national and regional macro levels, fewer studies have investigated the distribution of electronic information manufacturing firms on a city scale, and existing ones mainly focus on Beijing, Guangzhou, Suzhou and Kyushu as well as other cities with advanced electronic information manufacturing industries. The results have shown that electronic information manufacturing firms had a significant concentration of distribution within these cities, and gradually dispersed over time, from the central to the peripheral urban areas. In other words, the suburbanization phenomenon began to appear as time went on. From the value chain perspective, the manufacturing link of electronic information manufacturing firms is mainly distributed in suburban development zones. Some scholars have analyzed the distribution of electronic information manufacturing firms within cities based on macroeconomic industrial data. Chinese scholars, such as Yan (1998), concluded that the information manufacturing industry in the old urban area gradually shrunk and began to move to the outskirts, so that new suburban districts grew sharply to occupy a dominant position in attracting electronic information manufacturing firms [44]. Some scholars have attempted to research this topic empirically based on micro-enterprise data. For instance, Lu and Li (2012) took Beijing as an example and found that the distribution of electronic information manufacturing firms largely showed trends of agglomeration and suburbanization [45]. The production chain links of large electronic information firms also showed clustering distribution and obvious suburbanization [46]. Yuan et al. (2010) took the urban district of Suzhou as the study area and found that the high-value concentration area of information and communication firms had gradually transferred from the old urban area to the periphery, forming a cluster distribution centered in the old urban area and new development zone [24]. Overall, the development zones, the distant suburbs, or exurbs, of Eastern coastal cities in China are important spatial carriers of electronic information manufacturing firms. The emergence of these development zones is inseparably linked to foreign investment. Scholars, such as Yang and Hsia (2007) and Wei et al. (2009), found that trans-border investment by foreign information-technology (IT) companies drove the development of a new industrial space in Suzhou [47,48]. Sargent (1987) found that the semiconductor firms in Kyushu are mainly distributed in the Southeastern Fukuoka prefecture and Northern Oita prefecture, which are far from Nagasaki, the high urbanization area and capital of Kyushu [14]. Based on the above analysis, the following research hypothesis is proposed.
Hypothesis 1.
Japanese-funded electronic information manufacturing firms in Shanghai show significant concentration and a clear suburbanization trend.
2.3. Dynamic Mechanisms of Location Choice
There are numerous factors behind the location choices of electronic information manufacturing firms, including cost, market, accessibility, agglomeration economic effect, government policy, FDI, supply chain relation, economic crises, innovation, ecological environment, and decision-making behavior. The roles of these factors are often scale dependent and different mechanisms of location choice are identified in research on different scales. At a global scale, many scholars have argued that the traditional cost factors, including land cost, production cost, labor cost, transportation cost, and so on, are the most important factors in the location choice of the world’s electronic information manufacturing firms. For instance, Görg and Ruane (1999) believed the costs of skilled and unskilled labor could drive the global production location decisions for different parts of the production process [17]. Sun and Grimes (2016) also found that a major consequence of these developments has been to push much global ICT manufacturing towards Asia and, more recently, much of the assembly activity to China, in order to benefit from both lower production costs and a rapidly growing market for ICT products [41]. At national or regional scales, Sargent (1987) found that Kyushu had become the world’s third largest production base for semiconductor manufacturing industries, a development closely related to factors such as the accessibility of transportation facilities, preferential government policies, a high-quality ecological environment, the low cost of land, a plentiful, cheap, and high-quality workforce, and proximity to the Southeast Asian semiconductor market [14]. At the same time, he also stressed that as the accessibility of transportation facilities improved gradually, a decline in the share of transportation in the cost of manufacturing semiconductors could not be ignored. Atzema (2001) found that the distribution of ICT was mainly affected by the accessibility of transportation facilities, the labor force, the market, supply chain relationships, and proximity to education centers, and insisted that the accessibility of transportation facilities was the most significant factor [7]. The existing research in China and elsewhere has thus confirmed that the accessibility of transportation infrastructure is still an important location choice mechanism for technology-intensive industries, including electronic information manufacturing firms.
At a city scale, with the help of economic census data, Yuan et al. (2010) and Lu and Li (2012) analyzed the dynamic mechanisms of location choice by the electronic information manufacturing industry, in Beijing and Suzhou, respectively [24,45]. The former drew the conclusion that firms in Beijing preferred to locate in the development zones with good transportation facilities and preferential policy support, while the latter held the view that, in addition to the development zones, the accessibility of transportation facilities, market mechanisms, and the ecological environment were also important driving forces of firms’ location choices. Yang and Hsia (2007) and Wei et al. (2009) found that government policy in Suzhou was the most important factor in attracting cross-border investment by information and communication firms [47,48]. This involved establishing development zones, providing government services, constructing urban infrastructure, improving the living environment, and other measures designed to attract a large number of information manufacturing firms. The development zones with their various preferential policies thus became an important gathering place for electronic information manufacturing firms. In addition, through comparative analysis of the factors influencing the distribution of ICT enterprises in some cities in the Netherlands, Atzema (2001) found that Amsterdam and Utrecht had become favorable locations for ICT firms given that the two cities had the advantage of great access to the national market and good accessibility to public transportation and by automobile, making them appear more attractive than other localities in the country [7].
In summary, there has been an increasing number of studies on the dynamic mechanisms of location choice for electronic information manufacturing firms, with the majority of the studies confirming that the accessibility of transportation facilities remains an important consideration. Accessibility by car has been revealed as a decisive factor affecting the location choice of firms. This outcome suggests that even in an era dominated by electronic communication, physical accessibility remains an important explanatory factor for the location decisions of high-tech firms [7]. Accordingly, we proposed another working hypothesis:
Hypothesis 2.
Japanese-funded electronic information manufacturing firms in Shanghai are inclined to locate in areas with good accessibility to airports, subway stations, railway stations, ports, and other transportation facilities.
3. Study Methods and Data
3.1. Study Area
The empirical part of this paper uses Shanghai as the study area. Located in the middle of China’s long coastline, it is the biggest commercial city and economic center in China. Administratively, Shanghai consists of 18 districts (Figure 1), distributed into the central urban area, the suburbs and the exurbs. The central urban area of Shanghai includes Huangpu, Xuhui, Changning, Jingan, Putuo, Hongkou, Yangpu, Zhabei, and Luwan districts. The suburbs of Shanghai include Pudong, Minhang, Baoshan, Jiading and Songjiang districts. The exurbs of Shanghai include Qingpu, Fengxian, Jinshan and Chongming districts.
Since 1978, when economic reforms and open-door policies started to be implemented, Shanghai gradually becomes one of the most important locations for foreign-owned enterprises investing in China. In 1980s, the electronic information manufacturing industry in Japan became one of the largest and most successful industries in the world. There was a pressing need to expand the electronic information manufacturing industry to meet the demands of the global market and reduce the production costs, to make the industry competitive. Japanese firms began to invest heavily in manufacturing industries in China [49]. Japanese-funded electronic information manufacturing industry was one of the largest industries invested in China [50]. Japanese firms prefer locations with a large and educated workforce and advanced transportation infrastructure [36]. As one of the largest metropolises in China, Shanghai is endowed with some of the country’s best transportation facilities and has nearly the highest number of university graduates. Consequently, Shanghai became the highest investment recipient of China [14]. This study selected Shanghai as a case region, in the hope of revealing the effect of transportation infrastructure on the location choices of the Japanese-owned firms in an emerging market.
3.2. Data Sources
This paper focuses on the electronic information manufacturing firms in Shanghai as its research object, including electronic equipment, electronic components, devices, instruments, and other production industries. The data are mainly derived from the enterprise database registered by the Shanghai Administration of Industry and Commerce. In addition, some data are taken from the “Directory of Permanent Representatives of Foreign Enterprises in Shanghai in 2013” and the “Directory of Business in Japan from 1996 to 1997”, including company names, sizes, natures, addresses, business scopes, and other information. The firms with an unclear address and establishment time records, or those whose entries were canceled or revoked during the study period, are excluded from this paper. This yields a total of 599 firms with valid and complete information, as of 2012. Except where stated otherwise, all Japanese-funded electronic information firms mentioned in this study are manufacturing industries. No service firms are included. The analysis results are reported for all Japanese firms (Group 1), the wholly Japanese-owned firms (Group 2), and Sino-Japanese joint ventures (Group 3).
In processing locational data, two spatial units are employed for data measurement. The first is a grid system that divides the entire area of Shanghai into a mesh of 300 m by 300 m. This grid system allows an accurate assessment of transportation accessibility across Shanghai. Based on Shanghai’s administrative systems, the second spatial unit in data measurement is street blocks or townships, which is equivalent to census subdivision. This spatial unit was selected to measure the influence of transportation accessibility on firm location choice. The number of firms observed in every street blocks or townships is the dependent variable.
3.3. Methods for Data Analysis
3.3.1. Kernel Density Estimation Method
This method was used to describe the spatial clustering features, by transforming a series of discrete point groups into continuous density maps. Because of its advantages in terms of visual presentation and scientific validity, the kernel density estimation method is widely used in analyzing spatial clustering characteristics of geographical elements [47]. Based on this, Japanese-funded electronic information manufacturing firms were abstracted as points, and the kernel density estimation method was used in this paper to describe the spatial distribution of firms.
3.3.2. Global Moran’s I Index
Global Moran’s I index was used to examine the relationships between similarity, dissimilarity (positive spatial correlation and negative spatial correlation) and mutual independence for adjacent areas. The expression of Moran’s I index is as follows.
where N is the number of spatial units (street blocks or townships) in Shanghai; wij represents the spatial weight; xi and xj represent the attribute values of spatial unit i and spatial unit j, respectively; and is the average of the attribute for all the spatial units. The significance levels of the results from the Global Moran’s I test are analyzed by the z test.
where E(I) is the mathematical expectation and Var(I) is the variance.
The value of Global Moran’s I index is between −1 to 1. If the value of Global Moran’s I index is close to 1, it will show many regions with similar attribute values together, whereas if the value is closer to −1, it will show many regions with dissimilar attribute values together. If the value of Global Moran’s I index is close to 0, the result will show all regions with the attribute values distributed randomly.
3.3.3. Measuring Accessibility of Transportation Facilities
Evaluation Index
Airports, subway stations, railway stations, and ports are important transportation means, within and between cities, and are used by both workers and goods. The closer these transportation facilities are, the better an area’s transportation network accessibility is, and the more attractive the area becomes to foreign firms [14,49].
The evaluation index of accessibility from any node (i) inside a region to transportation facility (j) is as follows.
where, i represents any point inside a region; Ai represents the accessibility of node i; Tij represents the shortest travel time between node i and transportation facility j, based on the land traffic network; and Mj represents the weight of transportation facility j. It should be noted that the better the accessibility is, the lower the travel time is.
Technical Route
The accessibility of transportation facilities is not only associated with the location of transportation facilities, but also related to the freight volume for the passenger and freightage of different traffic modes. Also, various methods to evaluate the accessibility of transportation infrastructure have been developed in the literature, including distance method, accumulating opportunity method, gravity method, equilibrium coefficient method, and topological method [5]. Considering the route with the shortest time cost route in the transportation network, along with the attractiveness of different transportation facilities to passengers, the weighted average travel time indicator is adopted in this research.
In Equation (4), shown below, w1, w2, w3 and w4 represent the weightings of the subways, ports, civil airports and railway stations, respectively, while Ti1, Ti2, Ti3 and Ti4 represent the weighted average travel times of node i, based on the accessibility of the subways, ports, civil airports and railway stations, respectively. Applying this to the passengers and goods transportation volumes of different traffic modes in Shanghai, a method of weight setting for each traffic mode, based on comprehensive transportation networks made by Wu et al. [51] and Chen et al. [52], is adopted. Specifically, we used the method that combines the expert scoring and the share of passenger and freight volume of all kinds of transport modes mentioned above to total passenger and freight volume, to determine the weighting of the subways, ports, civil airports and railway stations. This resulted in weightings of 0.18 for subways, 0.40 for ports, 0.20 for airports and 0.22 for railway, in estimating the transportation accessibility of any given location, i. The result Ai represents the comprehensive accessibility of the transportation facilities in location i.
In order to verify the attractiveness of the accessibility of Shanghai’s transportation facilities to Japanese-funded electronic information manufacturing firms, this paper reports accessibility of individual (wj ∗ Tij), as well as weighted, total (Ai) transportation facilities, in order to get a comprehensive picture of the accessibility of all the transportation facilities in Shanghai. The number of concentrated firms in different periods is then calculated, to examine the spatial coupling relation between the weighted total accessibility of the transportation facilities and the distribution of the firms.
The spatial analyst module functions of Arc GIS were used to estimate the accessibility of Shanghai, by processing the available geographic information. The steps necessary to calculate spatial accessibility are as follows: ① The entire area of Shanghai was divided into 75,351 grids of 300 by 300 m each. Each grid was extremely small, compared to the total area of Shanghai (about 0.63 million km2). At the start, the entire area covered by the grid was considered to have equal accessibility; ② according to the speeds required by the ‘Highway Engineering Standard Specifications of the People’s Republic of China (JTG B-2003)’, the speed limits of all levels of highway were determined (Table 1). Moreover, the speed of an area without any graded highway was set to 15 km/h. Where different graded highways co-existed inside a grid, the speed limit of the highest graded highway within that grid was considered to be the speed limit of the grid; ③ not all the areas close to highways can enjoy convenient access at the same level. Only the highway exits and their immediate surroundings are meaningful to city accessibility. Therefore, the above algorithm was amended using the amendment method used by Zhang and Lu [53]. All roads in the traffic network were categorized into different types and every road is classified as either closed or open. A two-dimensional array of categories of all the roads in the traffic network was then defined. The two-dimensional array was used to store the information whether or not all kinds of categories connect with each other. As many categories of roads may pass one grid, we needed to save the travel time of every category. When we calculated the travel time from the grid to other eight adjacent grids, we adjusted the algorithm according to four different situations.
3.4. Location Choice Model
The distribution of firms in street blocks or townships in Shanghai presents significant discretization characteristics. In the case of the discrete choice of firm location over a large number of small areas, the dependent variable takes on nonnegative integer values corresponding to the occurrence of rare events. However, there may be numerous zero counts in many spatial units. The Poisson regression model is an appropriate method for analyzing count data, stipulating that the number of firms in a small area follows a Poisson distribution [37].
Taking street blocks or townships as basic spatial units for analysis, we divided the Shanghai area into 215 units and selected the number of firms in every unit in 2012 as the dependent variable, Yi. Based on the assumption that Yi obeys the Poisson distribution taking λi as a parameter, the number of firms observed in every street block or township Yi was determined through the probability density function of Poisson distribution, as follows:
where Yi is the number of firms in every street block or township i; yi represents nonnegative integer values; represents the mean number of firms in every street block or township, i; in particular, as a statistical property of a Poisson distribution, it is also equivalent to the conditional variance, i.e.,
After taking the logarithm of Formula (7), we obtain Formula (8) as follows.
The maximum likelihood estimation (MLE) of parameter can be determined through the logarithmic likelihood function as follows:
A key assumption of the Poisson regression model is that the conditional mean of the dependent variable is equal to the conditional variance (also equivalent to λi), i.e.,
This paper adopted the following method to test if the Poisson regression model satisfied the assumption of Formula (10) above. Firstly, we assumed that Yi obeys the Poisson distribution taking λi as a parameter, and determining the estimation value of in combination with the estimation variance of Formula (9). Secondly, through auxiliary regression analysis of Formula (11) below, where represents the residual, we obtained the regression coefficient, , and tested the significance of . If was significantly higher than 0, the degree of super-discrete would be much higher and the original model would not satisfy the assumption of Formula (10). The negative binomial regression model was needed to replace the Poisson regression model, to estimate quasi-maximum likelihood estimation taking β as a parameter [54]. Otherwise, the original Poisson regression satisfied its assumption of the Formula (10), and the maximum likelihood estimation (MLE) of parameter was determined through Formula (9).
In revealing the relationship between firm location choice and transportation infrastructure, the average travel time to airports (AIRP), subway stations (SUBW), railway stations (RAIL), and ports (PORT) in every street block or township were employed as four independent variables, to measure the accessibility of transportation facilities, respectively.
In addition to the accessibility of transportation facilities, five controlled variables observed at every street block or township were introduced into this research. The first was based on the Euclidean distance (DIST) from the center of each street block or township to the seat of the Shanghai municipal government. Street blocks or townships closer to the center of a city are considered to have better transportation facilities and public service facilities and are therefore more attractive to foreign-funded firms. It is assumed that foreign manufacturing firms tend to locate in the urban core area because of an agglomeration effect [49]. The second controlled variable was a binary variable (GOVR) of whether a street block or township was the seat of the district government. Typically, the seat of the district government has better transportation infrastructure and higher administrative efficiency, conducive to firm operations and development. Numerous studies have also confirmed that foreign firms tend to favor the industrial cluster locations, because the agglomeration economy is conducive to sharing resources, thereby reducing investment risk and production costs [41,42]. Hence, the third controlled variable measured the degree of agglomeration, as represented by AGGL. It was estimated using the number of Japanese-funded electronic information manufacturing firms in a street block or township in 1995. The fourth controlled variable was centered on highly educated areas. The level of education in an area, especially the concentration of college graduates, is argued to be strongly related to positive business outcomes [55]. This means that highly educated and highly skilled labor with relevant skills appeals to foreign investors. It is assumed that a region with a high degree of expertise is conducive to attracting foreign-funded firms, so the number of talented individuals with a college degree or above is selected as a controlled variable, represented by TANT. Finally, in the development zone, the local government puts forward preferential policies, such as encouraging the withdrawal from the downtown area in favor of industrial parks and offering preferential taxes, land, and other measures conducive to attracting foreign investment [46]. It was assumed that Japanese-funded electronic information manufacturing firms are inclined to locate in these development zones (assigning “national level development zones” to 2 and assigning “municipal development zones” to 1), which is represented by ZONE.
4. Firm Distribution and Transportation Accessibility in Shanghai
4.1. The Results of Spatial Association Analysis
Taking street blocks or townships as basic spatial units, we applied the index of Global Moran’s I to explore the geographical agglomeration of Japanese-funded electronic information manufacturing firms in the entire city of Shanghai. The results show that the values of Global Moran’s I of Group 1 firms, and Group 2 firms are 0.002 and 0.0008, respectively, demonstrating that the two values of Global Moran’s I are positive, but the values are very small. Namely, there is significant positive spatial autocorrelation but a low agglomeration level in the adjacent areas. In contrast, the value of Group 3 firms is −0.002, which is closer to zero, with significant negative spatial autocorrelation in the adjacent areas. If only the central urban area of Shanghai is considered, the values of Global Moran’s I of Group 1 firms, Group 2 firms and Group 3 firms are 0.056, 0.055 and 0.036, respectively, which are all positive and significant, which indicates that the agglomeration levels of Group 1 firms, Group 2 firms and Group 3 firms increase dramatically, albeit at a low level.
4.2. The Spatial Distribution of Electronic Information Manufacturing Firms
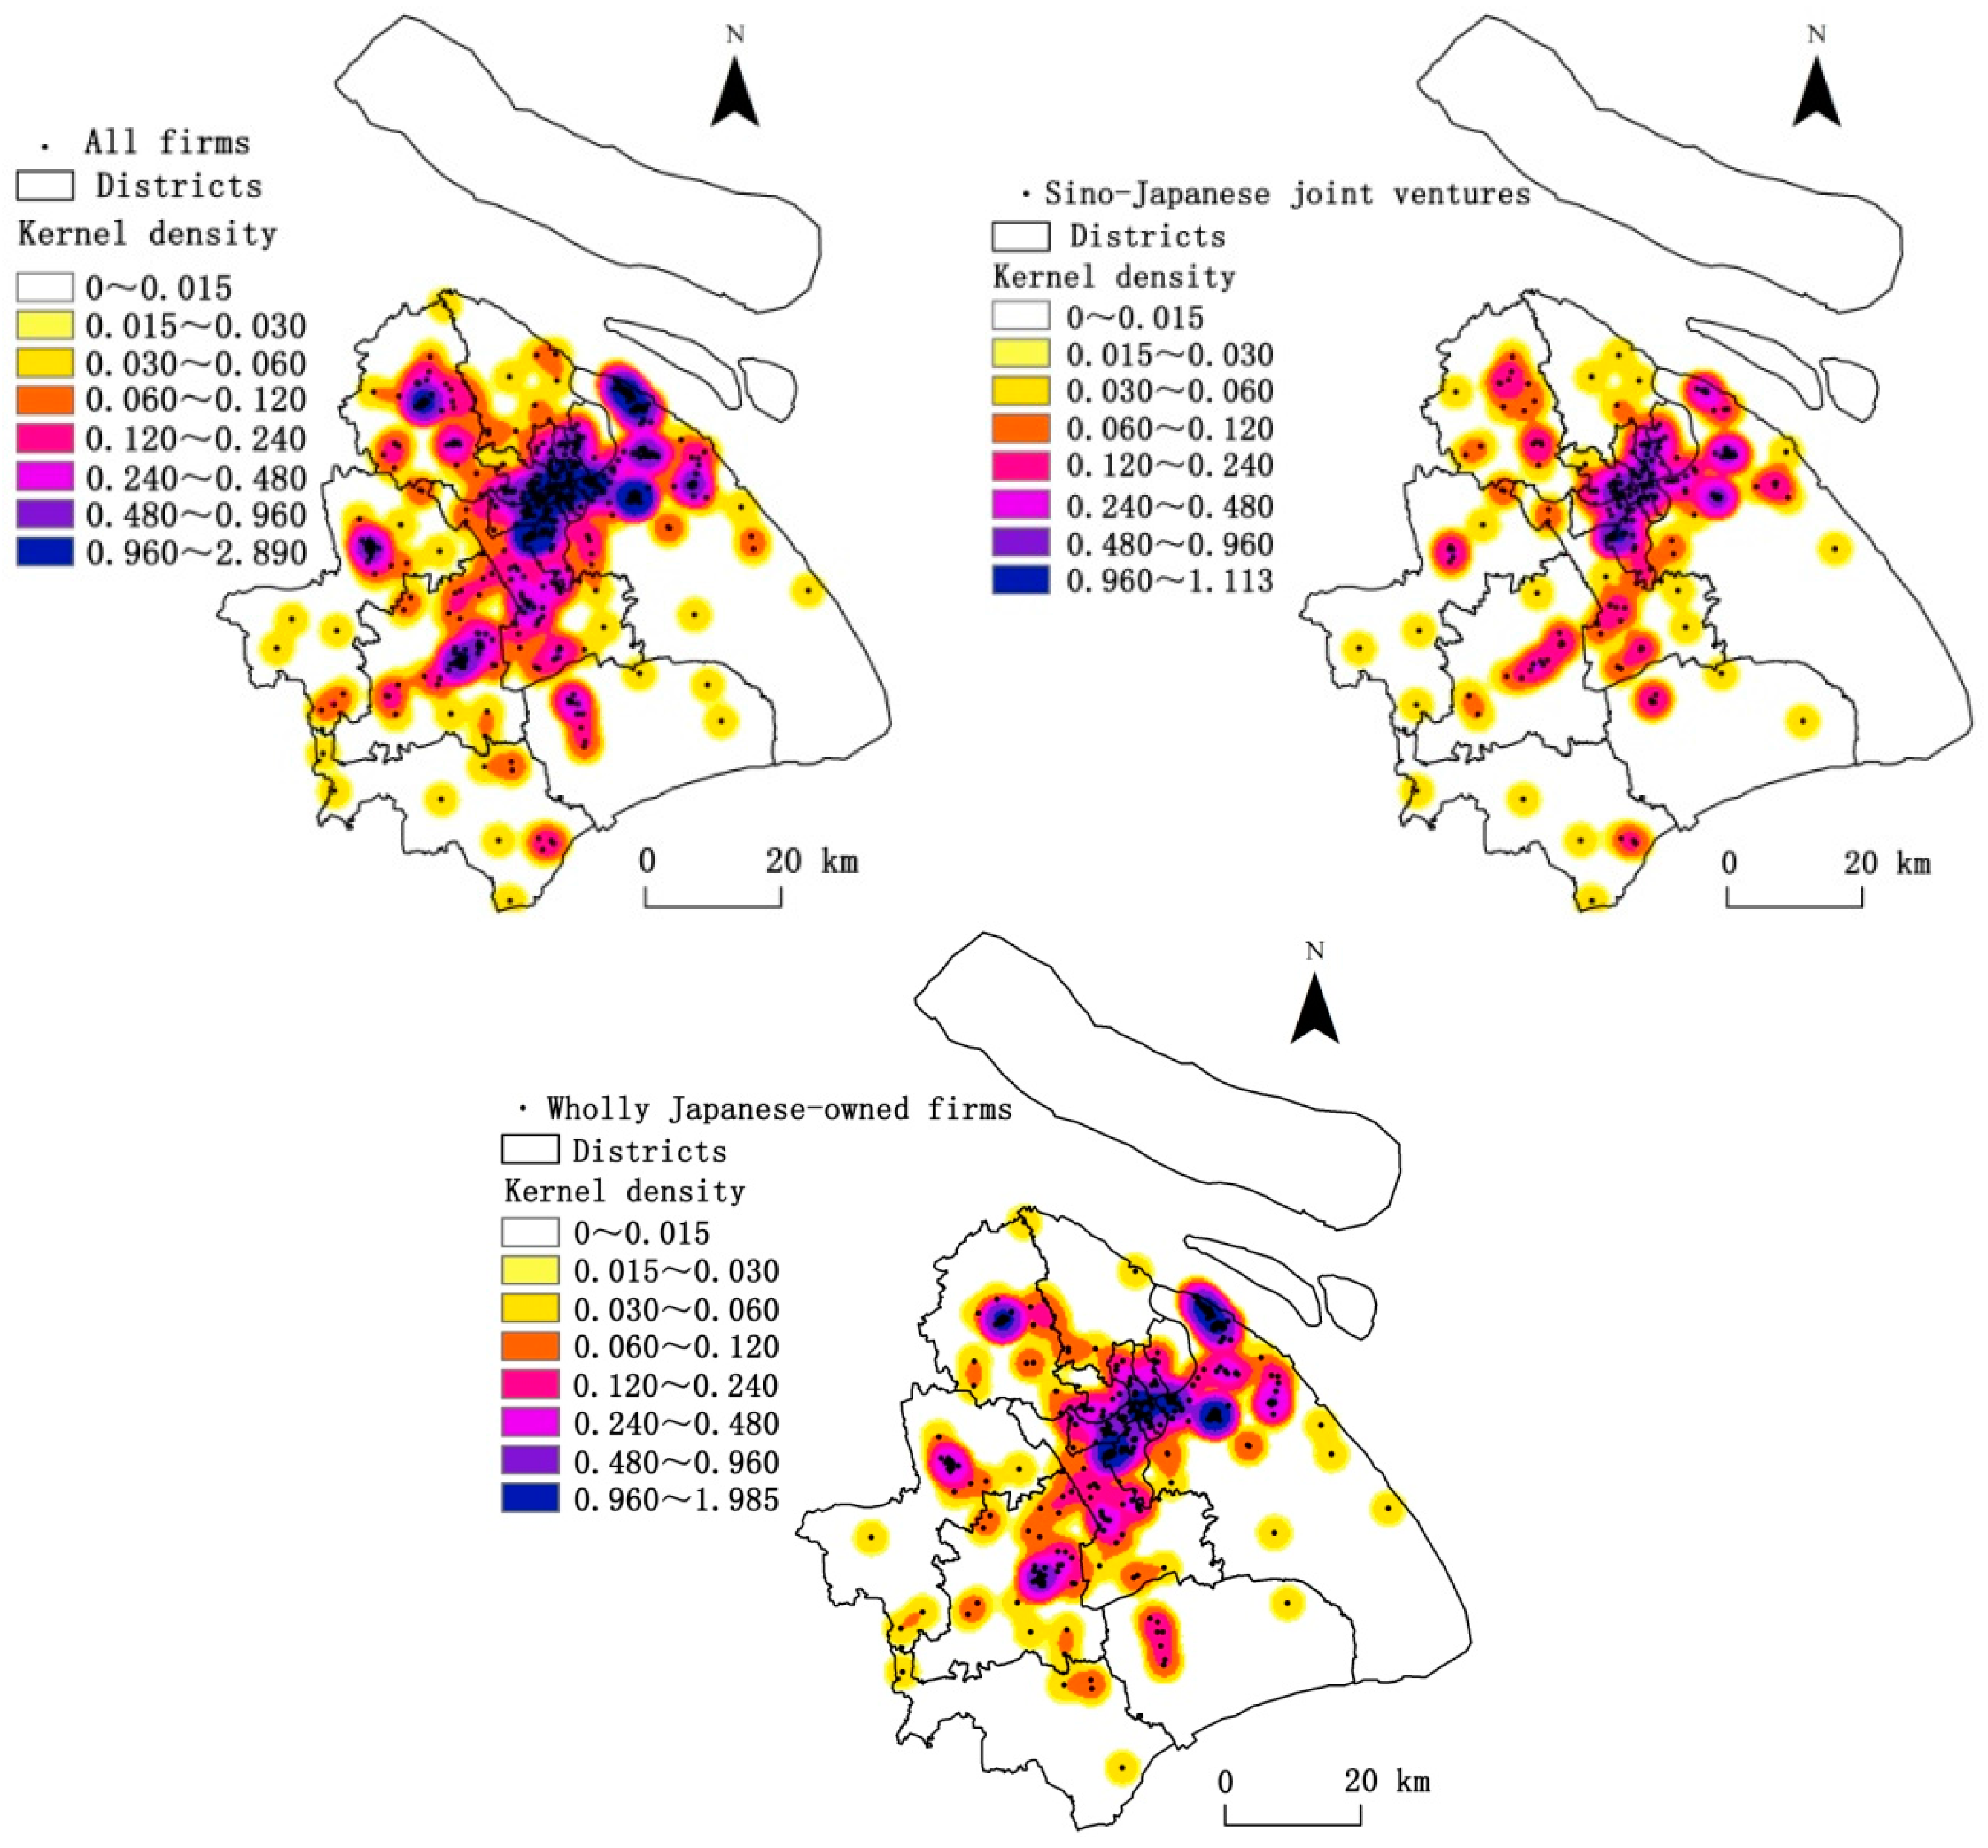
The kernel density estimation charts are drawn using a search radius of 4000 m and a grid mesh of 300 m. In terms of Group 1 firms, the districts with the highest number of firms are the former area of Pudong (not including the former Nanhui), Xuhui, Jiading, Songjiang, and Minhang (Figure 2). The number of firms in these five districts is 406, accounting for 68 percent of Group 1 firms. Pudong has the largest proportion of firms, accounting for 31 percent of the total. With respect to Group 2 firms and Group 3 firms, the districts with the highest number of firms continue to be the above five districts, accounting for 71 percent and 59 percent, respectively. The distribution of Group 1 firms, Group 2 firms, and Group 3 firms has a similar spatial pattern. In particular, Group 1 firms and Group 2 firms share a very similar pattern of distribution, centered in the peripheral outskirts of the central city of Shanghai. In contrast, the number of firms in the outer suburbs, such as the original Nanhui, Jinshan, Fengxian and Chongming, is relatively small.
4.3. Accessibility of Transportation Infrastructures in Shanghai
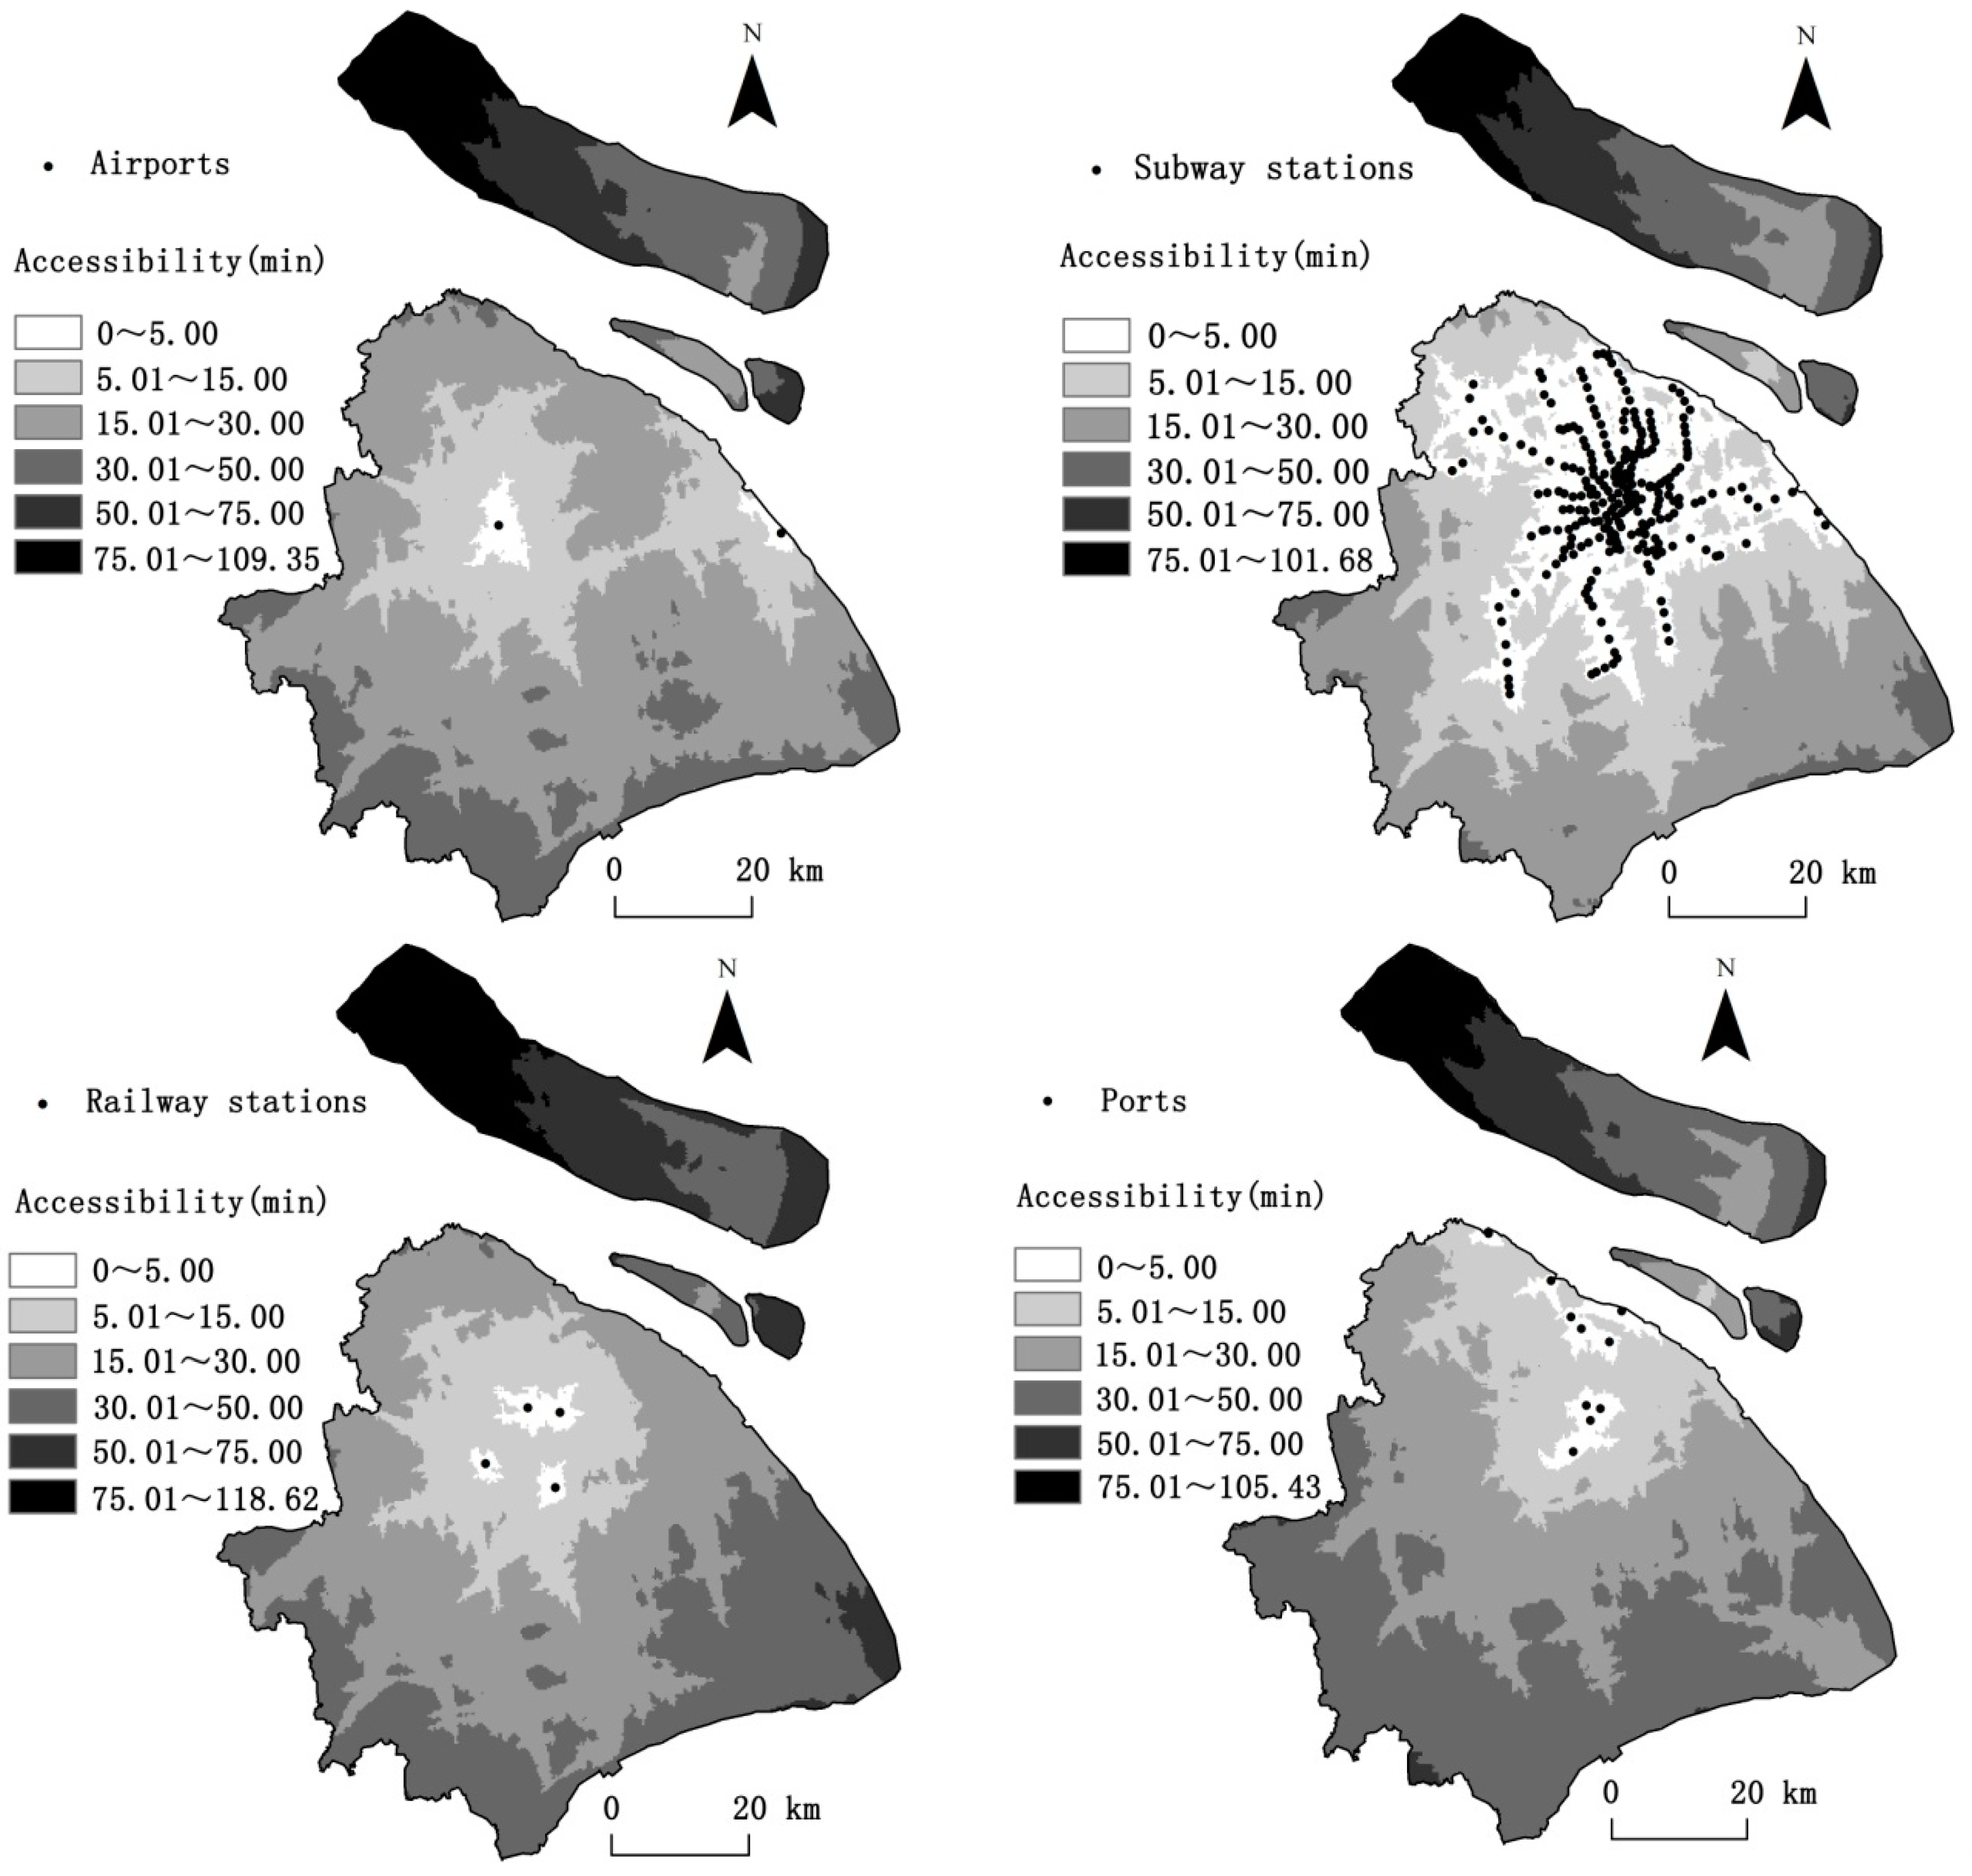
Based on the ground transportation network, Arc GIS 9.3 software was used to draw the accessibility maps of different transportation facilities in Shanghai. The results show that, in general, the accessibility of each of transportation facilities in Shanghai is very good. The accessibility of the subway system is the best, with an average travel time to subways of 20.63 min, and the area with an access time of 40 min or less accounts for 87.24 percent of Shanghai. The accessibility of the airports is also very good, with an average travel time of 29.16 min, and the area with an access time of 40 min or less accounts for 83.61 percent of Shanghai. The accessibility of the ports and the railway stations, by contrast, is relatively low, with average travel times of 31.67 min and 33.44 min, respectively. The areas with access times of 40 min or less to the ports and railway stations account for 77.78 percent and 75.31 percent of Shanghai, respectively. Areas with low accessibility of all transportation facilities are located in the same region, and are mainly distributed in the Western and Southern fringes of Shanghai, as well as most of Chongming (Figure 3). The transportation facilities are mainly concentrated on central and Northeastern Shanghai, with none of them located directly in Chongming. The reason for the subway’s good accessibility is the large number and wide distribution of subway stations. The accessibility of Shanghai’s transportation facilities is not only closely related to the structure of the transportation networks, but also to the spatial distribution and quantity of transportation facilities.
4.4. Spatial Coupling Relation between Transportation Accessibility and Firm Distribution
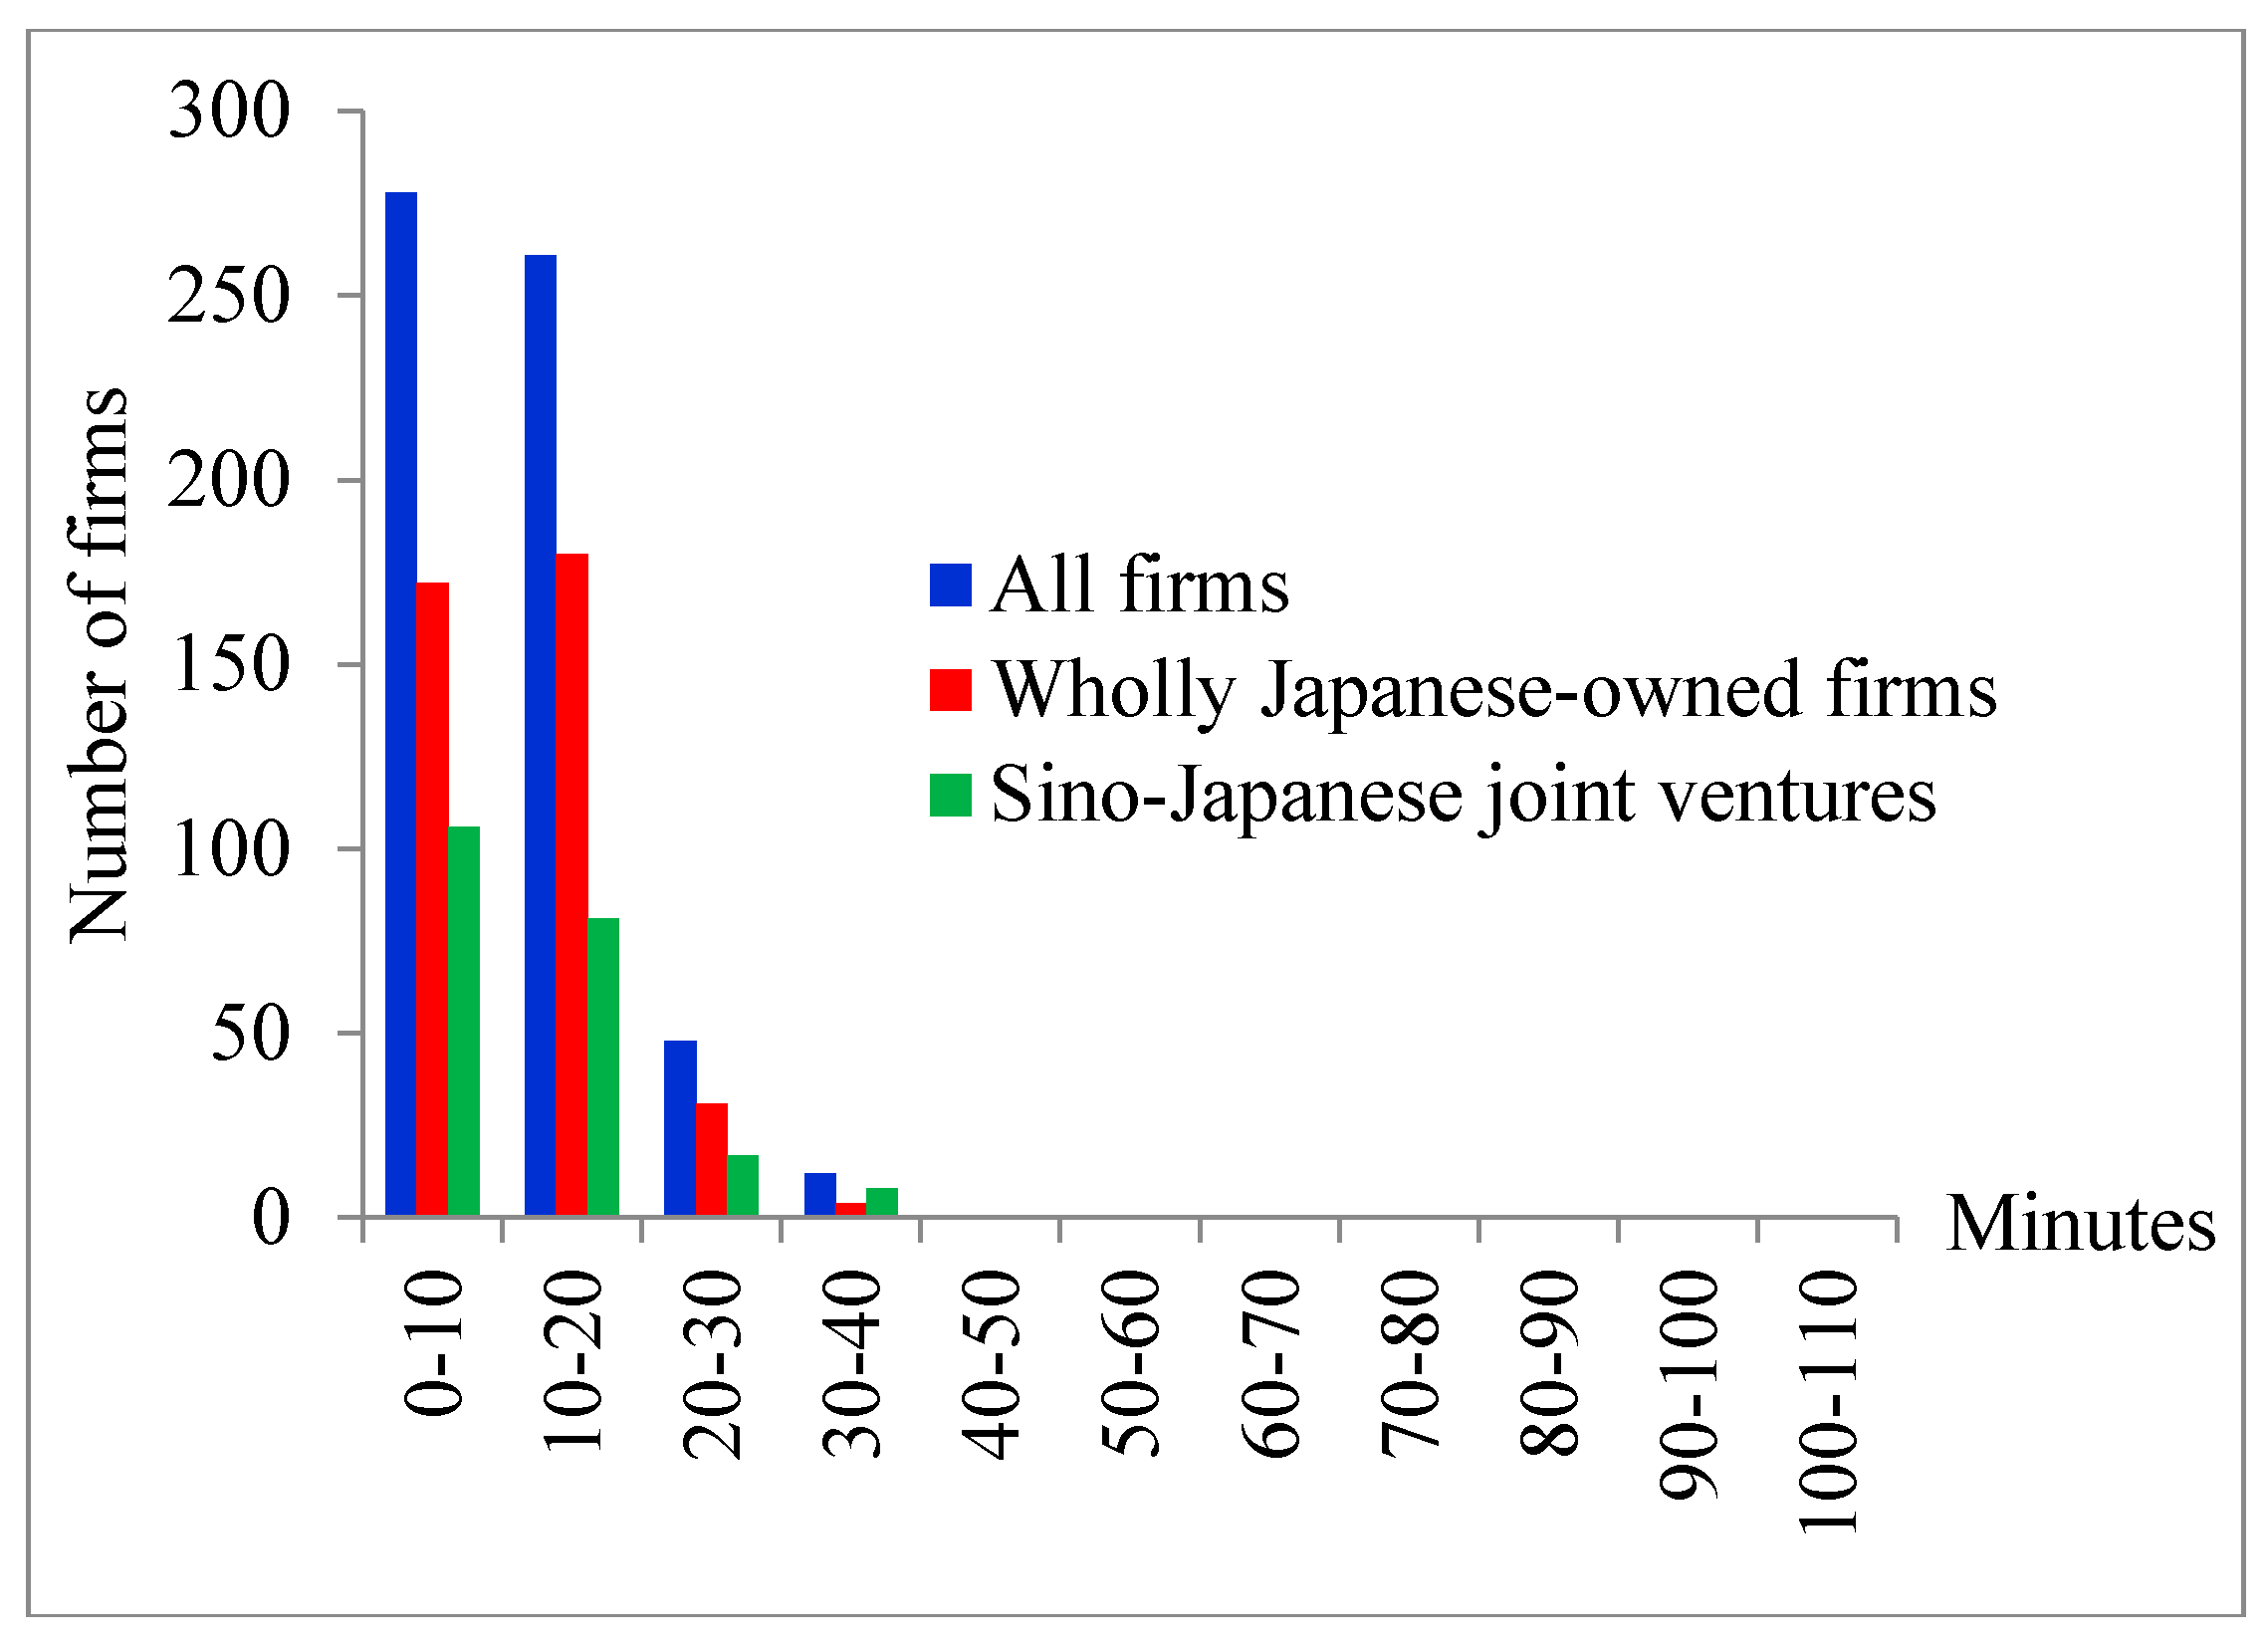
Figure 4 shows the number of Japanese-funded electronic information manufacturing firms along the travel time segments to all transportation facilities in Shanghai. All firms are inclined to concentrate in the areas with good accessibility. The proportion of Group 1 firms distributed in the 0–10 min and 10–20 min travel time segments are 46.4 percent and 43.6 percent, respectively. Nearly 90 percent of firms are thus distributed in the 0–20 min of travel time radius to all transportation facilities.
The distribution pattern along the travel time segments is very similar between Group 2 firms and Group 3 firms. About 91 percent and 88.2 percent are located within the 0–20 min travel time segment, respectively. Whether we look at Group 1 firms, or just Group 2 firms and Group 3 firms individually, more than 90 percent of firms tend to gather within the 20-min period, which effectively proves that there is a strong spatial coupling relation between the accessibility of transportation facilities and the distribution of Japanese-funded electronic information manufacturing firms.
The above evidence has confirmed that there is a strong spatial coupling relation between the accessibility of combined transportation facilities and the distribution of firms. This result further explores this conclusion by investigating the relationship between each type of transportation facility and firm distribution in Shanghai.
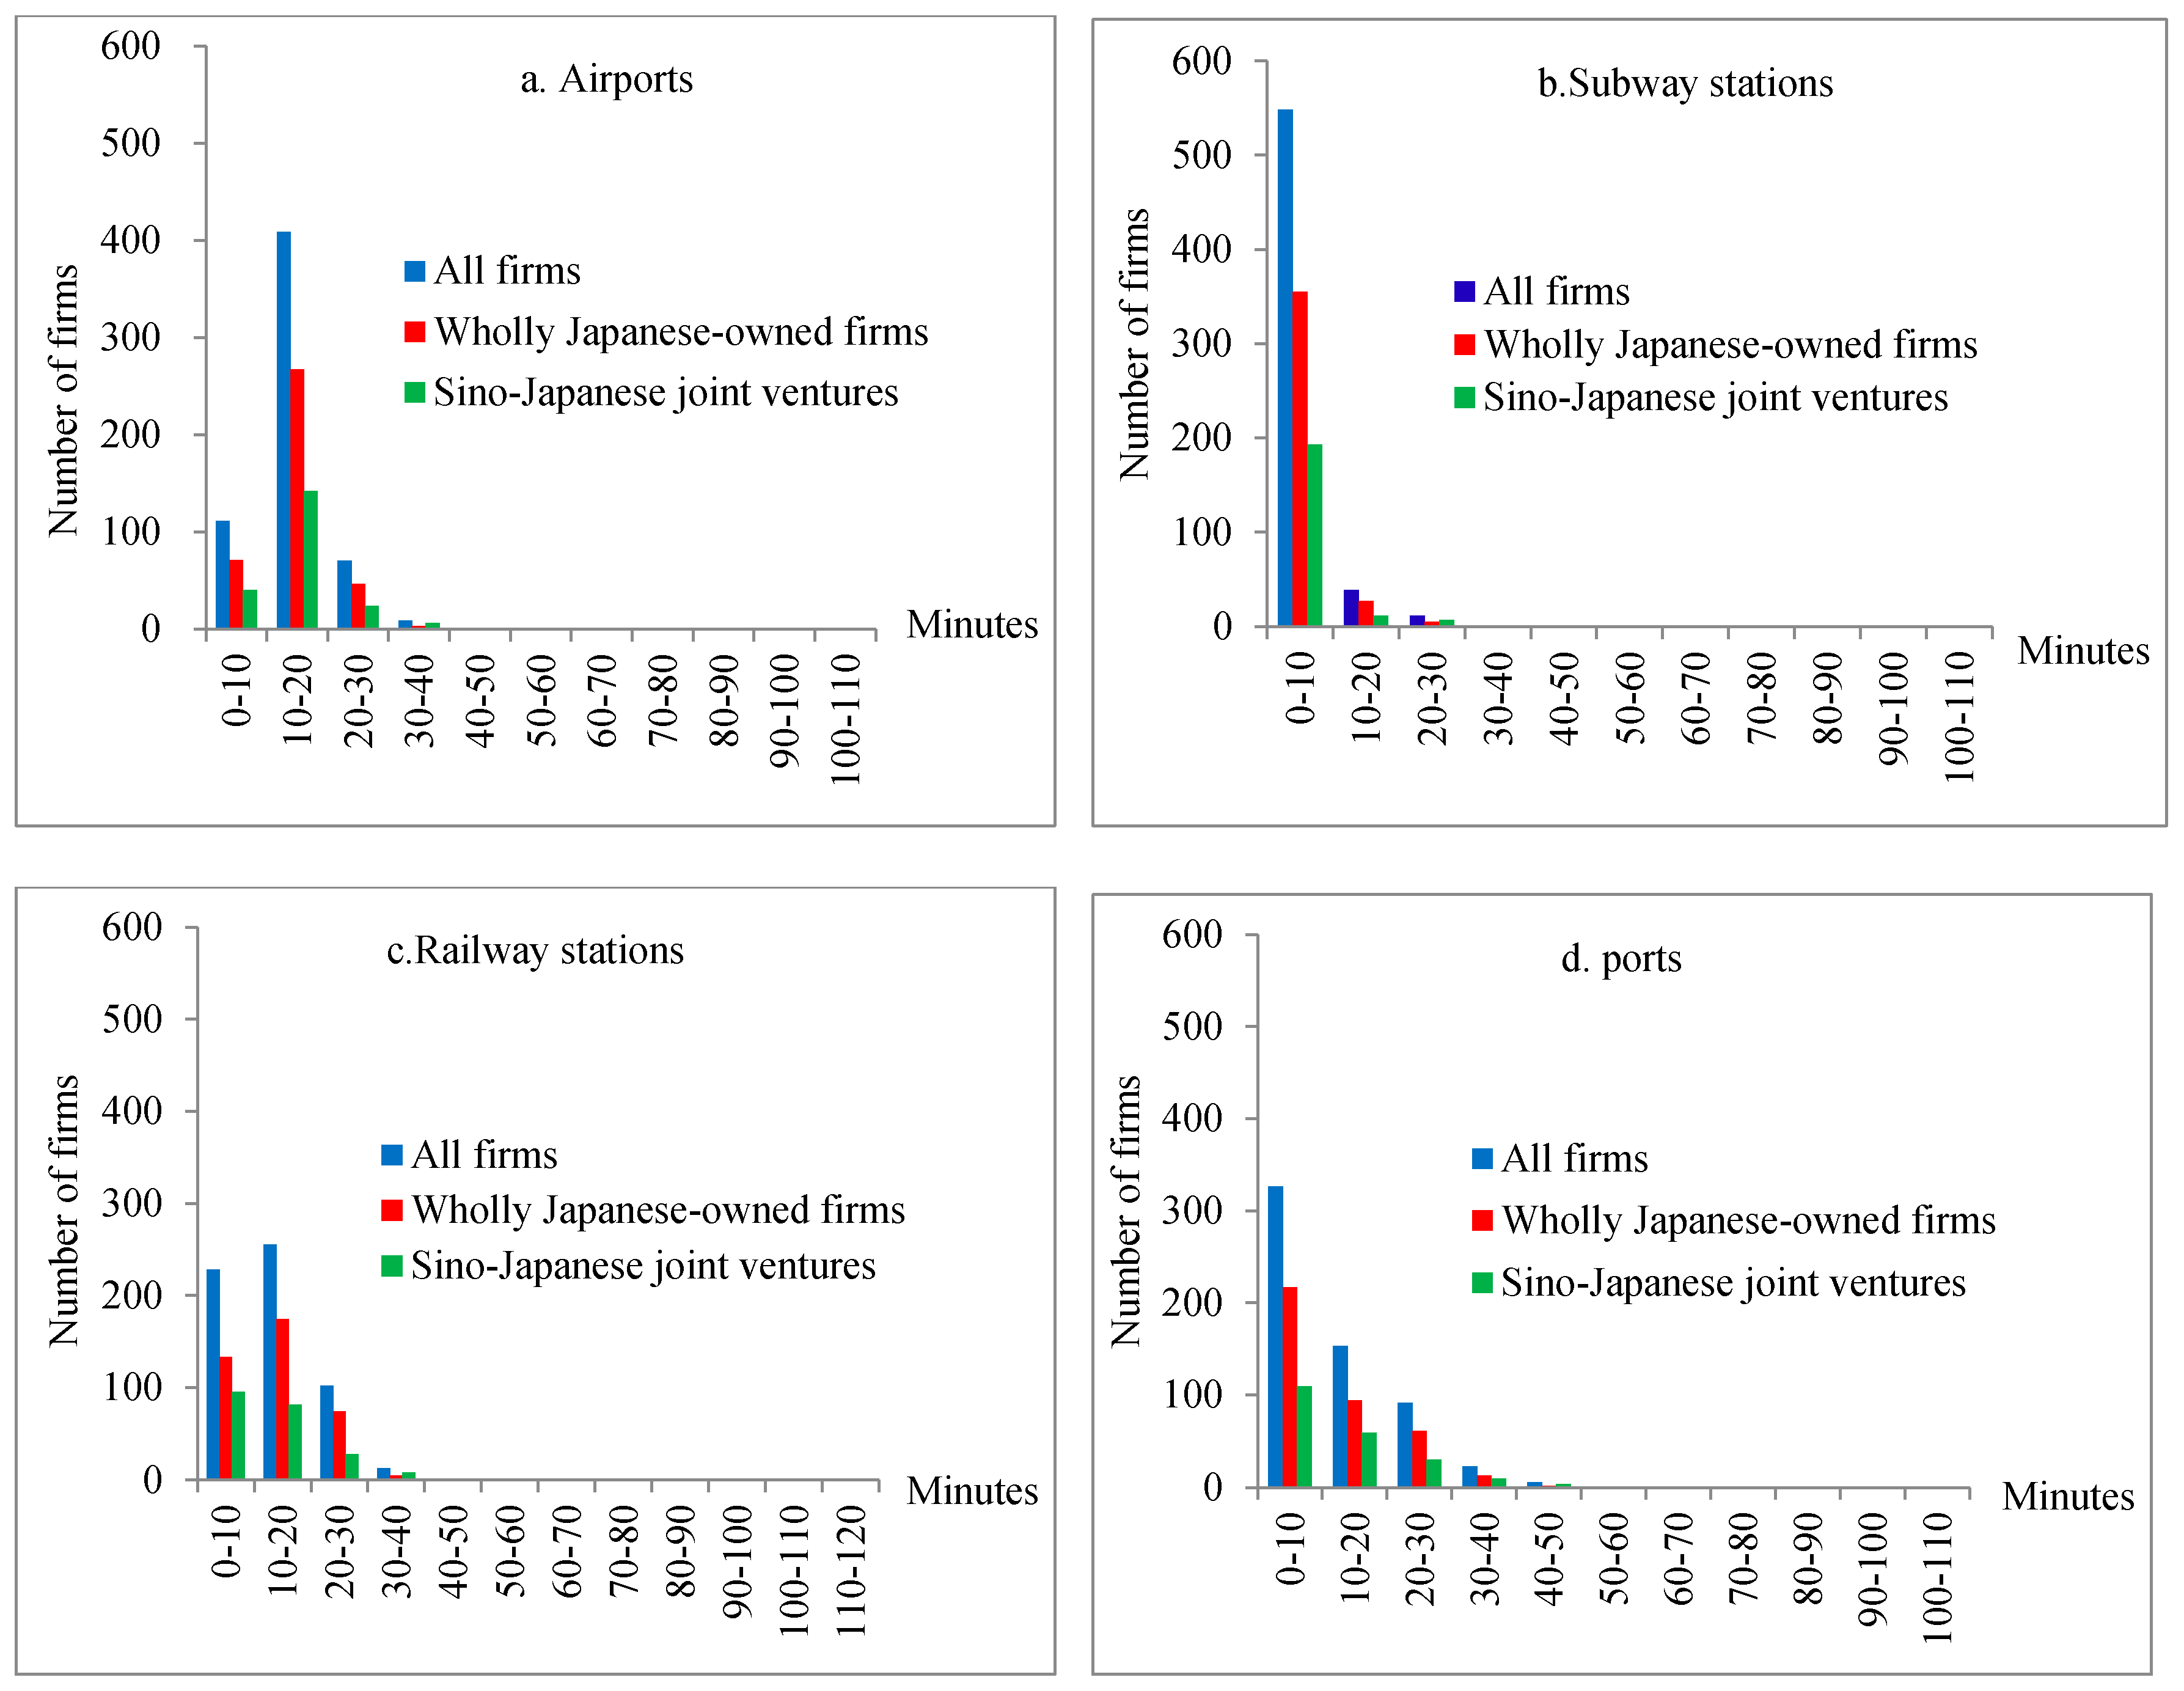
Figure 5 shows the number of Japanese-funded electronic information manufacturing firms along the travel time segments for each type of transportation facility in Shanghai. In general, Group 1 firms, Group 2 firms, and Group 3 firms all tend to gather in the areas with good accessibility to transportation facilities. The largest proportion of firms gathers in the areas within 0–10 min travel time to a subway station. In addition to this, many firms gather in the 0–30 min travel time to the other three types of transportation facilities.
Specifically, the spatial coupling relationship between transportation facility accessibility and firm distribution can be divided into two types. The first is represented by the airports and the railway stations, showing an inverted U shape. Although areas immediately surrounding these two types of transportation facilities would be favorable from an accessibility perspective, manufacturing firms are typically not permitted to locate here.
The proportions of Group 1 firms in the segments of 0–10 min, 10–20 min and 20–30 min travel time to airports, are 18.5 percent, 68.3 percent, and 11.7 percent, respectively. The proportions of Group 2 firms gathered near the airports are 18.4 percent, 69 percent, and 11.9 percent, respectively. Finally, the proportions of Group 3 firms gathered near the airports are 18.9 percent, 67 percent, and 11.3 percent, respectively. This shows that Group 1 firms, Group 2 firms and Group 3 firms have the same proportion of firms in the same segments of airport accessibility. The proportions of firms gathered within half an hour to airports are approximately 98.5 percent, 99.2 percent, and 97.2 percent, respectively. In contrast, although spatial coupling relationships between firm distribution and the accessibility of railway stations and airports are generally similar, location restrictions in the area surrounding airports are greater than railway stations. For instance, the quantity proportions of Group 1 firms, Group 2 firms, and Group 3 firms gathered near the railway stations in the 0–10 min travel time are higher, and they are 42.6 percent, 34.4 percent, and 44.8 percent, respectively. However, in the 0–30 min segment, the proportions are 97.7 percent, 98.5 percent, and 96.2 percent, respectively, similar to those for airports. The vast majority of Group 1 firms, Group 2 firms, and Group 3 firms are still distributed in the region within half an hour of travel time to the railway stations.
The second type of coupling relation between firm distribution and the accessibility of transportation facilities is represented by the subway stations and the ports. Here, the number of firms decreases as the access time to transportation facilities increases. The average accessibility of the subway stations is much better than that of the other means of transportation. The largest proportion of Group 1 firms, Group 2 firms, and Group 3 firms are distributed within 0–10 min travel time to a subway station, and the quantity proportions of firms with this time segment are 91.5 percent, 91.7 percent, and 91 percent, respectively. This shows that the spatial coupling relation between subway accessibility and spatial distribution of firms is more significant. In contrast, Group 1 firms, Group 2 firms, and Group 3 firms are mainly concentrated in the areas within 30 min of the ports, with the proportions of firms with a half an hour travel time to a port being 95.2 percent, 96.2 percent and 93.4 percent, respectively. The quantity proportions of gathering firms are the same in the segments of 0–10 min, 10–20 min and 20–30 min travel time. That is, the ports have a similar attraction for Group 1 firms, Group 2 firms, and Group 3 firms.
Japanese-funded electronic information manufacturing firms in Shanghai are inclined to gather in areas with good accessibility of transportation facilities. Whether we look at Group 1 firms, Group 2 firms or Group 3 firms, similar proportions of firms gather in an area with the same level of accessibility for a specific transport facility. This indicates that although different types of transportation facilities have different levels of attractiveness to firms, this attractiveness does not change whether we look at Group 1 firms or at Group 2 firms and Group 3 firms.
5. Effect of Transportation Facilities’ Accessibility on Firm Location Choice
In modelling firm location choice, we selected four independent variables, each of which measures the accessibility to four different transportation facilities, and five control variables. As expected, independent variables as well as control variables were highly correlated with each other. Instead of using multivariate regression analysis, a ridge regression analysis was adopted. The independent variables and control variables with high correlation were introduced into the regression models separately, and five regression models were formed accordingly. LR Statistics represents the test statistics of goodness-of-fit by likelihood ratio test results. Through models testing, the assumption that the conditional variance is equal to the conditional mean cannot be satisfied. Therefore, the negative binomial quasi-maximum likelihood estimation was chosen, to estimate the effects of accessibility of transportation facilities on the location choice of Japanese-funded electronic information manufacturing firms in Shanghai. It can be seen from Table 2 and Table 3 that the LR test results for the following five estimated models are all highly significant.
Based on Table 2 for Group 1 firms, the decentralization of Japanese-funded electronic information manufacturing firms in Shanghai is obviously reflected by the negative sign of the influence coefficients of travel time to transportation facilities, including airport accessibility (AIRP), subway station accessibility (SUBW), railway station accessibility (RAIL), and port accessibility (PORT). That is, the firms are inclined to locate in the areas with better accessibility to different transportation facilities, as stated in Hypothesis 2. According to the result in Model 1, the accessibility of airports seems the most important to firm location, followed by the influence of subway accessibility. The product of the electronic information manufacturing industry has the advantage of small size, light weight and high value-added technology. The tacit-knowledge spillover of staff may be crucial to the development of the electronic information manufacturing industry. Accordingly, the factors of accessibility of airports and subway stations, especially the former, are much more important in the location choice of the firms than the accessibility of railway stations and ports. In order to exclude the effects of some controlled variables, the influence factors of the distance to the city center (DIST), the district government seat (GOVR), the agglomeration effect (AGGL), the number of college students (TANT), and the development zone (ZONE) were used in Model 5, Model 1, Model 2, Model 3 and Model 4, respectively. The results show that the agglomeration effect (AGGL) and the development zone (ZONE) clearly exert positive effects on firm location. That is, these two controlled variables have significant attraction for the firms. In contrast, the influence coefficients of the distance to the city center (DIST) are close to zero, and the sign of the distance to the city center (DIST) is negative, showing that the firms do not have a clear tendency to agglomerate in the central urban area of Shanghai at all. Instead, the distribution of firms has a trend towards suburbanization. In contrast, the regression results for the number of college students (TANT) and the district government seat (GOVR) are not significant. The result of the former variable (TANT) shows that firms do not have a strong preference for the areas with a large number of college students. This result is similar to the result of Guzman-Anaya [36], suggesting that Japanese-funded electronic information manufacturing firms prefer more populous areas with vast labor pools, where the workforce might be more manageable and responsive to Japanese training. Also, the result of latter variable (GOVR) indicates that firms are not inclined to distribute in the district government seat, indicating these areas have no obvious locational advantages to other street blocks or townships of Shanghai on a city scale.
Table 3 reports the regression results for Group 2 firms and Group 3 firms. The influence coefficients for the average travel time to airports, subways, railway stations and ports on firm location choice are all significantly negative, and their signs are all consistent with Hypothesis 2. Among these factors, the accessibility of airports has the most important influence on firm location choice. The effects of the four different transportation facilities on Group 2 firms are all larger than the effects on Group 2 firms. This result indicates that compared with the Group 3 firms, Group 2 firms are more inclined to locate in areas with better accessibility, in order to reduce costs and investment risks. The effects of all controlled variables on Group 2 and Group 3 firms are similar to those on Group 1 firms discussed above, and as such, are not discussed further here.
6. Conclusions
With the development of globalization, informatization, and modern transportation facilities, does the accessibility of transportation facilities still play an important role in the location choice of electronic information manufacturing industries? The literature on the influence of transportation accessibility on firm location has mainly concerned the producer services and logistics firms, while little evidence has yet been provided on electronic information manufacturing industries. This paper aimed to fill the gap in the previous research on this topic. The results show that all three groups of firms have a similar spatial pattern. Also, similar to the results of Weterings [18], Lu [45] and Yuan [24], the results of this study show that Japanese-funded electronic information manufacturing firms are mainly concentrated in the peripheral outskirts of Shanghai’s central city, while the number of firms in the outer suburbs is relatively small.
Another finding reveals that a spatial coupling relationship between the distribution of the firms and their accessibility to different transportation facilities is clearly discernable. That is, the firms tend to select the areas with better accessibility to transportation facilities. Further, we identified two types of spatial coupling models between transportation facility accessibility and firm location. The first, represented by the airports and railway stations, shows an inverse U-shaped curve relationship. The second type is associated with accessibility to the subway stations and the ports, and the spatial coupling relationship degree between transportation facility accessibility and firm distribution is of negative linearity.
All three groups of firms tend to be distributed in the areas with good accessibility to transportation facilities, and the attractiveness of airport accessibility is the most significant. Although Sargent (1987) acknowledged the importance of Kyushu airport accessibility in attracting more firms because of the advantages of large transport capacity for passengers and cargo [14], he did not compare the importance among location factors. Furthermore, we analyzed the varied influence of accessibility of different transportation facilities on the location choices of the firms with different types of ownership. Compared with other firms, wholly-owned Japanese firms are more likely to distribute in areas with better accessibility to transportation facilities in order to reduce costs and investment risks.
This study provides some insight into how the foreign owned electronic information manufacturing industries are distributed at a city level, and how their location choices are coupled with, and affected, by transportation infrastructure accessibility. However, this study is based on firm data from 2012. It therefore lacks a dynamic analysis of different time breakpoints, due to space limitations and difficulty of data acquisition. Further study is needed to address how firm location is transformed in the process of changing transportation accessibility, on a city scale.
Acknowledgments
The research is supported by the National Natural Science Foundation of China (No.41501119, No.41430637, and No.41301110).
Author Contributions
Haining Jiang conceived and designed the research, and wrote the manuscript; Wei Xu is the correspondence author, and discussed the results and revised the manuscript; Wenzhong Zhang conceptualized and structured the paper. All authors read and approved the final manuscript.
Conflicts of Interest
The authors declare no conflict of interest.
References
- Haddad, E.; Hewings, G.J.D. Transportation costs, regional inequality and structural changes in the Brazilian economy: An interregional CGE approach. In Proceedings of the 38th European Congress of the Regional Science Association, Vienna, Austria, 28 August–1 September 1998. [Google Scholar]
- Hansen, W.G. How accessibility shapes land use. J. Am. Inst. Plan. 1959, 25, 73–76. [Google Scholar] [CrossRef]
- Morris, J.M.; Dumble, P.L.; Wigan, M.R. Accessibility indicators for transport planning. Transp. Res. A 1979, 13, 91–109. [Google Scholar] [CrossRef]
- Bok, M.D.; Oort, F.V. Agglomeration Economies, Accessibility, and the Spatial Choice Behavior of Relocating Firms. J. Transp. Land Use 2011, 4, 5–24. [Google Scholar] [CrossRef]
- Rietveld, P. Infrastructure and spatial economic development. Ann. Reg. Sci. 1995, 29, 117–119. [Google Scholar] [CrossRef]
- Linneker, B.; Spence, N. Road transport infrastructure and regional economic development: The regional development effects of the M25 London orbital motorway. J. Transp. Geogr. 1996, 4, 77–92. [Google Scholar] [CrossRef]
- Atzema, O. Location and local networks of ICT firms in The Netherlands. Tijdschr. Econ. Soc. Geogr. 2001, 92, 369–378. [Google Scholar] [CrossRef]
- Cairncross, F. The Death of Distance: How the Communications Revolution Is Changing Our Lives; Harvard Business Press: Boston, MA, USA, 2001. [Google Scholar]
- Mazzoleni, R. Learning and path-dependence in the diffusion of innovations: Comparative evidence on numerically controlled machine tools. Res. Policy 1997, 26, 405–428. [Google Scholar] [CrossRef]
- Verhetsel, A.; Kessels, R.; Goos, P.; Zijlstra, T.; Blomme, N.; Cant, J. Location of logistics companies: A stated preference study to disentangle the impact of accessibility. J. Transp. Geogr. 2015, 42, 110–121. [Google Scholar] [CrossRef]
- Nilsson, I.M.; Smirnov, O.A. Measuring the effect of transportation infrastructure on retail firm co-location patterns. J. Transp. Geogr. 2016, 51, 110–118. [Google Scholar] [CrossRef]
- Mejia-Dorantes, L.; Paez, A.; Vassallo, J.M. Transportation infrastructure impacts on firm location: The effect of a new metro line in the suburbs of Madrid. J. Transp. Geogr. 2012, 22, 236–250. [Google Scholar] [CrossRef]
- Holl, A.; Mariotti, I. The Geography of Logistics Firm Location: The Role of Accessibility. Netw. Spat. Econ. 2017, 1–25. [Google Scholar] [CrossRef]
- Sargent, J. Industrial Location in Japan with special reference to the semiconductor industry. Geogr. J. 1987, 153, 72–85. [Google Scholar] [CrossRef]
- Apparicio, P.; Abdelmajid, M.; Riva, M.; Schearmur, R. Comparing alternative approaches to measuring the geographical accessibility of urban health services: Distance types and aggregation-error issues. Int. J. Health Geogr. 2008, 7, 1–14. [Google Scholar] [CrossRef] [PubMed] [Green Version]
- Jiang, H.B.; Zhang, W.Z.; Qi, Y.; Zhou, L. Research progress on accessibility to regional transportation infrastructure. Prog. Geogr. 2013, 32, 807–817. (In Chinese) [Google Scholar]
- Görg, H.; Ruane, F. Globalization and Fragmentation: Evidence for the Electronics Industry in Ireland. Trinity Economic Papers Series 1999, No. 9911. Available online: https://ideas.repec.org/p/tcd/tcduee/9911.html (accessed on 10 December 2004).
- Weterings, A.; Boschma, R. How to explain the spatial evolution of new industries? The spatial evolution of the Dutch ICT industry. In Proceedings of the 42nd Congress of the European Regional Science Association, Dortmund, Germany, 27–31 August 2002. [Google Scholar]
- Aranya, R. Location theory in reverse? Location for global production in the IT industry of Bangalore. Environ. Plan. A 2008, 40, 446–463. [Google Scholar] [CrossRef]
- Arai, Y.; Nakamura, H.; Sato, H.; Nakazawa, T.; Musha, T.; Sugizaki, K. Multimedia and internet business clusters in central Tokyo. Urban Geogr. 2004, 25, 483–500. [Google Scholar] [CrossRef]
- Isaksen, A. Knowledge-based clusters and urban location: The clustering of software consultancy in Oslo. Urban Stud. 2004, 41, 1157–1174. [Google Scholar] [CrossRef]
- Ataka, Y. Location trend of information industry and municipal policy for the business development. Rev. Commun. Bus. 2008, 49, 31–52. (In Japanese) [Google Scholar]
- Dicken, P. Global Shift: Reshaping the Global Economic Map in the 21st Century, 4th ed.; The Guilford Press: New York, NY, USA, 2003. [Google Scholar]
- Yuan, F.; Wei, Y.H.; Chen, W.; Jin, Z.F. Spatial agglomeration and new firm formation in the information and communication technology industry in Suzhou. Acta Geogr. Sin. 2010, 65, 153–163. (In Chinese) [Google Scholar]
- Huang, H.; Wei, Y.D. Intra-metropolitan location of foreign direct investment in Wuhan, China: Institution, urban structure, and accessibility. Appl. Geogr. 2014, 47, 78–88. [Google Scholar] [CrossRef]
- Isard, W. Location and Space-Economy, 1st ed.; MIT Press: Cambridge, MA, USA, 1956. [Google Scholar]
- Losch, A. The Economics of Location. New Haven, 1st ed.; Yale University Press: New Haven, CT, USA, 1959. [Google Scholar]
- Friedrich, C.J. Alfred Weber's Theory of the Location of Industries, 1st ed.; The University of Chicago Press: Chicago, IL, USA, 1929. [Google Scholar]
- Harrington, J.W.; Warf, B.L. Industrial Location: Principles, Practice and Policy, 1st ed.; Taylor & Francis Ltd.: London, UK, 1995. [Google Scholar]
- Knox, P.L.; Taylor, P.J. World Cities in a World-System, 1st ed.; Cambridge University Press: New York, NY, USA, 1995. [Google Scholar]
- Henderson, J.V. Marshall’s scale economies. J. Urban Econ. 2001, 53, 1–28. [Google Scholar] [CrossRef]
- Krugman, P. History and Industry Location: The Case of the Manufacturing Belt. Am. Econ. Rev. 1991, 81, 80–83. [Google Scholar]
- Buurman, J.; Rietveld, P. Transport Infrastructure and Industrial Location: The Case of Thailand. Rev. Urban Reg. Dev. Stud. 1999, 11, 45–62. [Google Scholar] [CrossRef] [Green Version]
- Holl, A. Transport Infrastructure, Agglomeration Economies, and Firm Birth: Empirical Evidence from Portugal. J. Reg. Sci. 2004, 44, 693–712. [Google Scholar] [CrossRef]
- Holl, A. Start-ups and relocations: Manufacturing plant location in Portugal. Pap. Reg. Sci. 2004, 83, 649–668. [Google Scholar]
- Guzman-Anaya, L. Spatial determinants of Japanese FDI location in Mexico. México y la Cuenca del Pacífico 2017, 6, 13–35. [Google Scholar]
- Wu, F.L. Intrametropolitan FDI firm location in Guangzhou, China A Poisson and negative binomial analysis. Ann. Reg. Sci. 1999, 33, 535–555. [Google Scholar] [CrossRef]
- Wu, J.; Radbone, I. Global integration and the intra-urban determinants of foreign direct investment in Shanghai. Cities 2005, 22, 275–286. [Google Scholar] [CrossRef]
- Wei, Y.H.D.; Luo, J.; Zhou, Q. Location Decisions and Network Configurations of Foreign Investment in Urban China. Prof. Geogr. 2010, 62, 264–283. [Google Scholar] [CrossRef]
- Barrios, S.; Mas, M.; Navajas, E.; Quesada, J. Mapping the ICT in EU Regions: Location, Employment, Factors of Attractiveness and Economic Impact. Available online: http://mpra.ub.uni-muenchen.de/6998/ (accessed on 4 February 2008).
- Sun, Y.; Grimes, S. China’s increasing participation in ICT’s global value chain: A firm level analysis. Telecommun. Policy 2016, 40, 210–224. [Google Scholar] [CrossRef]
- Wang, C.C.; Lin, G.C.S. The growth and spatial distribution of China’s ICT industry: New geography of clustering and innovation. Issues Stud. 2008, 44, 145–192. [Google Scholar]
- Oort, F.G.V.; Atzema, O.A.L.C. On the conceptualization of agglomeration economies: The case of new firm formation in the Dutch ICT sector. Ann. Reg. Sci. 2004, 44, 263–290. [Google Scholar] [CrossRef]
- Yan, X.P. Analysis on the spatial difference of the development level of information industry in Guangzhou. Econ. Geogr. 1998, 18, 5–10. (In Chinese) [Google Scholar]
- Lu, M.H.; Li, L. The spatial distribution of electronic information industries and its value chain parts in Beijing. Geogr. Res. 2012, 31, 1861–1871. (In Chinese) [Google Scholar]
- Li, M. Research on spatial distribution characteristics of electronic information industry in Beijing and its value chain. In Proceedings of the 2015 International Conference on Education Technology & Economic Management, Xi’an, China, 12–13 December 2015. [Google Scholar]
- Yang, Y.R.; Hsia, C.J. Spatial clustering and organizational dynamics of transborder production networks: A case study of Taiwanese information-technology companies in the Greater Suzhou Area, China. Environ. Plan. A 2007, 39, 1346–1363. [Google Scholar] [CrossRef]
- Wei, Y.H.D.; Lu, Y.Q.; Chen, W. Globalizing regional development in Sunan, China: Does Suzhou Industrial Park fit a neo-Marshallian district model? Reg. Stud. 2009, 43, 409–427. [Google Scholar]
- Jiang, H.N.; Zhang, W.Z.; Lv, G.Q.; Ma, R.F.; Yu, J.H. Spatial pattern of Japan-funded textile and garment manufacturing enterprises in Shanghai. Geogr. Res. 2016, 35, 1095–1106. (In Chinese) [Google Scholar]
- Cassidy, J.F. Spatial determinants of Japanese FDI in China. Jpn. World Econ. 2006, 18, 512–527. [Google Scholar] [CrossRef]
- Wu, W.; Cao, Y.H.; Cao, W.D.; Liang, S.B. On the patterns of integrated transportation accessibility in the Yangtze River Delta under opening conditions. Geogr. Res. 2007, 26, 391–402. (In Chinese) [Google Scholar]
- Chen, S.L.; Chen, J.D.; Wei, S.Q. The integrated transportation accessibility in Fujian Province and its correlation with the spatial distribution of manufacturing. Sci. Geol. Sin. 2012, 32, 807–815. (In Chinese) [Google Scholar]
- Zhang, L.; Lu, Y.Q. Regional accessibility of land traffic network in the Yangtze River Delta. J. Geogr. Sci. 2007, 17, 351–364. [Google Scholar] [CrossRef]
- Greene, W.H. Econometric Analysis, 7th ed.; Prentice Hall: Upper Saddle River, NJ, USA, 2013. [Google Scholar]
- Doms, M.; Lewis, E.; Robb, A. Local labor force education, new business characteristics, and firm performance. J. Urban Econ. 2010, 67, 61–77. [Google Scholar] [CrossRef]
Figure 1.
Geographical location of the research area.

Figure 2.
The distribution of kernel density for Japanese-funded electronic information manufacturing firms in Shanghai.
Figure 2.
The distribution of kernel density for Japanese-funded electronic information manufacturing firms in Shanghai.

Figure 3.
The diffusion diagram of accessibility of different transportation facilities in Shanghai.
Figure 3.
The diffusion diagram of accessibility of different transportation facilities in Shanghai.

Figure 4.
Number of Japanese-funded electronic information manufacturing firms along travel time segments to all transportation facilities in Shanghai.
Figure 4.
Number of Japanese-funded electronic information manufacturing firms along travel time segments to all transportation facilities in Shanghai.

Figure 5.
Number of Japanese-funded electronic information manufacturing firms along travel time segments to individual transportation facilities in Shanghai.
Figure 5.
Number of Japanese-funded electronic information manufacturing firms along travel time segments to individual transportation facilities in Shanghai.


Table 1.
Road grades and speed limits of road network of Shanghai.
| Road Grades | Highway | National Road | Provincial Road | County Road | Default Value |
|---|---|---|---|---|---|
| Speed (km/h) | 120 | 75 | 60 | 30 | 15 |
Table 2.
Regression results of location choice of all Japanese-funded electronic information manufacturing firms in Shanghai.
Table 2.
Regression results of location choice of all Japanese-funded electronic information manufacturing firms in Shanghai.
| Group 1 Firms | |||||
|---|---|---|---|---|---|
| Model 1 | Model 2 | Model 3 | Model 4 | Model 5 | |
| c | 2.43 *** | 0.77 *** | 1.64 *** | 1.49 *** | 1.58 *** |
| AIRP | −0.07 *** | ||||
| SUBW | −0.05 *** | ||||
| RAIL | −0.04 ** | ||||
| PORT | −0.04 *** | ||||
| DIST | −2.93 × 10⁻⁵ * | ||||
| GOVR | 0.55 | ||||
| AGGL | 0.48 *** | ||||
| TANT | 7.85 × 10⁻⁶ | ||||
| ZONE | 0.61** | ||||
| sample size | 215 | 215 | 215 | 215 | 215 |
| significance | 0.00 | 0.00 | 0.00 | 0.00 | 0.00 |
| 10.89 *** | 4.32 *** | 11.15 *** | 6.79 *** | 10.51 *** | |
| LR statistic | 1016.80 *** | 637.94 *** | 1024.98 *** | 808.75 *** | 993.98 *** |
Note: * significance at a level of 10%; ** significance at a level of 5%; *** significance at a level of 1%.
Table 3.
Regression results of location choice of Japanese-funded electronic information manufacturing firms in Shanghai.
Table 3.
Regression results of location choice of Japanese-funded electronic information manufacturing firms in Shanghai.
| Group 2 Firms | |||||
| Model 1 | Model 2 | Model 3 | Model 4 | Model 5 | |
| c | 2.19 *** | 0.42 | 1.21 * | 1.06 *** | 1.23 ** |
| AIRP | −0.08 ** | ||||
| SUBW | −0.06 *** | ||||
| RAIL | −0.04 ** | ||||
| PORT | −0.04 *** | ||||
| DIST | −3.39 × 10⁻⁵ * | ||||
| GOVR | 0.64 | ||||
| AGGL | 0.45 *** | ||||
| TANT | 8.07 × 10⁻⁶ | ||||
| ZONE | 0.71 ** | ||||
| sample size | 215 | 215 | 215 | 215 | 215 |
| significance | 0.00 | 0.00 | 0.00 | 0.00 | 0.00 |
| 14.54 *** | 6.43 *** | 14.59 *** | 9.28 *** | 13.65 *** | |
| LR statistic | 1144.29 *** | 803.86 *** | 1142.77 *** | 948.99 *** | 1110.27 *** |
| Group 3 Firms | |||||
| Model 1 | Model 2 | Model 3 | Model 4 | Model 5 | |
| c | 0.99 ** | −0.39 ** | 0.40 | 0.36 | 0.41 |
| AIRP | −0.05 *** | ||||
| SUBW | −0.03 *** | ||||
| RAIL | −0.03 ** | ||||
| PORT | −0.03 ** | ||||
| DIST | −2.22 × 10⁻⁵ * | ||||
| GOVR | 0.39 | ||||
| AGGL | 0.49 *** | ||||
| TANT | 7.60 × 10⁻⁶ | ||||
| ZONE | 0.40 * | ||||
| sample size | 215 | 215 | 215 | 215 | 215 |
| significance | 0.00 | 0.00 | 0.00 | 0.00 | 0.00 |
| 6.02 *** | 1.36 *** | 6.52 *** | 4.28 *** | 6.01 *** | |
| LR statistic | 749.47 *** | 178.03 *** | 784.27 *** | 594.07 *** | 742.51 *** |
Note: * significance at a level of 10%; ** significance at a level of 5%; *** significance at a level of 1%.
© 2018 by the authors. Licensee MDPI, Basel, Switzerland. This article is an open access article distributed under the terms and conditions of the Creative Commons Attribution (CC BY) license (http://creativecommons.org/licenses/by/4.0/).
Share and Cite
MDPI and ACS Style
Jiang, H.; Xu, W.; Zhang, W. Transportation Accessibility and Location Choice of Japanese-Funded Electronic Information Manufacturing Firms in Shanghai. Sustainability 2018, 10, 390. https://doi.org/10.3390/su10020390
AMA Style
Jiang H, Xu W, Zhang W. Transportation Accessibility and Location Choice of Japanese-Funded Electronic Information Manufacturing Firms in Shanghai. Sustainability. 2018; 10(2):390. https://doi.org/10.3390/su10020390
Chicago/Turabian StyleJiang, Haining, Wei Xu, and Wenzhong Zhang. 2018. "Transportation Accessibility and Location Choice of Japanese-Funded Electronic Information Manufacturing Firms in Shanghai" Sustainability 10, no. 2: 390. https://doi.org/10.3390/su10020390
Note that from the first issue of 2016, this journal uses article numbers instead of page numbers. See further details here.