Sustaining Innovation Performance in SMEs: Exploring the Roles of Strategic Entrepreneurship and IT Capabilities

1
Graduate Institute of Technology Management, National Chung Hsing University, No. 250, KuoKuang Rd., Taichung 402, Taiwan
2
DOAE, National Taichung University of Science and Technology, No. 129 San-Ming Rd., Taichung 40401, Taiwan
*
Author to whom correspondence should be addressed.
Sustainability 2018, 10(2), 442; https://doi.org/10.3390/su10020442
Submission received: 13 December 2017
/
Revised: 22 January 2018
/
Accepted: 27 January 2018
/
Published: 8 February 2018
(This article belongs to the Section Economic and Business Aspects of Sustainability)
Abstract
:Recent research questions our understanding of the processes at play regarding information technology (IT) capabilities’ contribution to innovation performance, particularly under environmental uncertainty. Strategic entrepreneurship (SE) or the interface of entrepreneurship and strategic management, which aims to answer the very question of how firms create value or wealth and sustain success in increasingly competitive and dynamic environments, is deemed the appropriate catalyst to further explore this link. Thus, this study attempts to examine the driving effects of IT capabilities on product innovation performance (PIP) by exploring the mediating role of SE. Data were collected from 164 small- and medium-sized enterprises (SME) information communication technology (ICT) firms in Canada. Partial least squares (PLS) regression tested the hypotheses derived from the research model, and data exploration and analysis including visual analytics were performed in R. Results confirm that IT capabilities drive PIP and thereby create firm level value. Secondly, SE had a direct impact on PIP, and SE partially mediates IT capabilities effect on PIP. To date, SE research has mostly been conceptual in nature making this study one of the few to empirically capture the phenomena and highlight its link to sustainable innovation performance.
1. Introduction
Despite claims that IT and its perceived performance link is both imperative to managers and policy makers [1], and necessary for firm growth and survival [2], previous research has returned mixed results [3,4] thereby leaving a gap in the literature. The current research is motivated by our agreement with [5,6] who state that little is known about the relationship between IT capabilities and such performance measures, and with [1] who called for greater investigation into the improved IT business value (ITBV) of emerging forms of IT, particularly the role of other intermediary firm resources. In this study we attempt to answer this call and explore further the nature of IT capabilities in driving performance. In contrast to previous researchers, we operationalize strategic entrepreneurship (SE) as the mediating mechanism of interest within the context of small- and medium-sized enterprises (SME). Specifically, we aim to contribute to the ITBV and SE literatures as well as inform managerial practice by exploring two primary research questions: (1) what role does IT capability play in firm wealth/value creation? (2) what role does SE play in mediating the IT capability effect on PIP (Product Innovation Performance)?
These questions ultimately derive from the massive economic and social changes of the late 20th and early 21st centuries. As firms and researchers realized the magnitude of the challenges facing them, they invariably looked to determine the factors driving successful firms and attempted to respond accordingly. Strategic management and entrepreneurship scholars subsequently regarded entrepreneurial actions as necessary for growth and survival of firms [7,8]. Innovation, according to [9,10], was the primary driver of performance. Others [11,12,13,14] saw product innovation as central to success, while [15] stated that new product development reigned as the driving force behind firm success with [16] later claiming that technological innovation acted as the primary driver. Presently, innovation is widely regarded by academics and practitioners as not only important to the function of the firm but imperative for its continued operation and an especially critical component of the firm’s strategy [17].
According to [18], the life-sustaining elixir for all types of firms is their ability to continuously innovate. However, the concept of innovation is poorly defined [19]. Drucker [20] (p. 36) defines innovation as “the act that endows resources with a new capacity to create wealth”. This definition, while not very specific, links organizational resources to wealth creation via something new to the firm. This unspecified novelty within the firm is born out of the work of the entrepreneur; innovation is seen as the tool of the entrepreneur or the means by which they exploit changing opportunity. In this research, we adopt the definition of innovation as being the generation, development and adoption by a firm of a new idea or a new behavior encompassing products, services, devices, technology processes, organizational structures, administrative systems, plans, policies and programs [21,22,23]. In adopting this definition, we attempt to capture innovation in more than just products, unlike most previous research, and require a measurement tool capable of capturing a firm’s PIP. However, traditional measurement instruments such as financial ratios are not accurate in capturing different types of uncertainty, creativity and newness. We concur with [24] who state that innovation affects competitive advantage or value creation but that it is better to separate PIP from general measures of firm performance so as to capture a more appropriate measurement of interest. Consequently, the intermediate variable, innovation performance, may be used as the dependent variable in firm-level research. This leads us to adopt the definition and scale developed by [25] who define PIP as a two-dimensional construct: product innovation efficiency and product innovation efficacy. Product innovation efficacy marks the degree of success of the innovation and product innovation efficiency measures the effort undertaken to obtain that degree of success.
In many instances, explanations for successful innovation performance have been contingent on advances in information technology (IT). Initially, only anecdotal evidence supported the claim that IT drove firm value and performance, leading to the period being characterized by the dilemma of the productivity paradox [26]. ITBV scholars endeavored to prove IT’s role in driving firm success. Eventually, borrowing from the field of strategic management, particularly the resource-based view (RBV) [27,28,29] and its offshoot the dynamic capabilities view [30], researchers were able to operationalize the construct of IT capabilities and find both direct [31,32,33] and indirect [34,35,36,37] evidence of IT resources and capabilities contribution to organizational performance. Indeed, IT capabilities have been found to lead to superior firm performance in terms of costs and profit [31], financial and market performance [38], better organizational performance [3], and competitive advantage in turbulent environments [39]. Additionally, current enquiry has undertaken a process-oriented approach to investigate how IT capabilities are bundled, leveraged, and synergized with other firm-level capabilities in order to create value [1,3,5,31,40]. Bharadwaj [31] found that IT capability driven firms were more likely to prosper financially via increased revenues and reduced costs attributable to the synergies created by combining IT resources with the firms’ other capabilities. This notion of value creation was echoed by [41] who describe IT capabilities forming from the synergistic integration of IT resources and other complementary organizational capabilities. IT-enabled resources, according to [6], hold the potential to influence competitive advantage of the firm via the synergy created when positioned strategically with other firm resources and capabilities. IT capabilities display a significant positive effect on firm level performance according to [32,42] and also on competitive advantage [2]. In the RBV sense of this research, IT capabilities refer to the organizational ability to mobilize and deploy tangible, intangible and human IT-based resources in combination with other resources and capabilities for the purpose of creating competitive advantage [27,28,31].
In borrowing from the fields of both strategic management and entrepreneurship, scholars have claimed that firms need to successfully balance the exploration (opportunity-seeking) and exploitation (advantage-seeking) of future and current sources of competitive advantage [43,44,45,46]. Specifically, this interface of entrepreneurship research (opportunity-seeking) and strategic management research (advantage-seeking) has been labeled as SE. Fundamentally, SE attempts to answer the questions of how firms create value or wealth and how they remain relevant and sustain success in the long term in increasingly competitive and dynamic environments [7,47]. To date, empirical research related to SE has been sparse, making this research one of the first to empirically test the phenomenon. According to [7], possession of key capabilities and resources facilitates the delicate entrepreneurial and strategic balance necessary to create firm value or wealth. We deem IT capabilities as one such key capability, able to enhance the separate dimensions of SE. Previous work, for example, has noted IT capability’s impact on innovation [48] and competitive advantage [49]. SE dimensions and proxies have also been linked to general performance measures [44,50] and PIP [5,51,52]. Thus, we conceive SE as the link between IT capabilities and PIP. In this research, we employ the definition of SE provided by [47] as the value creating intersection between strategy and entrepreneurship. This entails the balancing of exploration and exploitation activities, the balancing of resources and capabilities, and anticipating and responding to environmental change.
Finally, this research aims to explore SE specifically within SMEs. The SME firm level focus of this research is congruent with the search for SE since it focuses on both opportunity- and advantage-seeking (ambidextrous) behavior. SE is broader in scope than other forms of entrepreneurship and is interested in all types of performance improvements, not just overall financial performance [53,54]. Additionally, the nature of SMEs in terms of size (less than 250 employees), age (non-start-up), organizational structure (non-hierarchal and flexible), limited resources and dependence on key top management team (TMT) personnel provide a better test ground for SE processes and behavior. Lubatkin et al. [55] argue that the characteristics of SMEs mean that TMT players are central to the attainment of competing behaviors and processes. While it is generally agreed that firms attending to such opportunity- and advantage-seeking behavior are expected to improve performance, we agree with and follow in the direction of [55] who state that data collection difficulty in SMEs has prevented scholars from exploring the phenomenon and left gaps in our knowledge about such types of firms. In practice, SMEs dominate in terms of firm count and contribution to employment in many nations including Canada, the USA and the EU. Currently, they are deemed by many nations as not only imperative for growth and employment creation but also critical for innovation and entrepreneurship stimulus. That being the case, this research aims to explore the impact of IT capability on innovation performance, looking specifically at the role SE plays in mediating this effect.
This interfacial study contributes both to the SE and ITBV literature and to managerial practice in several ways. First of all, this research not only explores and finds evidence for the existence of the elusive SE construct, but we also discover that the impact of IT capabilities on firm level PIP is partially mediated by SE. Most SE research to date has been conceptual, meaning that this work represents one of the first empirical studies aimed at capturing the construct. In doing so, this research, unlike most others [56], captures innovation in services as well as products. Thus, to our knowledge, this study is the first to take an SME firm level focus in exploring the link between IT capabilities, SE and PIP. Secondly, regarding ITBV, our findings suggest that IT capabilities significantly contribute to firm level PIP value in our multi-industry information communication technology (ICT) context. Previous research regarding performance implications has returned mixed results [3,4], and details are scant on the processes at play or explanations of how IT creates value [57]. Finally, this research informs SME managers of the vital importance of developing strong IT capabilities and striking a balance between opportunity-seeking and advantage-seeking behavior in attempting to create and sustain firm value.
We next present our proposed conceptual model and the proposed relationships among the major research constructs. Following this, the methodology section comprises the research design and methods employed, followed by an empirical analysis of results. Finally, we conclude with a discussion of the findings and research limitations.
2. Theory and Hypothesis Development
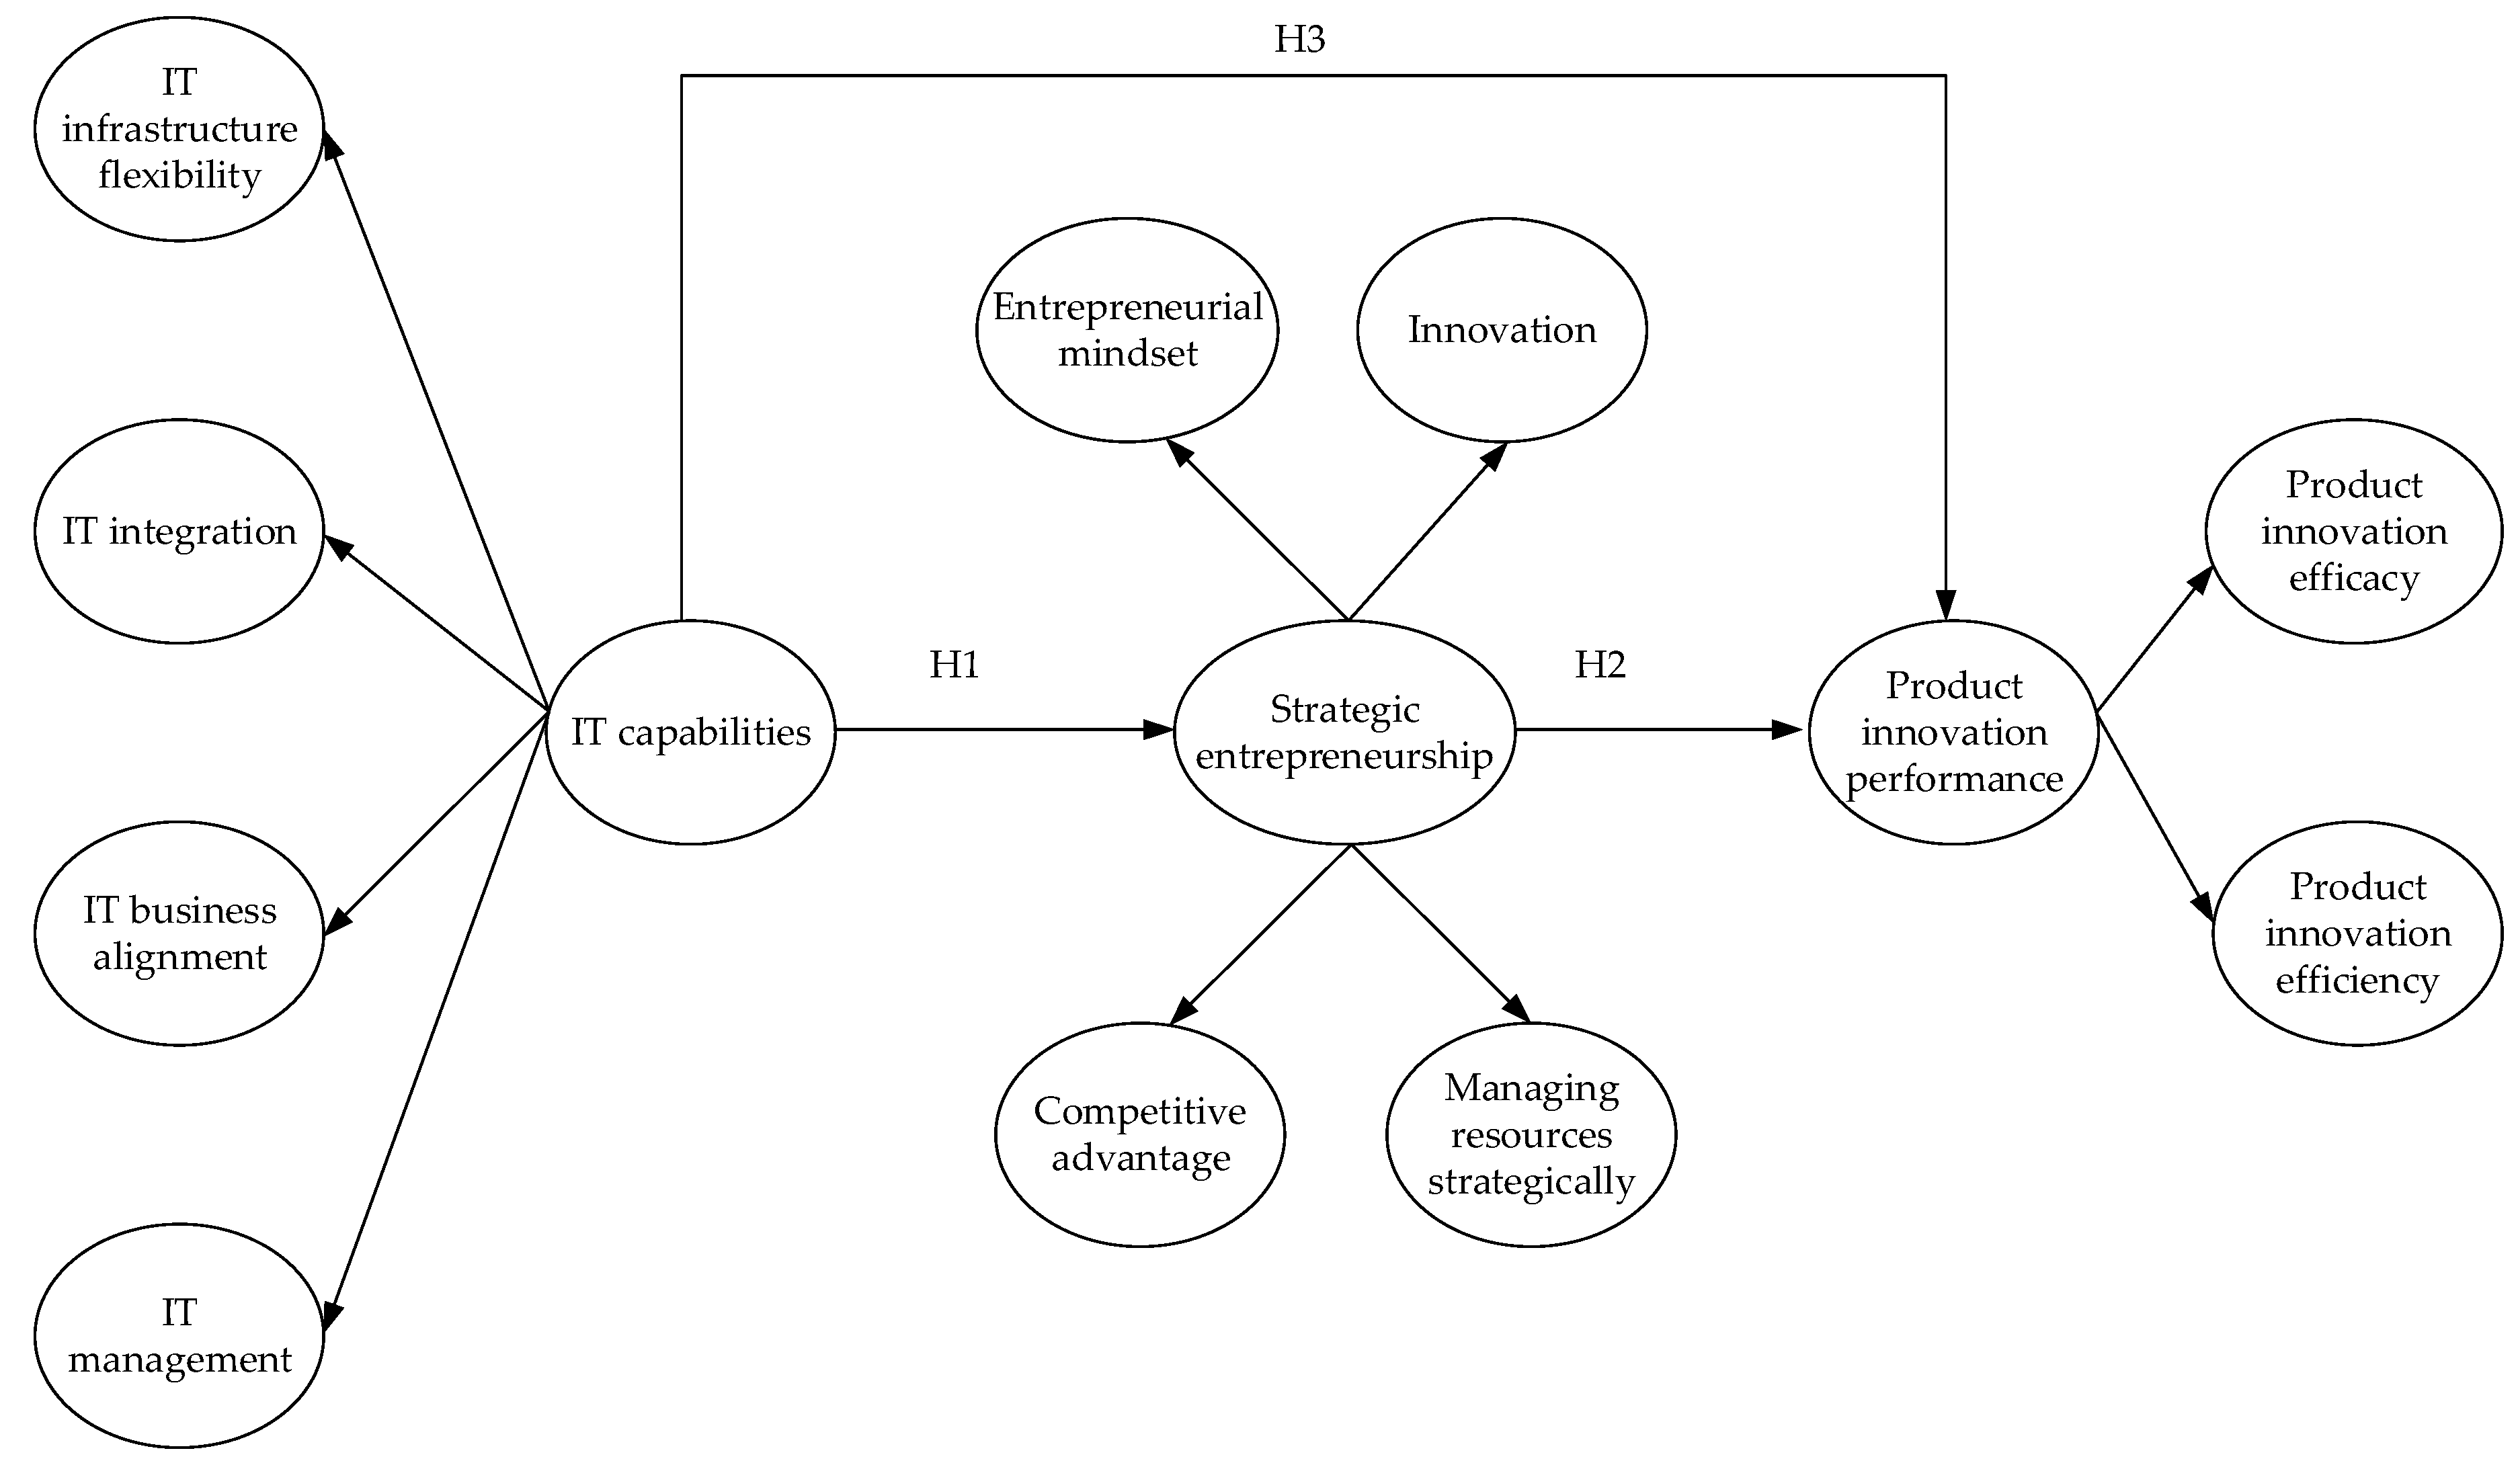
In the following section, we develop and present three hypotheses associated with our research model as illustrated in Figure 1. The SE construct consists of four dimensions (entrepreneurial mindset, managing resources strategically, innovation and competitive advantage). The IT capabilities construct is also conceived as a second-order reflective construct with four associated dimensions (IT infrastructure flexibility, IT integration, IT business alignment and IT management) and the dependent variable, PIP, is represented as a two-dimensional construct (product innovation efficacy and product innovation efficiency).
Although general definitional agreement exists among researchers regarding IT capabilities, there is less agreement about the individual IT capability topologies as presented in the literature. In our view, since no solitary IT capability exists, the construct must consist of several distinct sub-dimensions. These individual IT capability sub-dimensions drive a firm’s ability to compete innovatively and this driving effect is synergized when they act in concert. Notwithstanding the debate regarding individual dimensions and typologies, we suggest that a flexible IT infrastructure indicates the degree to which firms’ IT infrastructure is scalable, compatible and modular and can facilitate numerous business applications [5,41,58]. The second dimension, IT integration, represents the capability of a firm to allow rapid intra- and inter-organizational data, information and communication exchange for collaborative benefit [5,36,59,60]. Next, IT business alignment invokes the notion of overlap or compatibility between both the IT-business and the business-IT sides of the firm in a manner that is value additive [61]. Finally, IT management refers to the ability of the firm to create business value via its skill and competence in managing the IT resources in its possession [37].
In our view, these individual IT capabilities are critically important and a necessary antecedent helping to drive a firm’s ability to compete innovatively via SE on the PIP front (see Table 1). This driving force is heightened with the synergy created when these capabilities act in unison. We also argue that IT capabilities possess many more attributes than those detailed by previous researchers and should also include security, reliability, flexibility, cost-effectiveness as well as accommodating growth and learning potential. Given these additional attributes, we contend that the different dimensions of IT capability individually, and leveraged together, can influence the various dimensions of SE as proposed in our research model. Thus, our four-dimensional IT capabilities construct is meant to represent a holistic and comprehensive set of value-creating capabilities that we believe are individually and synergistically much more multifarious.
IT capabilities can enhance both opportunity-seeking dimensions (entrepreneurial mindset and innovation) of SE in many ways. For example, IT infrastructure flexibility allows a firm to capitalize on market expansion opportunities, including access to new markets, the generation of new markets, and the development of new business models. Additionally, this capability allows a firm to ramp up business processes across various regions and markets. Duncan [48] insisted that flexible IT infrastructure was central to firm success or failure, particularly with regard to allowing for continuous improvements. Similarly, when the components of firms’ IT are properly integrated, the firm is able to share data and information between various stakeholders. This integration in turn allows firms to quickly identify new ideas, transform these ideas into opportunities for the firm, and to continually repeat the process. According to [44], in order to stimulate either incremental or radical innovation, creativity is required and IT capabilities have the ability to foster creativity in numerous ways. IT infrastructure flexibility facilitates sharing and eases the use of a firm’s IT infrastructure, thereby unlocking creativity of staff and other stakeholders. This sharing of information within a firm, for example, may also improve the quality of customer services and firm responsiveness to customers and may indeed drive and accelerate innovation. New product development teams can work from diverse locations, injecting creativity and sharing information and knowledge to expedite cycle times. When firms synchronize IT and business activities, staff are able to work more efficiently and effectively, utilizing shared data, information, knowledge management, and technology and spur innovation.
The two dimensions of SE characterized as advantage-seeking (competitive advantage and managing resources strategically) are also potentially impacted by IT capabilities. Previous research has established both direct [31,32,33] and indirect [2,34,35,36,37] links between IT capabilities and various performance measures. In addition to affecting firm level profits, Jacks, T. et al. [49] suggest that IT affects firms in other ways including productivity and intangibility. We suggest that one of these intangibles includes aiding firms in balancing resource allocation between opportunity- and advantage-seeking behaviors. The scalable and modular nature of IT infrastructure flexibility, for example, enables firms to more easily iterate between planning and execution. Digital marketing and real-time monitoring not only allow for customer identification but also permit rapid pivoting or transitioning towards targeting these customers. IT integration, according to [31], was deemed critical in assisting decision makers. An example of this might include cloud-based enterprise resource planning applications which, when used effectively, translate into instant and continuous global monitoring and control of firm-level resources. From the RBV perspective, IT integration is not a common physical resource but a carefully constructed and managed combination of resources. These resource combinations are similar in a sense to the chain of capabilities used to describe flexible IT infrastructure [41]. As a result, we view IT integration as both critical and strategic, with links to competitive advantage.
Although it has been argued here that IT capabilities can individually contribute to enhancing SE, ultimately, it is the unique combinations and reconfigurations of these capabilities acting together that create firm value. In practical business settings it is unlikely that any of these capabilities would function in isolation. In other words, it is their combinations and enhanced synergies that create value for firms. Based on the above agreement, we propose the following hypothesis:
Hypothesis 1.
IT capabilities are positively related to SE.
In this study we adopt and test the conceptualization of SE initially proposed by [44] but subsequently revised by [63]. This revised practical model of SE was tested by [45] and is the operationalization employed in our study. While a single definition of SE has yet to be agreed upon, there does seem to be consensus on what the phenomena entails. Many researchers recognize the intersection of advantage-seeking behavior (strategic management) with opportunity-seeking behavior (entrepreneurship) for the purposes of performance improvement. This performance improvement ranges from superior firm performance, to competitive advantage, to wealth and/or value creation [7,45,46,63,64]. Others, including [65] state that no matter how we choose to define SE, the concept is rooted in the pursuit of competitive advantage which gives rise to new products, new processes, new markets, or technology innovation via new and established firms alike.
Although very little empirical research has been done on the SE construct, and none that we know of specifically relates SE to the phenomena in question, some work has linked the individual dimensions of SE and its proxies to performance in general and to PIP in particular. We posit that the dimensions of SE can influence PIP. Firstly, SE was founded on the notion that firms attending to both opportunity-seeking and advantage-seeking behaviors will improve firm performance—even more so given the correct balance of the two behaving synergistically [7,45,47,63]. Ireland et al. [44] referred to this simultaneous attention to both as the dimension of managing resources strategically, which they argued could explain performance differentials among firms.
Secondly, corporate entrepreneurship, the older sister of SE has been previously shown to be linked to performance [50] and PIP [66]. The seminal work of [67] paved the way for later researchers, including [68], to devise the now prominent entrepreneurial orientation construct and its 9-item measurement scale. The entrepreneurial orientation construct is most often embodied by the characteristics of innovativeness, risk taking and pro-activeness. Lumpkin and Dess [69] later built on the construct and added the dimensions of competitive aggressiveness and autonomy. Entrepreneurial orientation, long considered a surrogate of SE, has frequently been studied in the corporate entrepreneurship context and regularly been associated with performance enhancement in the literature [51,52], and according to [70], entrepreneurial orientation’s separate dimensions positively influence firm-level performance.
Finally, the two entrepreneurial or opportunity-seeking dimensions (entrepreneurial mindset and developing innovation) and the two strategic or advantage-seeking dimensions (managing resources strategically and creating competitive advantage) build on the organizational learning platform of [71] by incorporating the simultaneous manipulation of current capabilities and new competencies for the purpose of sustained organizational performance. Both these opportunity- and advantage-seeking behaviors constitute an organizational learning capability which [24] viewed as exploration and exploitation learning, leading to improved PIP. Other researchers too have noted the relationship between PIP and various measures of learning within organizations [72,73]. Furthermore, improved PIP requires both market and technical knowledge according to [74], which are garnered respectively from opportunity- and advantage-seeking behavior. This knowledge, along with continued and focused attention on innovation, has the potential to create a self-reinforcing cycle of innovation improvement [66,75]. We therefore suggest the following hypothesis:
Hypothesis 2.
SE has a significant positive impact on PIP.
Taken together, the consolidation of Hypothesis 1 and Hypothesis 2 suggests that SE is a likely intermediary in brokering the connection between IT capabilities and PIP. Individual IT capabilities have the ability to drive the various dimensions of SE but the synergies created when these capabilities act in concert intensify the overall level and effect of SE. The fusing of Hypothesis 1 and Hypothesis 2 would therefore suggest that IT capabilities effect on PIP is mediated by SE. In this research, ICT firms possessing the appropriate mix of IT capabilities are firmly positioned to undertake SE by capitalizing on opportunities via enhanced entrepreneurial mindsets and improved innovation, as well as on advantages through managing their resources strategically and executing competitive advantage. This enhanced level of SE in turn has the potential to heighten firm-level PIP. Consequently, when a firm is adept at creating and utilizing their IT capabilities, SE is enhanced, thereby improving the firm’s overall level of PIP. Thus:
Hypothesis 3.
The relationship between IT capabilities and PIP is mediated by SE.
3. Research Methodology and Analysis
3.1. Research Sample
This research employs a survey questionnaire method targeting top management team (TMT) or key informant firm-level respondents to collect data and explore the developed hypotheses. To broaden the scope of research beyond a single industry, ICT firms sourced from the Government of Canada Innovation, Science and Economic Development database were surveyed. In this database almost 92% of firms are characterized as service-based and more than 99% fit the definition of SMEs. This facilitates two of the purposes of this research; namely to explore innovation in products and services and to explore SE, which unlike corporate entrepreneurship, is deemed a SME firm-level phenomenon. ICT owners, presidents, Chief Executive Officers (CEOs), Chief Information Officers (CIOs) and senior managers were targeted to participate in the study. A link to the online survey was sent via email along with a letter of introduction which included an explanation of the purpose of the study and assurances of confidentiality of participation and responses.
This research followed a three-stage process. In stage one, the initial survey was given to 5 academic colleagues and checked for instructional clarity, tone, consistency and readability. Items were modified according to their feedback and then in stage two, the instrument was pretested on 10 industry experts in order to ensure face and content validity of the questionnaire items. Minor changes were again made based on comments and recommendations received. The final questionnaire consisted of 9 personal demographic items and 5 company demographic items. The main survey consisted of 32 (28 retained) items, all of which were measured using a 5-point Likert-type scale ranging from strongly disagree to strongly agree. Initial construct validity was determined by ensuring that pre-test responses were normally distributed and confirming the absence of skewness.
3.2. Measurement Variables
All multi-item measures for this study were adopted from previously validated studies in the literature but have been modified slightly to fit with the PIP context of this study. The purpose of the pretest was also to validate these multi-item measures (see Appendix A). Also, this research conceptualizes IT capabilities, SE and PIP as reflective second-order constructs according to the definitions provided in Appendix B. Given the lack of agreement on IT capability dimensions and typologies, we follow [62], who called for the movement away from studies of solitary IT asset types towards a disentanglement of the component parts, thereby emphasizing the potentially synergistic IT capabilities which create firm value. Likewise, [1] insist that the IT capability construct should be separated into meaningful elements. As such, this research employs the typology devised by [5] and treats IT capabilities as a second-order construct comprised of four dimensions. Chen et al. [5] argue that it is better to take an expansive view of the construct as they are more likely to covary with the variable in their study. Therefore, we adopt their typology and illustrate the construct as consisting of the following four dimensions: IT infrastructure flexibility, IT integration, IT business alignment and IT management.
SE is also composed of four dimensions, namely; entrepreneurial mindset, managing resources strategically, innovation and competitive advantage. Items were operationalized from [45] while the dependent variable PIP, which comprises both product innovation efficacy and product innovation efficiency, was derived from [25].
3.3. Descriptive Statistics
A breakdown of the 164 respondents reveals the following: CEO/Chairman/General Manager (GM) 67%, CIO/IT manager/E-commerce manager 9% and other senior manager 24%. 89% of all respondents were male. 83% of the sample was above the age of 41 with 27% ranging from 41 to 50 years of age and 56% at age 51 and above. 97% were college educated; 43% holding bachelor’s degrees, 46% having masters and 7% with PhDs. 79% of those surveyed turned out to be the firm founder and exactly 80% indicated that they held more than 10% equity in their organization. As a measure of entrepreneurship, 63% indicated that they had previously been involved in new venture formations and 83% of all respondents considered themselves an entrepreneur. In terms of personal level of experience, only 7% of respondents had less than 10 years’ experience; 81% had more than 16 years’ experience and 12% had from 11 to 15 years prior experience. In terms of the firms themselves, 46% of the respondent firms had been in operation for over 15 years, 28% from 10 to 15 years and 8% from 5 to 10 years, indicating that the majority of firms had a fair degree of longevity. 16% of firms had been in business for between 1 to 5 years and a mere 3% for less than 1 year. Confirming the SME nature of this study, 75% of firms employed fewer than 20 staff, 14% employed between 20 to 50 employees and 5% from 50 to 100 individuals. Only 6% of firms surveyed had a workforce above 100. In terms of financials, 46% of firms had revenues under $1 million Canadian, 35% between $1 m to $5 m, 8% from $5 m–$10 m, 2% from $50–$100 m and 4% above $100 million Canadian.
3.4. Non-Response Bias and Common Method Bias Check
In order to ensure that the sample (n = 164) did not suffer from non-response bias, the sample was split between early and late responders. We followed in the direction of [76], who in referencing [77], noted that the opinions of late respondents stood for those of non-respondents. Responses received in the first month of data collection (42 responses or approximately 25%) were deemed as early). The 122 responses or 75% received thereafter were categorized as late. Analysis of the two groups attempted to determine if any statistical differences existed between early and late respondents. We conducted a t-test using the scores of the two groups; no statistically significant differences between the two could be found, thus ensuring homogeneity in responding.
A test of common method bias was also conducted given the firm-level singular respondent nature of our survey instrument. A Harman’s one-factor test was performed on all latent variables in our survey to assess whether or not common method bias might exist. The test revealed that the highest covariance attributable to any one factor was 32% giving us a preliminary indication that common method bias was not a concern. However, given that our independent and dependent variables were obtained from the same respondents, we undertook the additional rigorous ad hoc approach provided by [78] based on the work of [79]. In this research, we follow the steps and method of [78]. Summary table results are shown in Appendix C.
This partitioning approach separates trait, method and random error variance of each individual indicator. This required inserting an additional latent method factor into our structural model in SmartPLS2 and transforming each individual indicator into single-indicator second-order constructs. We then linked our newly inserted common method factor to all the individual indicator constructs transformed from our observed indicators. Liang et al. [78] found no statistical differences qualitatively between their models when run as either formative or reflective constructs and consequently we leave our model as a reflective construct.
To interpret the results and ensure the absence of common method bias in our model we must examine the coefficients of both the substantive construct and the method factor construct incoming paths. In doing this, we follow the test developed by [80] and advised by [78]. In Appendix C, R22 represents the squared values of the method factor loadings or, alternatively, the percentage of indicator variance attributable to method. R12 represents the squared loadings of the substantive constructs or the percentage of indicator variance caused by substantive constructs. According to [78], two conditions must exist for us to rule out common method bias. Firstly, the method factor loadings should be insignificant and secondly, all indicators’ substantive variance R12 should be much larger than the method variance R12 (as is the case in Appendix C). Therefore, we rule out the presence of common method bias.
3.5. Measurement Model
In analyzing the data from the 164 surveys received, indicator reliability, internal consistency reliability, convergent validity and discriminant validity of the measurement model were checked against the cut-off measures as suggested by previous researchers. In order to do this, standardized factor loadings, composite reliability, average variance extracted (AVE) and the square root of AVE were taken from the model. A check of indicator reliability confirmed that 4 indicators that form PIP_CACY (PIP-efficacy) had loadings that were below 0.5. These four items were removed as per [81,82]. The 28 remaining indicators were all retained having loadings of 0.7 or above.
Internal consistency reliability was confirmed via a check of the composite reliability scores (Table 2). All composite reliability scores range from 0.82–0.94 indicating a high level of internal consistency reliability [83]. Convergent validity was tested and confirmed with a check of the CR and AVE as suggested by [84,85]. Typically, these measures should exceed 0.7 and 0.5, respectively, which was the case as shown in Table 2. Next, we tested whether the constructs discriminate well by following the steps discussed by [82]. We employed the Fornell–Larcker [84] criterion to determine discriminant validity by confirming that the square root of the AVE of the individual latent variables exceeded the latent variable correlations. In Table 2, the square root of AVE values are displayed diagonally and all are higher than the corresponding latent variable correlations. To further ensure discriminant validity we extracted the cross-loading table from the PLS default report (See Appendix D). As evidenced, indicator outer loadings on every single construct are higher than its cross-loadings with other constructs. In addition, all primary factor loadings are more than 0.2 away from loadings on other factors, thereby confirming the discriminant validity of the measurement model. Finally, it should be noted that all but one of the primary factor loadings exceeded 0.70 providing strong support for our decision to measure the constructs reflectively.
4. Empirical Results
4.1. Structural Model
Once reliability and validity of the construct model had been ensured, the next step was to evaluate the structural model and perform the necessary hypothesis testing. SmartPLS2 version M3 software was employed again, this time to perform a path analysis using a PLS-SEM model bootstrapping technique (frequency of 600). This analysis conforms to the 10X’s rule suggested by [86]. Our sample size of 164 responses is both larger than 10X the largest number of formative indicators used in measuring the most complex construct and/or more than 10X the largest number of structural paths directed at any single construct in the structural model.
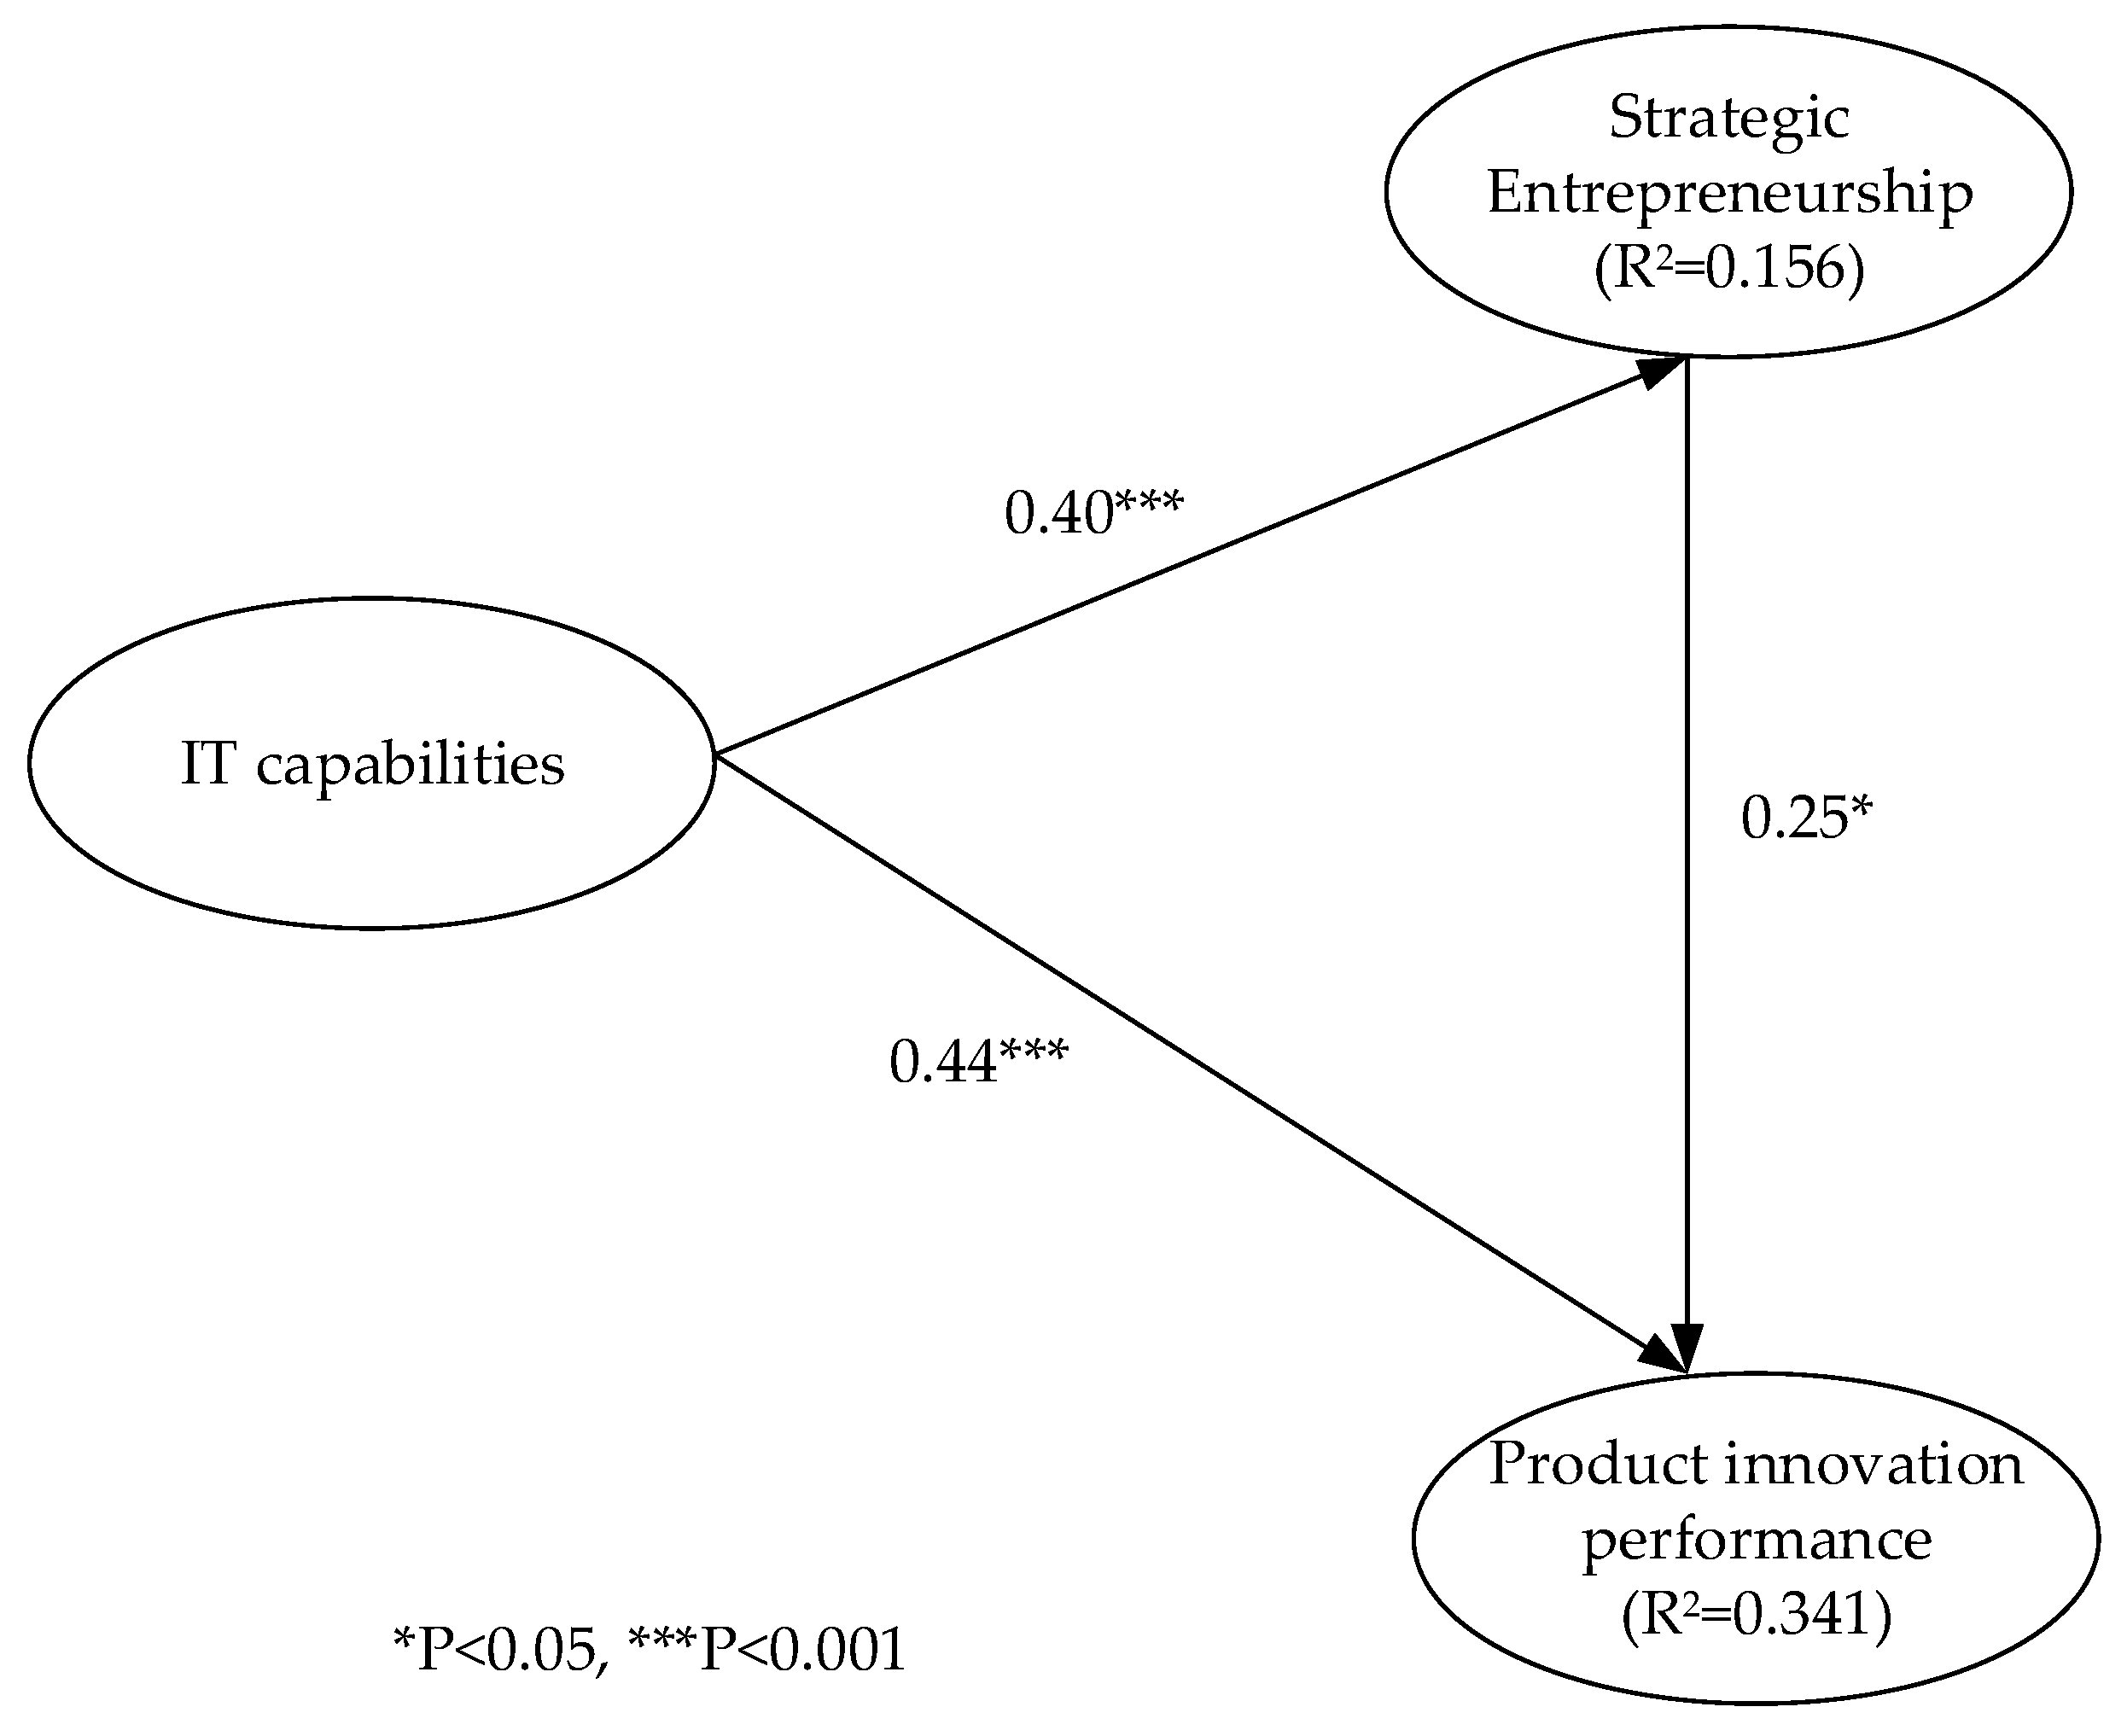
PLS results, including path coefficients and R2 values, were calculated to determine the predictive power of the structural model. In Figure 2 below, our coefficient of determination (R2 = 0.341) is considered moderate according to [87]. IT-Cap (IT capabilities) can explain approximately 16% of SE’s variances in the model and together IT capabilities and SE jointly explain 35% of PIP’s variance.
In examining the path coefficients to determine the construct relationships (see Table 3), it is evident that all three of the structural model relationships are significant and therefore we find support for all three hypotheses related to the construct. As per Table 3 below, Hypothesis 1 was supported given that the path coefficient equaled 0.40 at p ≤ 0.001. Thus, we can assert that IT capabilities had a positive impact on the SE of the organization; including the firm’s entrepreneurial mindset, innovation, competitive advantage and managing resources strategically. Support was also found for Hypothesis 2 with a path coefficient of 0.25 at p ≤ 0.05. PIP was enhanced by the presence of SE in our research model. Finally, support was confirmed for Hypothesis 3 with a path coefficient of 0.44 at p ≤ 0.001, indicating that IT capabilities are capable of improving the intermediate measure PIP.
4.2. Mediation Test
Regarding the test for mediation, SmartPLS2 version M3 was used with the results shown in Table 4. This time we ran the model and calculated the value of the direct effect with and without mediation and confirmed the first criteria for mediation; namely that the indirect effect had reduced in power. Stated alternatively, in the presence of the mediator (SE) the effect of IT capabilities on PIP decreases in power but remained statistically significant, thereby indicating that the mediation effect exits. Next, the Sobel test was performed to test for significance of mediation. The result confirmed that the Sobel test statistic coefficient was significant at <0.05 (95% confidence interval) as per the results in Table 4. Given that the t-statistic coefficient was still significant, we conclude that the mediation is partial.
5. Discussion
In a practical business sense, Dibrell, C. et al. [88] argued that SMEs who make good use of IT can level the playing field with their larger competitors. Research has demonstrated the existence of this IT–firm performance link, but as previously stated, the results have been mixed. As [62] point out, although findings provide positive evidence of the relationship, it is dependent upon the performance measure employed. Given the difficulty in finding direct links between resources and outcomes, researchers now seem focused on how resources are leveraged, enabled, improvised, combined and synergized to form IT capabilities. Recently, innovation has been touted by researchers and practitioners as central to firm function and continued operation. With anecdotal evidence suggesting that IT plays a role in driving firm-level innovation, early researchers including [5,60] have begun to explore this connection. Our current understanding remains limited, yet the importance of the IT performance link means that it is still widely studied by researchers at the intersection of the IT and management fields [57].
In light of the importance and novelty of this type of research, we have taken the added precautionary and confirmatory step of exploring and visualizing our data. This allows us to better understand our data, reshape it for simpler understanding and create data visualizations of the interaction effects. Furthermore, this will increase transparency and ease validation in reproducing our results. Therefore, we deem this a necessary extra step. Tests were performed using R programming language and software environment for statistical computing and graphics [89]. Having established the measurement model with factor loadings for reflective measurement items greater than 0.707 [87] (see Appendix A), we next created several visualizations of the proposed interactions in R.
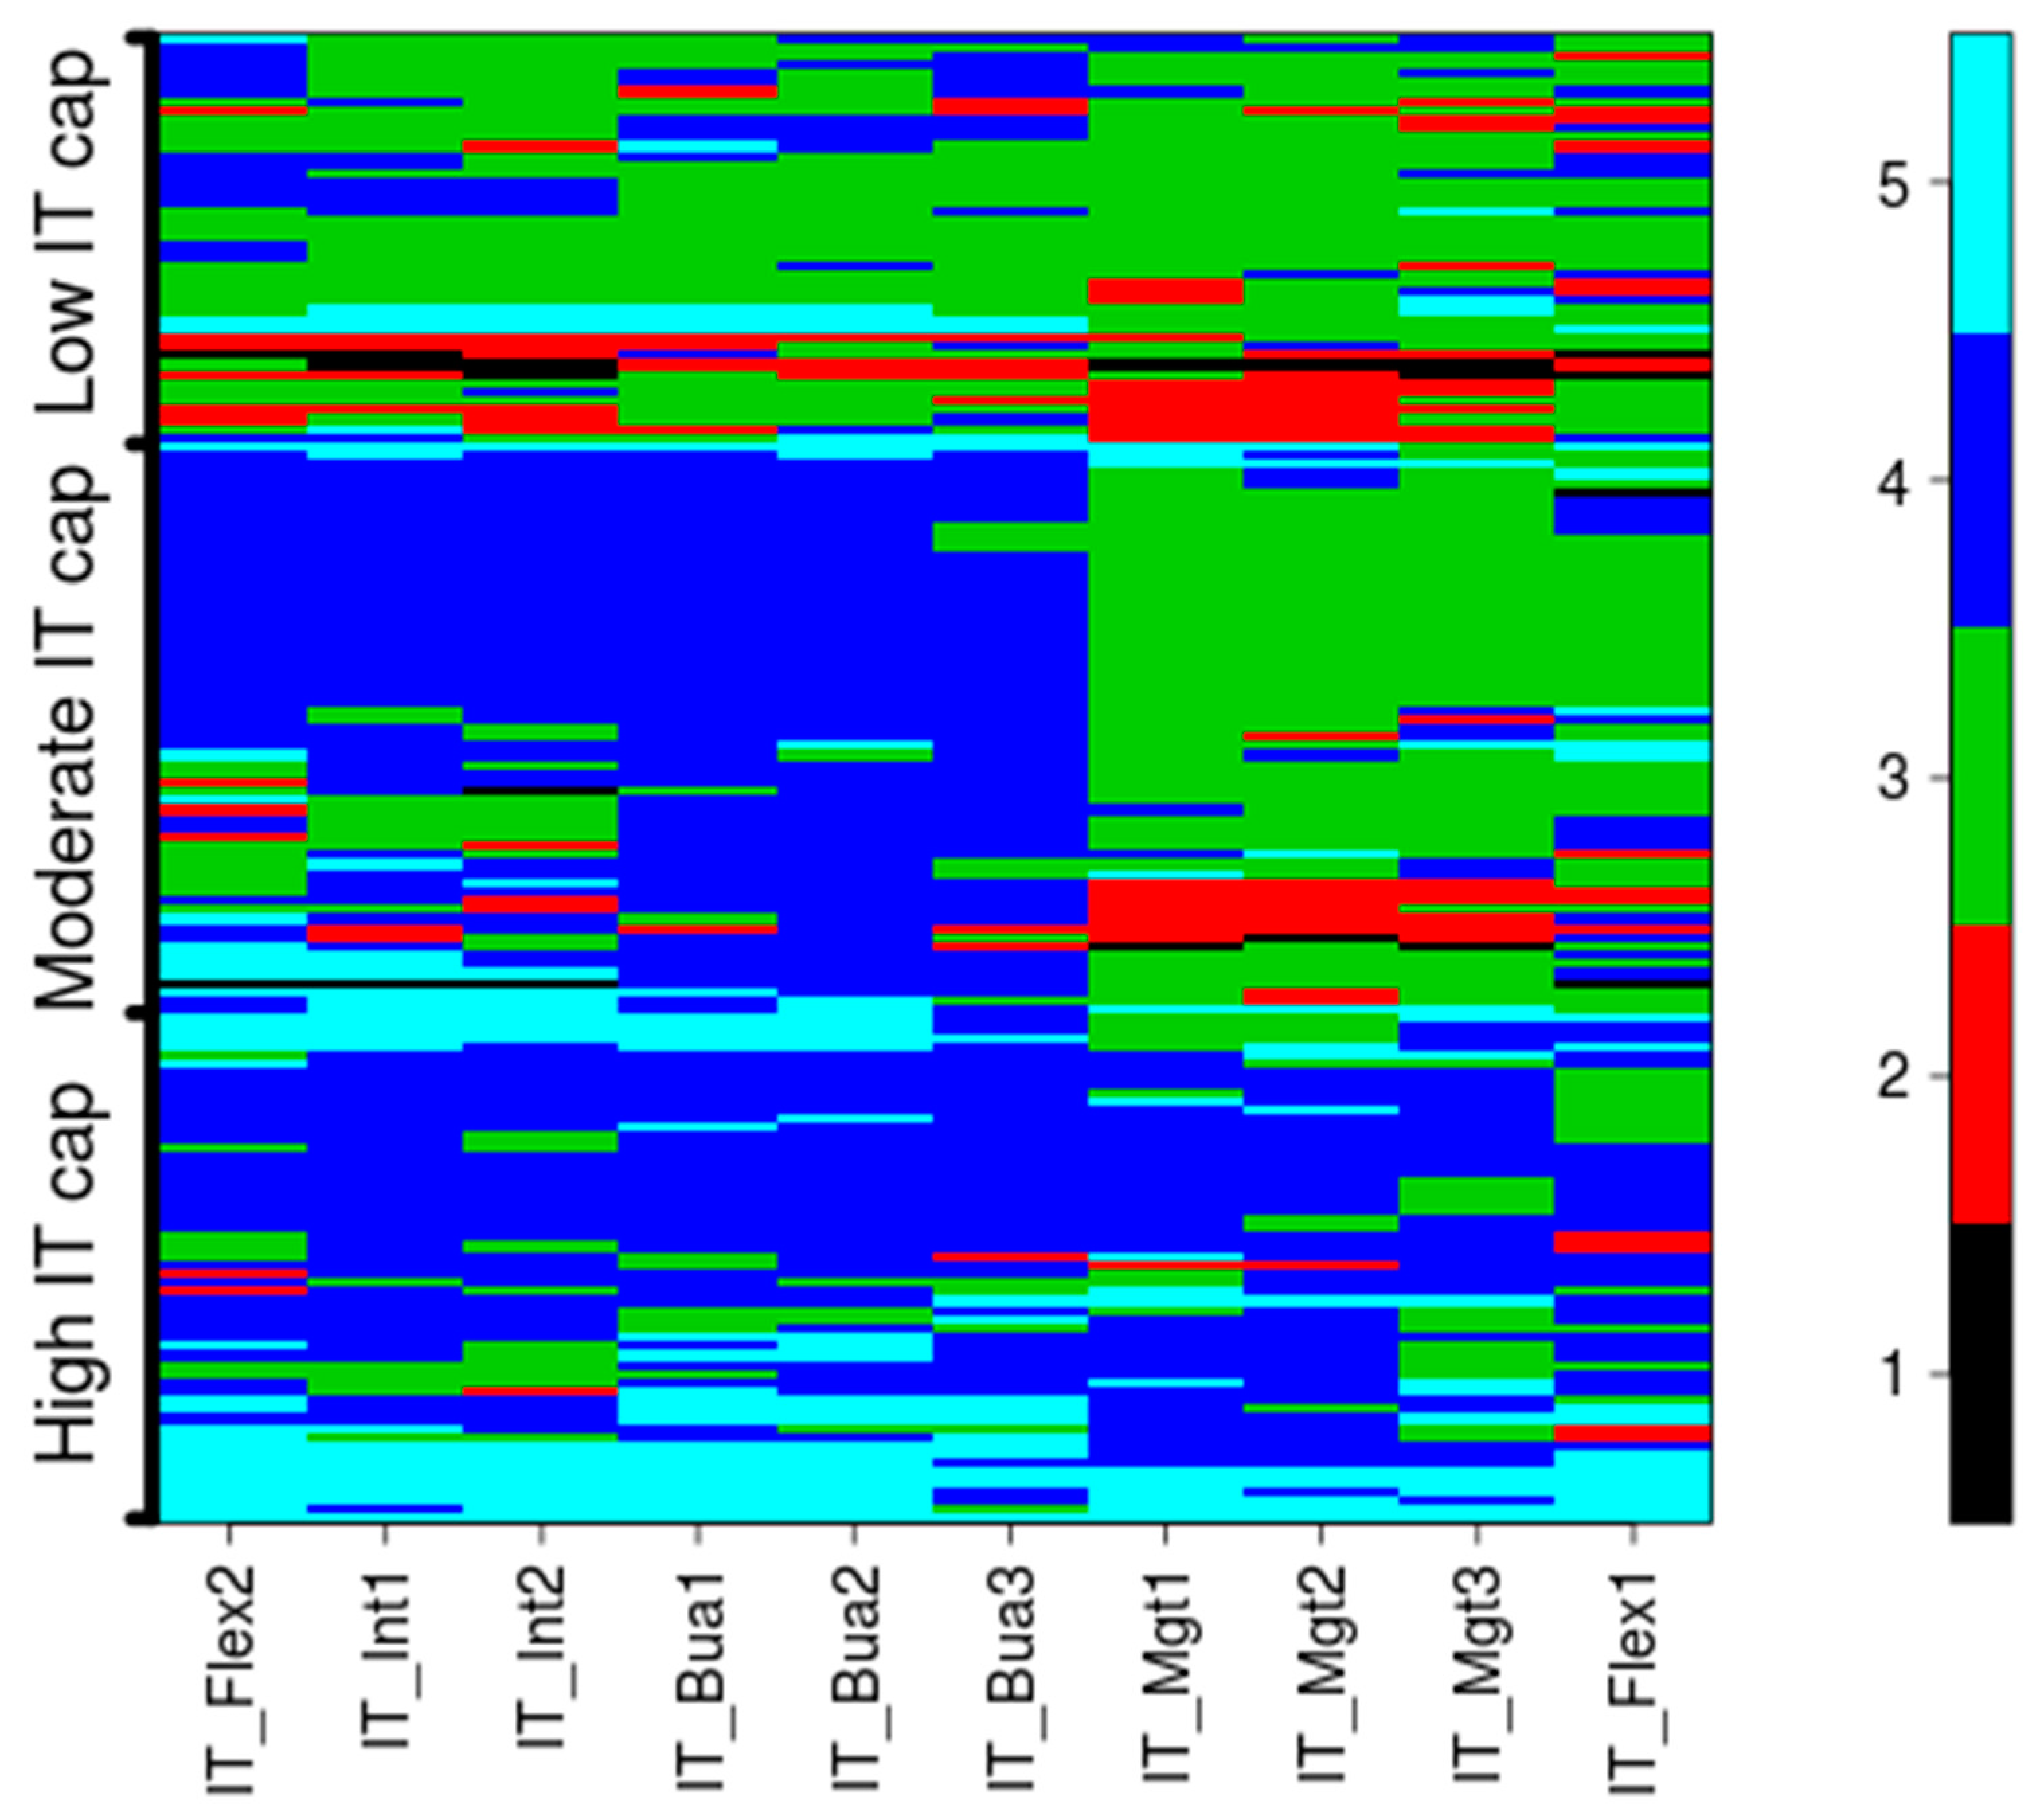
We apply partition around medoid (PAM) [90] with three clusters on the four separate dimensions of the independent variable, IT capability. The resultant heat map (Figure 3) depicts the data responses with the firms along the vertical axis ordered by each of the 3 clusters. Each horizontal line represents the data of one firm. In general, we find that a significant portion of respondents at the firm level agree with all IT capability items. Furthermore, the heat map illustrates three distinct cluster groupings which we term High IT cap, Moderate IT cap and Low IT cap. We define group 1 as high agreement IT capabilities (light and dark blue), group 2 as moderate agreement IT capabilities (dark blue/green) and group 3 as low agreement IT capabilities (green). These partitions allow us to create more meaningful visualizations based on our propositions for the discussion to follow.
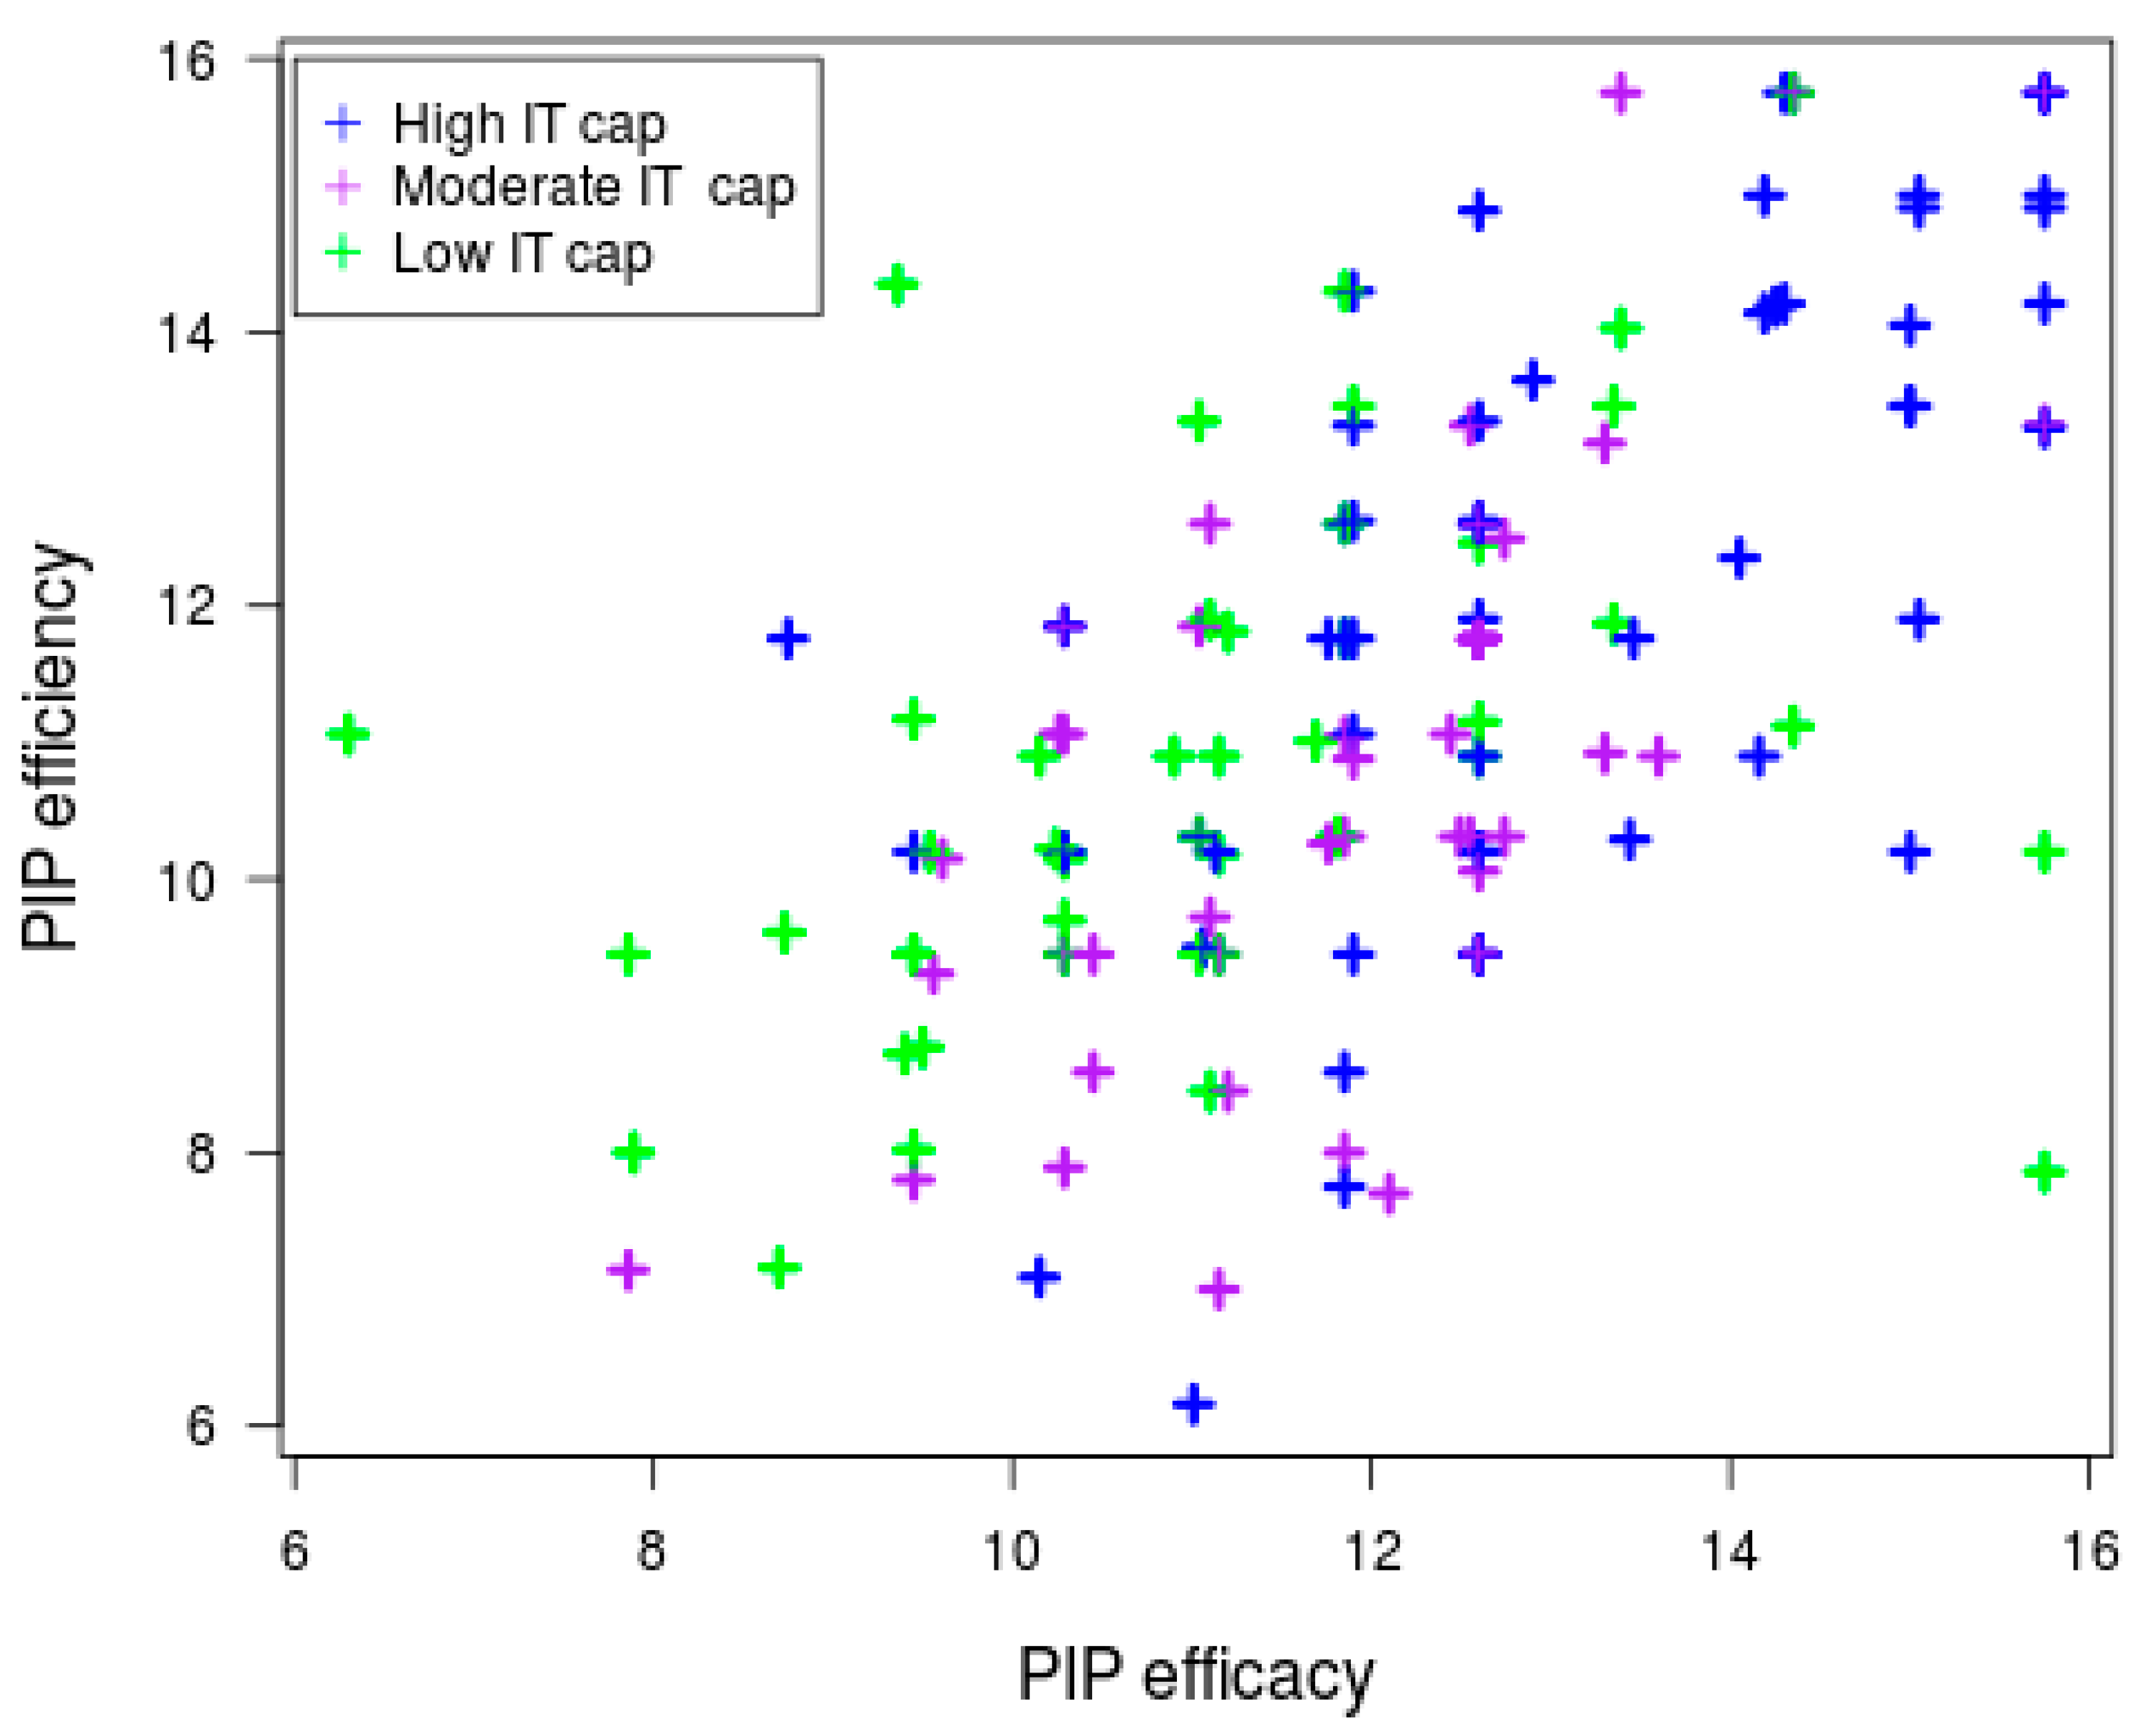
To graphically depict the impact of IT capabilities on PIP we must first take the factor loadings from the factor analysis results for the variables of PIP efficacy and PIP efficiency from Appendix A. For theoretical purposes, principal component analysis of these variables was performed. The factor score referring to a new variable, PIP efficacy, is a linear combination of the 3 measurements weighted by the factor loadings. Likewise, we did the same for the PIP efficiency variable. These resultant factor scores were plotted according to our cluster grouping in Figure 4, with the horizontal axis representing PIP efficacy and the vertical axis showing PIP efficiency. All groups maintain a linear pattern according to their cluster grouping, suggesting that higher IT capabilities are positively related to PIP efficacy and PIP efficiency. G1 (High IT capabilities—score 1 with an estimated mean of 12.98 ± 1.77 and score 2—mean 12.11 ± 2.27) shown below in dark blue, display higher scores in PIP efficacy and PIP efficiency than G2 (moderate IT capabilities—score 1—mean 12.10 ± 1.35 and score 2—mean 11.05 ± 1.83) which in turn shows higher scores than G3 (low IT capabilities—score 1—mean 10.99 ± 1.96 and score 2—mean 10.75 ± 1.88). As hypothesized, high IT capability firms tend to perform better in PIP efficacy and PIP efficiency according to the visualization.
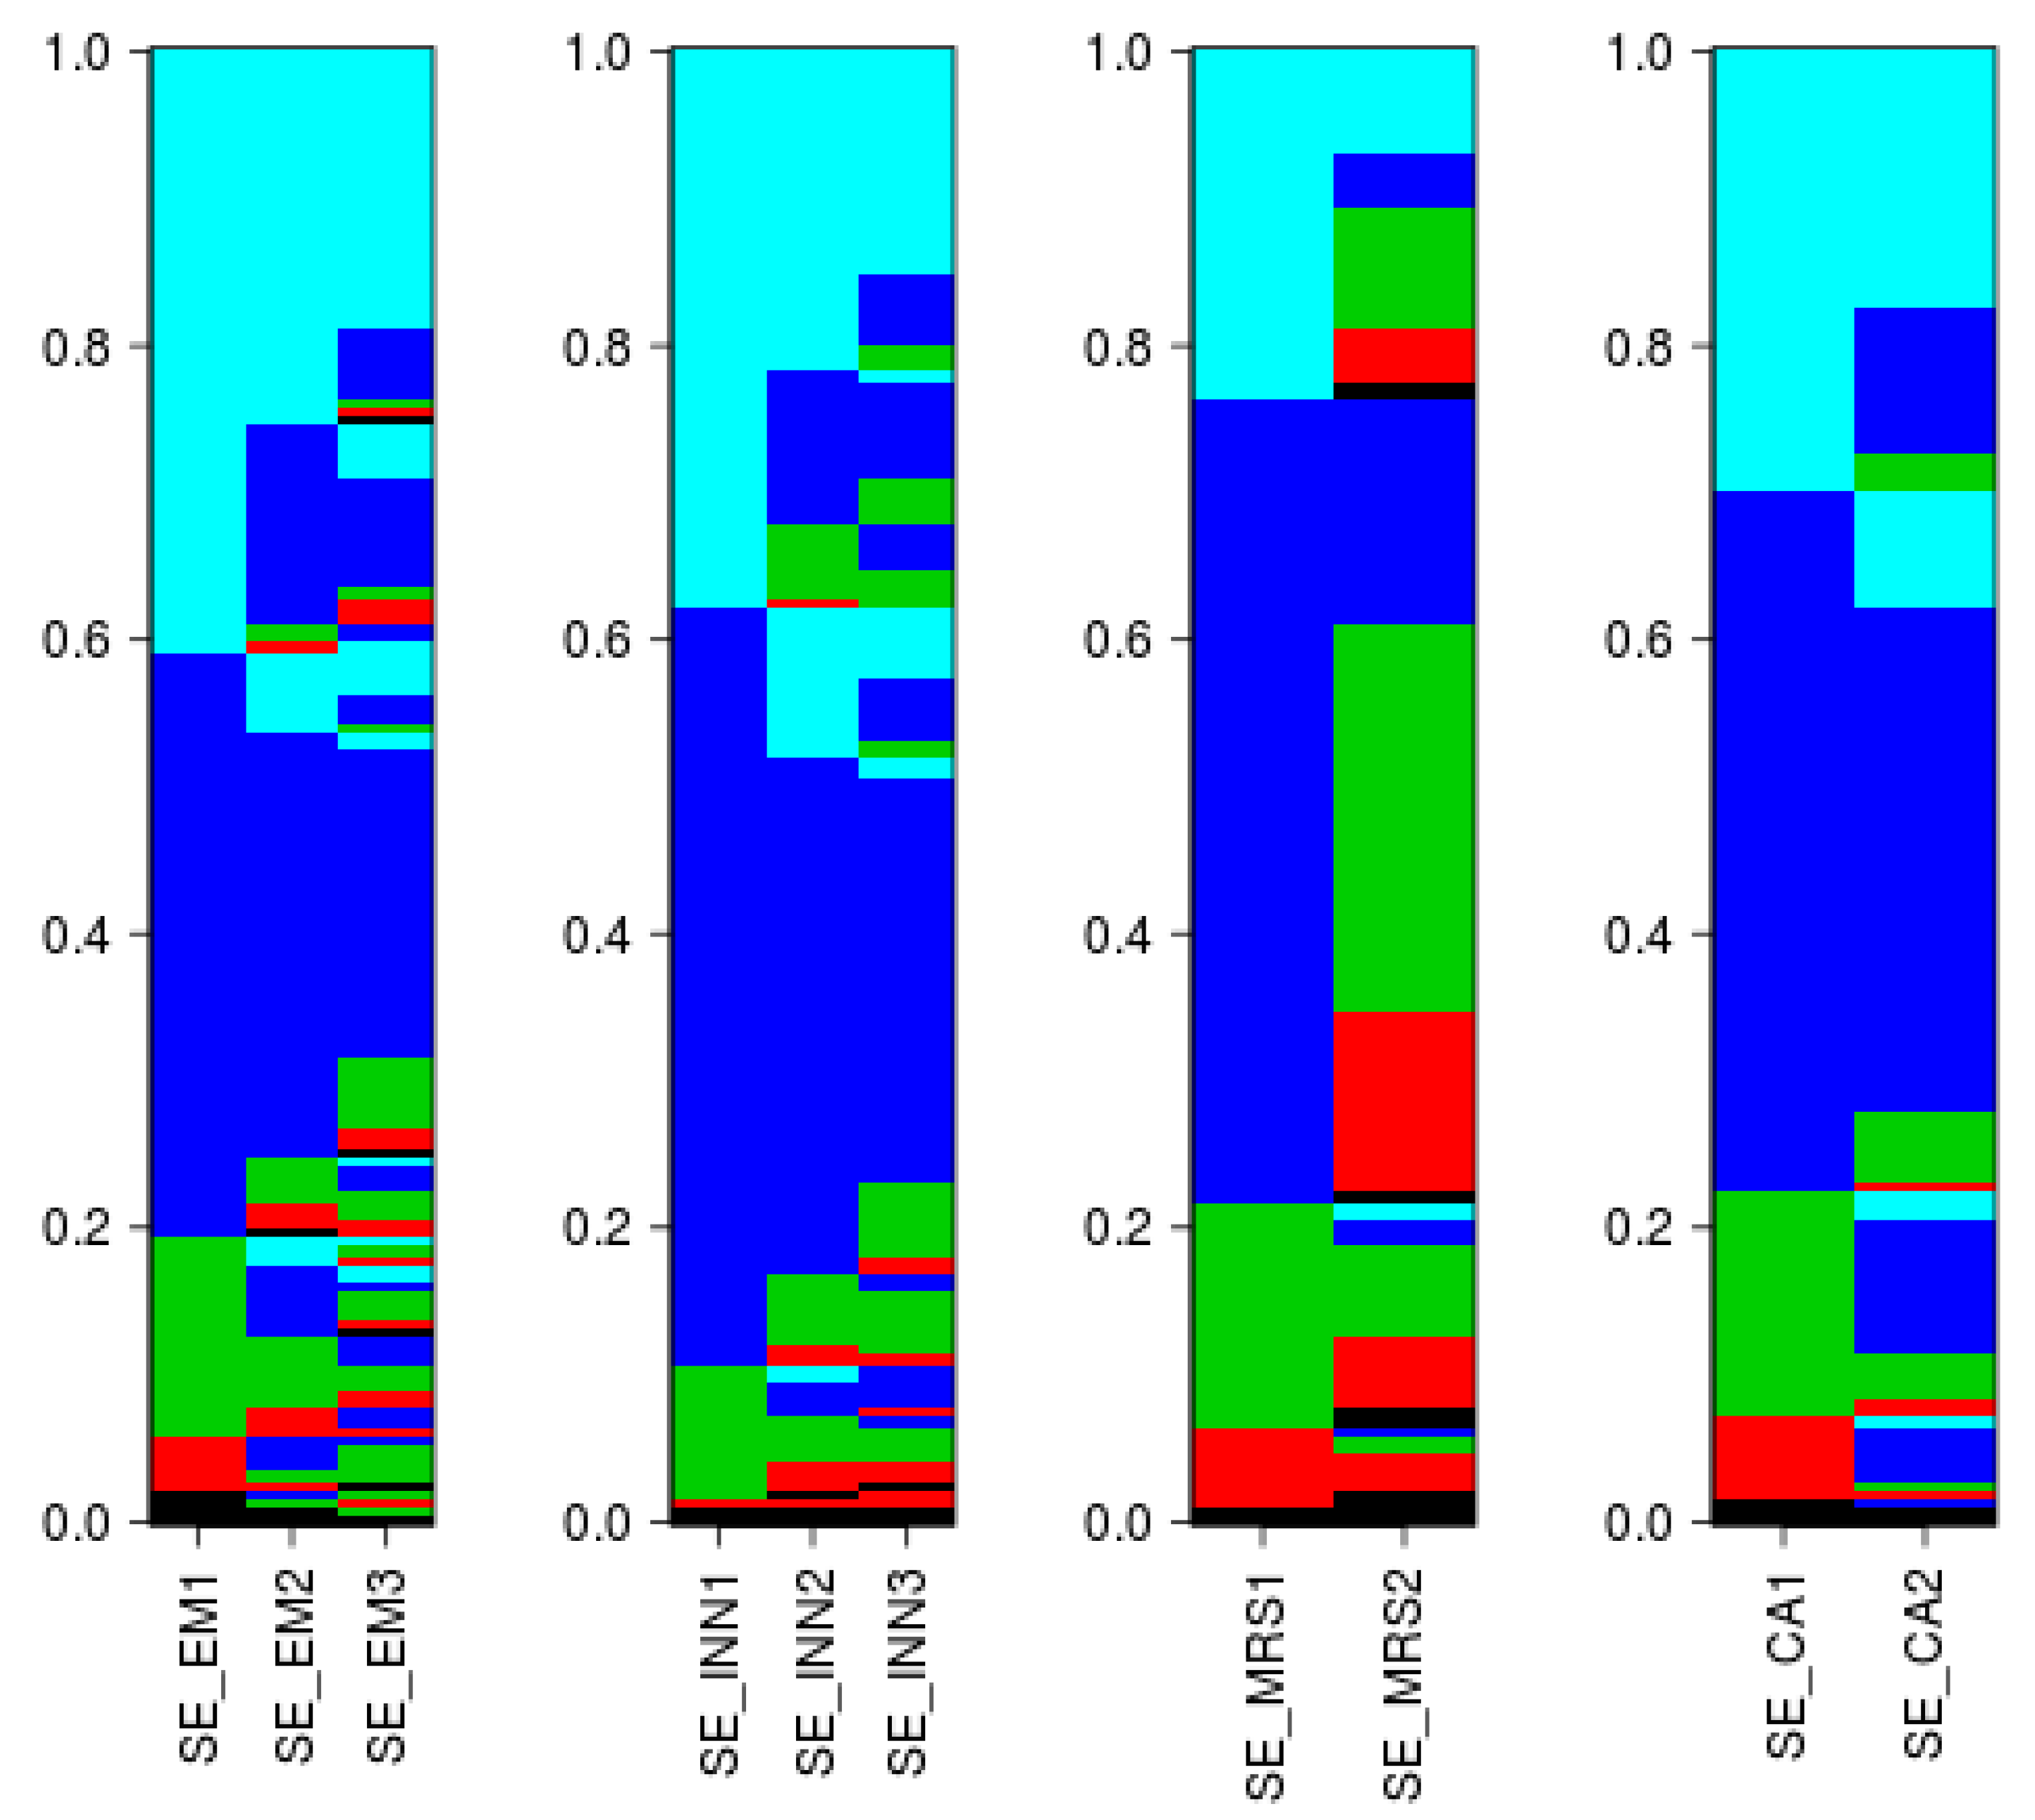
Turning to the SE construct, we again employ R to create a second heat map. This time, the data responses related to the four separate dimensions of the SE construct are depicted in Figure 5. Moving from left to right, items SE_EM1-3 represent the 3 items of entrepreneurial mindset, while SE_INN1-3 represent the 3 items of innovation. Taken together, these two dimensions represent the opportunity-seeking aspect of SE. The level of ‘strong agreement’ and ‘agreement’ of TMT respondents across the different items measured in our survey ranges from 65 to 90%. Thus, we are confident of the presence of significant opportunity-seeking behavior of SME firms in our research sample. SE_MRS1-2 portrays the items of managing resources strategically and SE_CA1-2 highlights the competitive advantage responses. Taken together, these two dimensions represent the advantage-seeking side of the SE construct. With the exception of one item in the figure, responses range from 65 to 85%. Overall, we draw great confidence from the visualization that the SE construct is heavily subscribed. The existence of SE and the strong level of agreement with questionnaire items (depicted in light blue and dark blue in Figure 5) offer convincing evidence of the importance of SE in our research context. In addition, from this particular data visualization it would appear that the SME ICT firms in our research tend to place more emphasis on the opportunity-seeking side of SE rather than the advantage-seeking side.
To confirm the effect of SE on PIP we also performed regression analysis in R (Table 5). Univariate analysis confirmed that all variables of SE are significant and therefore have an impact on PIP. In the multivariate analysis, competitive advantage was deemed significant (p-value = 0.001 ***) for factor 1, and for factor 2, significant values were returned for entrepreneurial mindset (p-value = 0.016 *) and marginally significant values for competitive advantage (p-value = 0.063). Thus, in the multivariate analysis these dimensions had a greater impact on the dependent variable PIP.
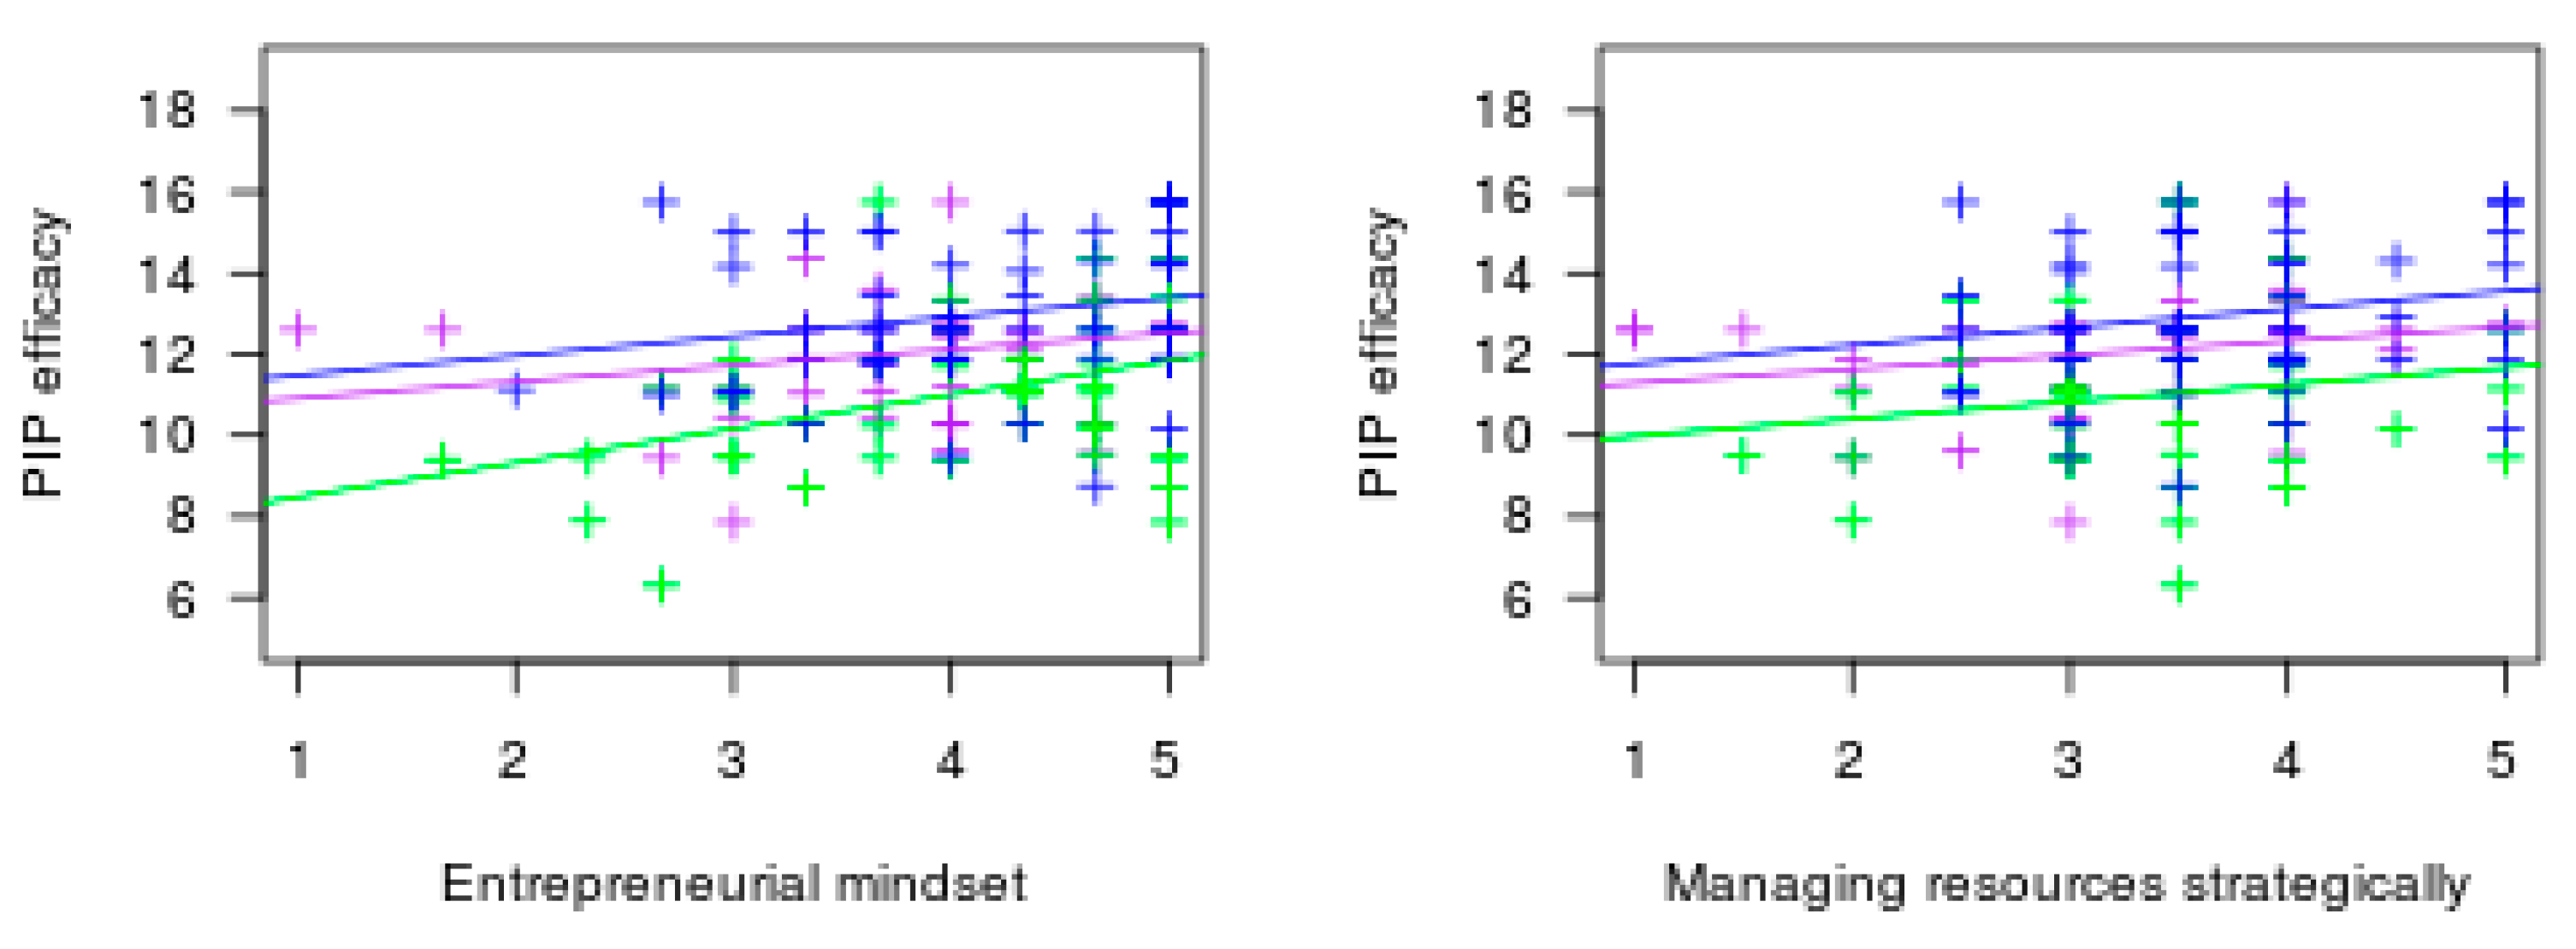
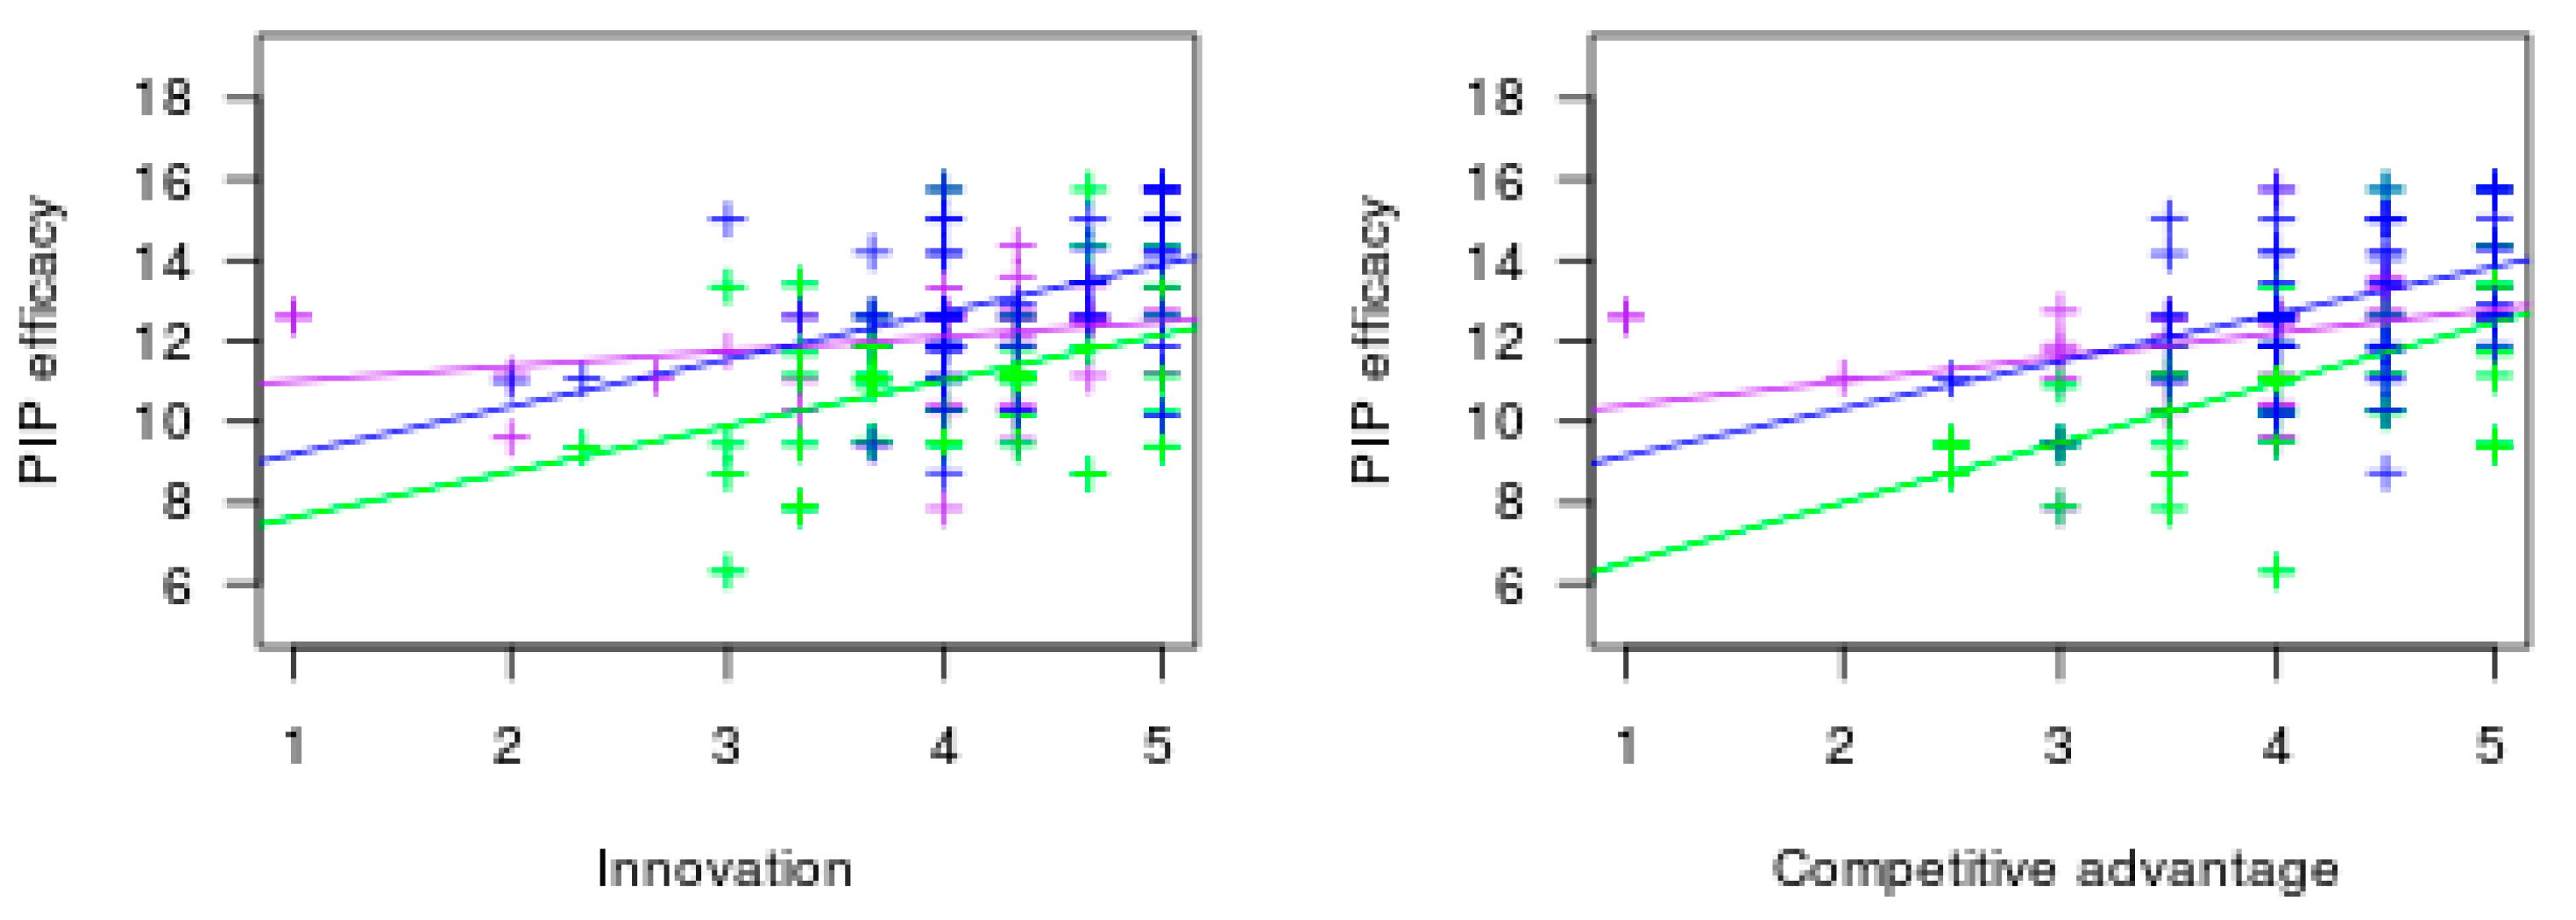
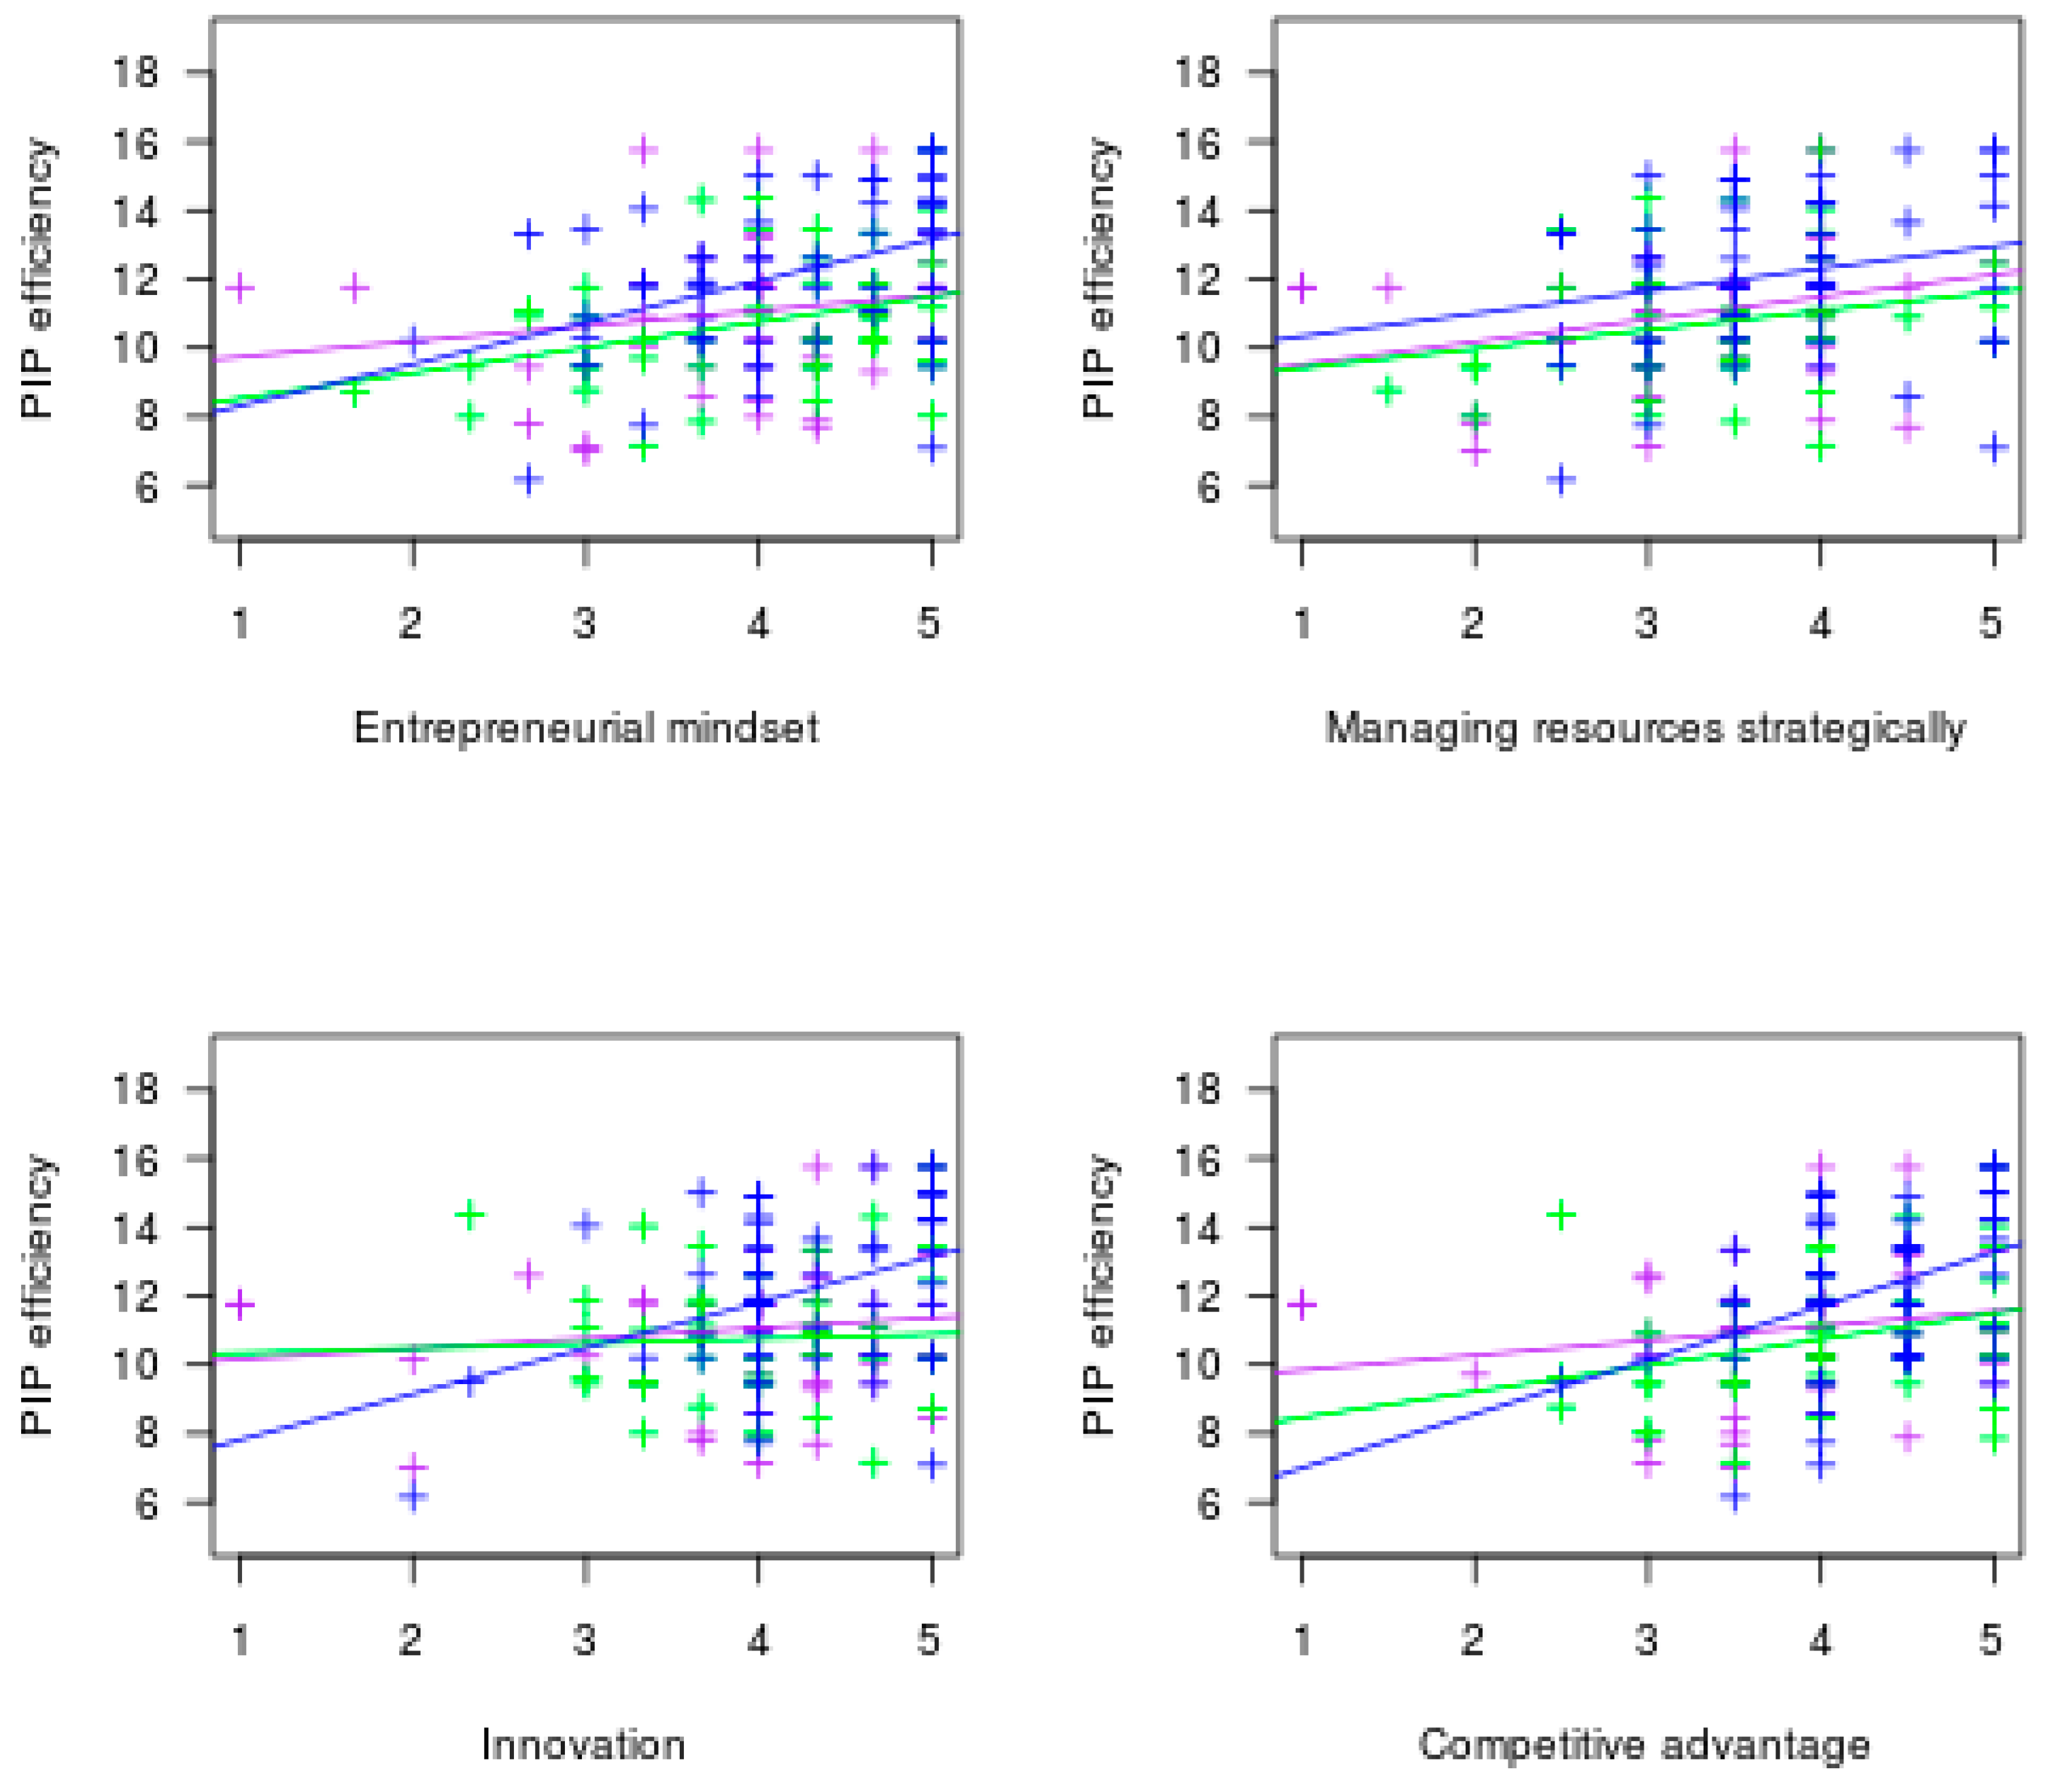
Finally, we plotted PIP efficacy (Appendix E) and PIP efficiency (Appendix F) against the 4 separate dimensions of SE according to our 3 cluster groups defined earlier. Here, G1 (dark blue) represents high IT capabilities, G2 (purple) represents moderate IT capabilities and G3 (green) represents low IT capabilities. In all scatter plots for both efficacy and efficiency, the high IT cap cluster group outperformed the moderate and low IT cap groups. PIP increased as these firms displayed higher levels on the individual SE dimensions. Moreover, in all scatter plots representing the 4 dimensions of SE, high IT capability firms display the highest values followed by moderate IT caps and then low IT caps. Alternatively stated, firms displaying higher values on the individual SE dimensions display higher PIP efficacy and PIP efficiency values. Therefore, we find graphical evidence of our stated propositions to compliment the statistical support provided via PLS structural equation modeling.
6. Conclusions
6.1. Implications for Research
This research set out to explore the driving impact of IT capabilities on SE and PIP as well as to look at the role that SE plays in impacting PIP. Chen et al. [5] rightly point out that firms and their leaders recognize the importance IT plays in improving organizational level innovation, despite the fact that little is known about the relationship. The results of this study hopefully add to the ITBV literature by demonstrating the existence of the link between IT capabilities and SE, as well as the link between IT capabilities and PIP (Figure 4 and Appendix E). This study, in finding evidence of the above links, adds support to the notion of IT-enabled innovation.
Additionally, we hope to add to the SE literature by demonstrating SE’s presence and importance in the context of the 164 SME ICT firms in this study. Within the SE literature [91] note that capabilities that are made up of a firms’ resources are essential to entrepreneurial behavior and firm level results. Researchers including [7,54,92] state that wealth creation via SE requires certain select resources and capabilities, but according to [43] it is the proper management (balance) of firm-level resources that helps organizations overcome their environmental uncertainty. Regarding this issue of balance, firms risk investing too many resources and thereby over-exploring or over-exploiting. However, as advised by [47], the ratio of resource allocation is unlikely to be a 50/50 split and depends on the rate of environmental change, the nature of the firms’ competitive landscape and the nature of the firms’ internal resource profile.
In carrying out this research, we also attempted to fill several gaps in the literature. Firstly, unlike [5], who explore the role of corporate entrepreneurship as the catalyst between IT capabilities and PIP, this research agrees with [93] regarding the central role innovation plays in the identification and exploitation of opportunities in entrepreneurial studies as primarily occurring in smaller firms. In many countries, it is generally the case that SMEs account for the majority of total firm numbers. In the US and the European Union for example, SMEs account for approximately 99% of companies and almost 50% of total employment figures—and these figures seem to be rising. In such developed economies, SMEs are now deemed critical to economic growth, innovation, entrepreneurship and jobs. Thus, we focus on SMEs in an ICT context and explore the central role SE plays. We therefore hope to provide additional insight into the relationship between IT capabilities and product innovation in a SE context. Furthermore, SE research to date has mostly been conceptual in nature, meaning that this study represents one of the few attempts at empirically capturing the phenomena.
Secondly, according to [56] research in innovation has tended towards manufacturing innovation in a tangible product sense. In this research we adopt an expanded definition of the phenomena of interest, namely one that underscores the importance of new services, devices, technology processes, organizational structures, administrative systems, plans, policies and programs [21,22,23]. Also, despite the importance of innovation, it is difficult to conceptualize and measure according to [19], and traditional financial measurement instruments have failed in capturing its many dimensions. We therefore agree with [24] and separate PIP from general measures of firm performance in an attempt to capture the appropriate measurement of interest. In this case, we focus on the intermediate variable, innovation performance, as the dependent variable.
Brynjolfsson [26] highlights that ITBV scholars labored through the period of productivity paradox and were eventually successful in linking IT to firm success after operationalizing IT capabilities from the RBV and dynamic capabilities. Yet despite evidence of the existence of the IT-firm performance link, research results have been mixed. In a general sense, IT and effective IT usage is expected to positively impact firms in a number of different ways. For example, Melville, N. et al. [1] note that ITBV scholars have provided evidence of wide-ranging benefits and highlight a list including flexibility and quality improvement, reduced costs, and improved productivity. However, while numerous researchers have commented on the importance of this particular area of investigation, our knowledge of how, why, or what is actually happening in terms of IT’s impact on firm value remains unclear [1,6,31,36,62,94]. From the resource-based perspective of [57] (p. 18), “a paucity of research exists dealing with how IT can be a source of competitive advantage”. In our view, and as discussed by [95], the relevant catalyst to investigate this link falls to the emerging field of SE, which seeks to explore firm wealth and value creation, as well as sustainable performance, in dynamic and increasingly competitive business environments. Regarding the phenomena of interest or dependent variable in IT research, Jacks, T. et al. [49] note that IT affects firms in the form of profits, productivity or intangibility, but call for more research on the elusive dependent variable. Given the paucity of research into the relationship between IT and competitive advantage, this research endeavored to look specifically at the impact of IT capabilities on PIP, as according to [30], successful firms are those that quickly respond by allocating and reallocating capabilities via product innovation. In sum, this study finds support for the IT–firm performance link and highlights the role played by SE.
6.2. Implications for Practice
Our findings indicate that IT capabilities directly impact PIP as well as SE. This would suggest that SME managers interested in improving innovation performance and enhancing firm-level entrepreneurship should attend to nurturing and developing these capabilities in order to unlock their combined potential. In addition, SE plays a role in partially mediating the relationship between IT capabilities and PIP, indicating to firms the importance of simultaneously pursuing an optimal amount of both opportunity-seeking and advantage-seeking behaviors. In today’s rapidly changing competitive landscape, firms who attempt and achieve the right balance between exploring new competencies (opportunity-seeking) and exploiting existing ones (advantage-seeking) are better positioned to improve performance [71,96,97,98]. Practiced correctly, SE allows firms to predict and react effectively to the many environmental changes that may befall them and is regarded by [47] as a critical result of firms’ exploitation of its innovations. Due to the many types of environmental change occurring nowadays, uncertainty awareness is strengthened when firms choose to practice SE [43]. Kuratko and Audretsch [99] go even further to suggest that firms might even seek out and thrive on such predicaments. As such, the presence of environmental change and uncertainty is regarded as a key indicator of the need for SE as well as a potential opportunity source for firms willing to embrace it. However, as [100] acknowledged, the answer to the question of optimal balance remains unclear. In our current study of ICT SMEs, the majority of firms (74%) have been able to sustain their business operations for over a decade. In doing so, they report being adept at both opportunity- and advantage-seeking behaviors while placing slightly more emphasis on the opportunity-seeking dimension.
6.3. Limitations and Future Research
This study has several limitations which offer scope for further investigation. Specifically, at 164 respondents, sample size is adequate but small. Although this meets the 10X-minimum criteria rule suggested in performing PLS-SEM testing, we hope that the sample size of future studies can be expanded. Future researchers should strive for increased sample sizes to allow for sample splitting. In this way, validity could be further assured by using one subsample for model estimation and one subsample for prediction. Also, respondents to our survey were limited to one per firm—albeit key informant TMT firm members. Future researchers should design studies that collect multiple responses from individual firms as a means of ensuring reliability, particularly with regard to questions related to performance measurement. Collecting multiple responses for each firm and ensuring inter-rater reliability would help strengthen internal validity. Finally, this research selected ICT sector firms as a way of overcoming the single industry focus limitation highlighted by previous researchers. Although the ICT industry as defined previously spans multiple business types and categories, they still share a common focus on equipment, applications and services related to communications. We suggest that future researchers attempt to replicate the result across other locations, other industries or multi-industry contexts, non-SMEs and non-service orientated firms. The generalizability of our findings can be greatly extended if similar results are returned.
Acknowledgments
We would like to sincerely thank the anonymous reviewers for their constructive feedback that helped to improve the manuscript significantly.
Author Contributions
Maurice Lyver and Ta-Jung Lu designed and performed the study. All authors have read and approved the final manuscript.
Conflicts of Interest
The authors declare no conflict of interest.
Appendix A

Table A1.
Factor loadings.
| Construct Indicators | Factor Loading | Reference | |
|---|---|---|---|
| IT infrastructure flexibility (IT_FLEX) (AVE = 0.74; CR = 0.85) | |||
| IT_FLEX1 | I find it easy to get the IS to do what I want to do. | 0.85 | [5,41] |
| IT_FLEX2 | Our information systems are adopted to share information. | 0.87 | |
| IT integration (IT_INT) (AVE = 0.88; CR = 0.94) | |||
| IT_INT1 | Our IS allows data integration. | 0.94 | [5,101,102] |
| IT_INT2 | Our IS allows integration with other IT systems. | 0.89 | |
| IT business alignment (IT_BUA) (AVE = 0.76; CR = 0.90) | |||
| IT_BUA1 | Our information system (IS) plans reflect the business plan goals. | 0.89 | [5,103] |
| IT_BUA2 | Our information system (IS) plans support the business strategies. | 0.91 | |
| IT_BUA3 | Business plans have reasonable expectations of information systems (IS). | 0.81 | |
| IT management (IT_MGT) (AVE = 0.78; CR = 0.91) | |||
| IT_MGT1 | Effectiveness of IT planning in our firm is better than our competitors in the industry. | 0.91 | [5,104] |
| IT_MGT2 | IT project management practices in our firm are better than our competitors in the industry. | 0.90 | |
| IT_MGT3 | Planning for IT security control in our firm is better than our competitors in the industry. | 0.84 | |
| Entrepreneurial mindset (SE_EM) (AVE = 0.67; CR = 0.86) | |||
| SE_EM1 | Our firm has many more promising ideas than we have the time and resources to pursue. | 0.82 | [45] |
| SE_EM2 | Our firm's ability to perceive changes in society at large often gives us ideas for new products/services. | 0.84 | |
| SE_EM3 | Our firm never experiences a lack of ideas that we can convert into profitable products/services. | 0.80 | |
| Innovation (SE_INN) (AVE = 0.73; CR = 0.89) | |||
| SE_INN1 | We constantly seek to enhance current products/services with continuous improvements. | 0.80 | [45] |
| SE_INN2 | We constantly seek out business opportunities to exploit. | 0.88 | |
| SE_INN3 | We constantly seek to generate new products/services. | 0.88 | |
| Competitive advantage (SE_CA) (AVE = 0.73; CR = 0.84) | |||
| SE_CA1 | All our products/services must contribute value or will be culled. | 0.84 | [45] |
| SE_CA2 | We constantly seek ways to reinforce competitive advantage. | 0.87 | |
| Managing resources strategically (SE_MRS) (AVE = 0.69; CR = 0.82) | |||
| SE_MRS1 | As our firm defines its strategies, our major concern is how to best utilize the resources we control. | 0.80 | [45] |
| SE_MRS2 | Since our objective is to use our resources, we will usually invest heavily and rapidly. | 0.86 | |
| Product innovation efficacy (PIP_CACY) (AVE = 0.62; CR = 0.87) | |||
| PIP_CACY1 | We are better able to replace products/services being phased out than our competitors in the industry. | 0.75 | [25] |
| PIP_CACY2 | We are better able to extend our existing product/service range using NEW TECHNOLOGIES. | 0.84 | |
| PIP_CACY3 | We are better able to extend our existing product/service range using IMPROVED TECHNOLOGIES. | 0.86 | [25] |
| PIP_CACY4 | We are better at extending our product/service range outside our main product/service field than our competitors in the industry. | 0.70 | |
| Product innovation efficiency (PIP_CIENCY) (AVE = 0.62; CR = 0.87) | |||
| PIP_CIENCY1 | Our firm has better average innovation project development time (an innovation project refers to the creation of a new product, a new component or a new service) than our competitors in the industry. | 0.82 | [25] |
| PIP_CIENCY2 | Our firm has a shorter average number of innovation project working hours than our competitors in the industry. | 0.79 | |
| PIP_CIENCY3 | Our firm has a lower average cost per innovation project than our competitors in the industry. | 0.74 | |
| PIP_CIENCY4 | Our firm has a higher global degree of satisfaction with innovation project efficiency than our competitors in the industry. | 0.80 | |
Appendix B
Table A2.
Definition table.
| Construct | Definition | Reference |
|---|---|---|
| IT capabilities | an organizations ability to assemble and arrange tangible, intangible and human IT-based resources in combination or with other resources and capabilities for the purposes of creating competitive advantage | [27,28,31] |
| IT infrastructure flexibility | the degree to which firms IT infrastructure is scalable, compatible and modular and can facilitate numerous business applications | [5,41,58] |
| IT integration | the capability of a firm to allow rapid intra- and inter-organizational data, information and communication exchange for collaborative benefit | [5,36,59,60] |
| IT business alignment | ‘IT-business and business-IT related managerial behaviors that can enable and promote the coordination and ‘harmonization’ of activities across the business and the IT domain in ways that add business value’ | [5,61,105] |
| IT management | the ability of the firm to create business value via its skill and competence in managing the IT resources in its possession | [37] |
| Strategic entrepreneurship | the value creating intersection between strategy and entrepreneurship entailing the balance of exploration and exploitation activities, balancing resources and capabilities and anticipating and responding to environmental change | [47] |
| Entrepreneurial mindset | a focused attention on growing an organization via identifying and developing new opportunities stemming from flexibility, creativity, continuous innovation and renewal | [44] |
| strategic management of resources | The simultaneous integration of firm resources between opportunity- and advantage-seeking activities for the purpose of wealth creation | [44] |
| Developing innovation | The notion of how creativity is a necessary ingredient with the potential to affect both the amount and type of firm level radical or sustaining innovation | [44] |
| Creating competitive advantage | the extent to which an organization is able to create a defendable position over competitors by deploying current advantages in conjunction with new bundles when pursuing opportunities | [44,45] |
| Product innovation performance | ||
| product innovation efficiency | the degree of success of an innovation | [25] |
| product innovation efficacy | the effort undertaken to obtain that degree of success |
Appendix C
Table A3.
Common method bias analysis.
| Variables | Indicator | Substantive Factor Loading (R1) | R12 | Method Factor Loading (R2) | R22 |
|---|---|---|---|---|---|
| IT infrastructure flexibility | IT_FLEX1 | 0.85 *** | 0.72 | 0.01 | 0.000 |
| IT_FLEX2 | 0.86 *** | 0.74 | −0.01 | 0.000 | |
| IT integration | IT_INT1 | 0.94 *** | 0.88 | −0.006 | 0.000 |
| IT_INT1 | 0.93 *** | 0.86 | 0.006 | 0.000 | |
| IT management | IT_MGT1 | 0.91 *** | 0.83 | −0.014 | 0.000 |
| IT_MGT2 | 0.86 *** | 0.74 | 0.098 * | 0.010 | |
| IT_MGT3 | 0.84 *** | 0.71 | −0.088 | 0.008 | |
| IT business alignment | IT_BUA1 | 0.92 *** | 0.85 | −0.076 ** | 0.006 |
| IT_BUA2 | 0.89 *** | 0.79 | 0.017 | 0.000 | |
| IT_BUA3 | 0.75 *** | 0.56 | 0.07 | 0.005 | |
| Entrepreneurial mindset | SE_EM1 | 0.83 *** | 0.69 | −0.16 * | 0.026 |
| SE_EM2 | 0.78 *** | 0.61 | 0.083 | 0.007 | |
| SE_EM3 | 0.75 *** | 0.56 | 0.065 | 0.004 | |
| Innovation | SE_INN1 | 0.75 *** | 0.56 | −0.024 | 0.001 |
| SE_INN2 | 0.83 *** | 0.69 | 0.002 | 0.000 | |
| SE_INN3 | 0.82 *** | 0.67 | 0.02 | 0.000 | |
| Competitive advantage | SE_CA1 | 0.85 *** | 0.72 | −0.029 | 0.001 |
| SE_CA2 | 0.85 *** | 0.72 | 0.028 | 0.001 | |
| Managing resources strategically | SE_MRS1 | 0.79 *** | 0.62 | −0.021 | 0.000 |
| SE_MRS2 | 0.81 *** | 0.66 | 0.020 | 0.000 | |
| Product innovation efficacy | PIP_CACY1 | 0.71 *** | 0.50 | 0.066 | 0.004 |
| PIP_CACY2 | 0.85 *** | 0.72 | −0.041 | 0.002 | |
| PIP_CACY3 | 0.87 *** | 0.76 | −0.005 | 0.000 | |
| PIP_CACY4 | 0.67 *** | 0.45 | −0.017 | 0.000 | |
| Product innovation efficiency | PIP_CIENCY1 | 0.77 *** | 0.59 | 0.017 | 0.000 |
| PIP_CIENCY2 | 0.79 *** | 0.62 | −0.013 | 0.000 | |
| PIP_CIENCY3 | 0.74 *** | 0.55 | −0.003 | 0.000 | |
| PIP_CIENCY4 | 0.77 *** | 0.59 | −0.002 | 0.000 | |
| Average | 0.82 | 0.68 | −0.00025 | 0.003 |
*** p < 0.001; ** p < 0.01; * p < 0.05.
Appendix D
Table A4.
Cross-loadings.
| Items | SE_EM | SE_MRS | SE_INN | SE_CA | IT_FLEX | IT_INT | IT_BUA | IT_MGT | PIP_CACY | PIP_CIENCY |
|---|---|---|---|---|---|---|---|---|---|---|
| SE_EM1 | 0.745 | 0.190 | 0.282 | 0.265 | 0.006 | 0.040 | 0.044 | 0.165 | 0.259 | 0.284 |
| SE_EM2 | 0.839 | 0.364 | 0.401 | 0.302 | 0.115 | 0.108 | 0.106 | 0.190 | 0.280 | 0.269 |
| SE_EM3 | 0.766 | 0.254 | 0.210 | 0.318 | 0.215 | 0.151 | 0.251 | 0.221 | 0.228 | 0.297 |
| SE_MRS1 | 0.299 | 0.749 | 0.230 | 0.258 | 0.224 | 0.329 | 0.229 | 0.172 | 0.185 | 0.263 |
| SE_MRS2 | 0.267 | 0.842 | 0.378 | 0.372 | 0.294 | 0.188 | 0.298 | 0.266 | 0.221 | 0.238 |
| SE_INN1 | 0.311 | 0.348 | 0.753 | 0.427 | 0.339 | 0.243 | 0.216 | 0.308 | 0.312 | 0.312 |
| SE_INN2 | 0.298 | 0.349 | 0.828 | 0.463 | 0.269 | 0.277 | 0.335 | 0.208 | 0.355 | 0.184 |
| SE_INN3 | 0.322 | 0.237 | 0.819 | 0.420 | 0.189 | 0.129 | 0.267 | 0.247 | 0.340 | 0.124 |
| SE_CA1 | 0.300 | 0.316 | 0.370 | 0.821 | 0.112 | 0.089 | 0.252 | 0.194 | 0.369 | 0.209 |
| SE_CA2 | 0.336 | 0.364 | 0.547 | 0.879 | 0.230 | 0.171 | 0.387 | 0.312 | 0.440 | 0.271 |
| IT_FLEX1 | 0.201 | 0.296 | 0.291 | 0.162 | 0.843 | 0.445 | 0.428 | 0.404 | 0.255 | 0.257 |
| IT_FLEX2 | 0.047 | 0.263 | 0.275 | 0.189 | 0.859 | 0.564 | 0.485 | 0.327 | 0.314 | 0.228 |
| IT_INT1 | 0.111 | 0.302 | 0.294 | 0.184 | 0.530 | 0.934 | 0.635 | 0.427 | 0.353 | 0.250 |
| IT_INT2 | 0.127 | 0.285 | 0.215 | 0.109 | 0.583 | 0.936 | 0.586 | 0.467 | 0.372 | 0.339 |
| IT_BUA1 | 0.186 | 0.332 | 0.356 | 0.298 | 0.494 | 0.604 | 0.897 | 0.464 | 0.308 | 0.270 |
| IT_BUA2 | 0.212 | 0.318 | 0.275 | 0.303 | 0.471 | 0.629 | 0.900 | 0.435 | 0.439 | 0.295 |
| IT_BUA3 | 0.011 | 0.194 | 0.241 | 0.396 | 0.414 | 0.425 | 0.765 | 0.371 | 0.396 | 0.229 |
| IT_MGT1 | 0.177 | 0.231 | 0.255 | 0.245 | 0.373 | 0.433 | 0.489 | 0.909 | 0.373 | 0.397 |
| IT_MGT2 | 0.279 | 0.258 | 0.343 | 0.285 | 0.374 | 0.348 | 0.375 | 0.873 | 0.481 | 0.398 |
| IT_MGT3 | 0.187 | 0.244 | 0.234 | 0.265 | 0.374 | 0.464 | 0.427 | 0.830 | 0.485 | 0.359 |
| PIP_CACY1 | 0.260 | 0.097 | 0.325 | 0.413 | 0.238 | 0.217 | 0.319 | 0.345 | 0.744 | 0.472 |
| PIP_CACY2 | 0.185 | 0.279 | 0.359 | 0.433 | 0.272 | 0.342 | 0.365 | 0.430 | 0.826 | 0.457 |
| PIP_CACY3 | 0.286 | 0.233 | 0.325 | 0.372 | 0.352 | 0.459 | 0.451 | 0.439 | 0.870 | 0.514 |
| PIP_CACY4 | 0.303 | 0.177 | 0.299 | 0.254 | 0.154 | 0.138 | 0.205 | 0.370 | 0.652 | 0.327 |
| PIP_CIENCY | 0.312 | 0.290 | 0.188 | 0.189 | 0.231 | 0.141 | 0.188 | 0.321 | 0.384 | 0.773 |
| PIP_CIENCY | 0.241 | 0.266 | 0.208 | 0.153 | 0.373 | 0.329 | 0.285 | 0.408 | 0.416 | 0.777 |
| PIP_CIENCY | 0.280 | 0.161 | 0.172 | 0.221 | 0.133 | 0.287 | 0.215 | 0.264 | 0.395 | 0.739 |
| PIP_CIENCY | 0.272 | 0.238 | 0.220 | 0.300 | 0.143 | 0.215 | 0.262 | 0.358 | 0.558 | 0.785 |
Bold values indicate primary factor loadings.
Appendix E
Figure A1.
SE dimensions against PIP efficacy according to cluster group.


Appendix F
Figure A2.
SE dimensions against PIP efficiency according to cluster group.

References
- Melville, N.; Kraemer, K.; Gurbaxani, V. Review: Information technology and organizational performance: An integrative model of it business value. MIS Q. 2004, 28, 283–322. [Google Scholar] [CrossRef]
- Bhatt, G.; Grover, V. Types of information technology capabilities and their role in competitive advantage: An empirical study. J. Manag. Inf. Syst. 2005, 22, 253–277. [Google Scholar] [CrossRef]
- Stoel, M.D.; Muhanna, W.A. It capabilities and firm performance: A contingency analysis of the role of industry and it capability type. Inf. Manag. 2009, 46, 181–189. [Google Scholar] [CrossRef]
- Coltman, T.; Tallon, P.; Sharma, R.; Queiroz, M. Strategic it alignment: Twenty-five years on. J. Inf. Technol. 2015, 30, 91–100. [Google Scholar] [CrossRef]
- Chen, Y.; Wang, Y.; Nevo, S.; Benitez-Amado, J.; Kou, G. It capabilities and product innovation performance: The roles of corporate entrepreneurship and competitive intensity. Inf. Manag. 2015, 52, 643–657. [Google Scholar] [CrossRef]
- Nevo, S.; Wade, M.R. The formation and value of it-enabled resources: Antecedents and consequences of synergistic relationships. MIS Q. 2010, 34, 163–183. [Google Scholar] [CrossRef]
- Hitt, M.A.; Ireland, R.D.; Camp, S.M.; Sexton, D.L. Strategic entrepreneurship: Entrepreneurial strategies for wealth creation. Strateg. Manag. J. 2001, 22, 479–491. [Google Scholar] [CrossRef]
- Lyon, D.W.; Lumpkin, G.T.; Dess, G.G. Enhancing entrepreneurial orientation research: Operationalizing and measuring a key strategic decision making process. J. Manag. 2000, 26, 1055–1085. [Google Scholar] [CrossRef]
- Wheelwright, S.C.; Clark, K.B. Revolutionizing Product Development: Quantum Leaps in Speed, Efficiency, and Quality; Simon and Schuster: New York, NY, USA, 1992. [Google Scholar]
- Bueno, E.; Ordonez de Pablos, P.; Salmador Sanchez, M.P. Towards an integrative model of business, knowledge and organisational learning processes. Int. J. Technol. Manag. 2004, 27, 562–574. [Google Scholar] [CrossRef]
- Capon, N.; Farley, J.U.; Lehmann, D.R.; Hulbert, J.M. Profiles of product innovators among large us manufacturers. Manag. Sci. 1992, 38, 157–169. [Google Scholar] [CrossRef]
- Damanpour, F. Organizational innovation: A meta-analysis of effects of determinants and moderators. Acad. Manag. J. 1991, 34, 555–590. [Google Scholar] [CrossRef]
- Lemon, M.; Sahota, P.S. Organizational culture as a knowledge repository for increased innovative capacity. Technovation 2004, 24, 483–498. [Google Scholar] [CrossRef]
- Montalvo, C. What triggers change and innovation? Technovation 2006, 26, 312–323. [Google Scholar] [CrossRef]
- Schilling, M.A.; Hill, C.W.L. Managing the new product development process: Strategic imperatives. Acad. Manag. Executive 1998, 12, 67–81. [Google Scholar] [CrossRef]
- Schilling, M.A. Strategic Management of Technological Innovation, 3rd ed.; McGraw-Hill Education: New York, NY, USA, 2010. [Google Scholar]
- Hamel, G. Leading the Revolution; Harvard Business School Press: Boston, MA, USA, 2000; pp. 343–354. [Google Scholar]
- Varis, M.; Littunen, H. Types of innovation, sources of information and performance in entrepreneurial smes. Eur. J. Innov. Manag. 2010, 13, 128–154. [Google Scholar] [CrossRef]
- Fagerberg, J.; Mowery, D.C.; Nelson, R.R. The Oxford Handbook of Innovation; Oxford University Press: Oxford, UK, 2006. [Google Scholar]
- Drucker, P. Innovation and Entrepreneurship; Routledge: London, UK, 2014. [Google Scholar]
- Daft, R.L. A dual-core model of organizational innovation. Acad. Manag. J. 1978, 21, 193–210. [Google Scholar] [CrossRef]
- Damanpour, F.; Evan, W.M. Organizational innovation and performance: The problem of “organizational lag”. Adm. Sci. Q. 1984, 29, 392–409. [Google Scholar] [CrossRef]
- Damanpour, F. Organizational complexity and innovation: Developing and testing multiple contingency models. Manag. Sci. 1996, 42, 693–716. [Google Scholar] [CrossRef]
- Alegre, J.; Chiva, R. Assessing the impact of organizational learning capability on product innovation performance: An empirical test. Technovation 2008, 28, 315–326. [Google Scholar] [CrossRef]
- Alegre, J.; Lapiedra, R.; Chiva, R. A measurement scale for product innovation performance. Eur. J. Innov. Manag. 2006, 9, 333–346. [Google Scholar] [CrossRef]
- Brynjolfsson, E. The productivity paradox of information technology. Commun. ACM 1993, 36, 66–77. [Google Scholar] [CrossRef]
- Grant, R.M. The resource-based theory of competitive advantage: Implications for strategy formulation. Calif. Manag. Rev. 1991, 33, 114–135. [Google Scholar] [CrossRef]
- Barney, J. Firm resources and sustained competitive advantage. J. Manag. 1991, 17, 99. [Google Scholar] [CrossRef]
- Wernerfelt, B. A resource-based view of the firm. Strateg. Manag. J. 1984, 5, 171–180. [Google Scholar] [CrossRef]
- Teece, D.J.; Pisano, G.; Shuen, A. Dynamic capabilities and strategic management. Strateg. Manag. J. 1997, 18, 509–533. [Google Scholar] [CrossRef]
- Bharadwaj, A.S. A resource-based perspective on information technology capability and firm performance: An empirical investigation. MIS Q. 2000, 24, 169–196. [Google Scholar] [CrossRef]
- Santhanam, R.; Hartono, E. Issues in linking information technology capability to firm performance. MIS Q. 2003, 27, 125–153. [Google Scholar] [CrossRef]
- Tanriverdi, H. Performance effects of information technology synergies in multibusiness firms. MIS Q. 2006, 30, 57–77. [Google Scholar] [CrossRef]
- Tippins, M.J.; Sohi, R.S. It competency and firm performance: Is organizational learning a missing link? Strateg. Manag. J. 2003, 24, 745–761. [Google Scholar] [CrossRef]
- Ravichandran, T.; Lertwongsatien, C. Effect of information systems resources and capabilities on firm performance: A resource-based perspective. J. Manag. Inf. Syst. 2005, 21, 237–276. [Google Scholar] [CrossRef]
- Rai, A.; Patnayakuni, R.; Seth, N. Firm performance impacts of digitally enabled supply chain integration capabilities. MIS Q. 2006, 30, 225–246. [Google Scholar] [CrossRef]
- Kim, G.; Shin, B.; Kim, K.K.; Lee, H.G. It capabilities, process-oriented dynamic capabilities, and firm financial performance. J. Assoc. Inf. Syst. 2011, 12, 487. [Google Scholar] [CrossRef]
- Nakata, C.; Zhu, Z.; Kraimer, M.L. The complex contribution of information technology capability to business performance. J. Manag. Issues 2008, 20, 485–506. [Google Scholar]
- Pavlou, P.A.; El Sawy, O.A. The “third hand”: It-enabled competitive advantage in turbulence through improvisational capabilities. Inf. Syst. Res. 2010, 21, 443–471. [Google Scholar] [CrossRef]
- Chen, Y.; Wang, Y.; Nevo, S.; Jin, J.; Wang, L.; Chow, W.S. It capability and organizational performance: The roles of business process agility and environmental factors. Eur. J. Inf. Syst. 2014, 23, 326–342. [Google Scholar] [CrossRef]
- Bhatt, G.; Emdad, A.; Roberts, N.; Grover, V. Building and leveraging information in dynamic environments: The role of it infrastructure flexibility as enabler of organizational responsiveness and competitive advantage. Inf. Manag. 2010, 47, 341–349. [Google Scholar] [CrossRef]
- Hao, S.; Song, M. Technology-driven strategy and firm performance: Are strategic capabilities missing links? J. Bus. Res. 2016, 69, 751–759. [Google Scholar] [CrossRef]
- Ireland, D.R.; Webb, J.W. Crossing the great divide of strategic entrepreneurship: Transitioning between exploration and exploitation. Bus. Horiz. 2009, 52, 469–479. [Google Scholar] [CrossRef]
- Ireland, D.R.; Hitt, M.A.; Sirmon, D.G. A model of strategic entrepreneurship: The construct and its definition. J. Manag. 2003, 29, 963–989. [Google Scholar]
- Kyrgidou, L.P.; Petridou, E. The effect of competence exploration and competence exploitation on strategic entrepreneurship. Technol. Anal. Strateg. Manag. 2011, 23, 697–713. [Google Scholar] [CrossRef]
- Ketchen, D.J.; Ireland, R.D.; Snow, C.C. Strategic entrepreneurship, collaborative innovation, and wealth creation. Strateg. Entrep. J. 2007, 1, 371–385. [Google Scholar] [CrossRef]
- Ireland, D.R.; Webb, J.W. Strategic entrepreneurship: Creating competitive advantage through streams of innovation. Bus. Horiz. 2007, 50, 49–59. [Google Scholar] [CrossRef]
- Duncan, N.B. Capturing flexibility of information technology infrastructure: A study of resource characteristics and their measure. J. Manag. Inf. Syst. 1995, 12, 37–57. [Google Scholar] [CrossRef]
- Jacks, T.; Palvia, P.; Schilhavy, R.; Wang, L. A framework for the impact of it on organizational performance. Bus. Process Manag. J. 2011, 17, 846–870. [Google Scholar] [CrossRef]
- Barringer, B.R.; Bluedorn, A.C. The relationship between corporate entrepreneurship and strategic management. Strateg. Manag. J. 1999, 20, 421–444. [Google Scholar] [CrossRef]
- Zahra, S.A.; Covin, J.G. Contextual influences on the corporate entrepreneurship-performance relationship: A longitudinal analysis. J. Bus. Ventur. 1995, 10, 43–58. [Google Scholar] [CrossRef]
- Rauch, A.; Wiklund, J.; Lumpkin, G.T.; Frese, M. Entrepreneurial orientation and business performance: An assessment of past research and suggestions for the future. Entrep. Theory Pract. 2009, 33, 761–787. [Google Scholar] [CrossRef]
- Short, J.C.; Moss, T.W.; Lumpkin, G.T. Research in social entrepreneurship: Past contributions and future opportunities. Strateg. Entrep. J. 2009, 3, 161–194. [Google Scholar] [CrossRef]
- Hitt, M.A.; Ireland, R.D.; Sirmon, D.G.; Trahms, C.A. Strategic entrepreneurship: Creating value for individuals, organizations, and society. Acad. Manag. Perspect. 2011, 25, 57–75. [Google Scholar] [CrossRef]
- Lubatkin, M.H.; Simsek, Z.; Ling, Y.; Veiga, J.F. Ambidexterity and performance in small-to medium-sized firms: The pivotal role of top management team behavioral integration. J. Manag. 2006, 32, 646–672. [Google Scholar] [CrossRef]
- OECD. Guidelines for collecting and interpreting innovation data. In The Oslo Manual; OECD: Paris, France, 2005. [Google Scholar]
- Fink, L. How do it capabilities create strategic value? Toward greater integration of insights from reductionistic and holistic approaches. Eur. J. Inf. Syst. 2011, 20, 16–33. [Google Scholar] [CrossRef]
- Byrd, T.A.; Turner, D.E. An exploratory examination of the relationship between flexible it infrastructure and competitive advantage. Inf. Manag. 2001, 39, 41–52. [Google Scholar] [CrossRef]
- Rai, A.; Tang, X. Leveraging it capabilities and competitive process capabilities for the management of interorganizational relationship portfolios. Inf. Syst. Res. 2010, 21, 516–542. [Google Scholar] [CrossRef]
- Wang, Y.; Chen, Y.; Nevo, S.; Jin, J.F.; Tang, G.; Chow, W.S. It capabilities and innovation performance: The mediating role of market orientation. Commun. Assoc. Inf. Syst. 2013, 33, 9. [Google Scholar]
- Luftman, J.; Lyytinen, K.; Tal, B.Z. Enhancing the measurement of information technology (it) business alignment and its influence on company performance. J. Inf. Technol. 2017, 32, 26–46. [Google Scholar] [CrossRef]
- Aral, S.; Weill, P. It assets, organizational capabilities, and firm performance: How resource allocations and organizational differences explain performance variation. Organ. Sci. 2007, 18, 763–780. [Google Scholar] [CrossRef]
- Kyrgidou, L.P.; Hughes, M. Strategic entrepreneurship: Origins, core elements and research directions. Eur. Bus. Rev. 2010, 22, 43–63. [Google Scholar] [CrossRef]
- Ketchen, D.J. Change. Strateg. Entrep. J. 2007, 1, 291–293. [Google Scholar] [CrossRef]
- Agarwal, R.; Audretsch, D.; Sarkar, M. Knowledge spillovers and strategic entrepreneurship. Strateg. Entrep. J. 2010, 4, 271–283. [Google Scholar] [CrossRef]
- Chen, Y.; Tang, G.; Jin, J.; Xie, Q.; Li, J. Ceos’ transformational leadership and product innovation performance: The roles of corporate entrepreneurship and technology orientation. J. Product Innov. Manag. 2014, 31, 2–17. [Google Scholar] [CrossRef]
- Miller, D. The correlates of entrepreneurship in three types of firms. Manag. Sci. 1983, 29, 770–791. [Google Scholar] [CrossRef]
- Covin, J.G.; Slevin, D.P. Strategic management of small firms in hostile and benign environments. Strateg. Manag. J. 1989, 10, 75–87. [Google Scholar] [CrossRef]
- Lumpkin, G.T.; Dess, G.G. Clarifying the entrepreneurial orientation construct and linking it to performance. Acad. Manag. Rev. 1996, 21, 135–172. [Google Scholar]
- Wiklund, J.; Shepherd, D. Entrepreneurial orientation and small business performance: A configurational approach. J. Bus. Ventur. 2005, 20, 71–91. [Google Scholar] [CrossRef]
- March, J.G. Exploration and exploitation in organizational learning. Organ. Sci. 1991, 2, 71–87. [Google Scholar] [CrossRef]
- Yalcinkaya, G.; Calantone, R.J.; Griffith, D.A. An examination of exploration and exploitation capabilities: Implications for product innovation and market performance. J. Int. Market. 2007, 15, 63–93. [Google Scholar] [CrossRef]
- Calisir, F.; Altin Gumussoy, C.; Guzelsoy, E. Impacts of learning orientation on product innovation performance. Learn. Organ. 2013, 20, 176–194. [Google Scholar] [CrossRef]
- Lai, C.-S.; Chen, C.-S.; Chiu, C.-J.; Pai, D.-C. The impact of trust on the relationship between inter-organisational collaboration and product innovation performance. Technol. Anal. Strateg. Manag. 2011, 23, 65–74. [Google Scholar] [CrossRef]
- Laursen, K.; Salter, A. Open for innovation: The role of openness in explaining innovation performance among uk manufacturing firms. Strateg. Manag. J. 2006, 27, 131–150. [Google Scholar] [CrossRef]
- Kim, D.-Y.; Kumar, V.; Kumar, U. Relationship between quality management practices and innovation. J. Oper. Manag. 2012, 30, 295–315. [Google Scholar] [CrossRef]
- Armstrong, J.S.; Overton, T.S. Estimating nonresponse bias in mail surveys. J. Market. Res. 1977, 14, 396–402. [Google Scholar] [CrossRef]
- Liang, H.; Saraf, N.; Hu, Q.; Xue, Y. Assimilation of enterprise systems: The effect of institutional pressures and the mediating role of top management. MIS Q. 2007, 31, 59–87. [Google Scholar] [CrossRef]
- Podsakoff, P.M.; MacKenzie, S.B.; Lee, J.-Y.; Podsakoff, N.P. Common method biases in behavioral research: A critical review of the literature and recommended remedies. J. Appl. Psychol. 2003, 88, 879. [Google Scholar] [CrossRef] [PubMed]
- Williams, L.J.; Edwards, J.R.; Vandenberg, R.J. Recent advances in causal modeling methods for organizational and management research. J. Manag. 2003, 29, 903–936. [Google Scholar]
- Hair, J.F.; Black, W.C.; Babin, B.J.; Anderson, R.E.; Tatham, R.L. Multivariate Data Analysis; Pearson Prentice Hall: Upper Saddle River, NJ, USA, 2006. [Google Scholar]
- Hair, J.F., Jr.; Hult, G.T.M.; Ringle, C.; Sarstedt, M. A Primer on Partial Least Squares Structural Equation modeling (pls-sem); Sage Publications: Thousand Oaks, CA, USA, 2016. [Google Scholar]
- Nunnally, J.; Bernstein, I. Psychometric Theory, 3rd ed.; McGraw-Hill: New York, NY, USA, 1994. [Google Scholar]
- Fornell, C.; Larcker, D.F. Evaluating structural equation models with unobservable variables and measurement error. J. Market. Res. 1981, 18, 39–50. [Google Scholar] [CrossRef]
- Bagozzi, R.P.; Yi, Y. On the evaluation of structural equation models. J. Acad. Market. Sci. 1988, 16, 74–94. [Google Scholar] [CrossRef]
- Henseler, J.; Ringle, C.M.; Sinkovics, R.R. The use of partial least squares path modeling in international marketing. Adv. Int. Market. 2009, 20, 277–319. [Google Scholar]
- Chin, W.W. Issues and opinion on structural equation modeling. Manag. Inf. Syst. Q. 1998, 22, 7–16. [Google Scholar]
- Dibrell, C.; Davis, P.S.; Craig, J. Fueling innovation through information technology in smes. J. Small Bus. Manag. 2008, 46, 203–218. [Google Scholar] [CrossRef]
- R Development Core Team. R: A Language and Environment for Statistical Computing. Available online: http://www.R-project.org/ (accessed on 28 September 2017).
- Kaufman, L.; Rousseeuw, P.J. Finding Groups in Data: An Introduction to Cluster Analysis; John Wiley & Sons: New York, NY, USA, 2009; Volume 344. [Google Scholar]
- Klein, P.G.; Mahoney, J.T.; McGahan, A.M.; Pitelis, C.N. Capabilities and strategic entrepreneurship in public organizations. Strateg. Entrep. J. 2013, 7, 70–91. [Google Scholar] [CrossRef]
- Sirmon, D.G.; Hitt, M.A.; Ireland, R.D. Managing firm resources in dynamic environments to create value: Looking inside the black box. Acad. Manag. Rev. 2007, 32, 273–292. [Google Scholar] [CrossRef]
- Naudé, W.A. Entrepreneurship and Economic Development; Palgrave Macmillan: New York, NY, USA, 2010. [Google Scholar]
- Sambamurthy, V.; Bharadwaj, A.; Grover, V. Shaping agility through digital options: Reconceptualizing the role of information technology in contemporary firms. MIS Q. 2003, 27, 237–263. [Google Scholar] [CrossRef]
- Kantur, D. Strategic entrepreneurship: Mediating the entrepreneurial orientation-performance link. Manag. Decis. 2016, 54, 24–43. [Google Scholar] [CrossRef]
- Levinthal, D.A.; March, J.G. The myopia of learning. Strateg. Manag. J. 1993, 14, 95–112. [Google Scholar] [CrossRef]
- He, Z.-L.; Wong, P.-K. Exploration vs. Exploitation: An empirical test of the ambidexterity hypothesis. Organ. Sci. 2004, 15, 481–494. [Google Scholar] [CrossRef]
- Benner, M.J.; Tushman, M.L. Exploitation, exploration, and process management: The productivity dilemma revisited. Acad. Manag. Rev. 2003, 28, 238–256. [Google Scholar]
- Kuratko, D.F.; Audretsch, D.B. Strategic entrepreneurship: Exploring different perspectives of an emerging concept. Entrep. Theory Pract. 2009, 33, 1–17. [Google Scholar] [CrossRef]
- Gupta, A.K.; Smith, K.G.; Shalley, C.E. The interplay between exploration and exploitation. Acad. Manag. J. 2006, 49, 693–706. [Google Scholar] [CrossRef]
- Ifinedo, P. Examining the influences of external expertise and in-house computer/it knowledge on erp system success. J. Syst. Softw. 2011, 84, 2065–2078. [Google Scholar] [CrossRef]
- Chang, L.-M.; Chang, S.-I.; Ho, C.-T.; Yen, D.C.; Chiang, M.-C. Effects of is characteristics on e-business success factors of small-and medium-sized enterprises. Comput. Hum. Behav. 2011, 27, 2129–2140. [Google Scholar] [CrossRef]
- Kearns, G.S.; Lederer, A.L. A resource-based view of strategic it alignment: How knowledge sharing creates competitive advantage. Decis. Sci. 2003, 34, 1–29. [Google Scholar] [CrossRef]
- Bharadwaj, A.S.; Sambamurthy, V.; Zmud, R.W. IT capabilities: Theoretical perspectives and empirical operationalization. In Proceedings of the 20th international conference on Information Systems, Charlotte, NC, USA, 12–15 December 1999; Association for Information Systems: Atlanta, GA, USA, 1999; pp. 378–385. [Google Scholar]
- Babin, B.J. A resource-based view of strategic it alignment: How knowledge sharing creates competitive advantage. Decis. Sci. 2003, 34, 1–29. [Google Scholar]
Figure 1.
Research model.

Figure 2.
Structural model.

Figure 3.
Heat map of IT capabilities according to cluster group.

Figure 4.
PIP efficacy and PIP efficiency (linear transformations) according to IT Cap cluster group.
Figure 4.
PIP efficacy and PIP efficiency (linear transformations) according to IT Cap cluster group.

Figure 5.
Heat map of SE dimensions.

Table 1.
Literature Review for Hypotheses Development.
| Author | Method | Sample | Remark |
|---|---|---|---|
| [49] | Empirical Meta-Analysis | 76 articles on firm level impacts of IT (2001–2009) | No consistent set of performance measures but IT capabilities impact competitive advantage (productivity, profitability and intangibles) |
| [31] | Empirical Replicated by [32] | High IT capability firms vs. control sample |
|
| [2] | Empirical Survey | IT executives Manufacturing | Flexible IT infrastructure improves both information generation and dissemination, thereby improving a firm’s ability to function in turbulent environments leading to competitive advantage |
| [40] | Empirical Survey | Manufacturing China | IT capability has an indirect effect on firm performance (mediated fully via business process agility) |
| [5] | Empirical Survey | Manufacturing China |
|
| [6] | Conceptual |
| |
| [62] | Empirical Survey | Publically traded US firms Senior IT executives |
|
| [51] | Empirical | Medium- and large-sized firms | Corporate entrepreneurship positively impacts financial performance measures |
| [24] | Empirical | Spanish and Italian ceramic tile industry | Organization learning capability (exploration–exploitation) influences PIP |
| [52] | Empirical Meta-Analysis | 51 articles on the entrepreneurial orientation–performance relationship | Entrepreneurial orientation has a moderate-to-large impact on firm level performance |
| [47] | Conceptual | Successful firms must be flexible and fleet of foot, able to balance conflicting organizational tensions via simultaneously exploiting current competitive advantages while exploring new opportunities |
Table 2.
Inter-construct Co-relations.
| Construct | Average Variance Extracted (AVE) | √AVE | CR | 1 | 2 | 3 | 4 | 5 | 6 | 7 | 8 | 9 | 10 |
|---|---|---|---|---|---|---|---|---|---|---|---|---|---|
| 1. IT infrastructure flexibility (IT_FLEX) | 0.74 | 0.86 | 0.85 | 0.86 | |||||||||
| 2. IT integration (IT_INT) | 0.88 | 0.94 | 0.94 | 0.65 | 0.94 | ||||||||
| 3. IT business alignment (IT_BUA) | 0.76 | 0.87 | 0.90 | 0.57 | 0.64 | 0.87 | |||||||
| 4. IT management (IT_MGT) | 0.78 | 0.88 | 0.91 | 0.43 | 0.46 | 0.52 | 0.88 | ||||||
| 5. Entrepreneurial mindset (SE_EM) | 0.67 | 0.82 | 0.86 | 0.17 | 0.14 | 0.09 | 0.17 | 0.82 | |||||
| 6. Innovation (SE_INN) | 0.73 | 0.85 | 0.89 | 0.37 | 0.34 | 0.29 | 0.27 | 0.45 | 0.85 | ||||
| 7. Competitive advantage (SE_CA) | 0.73 | 0.85 | 0.84 | 0.34 | 0.23 | 0.28 | 0.30 | 0.44 | 0.67 | 0.85 | |||
| 8. Managing resources strategically (SE_MRS) | 0.69 | 0.83 | 0.82 | 0.29 | 0.31 | 0.27 | 0.26 | 0.46 | 0.55 | 0.50 | 0.83 | ||
| 9. Product innovation efficacy (PIP_CACY) | 0.62 | 0.79 | 0.87 | 0.33 | 0.43 | 0.48 | 0.48 | 0.27 | 0.35 | 0.43 | 0.23 | 0.79 | |
| 10. Product innovation efficiency (PIP_CIENCY) | 0.62 | 0.79 | 0.87 | 0.26 | 0.29 | 0.33 | 0.44 | 0.32 | 0.24 | 0.32 | 0.28 | 0.62 | 0.79 |
Note: The square root of AVE is displayed diagonally in bold italics.
Table 3.
Structural model path coefficients.
| Hypothesis | Path | Path Coefficients | t Values | Significance | Hypothesis |
|---|---|---|---|---|---|
| H1 | IT_Cap → Strategic entrepreneurship (SE) | 0.40 | 5.98 | p < 0.001 *** | Supported |
| H2 | SE → PIP | 0.25 | 2.57 | p < 0.05 * | Supported |
| H3 | IT_Cap → PIP | 0.44 | 5.55 | p < 0.001 *** | Supported |
Note: *** and * represent significance at 99.9% and 95% respectively.
Table 4.
Sobel test of mediation.
| INPUT Data | Coefficient |
|---|---|
| Direct (No Mediation) | 0.54 |
| Direct (with Mediation) | 0.44 |
| Independent variable (IV) → Mediation Beta | 0.3947 |
| Mediation → Dependent variable (DV) Beta | 0.2512 |
| IV → Mediation Standard Error | 0.067 |
| Mediation → DV Standard Error | 0.0905 |
| Result: | |
| Sobel test statistic | 2.51093254 |
| One-tailed probability | 0.00602064 |
| Two-tailed probability | 0.01204127 |
Table 5.
Multivariate regression analysis of SE on PIP.
| Variables | Factor 1 (PIP Efficacy) | Factor 2 (PIP Efficiency) | ||
|---|---|---|---|---|
| Multivariate Analysis | Multivariate Analysis | |||
| p-Value | Regression Coef. | p-Value | Regression Coef. | |
| Constant | 7.138 | 6.177 | ||
| Entrepreneurial mindset | 0.218 | 0.098 | 0.016 * | 0.226 |
| Innovation | 0.067 | 0.232 | 0.472 | −0.106 |
| Managing resources strategically | 0.301 | −0.108 | 0.221 | 0.151 |
| Competitive advantage | 0.001 *** | 0.513 | 0.063 | 0.326 |
* p < 0.05; *** p < 0.001.
© 2018 by the authors. Licensee MDPI, Basel, Switzerland. This article is an open access article distributed under the terms and conditions of the Creative Commons Attribution (CC BY) license (http://creativecommons.org/licenses/by/4.0/).
Share and Cite
MDPI and ACS Style
Lyver, M.J.; Lu, T.-J. Sustaining Innovation Performance in SMEs: Exploring the Roles of Strategic Entrepreneurship and IT Capabilities. Sustainability 2018, 10, 442. https://doi.org/10.3390/su10020442
AMA Style
Lyver MJ, Lu T-J. Sustaining Innovation Performance in SMEs: Exploring the Roles of Strategic Entrepreneurship and IT Capabilities. Sustainability. 2018; 10(2):442. https://doi.org/10.3390/su10020442
Chicago/Turabian StyleLyver, Maurice J., and Ta-Jung Lu. 2018. "Sustaining Innovation Performance in SMEs: Exploring the Roles of Strategic Entrepreneurship and IT Capabilities" Sustainability 10, no. 2: 442. https://doi.org/10.3390/su10020442
Note that from the first issue of 2016, this journal uses article numbers instead of page numbers. See further details here.