Eco-Efficiency Evaluation of Regional Circular Economy: A Case Study in Zengcheng, Guangzhou

1
State Key Laboratory of Water Environment Simulation, School of Environment, Beijing Normal University, Beijing 100875, China
2
Institute of Geographic Sciences and Natural Resources Research, Chinese Academy of Sciences, Beijing 100101, China
3
Center for Chinese Agricultural Policy, Chinese Academy of Sciences, Beijing 100101, China
4
University of Chinese Academy of Sciences, Beijing 100049, China
5
Faculty of Social Science, the Chinese University of Hong Kong, Shatin, N.T., Hong Kong, China
*
Author to whom correspondence should be addressed.
Sustainability 2018, 10(2), 453; https://doi.org/10.3390/su10020453
Submission received: 27 December 2017
/
Revised: 7 February 2018
/
Accepted: 7 February 2018
/
Published: 9 February 2018
(This article belongs to the Special Issue Regional Cooperation for the Sustainable Development and Management in Northeast Asia)
Abstract
:Circular economies are critical for alleviating resource pressure and improving environmental quality at regional level. Emergy analysis and eco-efficiency evaluations play important roles in measuring regional eco-efficiency and providing supporting information for governmental decision-making. In this study, emergy analysis and input–output analysis were applied to analyze the changes in emergy structure, functional efficiency, and sustainable development capacity of Zengcheng, Guangzhou during the period 2000–2016. The results showed that the proportion of non-renewable emergy in total emergy structure of Zengcheng increased from 55% to 75%, which placed a greater environmental load on the natural ecosystem and gradually weakened the capacity for sustainable development. The rates of emergy utilization and eco-efficiency both showed increasing trends. All indicators about eco-efficiency showed the development of Zengcheng heavily relied on emergy consumption, especially on non-renewable emergy. The relationship between emergy utilization and socio-economic development of Zengcheng can provide decision-making support for economic structure optimization and sustainable community development.
1. Introduction
Since the implementation of economic reforms and opening-up policy in 1978, China has experienced rapid economic growth and accelerating urbanization. This is resulting in extensive increases of external resource consumption and carbon dioxide emissions and, accordingly, affecting urban development quality [1,2]. Urban areas have become the main hot spots of resource consumption and waste generation [3,4]. The contradiction among economic development, resource shortages, and air pollution is creating urgent need to seek new development pathways, such as circular economies, which play an important role in alleviating resource pressure and improving environmental quality [5,6]. A circular economy observes the principle of reducing, reusing, and recycling (3R), which aims to lower pollutant emissions, implement cleaner production, and minimize inputs of energy and materials in the production process [7]. A circular economy is a sustainable development strategy, which is identified as beneficial from the development economics perspective [8,9]. Promoting circular economies at the regional level could effectively alleviate energy crises, environmental pollution, and resource consumption, and thereby could improve regional sustainability and construction of eco-cities and eco-communities. The economic boom has required significant natural resources inputs [10]. According to china statistical yearbook of 2016, the total energy consumption has increased about 7.6 times from 5.7 × 10⁸ t SCE in 1978 to 4.36 × 10⁹ t SCE in 2016. While the overarching objectives of the circular economy are not only to achieve pure economic growth but also to improve eco-efficiency, the prefix “eco” stands for both ecological and economic performance. Eco-efficiency has been proposed as a concept of “efficiency with which ecological resources are used to meet human needs” [11] and as a tool of sustainable development [12], which connotes the efficiency level of economic activity regarding resources, funds, and services. Changes in urban development sustainability can be assessed based on regional eco-efficiency evaluations over time. Within the context of new urbanization, eco-efficiency assessment may provide support information for policy making to promote regional sustainability with less-negative impacts on the environment, and to better inform construction of eco-cities [13,14].
The application of the circular economy concept in the Chinese context was first proposed in 1998, and formally implemented by the central government in 2002 as a new development strategy [15]. Development policies were carried out mainly for environmental protection and waste recycling, while the circular economy model worked as the end-of-pipe treatment. During the period 2003–2006, pilots of regional circular economies and eco-industrial parks were promoted by the Ministry of Environmental Protection, with the help of special funds. In 2007, the goal of constructing an ecological civilization, presented by the 17th National Congress of the Communist Party of China (CPC), was to vigorously develop a circular economy. The move for such an economy gained momentum on 1 January 2009, when the Circular Economy Promotion Law was enacted.
An increasing number of studies focused on applications of statistical methods for measuring eco-efficiency including the Delphi method [16], ecological footprint method [17], analytic hierarchy process [18], and data envelopment analysis [19]. These methods were mainly applied for analyzing the impacts of emissions on the environment, and the economic benefits [20], while the contribution of ecological products and services to alleviate these impacts was neglected, as were the loads placed on ecosystems and problems related to the carrying capacity of economic and industrial development [21]. Currently, most studies concerning eco-efficiency in a circular economy focus on the scientific planning of eco-cities and eco-communities [22,23]. Lou and Ulgiati (2013) used emergy analysis methods to analyze the advantages and constraints of Chinese ecological conditions for economic development [24]. Pouriyeh et al. (2016) used envelopment analysis to investigate the ecological efficiency of urban suburbs in Iran, and not only solved the problems of inaccuracy in previous approaches, but also provided a creative and scientific way to evaluate fluctuation in the energy structure, ecological efficiency, and sustainable development capacity [25]. Data used in these studies were directly obtained from the related statistical yearbook or survey. Therefore, most research on eco-efficiency has focused on areas such as industrial parks and mega-cities with less focused on that at regional level. Lou et al. (2015) used emergy accounting method to evaluate the regional environmental sustainability in terms of power production, industry, mobility, and buildings four aspects [26], which may be better to reflect the sustainability of sub-economic system and neglected the relationship between different sub-systems. Therefore, in this study, we combined the emergy analysis and input-output method to study the eco-efficiency of circular economy from the whole social-economic system perspective rather than the sub-system. In addition, we aimed to prove the feasibility of combination of these two methods and extend them in investigations about eco-efficiency of circular economy to regional level.
Emergy analysis converts capital, materials, and resources into solar energy values, thereby linking the natural environment system and socio-economic system. Input–output data provide a detailed record of the material or capital inflows and outflows [27,28]. The combination of traditional emergy analysis with the input-output method has been frequently used to measure the flows of regional energy, materials, information, and capital, and to evaluate sustainability at regional level [29,30]. The relative emergy-based indices such as emergy yield ratio, environmental load ratio and environmental sustainability index are directly linked to urban ecosystems in an integrated way through the combined values of the services [31]. It could capture the dynamics of the system and reflect the environmental load, eco-efficiency, the changing trends of energy structures, resource utilization, eco-efficiency, and the ability to achieve sustainable development [32,33]. Additionally, it also can identify issues to be addressed during the process of eco-city construction in the name of circular economy.
Zengcheng, a county in the city of Guangzhou, has taken the lead in eco-city construction in China. We selected Zengcheng as case study to analyze its eco-efficiency change during the period 2000–2016. The rest of this article is organized as follows: the second section is a description of the study area, and the third section covers the data processing and modeling. The fourth section lays out the results that are significant for consolidating existing eco-city achievements, and the final section includes discussions on the key findings and conclusions. This study not only serves as an empirical study for evaluating the eco-efficiency of circular economy in Zengcheng based on emergy analysis, but also provides useful decision-making information to help promote urban ecological integrated management.
2. Study Area
Zengcheng (113°29′ E–113°57′ E, 23°5′ N–23°37′ N) is located in the east of Guangzhou (Figure 1), covers an area of 1616.47 km2, of which 55.88% is forested. Zengcheng is in a subtropical zone, with annual average temperature of 22.2 °C, precipitation of 1869 mm (73.6 inches), evaporation 1330.3 mm and sunshine of 1830.0 h, which makes it suitable for tropical and subtropical crop growth.
With the objective of ecological conservation and under the guidance of the Scientific Outlook on Development, a guiding socio-economic principle of the CPC, a “three economic zones” strategy was employed in Zengcheng to spatially allocate various industries (Figure 1). The northern ecological industrial zone is a strictly conserved area mainly used for tourism and urban agriculture. The science, education, and living zone is planned to form a high-end living area by importing residential and educational components. The new southern industrial zone is served for developing strategic emerging industries to form an industrial agglomeration combining with the original manufacturing industrial base there.
Government of Zengcheng paid more attention to the circular economy in the development of industry. Its sustainable development strategy was implemented via closure of polluting enterprises and rational allocation of manufacturing districts, residential zones, and ecological conservation areas under the guidance of a circular economy. In addition, the environmental remedying strategy was also carried out in 2001. Finally, the government of Zengcheng entitled a privilege of the “Zengcheng model”, which was famous for its win-win strategy in terms of ecologically oriented society and economic development. To ensure a mode of circular economy development, on the one hand green cleaner production was required, while on the other hand circular utilization of resources was needed. The annual GDP growth rate in Zengcheng was above 10% from 2000 to 2015. In addition, industrial structure became more and more rational. In 2015, the gross domestic product (GDP) in Zengcheng reached $15.23 billion, with the ratio of the first, second and tertiary industries was 5:60:35, and total exports valued reaching $3.62 billion. The per capita disposable income of urban residents was $5900, while that of rural residents was just $2822. Circular economy was implemented in Zengcheng in 2001. Therefore, there is great value in taking Zengcheng as a case study area to characterize the various aspects of its ecological efficiency and resource utilization, and to speculate on what underlies the crucial problems encountered.
3. Data and Methods
3.1. Data
Natural environment data were employed to calculate the emergy contribution to circular development from the ecosystem, and these consisted mainly of average sunshine hours, annual precipitation, and above mean sea level. The data were obtained from the database of the Resource and Environmental Science Data Center, Chinese Academy of Sciences.
Social economic data were applied to estimate the emergy contribution of resources, funds, and services from the human economic system. It mainly included food consumption (fruit, vegetables, meat, eggs, fish), energy consumption (coal, fuel oil, electricity), metal consumption, GDP, and waste (solid waste, wastewater, and waste gas). These data were mainly derived from the Guangzhou Statistical Yearbooks of years 2001–2017 [34], the Statistical Bulletin of Social Development of Zengcheng, and the input–output (I-O) table of Guangdong Province for 2000, 2002, 2005, 2007, 2010, and 2012. The total consumption of food and energy in Zengcheng was acquired, then the amount of resources, obtained internally and externally, was determined in accordance with the IO table. Owing to the lack of official statistical data of Zengcheng, in this study some data at the Guangdong provincial or municipal scale were interpolated into the spatial scale of Zengcheng by linear regression. For example, the consumption of fuel oil, electricity, and cement were calculated based on the ratio of Zengcheng’s GDP compared with those of Guangzhou. Of note, the I-O table for Guangdong was employed for speculating the proportion of import resources in the total.
During the data processing phase, we first calculated the total input emergy of energies, resources, and capital for Zengcheng. Then, the total emergy was divided into local and external emergy in accordance with proportions of total output value of domestic and foreign inflows. Here, to avoid duplicate counting, we followed Lomas et al. (2008) to use the sum of rain chemical emergy and rainwater potential emergy to replace the emergy of renewable energy [35]. The input emergy of various non-renewable resources was interpolated based on multiplication of the resource consumption indicated in the Guangzhou Statistical Yearbook, and the proportion of GDP of Zengcheng within Guangzhou. The emergy of renewable resources excluding food emergy was calculated as the per capita consumption of Guangzhou multiplied by the population of Zengcheng. Proportion of rations accounted for the total amount of grain consumption was 30%; therefore, emergy of grains was calculated by emergy of rations divided 30%.
3.2. Methods
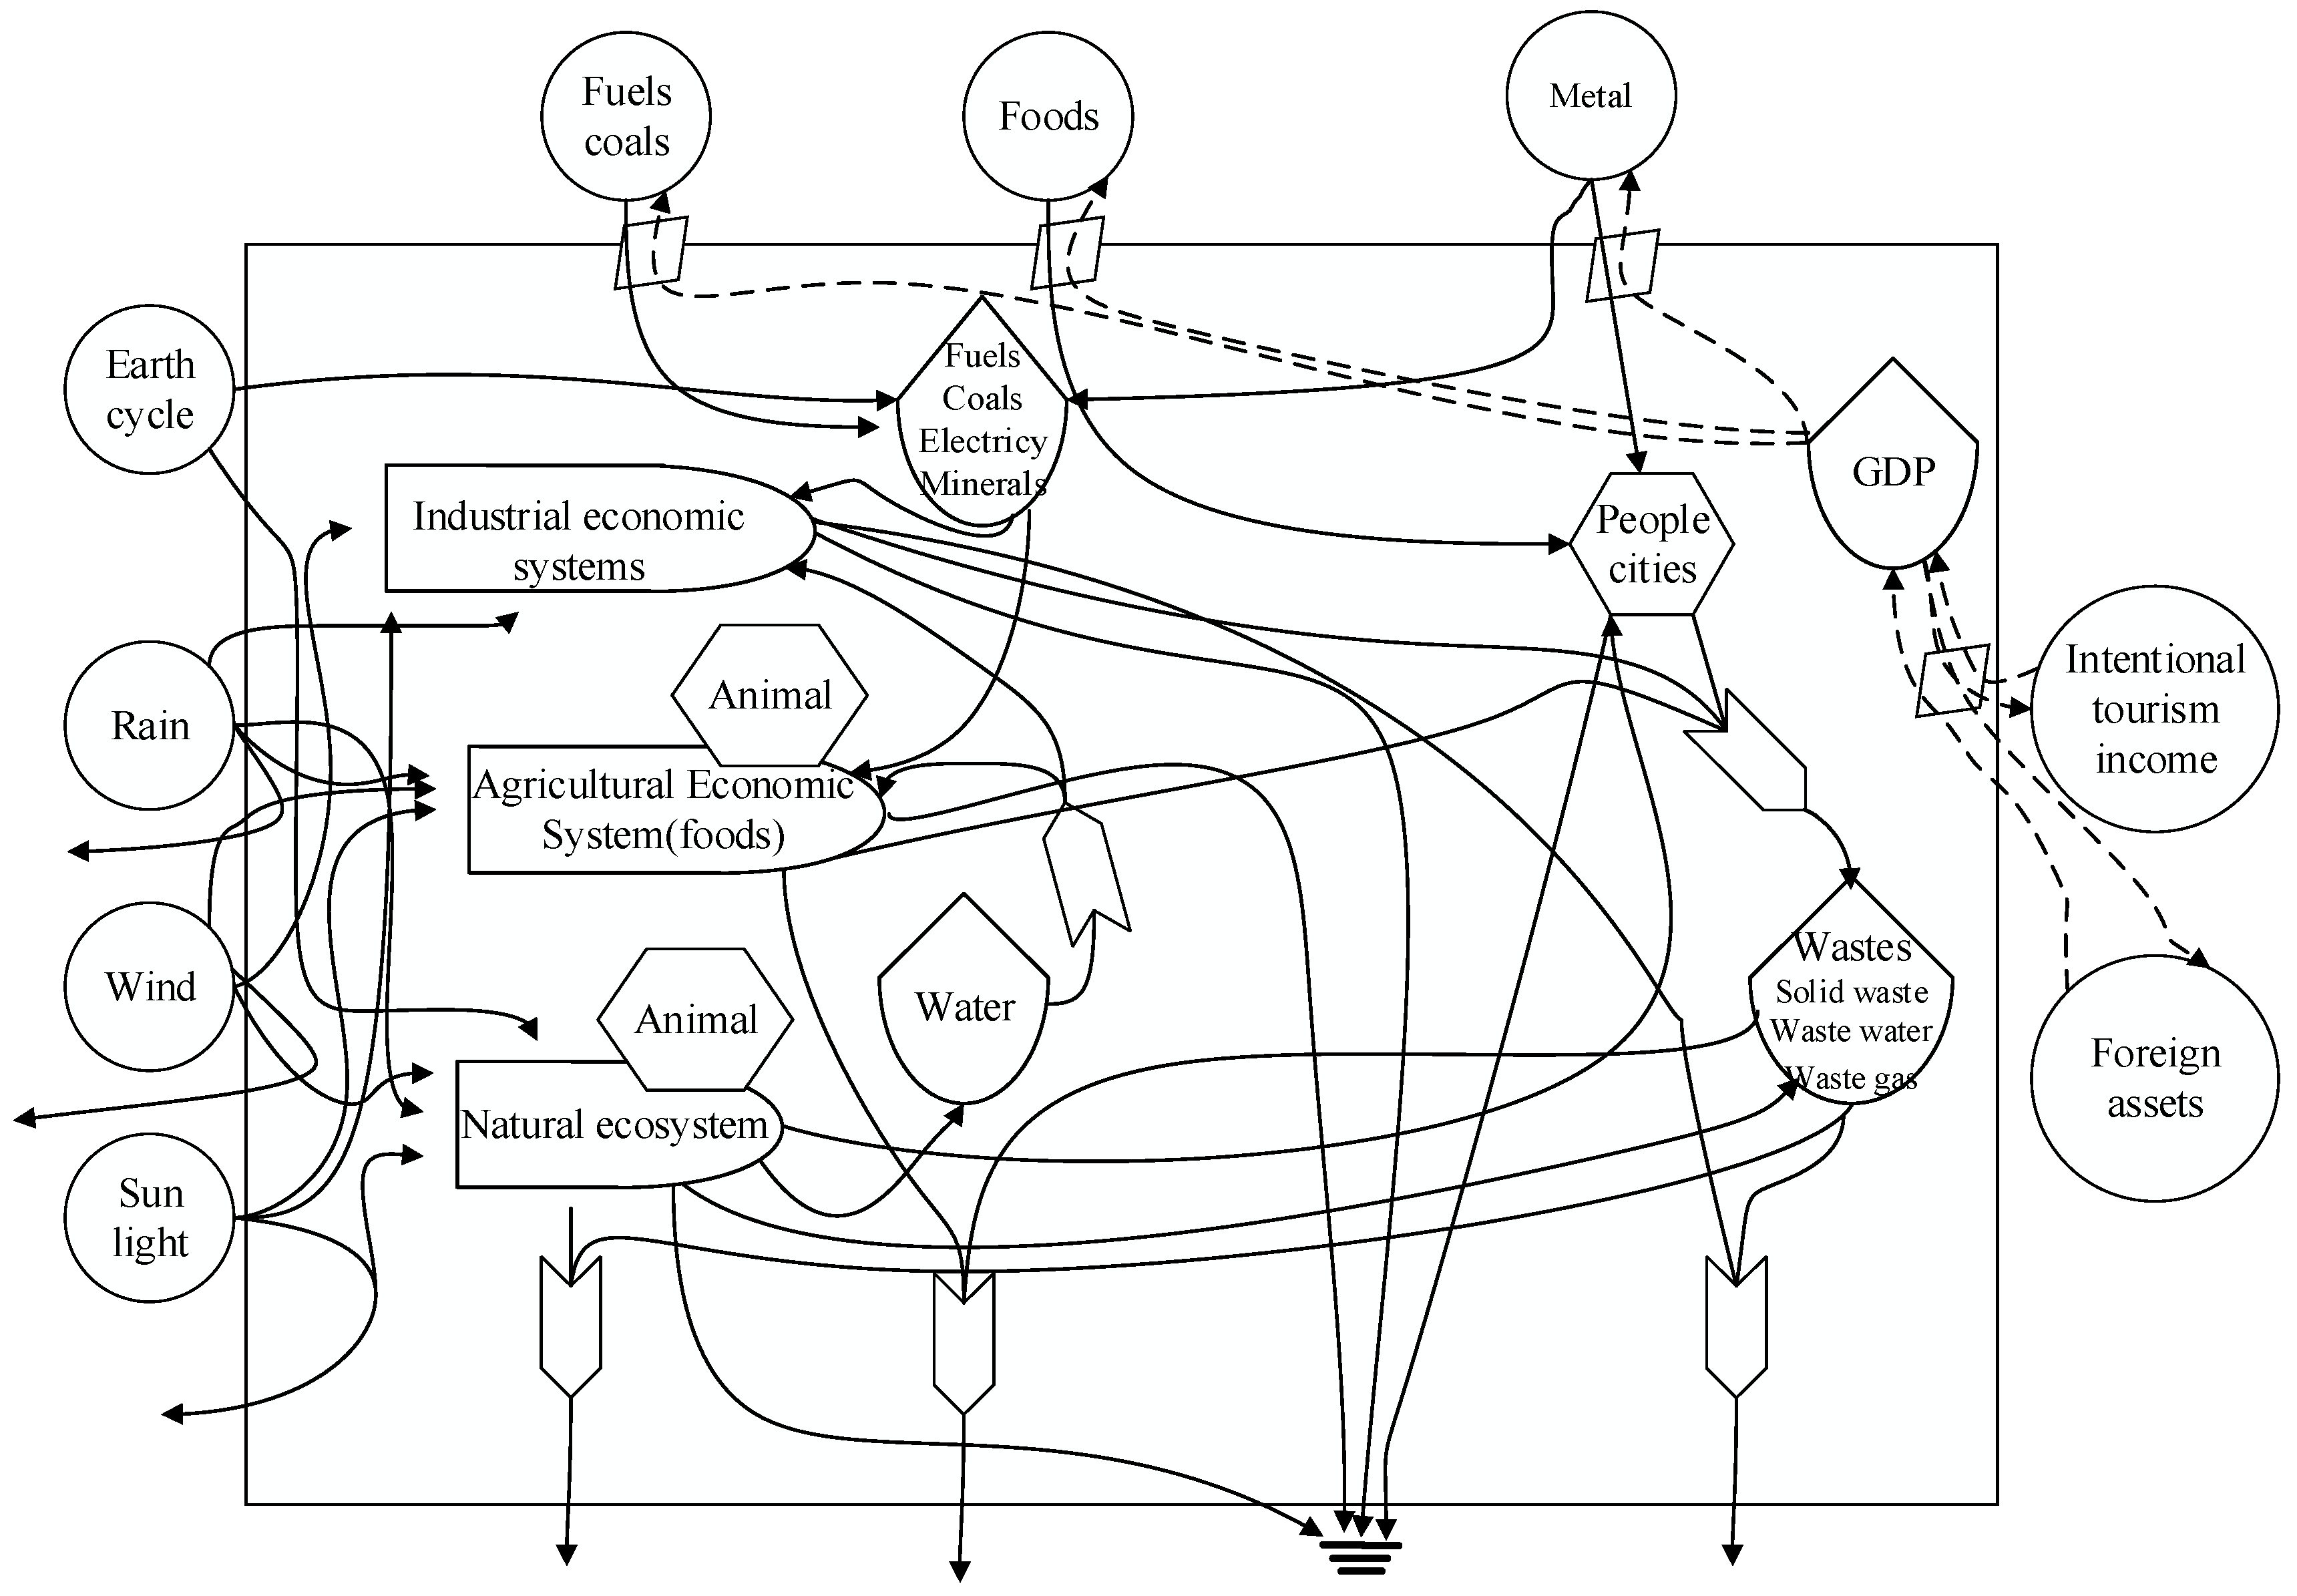
Emergy analysis and the input–output method were incorporated to evaluate regional eco-efficiency. Odum (1983) introduced emergy analysis in the 1980s [36]. There is fundamental difference among various types of energy as long as quality and value are concerned; therefore, energy cannot be added or subtracted directly in a system [37]. The values of various forms of energy were standardized into that of solar energy as the standard energy value, based on their emergy transformity [38]. After conversion, the emergy of the inputs and outputs can be compared and analyzed within the same system [39]. An I-O table records the direction of material and capital flow in the region, providing a detailed database for an emergy analysis [40]. The main procedures of emergy analysis are: (1) determine the boundary of the study area and project the inner relationship within the emergy systems [41] (Figure 2); (2) calculate the emergy of the various energy flows; (3) establish an evaluation index system on a circular economy, and calculate the respective values; and (4) analyze the dynamics and driving mechanism of the emergy.
Traditional evaluation methods, such as material flow analysis, the Delphi method, ecological footprint method, and analytic hierarchy process, focus mainly on a single parameter, without accounting for local ecosystem services or the value of existing natural capital [42]. Furthermore, these methods are not capable of distinguishing the origin of resources (local or external) to assess their contribution to regional economic development, and are not originally designed for the systemic, closed-loop feedback features that characterize a circular economy. Emergy analysis incorporates ecosystems as well as socio-economic systems, analyzes energy flow, material flow, monetary flow, and other ecological flows, and thus enables choosing integrated evaluation indicators to reflect the system’s structure, function, and efficiency [43,44]. However, emergy analysis is still somewhat imperfect; that is, the emergy transformity of energy, materials, or capital may vary by region, and it is obtained from various sources, which may lead to inaccurate accounting results.
Classification of emergy. Based on the actual situation in Zengcheng, the emergy is divided into eight types: local renewable energy emergy, local renewable resources emergy, local non-renewable resources emergy, imported renewable resources emergy (domestic), imported non-renewable resource emergy (domestic), foreign input emergy, net output emergy, and waste emergy (Table 1). The emergy is calculated based on the emergy transformity (unit emergy value) of these resources (energy, capital) according to Equation (1), Table A1 (Appendix A) shows all types of emergy in Zengcheng from 2000 to 2016.
where is the emergy of i resources, is the ith input flow of matter or energy and is the unit emergy value of the ith flow (from related literature).
Evaluation index system of emergy. The evaluation index for assessing regional sustainability is capable of reflecting the information of urban ecological planning, construction, and management [45]. To describe and evaluate the changes of the circular economy in Zengcheng from 2000 to 2016, based on the related study of emergy sustainability indicators [46], a series of indexes were selected from the aspects of structure, function, and efficiency (Table 2), all of which supported multiple performance aspects in resource use. The emergy evaluation index was calculated from the material flow and capital flow. Further detailed on the emergy method and emergy evaluation index can be found in [13,24,28,32].
4. Results
4.1. Changes of Emergy Flow of Circular Economy
The emergy of renewable energy fluctuated widely in Zengcheng from 2000 to 2016, mainly as a result of changes in rainfall, with an average value of 5.31 × 10²⁰ seJ/year, a minimum value of 3.47 × 10²⁰ seJ in 2004 and a maximum value of 6.98 × 10²⁰ seJ in 2016 (Table 3). Additionally, based on the calculation results, we can sort the magnitudes of the emergy of renewable energy inputs to Zengcheng by the Earth’s rotational energy, wind energy, and solar energy.
The emergy of renewable resources is characterized by decreasing inputs and a reliance on local supply. It decreased from 7.99 × 10²¹ seJ in 2000 to 6.84 × 10²¹ seJ in 2016. The emergy of renewable resources outside the region accounted for about 15% of the total emergy. The types of resources outside the region and imported to Zengcheng include food, fruit, vegetables, and meat, while the region is essentially self-sufficient in terms of fish and eggs. Among the renewable resources, the input emergy of grains was the largest from 2000 to 2016, accounting for over 65%, followed by that of vegetables, accounting for around 15%. However, the input emergy of grains decreased from 6.08 × 10²¹ seJ in 2000 to 4.93 × 10²¹ seJ in 2016, and the emergy of meat and fruits increased during the same period. Improved living conditions and changes in people’s diet structure were the main reasons behind this. From 2000 to 2016, the figure of grain emergy was the largest, dominated the change trend of renewable resources. Although the population continues to increase, the amount of grains consumption is decreasing rapidly, leading to a variety of renewable resources also showing a decreasing trend.
The emergy of non-renewable resources show an increasing trend: from 1.12 × 10²² seJ in 2000 to 2.75 × 10²² seJ in 2016, respectively. While, Zengcheng’s economy has recently rapidly developed, resulting in rising demand for energy, the rising use of private automobiles has also raised consumption of oil and other resources. Among the emergy of non-renewable resources, electricity had the largest proportion, of 40% (except for in 2000, when it accounted for 29%). The emergy of cement showed a decreasing tendency from 2000 to 2016 owing to the well-built infrastructure with less renovations or repairs required; frequency of using cement is resultantly decreasing. The emergy of other non-renewable resources showed differing degrees of increase and emergy outside the region accounted for about 20%. The local supply of coal was at a low level, and depended mainly on resources outside the region. The emergy of electricity, water, and cement reflected the basic self-sufficiency in Zengcheng, while emergy of other resources still needed external supply.
The emergy of foreign inputs and outputs both show an increasing trend, and the gap between the two sides has widened. The emergy of foreign inputs reached 1.44 × 10²¹ seJ in 2016, which was 2.44 times the 2000 figure. The emergy of foreign outputs increased from 1.99 × 10²¹ seJ to 1.98 × 10²² seJ during the same time with about a tenfold increase since 2000.
The emergy of outputs is increasing rapidly, though the emergy of waste is still large. The emergy of GDP reached 1.46 × 10²³ seJ, with an increase of 1.32 × 10²³ seJ over the 17-year period. During this period, the emergy of waste showed an unstable trend, first increasing, then decreasing. The emergy of solid waste accounted for the largest proportion, at about 90%. These data show the cycle capacity of the economic system in Zengcheng is weakening. Disposal of waste and recycling should be strengthened to minimize emissions incurred in future development.
On the whole, the input emergy in Zengcheng maintained an increasing trend. More specifically, the input emergy outside the region increased from 3.16 × 10²¹ seJ in 2000 to 7.21 × 10²¹ seJ in 2016, accounting for 16.5% to 21% of the total input emergy. Similarly, the local input emergy also kept an increasing trend, but the proportion decreased, mainly due to introduction of a large amount of oil resources.
4.2. Changes in the Emergy Evaluation Index of the Circular Economy
Figure 3 shows the changes in the circular economic structure in Zengcheng. Non-renewable energy emergy dominates the emergy structure in Zengcheng. The total input emergy was 3.65 × 10²² seJ in 2016, about twice the 2000 figure. The emergy of non-renewable resources increased from 1.12 × 10²² seJ in 2000 to 2.75 × 10²² seJ in 2016, accounting for about 75% of the total input emergy in 2016 (Figure 3). Over the same period, the percentage of the emergy of renewable energy decreased from 39.4% to 18.7%. The change of proportion of foreign input emergy accounting for the total input emergy is not significant over the 17-year period, about 3–10%. These data show the economic development in Zengcheng relies mainly on non-renewable resources, such as coal and oil, and this will inevitably affect the local ecological environment in the processes of development, transportation, and other use.
As the socio-economic system in Zengcheng has been improved, the efficiency of emergy utilization and production has increased. The system’s emergy became increasingly dependent on the purchase of foreign emergy from 2000 to 2016, with the increase becoming more rapid over time. As a result, the emergy yield ratio (EYR) experienced a partial change in volatility and then finally an overall decreasing trend (Figure 4, Table 4). Emergy use per unit area and per person increased, while the ratio of emergy use to GDP decreased (Figure 5, Table 4). The emergy use per unit area nearly roughly doubled from 1.25 × 10¹⁹ seJ/km2 in 2000 to 2.26 × 10¹⁹ seJ/km2 in 2016, while emergy use per person increased from 2.74 × 10¹⁶ seJ/person to 4.14 × 10¹⁶ seJ/person. Additionally, the ratio of emergy use to GDP decreased from 1.21 × 10¹⁷ seJ/$10,000 to 2.31 × 10¹⁶ seJ/$10,000 (Table 4), indicated that less emergy was needed to produce something of equal value. It mainly because of that the emergy use efficiency improvement was due to the technical progress.
Pressure exerted on the ecological environment system gradually increased in Zengcheng during the period 2000–2016. The ELR of Zengcheng showed an increasing trend (Figure 6), mainly because of the decreasing emergy of renewable energy within the system. Apart from that, the increasing input emergy and non-renewable emergy resulted in overall rising of ELR. The ELR changed suddenly in certain years, mainly owing to abrupt decreases in rainfall, which further caused the decreasing emergy of the renewable energy inputs from 2004 to 2010. The EWR and ratio of waste to total imports decreased (Figure 6, Table 4), utilization efficiency of emergy within the entire system increased, and output emergy increased. Although the ratio of waste to total imports continued to decline, the emergy of waste rose, particularly that of solid waste, which was equal to the emergy of renewable energy.
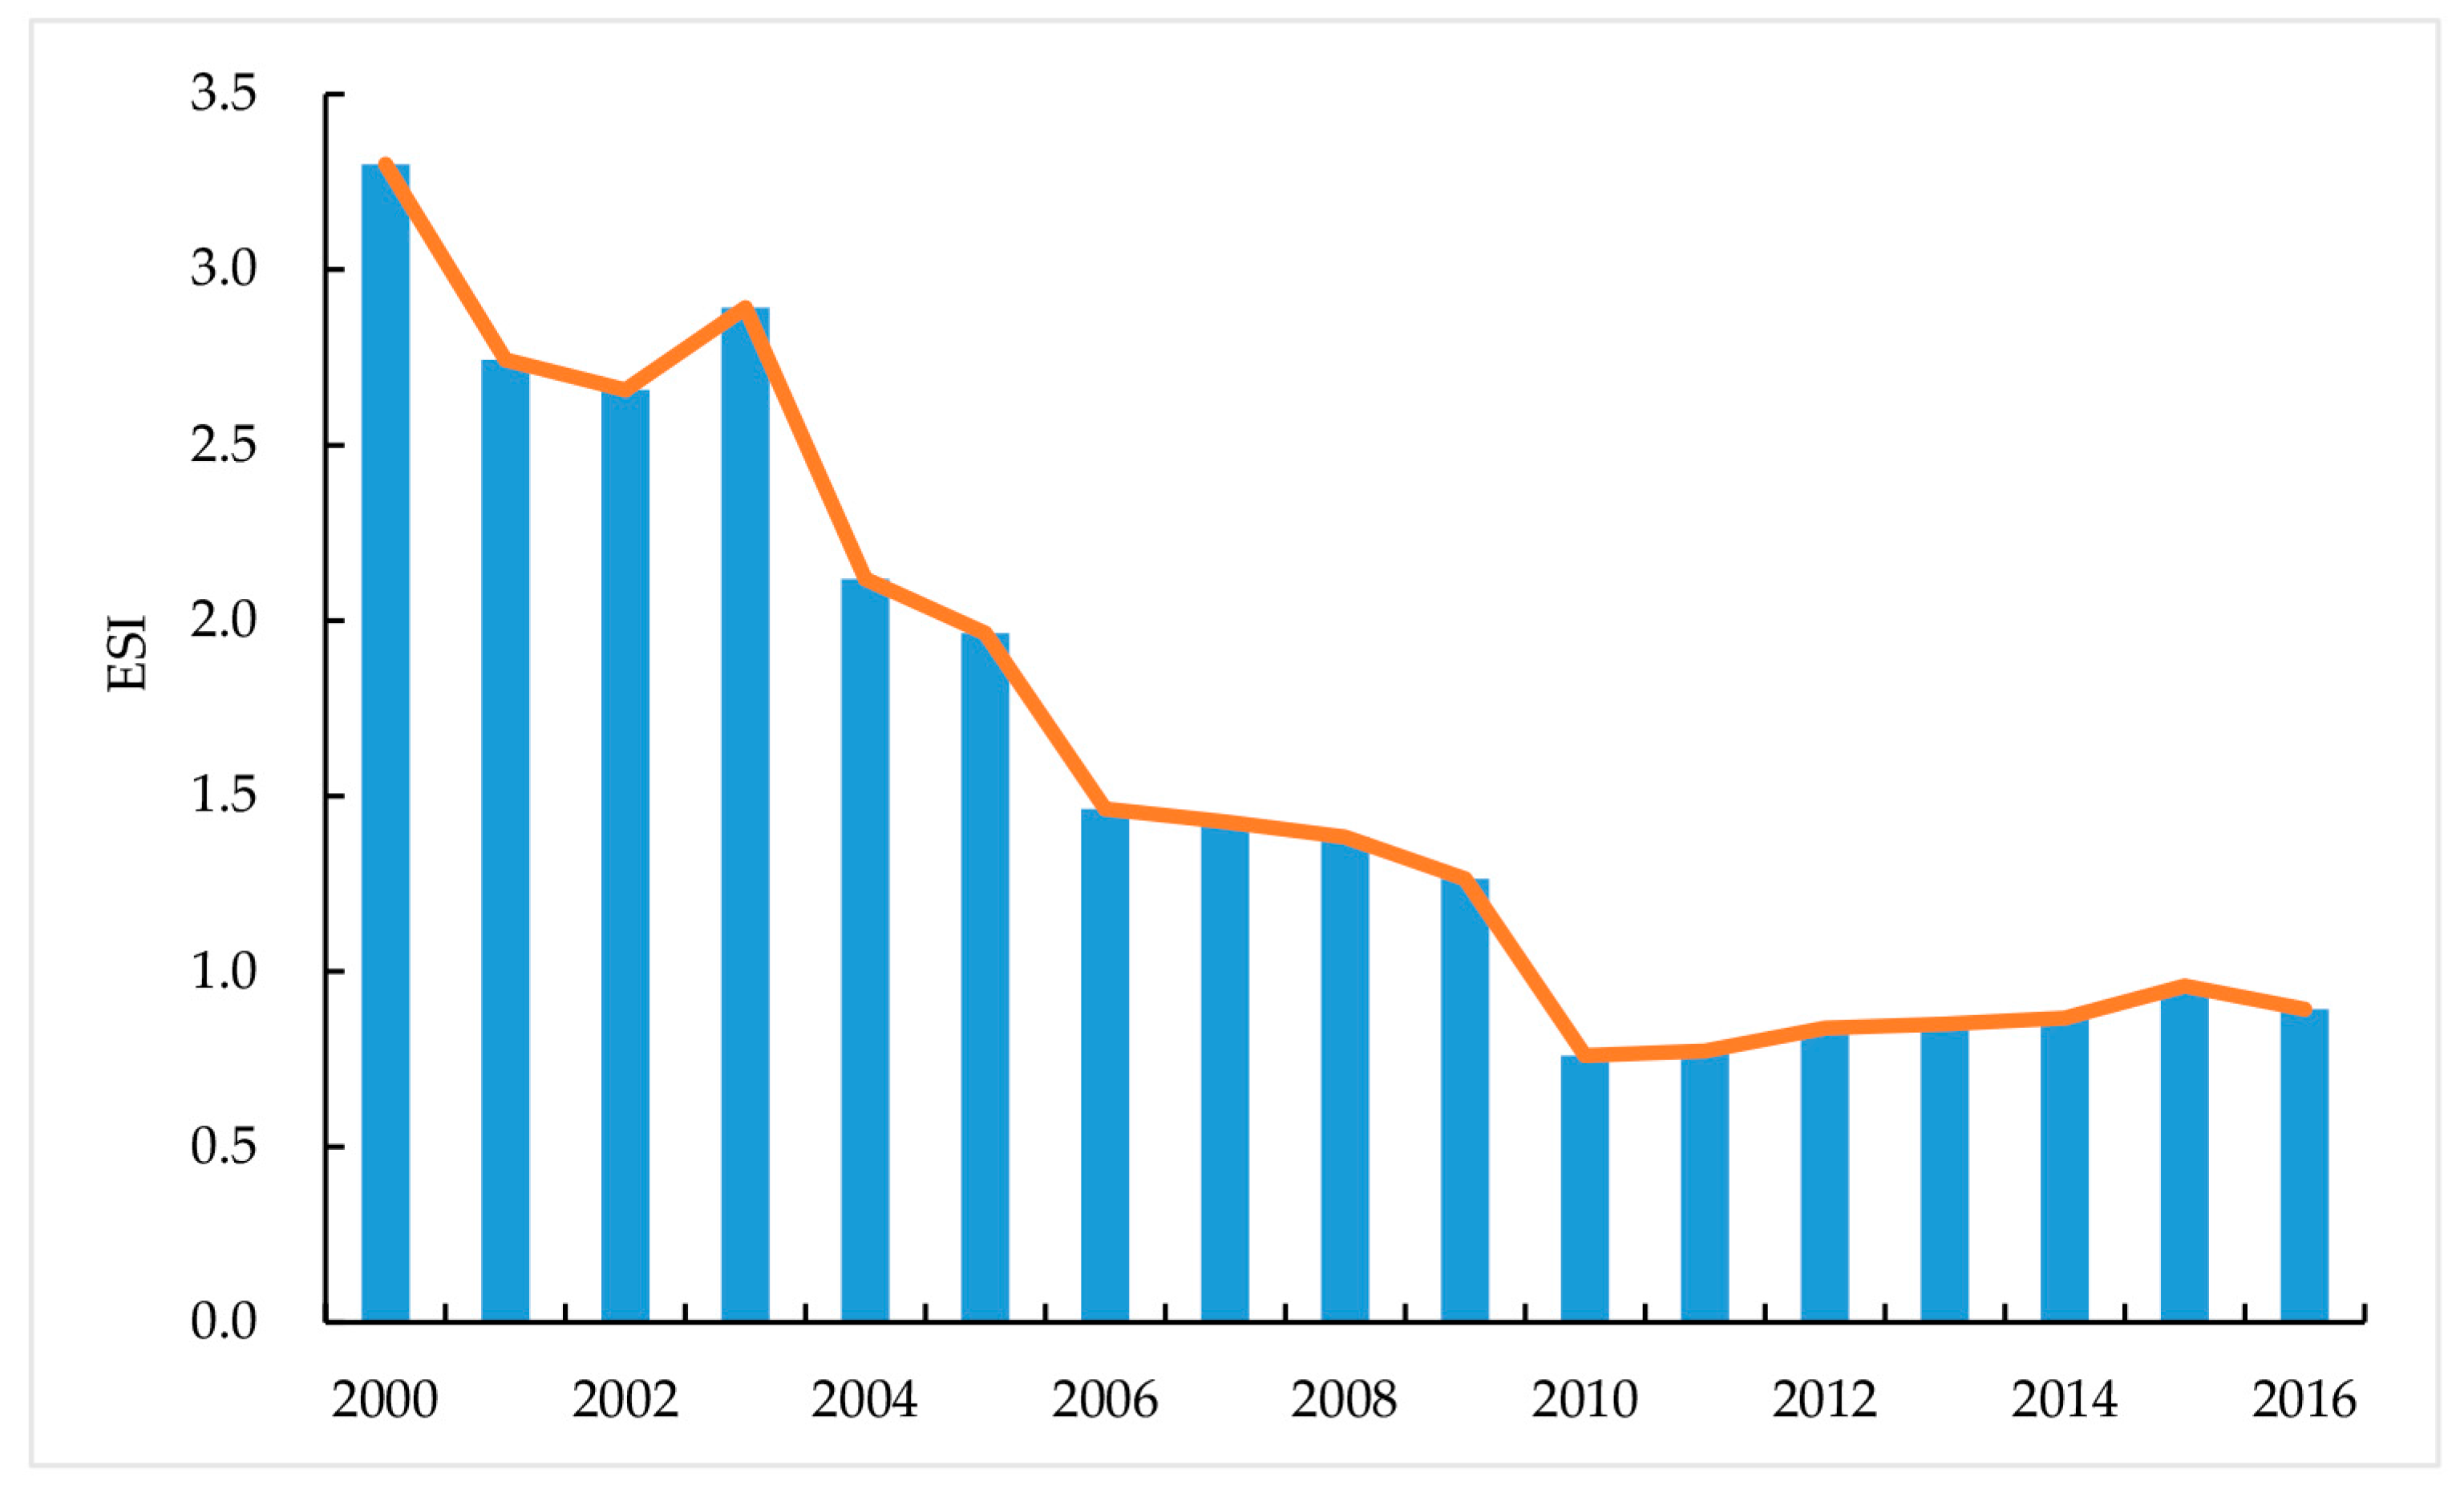
The emergy sustainability index (ESI) decreased with fluctuation during our study time period (Figure 7, Table 4), indicating the system development capability decreased continuously. The ESI sharply decreased from 3.3 in 2000 to 0.76 in 2010. From 2010 to 2016, it kept around 0.8. A large amount of input emergy comes from outside of Zengcheng, and the emergy of non-renewable resources accounts for 80% of the total input emergy. Furthermore, the local renewable energy was decreasing during the study period, which led to a smaller ESI value. These data showed that the sustainability of socio-economy system was decreasing.
We examined the accuracy of our results via comparison with related research. We referred to the results of Sweeney et al. (2007) on circular economies in various countries [47]. The ratio of renewable energy in Zengcheng is below the China’s average level (0.26 in 2006) and has maintained a decreasing trend in recent years. Our results on ratio of renewable energy are above the average level (0.03 in 2006) in Japan, which may be due to Japan’s heavy reliance on resource imports. ELR is about twice more than China’s average level (2.83 in 2006). The EYR in Zengcheng is similar to the China’s average level (4.03 in 2006), and lower than that for Russia (11.33 in 2006), indicating the efficiency of emergy use is higher in developed countries. The ESI figure is higher than that for Japan (0.04 in 2006), showing better sustainable development of society and the economy in China than in Japan. In sum, the recent development level of the circular economy has increased, but it is still clearly problematic compared with what is seen in developed countries.
5. Conclusions and Discussion
On the whole, the input emergy of Zengcheng has been increasing, mainly stemming from an increase in non-renewable resource emergy, which means non-renewable energy emergy dominates Zengcheng’s emergy structure, especially coal resources. The increasing input emergy and relatively low efficiency are the main reasons leading to the large annual amounts of waste emergy. The development model in Zengcheng relies on high emergy consumption, as a tradeoff for economic development. This exerts great pressure on the ecological environment system in Zengcheng. Although the efficiency of emergy utilization and production has increased, the capability for system development has continuously decreased. This mode of development is not sustainable and will affect the system’s capacity for sustainable development in Zengcheng. To sum up, the emergy structure in Zengcheng should be adjusted to better reduce the use of non-renewable resources and develop a circular economy in the future. These results help decision makers have a comprehensive understanding of the development of circular economy in Zengcheng and aids in decision-making to promote construction of ecological communities and implementation of urban ecologically integrated management. It also proves combination the emergy analysis and input-output method can be applied to evaluate the eco-efficiency at regional level.
There are some suggestions for policy makers to improve the eco-efficiency and sustainability. Based on the ESI formula, it is abundantly clear that increasing use of local resources is vital for reducing dependence on resources outside the region. Reducing use of non-renewable resources to ensure a relatively high ESI should yield positive effects. First, to develop new energy sources (e.g., solar energy and wind power) and the low emergy demanding technologies, and improve the emergy use efficiency; second, to adjust the energy structure and reduce the dependence on resources outside, especially the non-renewable energy; third, to develop the technology of wastes recycling and improve the use efficiency of wastes; fourth, to adjust the high emergy consumption industries, e.g., energy intensive industries, and accelerate the development of the tertiary industry and optimize local economy structure; at last, local government should encourage citizens to have a low emergy and healthy lifestyles.
The lack of official statistical data on Zengcheng means that we have to scientifically convert data from Guangdong Province or Guangzhou City to derive proportional coefficients. Therefore, there may be errors between the calculated and actual data. However, based on the emergy analysis method and input-output method, compared with the results of Brown (2006) [25], the discounted data in Zengcheng are within a reasonable range. These results reflect the basic changes in the trends of the circular economy and development of a social economic system in Zengcheng from 2000 to 2016.
The present research broadens investigations on regional eco-efficiency evaluation based on emergy analysis. Our results of Zengcheng indicate eco-efficiency calculated via an emergy model is capable of reflecting the comprehensive situation of circular economy development, including structure of resources, function and efficiency, and sustainability of the socio-economic system. Compared with the data at national and provincial levels, there are some difficulties in data collection at regional level. However, the results may reflect a more realistic portrait of the socio-economic system. In the future study, we will carry out field research and consult with the related government bureau about energy flow, material flow in Zengcheng, and to assess the reliability of calculated data thorough comparing the investigated data with the calculated data. Combined with the Chinese characteristic, the construction of circular economy may achieve better results adopting a bottom-up model. In some sense, it is important to evaluate the development of a circular economy at the regional level. The present study provides the database and decision-support information for further optimization the circular economic structure for building an ecological city, ecological communities, and pursuing development at even smaller spatial scales.
Acknowledgments
This research was supported by the research funds from the National Key Research and Development Program of China (Grant No. 2016YFC0502802), the National Natural Science Foundation of China for Distinguished Young Scholars (Grant No. 71225005), State Key Program of National Natural Science Foundation of China (Grant No. 71533004), the Key Program of International Cooperation, Chinese Academy of Sciences (Grant No. 131A11KYSB20130023).
Author Contributions
Wei Liu and Jinyan Zhan had the original idea and designed this research. Wei Liu and Fan Zhang were responsible for data collecting and preparation. Jinyan Zhan, Zhihui Li and Siqi Jia supervised the research and proofread the manuscript. Wei Liu analyzed data and wrote this paper. The authors approved the content of this manuscript.
Conflicts of Interest
The authors declare no conflicts of interest.
Appendix A

Table A1.
The emergy of Zengcheng City, 2000–2016 (unit: seJ/year).
| Types | 2000 | 2001 | 2002 | 2003 | 2004 | 2005 | 2006 | 2007 | 2008 | 2009 | 2010 | 2011 | 2012 | 2013 | 2014 | 2015 | 2016 | |
|---|---|---|---|---|---|---|---|---|---|---|---|---|---|---|---|---|---|---|
| Local renewable energy | Sunlight (×1018) | 7.10 | 7.10 | 7.10 | 7.10 | 7.10 | 7.10 | 7.10 | 7.10 | 7.10 | 7.10 | 7.10 | 7.10 | 7.10 | 7.10 | 7.10 | 7.10 | 7.10 |
| Wind (×1019) | 4.99 | 4.99 | 4.99 | 4.99 | 4.99 | 4.99 | 4.99 | 4.99 | 4.99 | 4.99 | 4.99 | 4.99 | 4.99 | 4.99 | 4.99 | 4.99 | 4.99 | |
| Rain (chemical potential) (×1020) | 5.27 | 5.80 | 4.17 | 3.89 | 3.37 | 5.55 | 6.37 | 4.78 | 6.58 | 4.73 | 4.86 | 3.67 | 5.03 | 5.31 | 5.19 | 5.53 | 6.04 | |
| Rain (geopotential) (×1019) | 1.56 | 1.72 | 1.24 | 1.15 | 1.00 | 1.65 | 1.89 | 1.42 | 1.95 | 1.40 | 1.44 | 1.09 | 1.49 | 1.57 | 1.54 | 1.64 | 1.79 | |
| Earth cycle (×1019) | 9.38 | 9.38 | 9.38 | 9.38 | 9.38 | 9.38 | 9.38 | 9.38 | 9.38 | 9.38 | 9.38 | 9.38 | 9.38 | 9.38 | 9.38 | 9.38 | 9.38 | |
| Total (rain) (×1020) | 5.42 | 5.98 | 4.29 | 4.01 | 3.47 | 5.71 | 6.56 | 4.93 | 6.78 | 4.87 | 5.00 | 3.78 | 5.18 | 5.46 | 5.34 | 6.47 | 6.98 | |
| Import renewable resources | Grain (×1020) | 3.61 | 6.07 | 7.74 | 2.23 | 6.80 | 7.09 | 11.16 | 5.98 | 5.83 | 5.31 | 10.98 | 6.34 | 5.01 | 5.25 | 5.22 | 4.85 | 5.97 |
| Fruit (×1016) | 9.17 | 8.13 | 8.67 | 6.60 | 7.07 | 6.33 | 7.63 | 8.52 | 8.37 | 9.96 | 8.44 | 8.92 | 11.04 | 9.70 | 11.78 | 13.27 | 16.03 | |
| Vegetable (×1020) | 2.74 | 2.83 | 2.77 | 2.79 | 2.19 | 2.31 | 2.32 | 2.42 | 2.68 | 2.63 | 3.29 | 3.29 | 3.37 | 2.36 | 2.96 | 3.08 | 3.40 | |
| Meat (×1020) | 2.00 | 2.13 | 2.03 | 2.10 | 2.03 | 2.37 | 2.28 | 2.29 | 1.94 | 1.99 | 2.57 | 3.01 | 1.40 | 2.92 | 2.97 | 1.93 | 2.10 | |
| Total (×1020) | 8.45 | 11.11 | 12.63 | 7.19 | 11.09 | 11.83 | 15.84 | 10.77 | 10.54 | 10.03 | 16.93 | 12.74 | 9.89 | 10.64 | 11.27 | 10.00 | 11.63 | |
| Local renewable resources | Grain (×1021) | 5.72 | 5.23 | 5.88 | 5.98 | 5.23 | 5.18 | 4.32 | 4.95 | 4.51 | 4.19 | 3.27 | 3.59 | 3.82 | 3.64 | 3.86 | 4.14 | 4.33 |
| Egg (×1016) | 1.26 | 1.51 | 1.32 | 1.50 | 1.45 | 1.61 | 1.51 | 1.50 | 1.76 | 1.73 | 1.91 | 2.26 | 2.17 | 2.10 | 2.28 | 2.46 | 2.88 | |
| Fishery (×1016) | 2.05 | 2.05 | 2.02 | 1.81 | 1.80 | 1.99 | 2.08 | 2.09 | 2.43 | 2.41 | 2.64 | 3.09 | 2.91 | 3.03 | 3.08 | 3.27 | 3.73 | |
| Fruit (×1019) | 2.75 | 2.25 | 2.29 | 1.65 | 1.76 | 1.55 | 1.74 | 1.86 | 1.74 | 2.00 | 1.97 | 1.59 | 1.73 | 1.80 | 2.50 | 2.69 | 3.36 | |
| Vegetable (×1020) | 9.12 | 9.25 | 8.70 | 8.24 | 8.05 | 7.17 | 7.82 | 8.05 | 6.90 | 6.38 | 7.33 | 6.39 | 5.27 | 6.39 | 6.52 | 6.98 | 7.40 | |
| Meat (×1020) | 4.91 | 5.21 | 4.76 | 5.14 | 4.98 | 5.79 | 5.58 | 5.37 | 6.43 | 6.95 | 6.95 | 8.58 | 8.82 | 7.71 | 7.70 | 5.36 | 5.65 | |
| Total (×1021) | 7.15 | 6.70 | 7.25 | 7.34 | 6.55 | 6.49 | 5.68 | 6.31 | 5.86 | 5.54 | 4.72 | 5.11 | 5.24 | 5.07 | 5.31 | 5.40 | 5.67 | |
| The total renewable emergy (×1021) | 7.99 | 7.81 | 8.51 | 8.05 | 7.66 | 7.67 | 7.26 | 7.38 | 6.91 | 6.55 | 6.41 | 6.38 | 6.23 | 6.13 | 6.43 | 6.40 | 6.84 | |
| Import non-renewable resources | Coal (×1021) | 2.23 | 2.21 | 2.24 | 2.26 | 2.25 | 2.27 | 2.45 | 2.49 | 2.48 | 2.49 | 2.64 | 2.78 | 2.52 | 2.49 | 2.47 | 2.56 | 2.32 |
| Oil (×1020) | 0 | 0 | 0 | 0 | 0 | 0 | 0 | 5.42 | 6.87 | 6.23 | 11.62 | 15.63 | 24.92 | 21.74 | 24.19 | 24.3 | 34.6 | |
| Metal (×1019) | 8.90 | 5.51 | 4.59 | 4.98 | 8.65 | 17.37 | 9.28 | 9.50 | 14.59 | 18.42 | 28.08 | 17.67 | 28.63 | 34.14 | 22.01 | 24 | 26.9 | |
| Total (×1021) | 2.32 | 2.27 | 2.29 | 2.31 | 2.34 | 2.44 | 2.54 | 3.13 | 3.31 | 3.30 | 4.09 | 4.52 | 5.30 | 5.00 | 5.11 | 5.23 | 6.05 | |
| Local non-renewable resources | Oil (×1021) | 2.84 | 2.91 | 3.15 | 3.20 | 3.23 | 3.36 | 3.56 | 3.73 | 4.05 | 4.42 | 4.57 | 4.45 | 3.89 | 4.62 | 4.49 | 5.82 | 6.05 |
| Electricity (×1021) | 3.25 | 3.73 | 4.60 | 5.77 | 6.84 | 7.81 | 8.04 | 8.92 | 8.57 | 8.55 | 9.66 | 10.24 | 10.65 | 10.96 | 11.48 | 12.1 | 12.8 | |
| Cement (×1021) | 2.60 | 2.55 | 2.94 | 4.24 | 3.58 | 3.96 | 4.17 | 3.10 | 2.06 | 2.00 | 1.97 | 2.07 | 2.19 | 2.28 | 1.89 | 2.45 | 2.13 | |
| Metal (×1020) | 1.51 | 2.07 | 2.31 | 3.65 | 4.44 | 3.82 | 6.21 | 7.36 | 5.49 | 5.24 | 5.97 | 5.30 | 4.67 | 6.07 | 4.68 | 4.70 | 4.81 | |
| Water (×1016) | 3.97 | 5.39 | 5.18 | 5.63 | 5.94 | 5.69 | 5.53 | 5.67 | 5.78 | 5.81 | 5.96 | 5.95 | 5.92 | 6.05 | 6.17 | 6.32 | 6.5 | |
| Total (×1021) | 8.84 | 9.40 | 10.92 | 13.58 | 14.10 | 15.51 | 16.39 | 16.48 | 15.23 | 15.49 | 16.80 | 17.29 | 17.20 | 18.47 | 18.32 | 20.8 | 21.5 | |
| The non-renewable emergy (×1022) | 1.12 | 1.12 | 1.17 | 1.32 | 1.59 | 1.64 | 1.79 | 1.89 | 1.96 | 1.85 | 1.88 | 2.09 | 2.18 | 2.25 | 2.35 | 2.61 | 2.75 | |
| Foreign input | Foreign assets (×1020) | 5.07 | 6.30 | 6.83 | 7.47 | 9.25 | 11.10 | 13.14 | 18.09 | 16.52 | 16.32 | 22.48 | 25.81 | 19.62 | 17.80 | 18.10 | 12.2 | 12.3 |
| International tourism income (×1019) | 8.19 | 9.01 | 11.2 | 8.56 | 9.73 | 10.92 | 13.71 | 18.39 | 14.53 | 16.61 | 26.83 | 22.61 | 16.91 | 15.79 | 17.60 | 19.1 | 20.3 | |
| Total (×1020) | 5.88 | 7.20 | 7.95 | 8.32 | 10.23 | 12.19 | 14.51 | 19.93 | 17.98 | 17.98 | 25.16 | 28.07 | 21.31 | 19.38 | 19.9 | 14.1 | 14.4 | |
| Net output | GDP (×1022) | 1.45 | 1.67 | 1.87 | 2.18 | 2.49 | 2.89 | 3.57 | 4.36 | 5.42 | 6.12 | 7.68 | 9.16 | 10.20 | 12.05 | 12.31 | 13.1 | 14.6 |
| Total annual export (×1021) | 1.99 | 2.43 | 2.45 | 2.79 | 3.66 | 5.34 | 7.22 | 9.64 | 10.61 | 10.31 | 14.01 | 16.77 | 17.31 | 19.52 | 20.50 | 21 | 19.8 | |
| Total (×1022) | 1.65 | 1.91 | 2.11 | 2.46 | 2.86 | 3.42 | 4.30 | 5.33 | 6.49 | 7.15 | 9.08 | 10.84 | 11.93 | 14.01 | 14.36 | 15.2 | 16.6 | |
| Wastes | Solid waste (×1020) | 4.69 | 5.75 | 6.23 | 7.63 | 8.44 | 7.49 | 8.56 | 7.41 | 8.05 | 9.19 | 10.34 | 9.00 | 8.20 | 7.76 | 6.16 | 8.53 | 9.38 |
| Waste water (×1019) | 8.94 | 9.56 | 9.66 | 8.05 | 8.65 | 7.53 | 7.42 | 6.89 | 11.25 | 9.99 | 9.46 | 8.99 | 8.13 | 8.45 | 6.39 | 6.34 | 6.57 | |
| Waste gas (×1018) | 3.41 | 4.17 | 4.52 | 3.33 | 5.02 | 4.18 | 3.70 | 3.12 | 3.82 | 4.68 | 6.07 | 7.24 | 6.26 | 6.75 | 6.57 | 6.39 | 7.32 | |
| Total (×1020) | 5.62 | 6.75 | 7.24 | 8.47 | 9.36 | 8.28 | 9.34 | 8.13 | 9.22 | 10.24 | 11.35 | 9.97 | 9.08 | 8.68 | 6.86 | 9.23 | 10.1 | |
Data source: Guangzhou/Guangdong Statistical Yearbook from 2001 to 2017, Guangdong IO Table of 2000, 2002, 2005, 2007 and 2012.
References
- Deng, X.Z.; Huang, J.K.; Rozelle, S.; Zhang, J.P.; Li, Z.H. Impact of urbanization on cultivated land changes in China. Land Use Policy 2015, 45, 1–7. [Google Scholar] [CrossRef]
- Liu, Y.; Chen, Z.M.; Xiao, H.W.; Yang, W.; Liu, D.H.; Chen, B. Driving factors of carbon dioxide emissions in China: An empirical study using 2006–2010 provincial data. Front. Earth Sci. 2017, 11, 156–161. [Google Scholar] [CrossRef]
- Xu, M.; Weissburg, M.; Newell, J.P.; Crittenden, J.C. Developing a science of infrastructure ecology for sustainable urban systems. Environ. Sci. Technol. 2012, 46, 7928–7929. [Google Scholar] [CrossRef] [PubMed]
- Yin, K.; Wang, R.; An, Q.; Yao, L.; Liang, J. Using eco-efficiency as an indicator for sustainable urban development: A case study of Chinese provincial capital cities. Ecol. Indic. 2014, 36, 665–671. [Google Scholar] [CrossRef]
- Chen, S.Y.; Santos-Paulino, A.U. Energy Consumption and Carbon Emission Based Industrial Productivity in China: A Sustainable Development Analysis. Rev. Dev. Econ. 2013, 17, 644–661. [Google Scholar] [CrossRef]
- Wu, H.Q.; Shi, Y.; Xia, Q.; Zhu, W.D. Effectiveness of the policy of circular economy in China: A DEA-based analysis for the period of 11th five-year-plan. Resour. Conserv. Recycl. 2014, 83, 163–175. [Google Scholar] [CrossRef]
- Haas, W.; Krausmann, F.; Wiedenhofer, D.; Heinz, M. How Circular is the Global Economy? An Assessment of Material Flows, Waste Production, and Recycling in the European Union and the World in 2005. J. Ind. Ecol. 2015, 19, 765–777. [Google Scholar] [CrossRef]
- Gu, Y.F.; Wu, Y.F.; Xu, M.; Mu, X.Z.; Zuo, T.Y. Waste electrical and electronic equipment (WEEE) recycling for a sustainable resource supply in the electronics industry in China. J. Clean. Prod. 2016, 127, 331–338. [Google Scholar] [CrossRef]
- Ma, S.J.; Hu, S.Y.; Chen, D.J.; Zhu, B. A case study of a phosphorus chemical firm’s application of resource efficiency and eco-efficiency in industrial metabolism under circular economy. J. Clean. Prod. 2015, 87, 839–849. [Google Scholar] [CrossRef]
- Peters, G.P.; Weber, C.L.; Guan, D.; Hubacek, K. China’s growing CO2 emissions—A race between increasing consumption and efficiency gains. Environ. Sci. Technol. 2007, 41, 5939–5944. [Google Scholar] [CrossRef] [PubMed]
- Mickwitz, P.; Melanen, M.; Rosenström, U.; Seppälä, J. Regional eco-efficiency indicators—A participatory approach. J. Clean. Prod. 2006, 14, 1603–1611. [Google Scholar] [CrossRef]
- Govindan, K.; Sarkis, J.; Jabbour, C.J.C.; Zhu, Q.; Geng, Y. Eco-efficiency based green supply chain management: Current status and opportunities. Eur. J. Oper. Res. 2014, 233, 293–298. [Google Scholar] [CrossRef]
- Su, M.R.; Fath, B.D.; Yang, Z.H.; Chen, B.; Liu, G.Y. Ecosystem health pattern analysis of urban clusters based on emergy synthesis: Results and implication for management. Energy Policy 2013, 59, 600–613. [Google Scholar] [CrossRef]
- Ansari, Z.N.; Kant, R. A state-of-art literature review reflecting 15 years of focus on sustainable supply chain management. J. Clean. Prod. 2017, 142, 2524–2543. [Google Scholar] [CrossRef]
- Yuan, Z.W.; Bi, J.; Moriguichi, Y. The circular economy: A new development strategy in China. J. Ind. Ecol. 2006, 10, 4–8. [Google Scholar] [CrossRef]
- Musa, H.D.; Yacob, M.R.; Abdullah, A.M.; Ishak, M.Y. Delphi Method of Developing Environmental Well-being Indicators for the Evaluation of Urban Sustainability in Malaysia. Procedia Environ. Sci. 2015, 30, 244–249. [Google Scholar] [CrossRef]
- Dakhia, K.; Berezowska-Azzag, E. Urban institutional and ecological footprint A new urban metabolism assessment tool for planning sustainable urban ecosystems. Manag. Environ. Qual. Int. J. 2010, 21, 78–89. [Google Scholar] [CrossRef]
- Lee, G.K.L.; Chan, E.H.W. The Analytic Hierarchy Process (AHP) Approach for Assessment of Urban Renewal Proposals. Soc. Indic. Res. 2007, 89, 155–168. [Google Scholar] [CrossRef]
- Blancard, S.; Hoarau, J.F. A new sustainable human development indicator for small island developing states: A reappraisal from data envelopment analysis. Econ. Model. 2013, 30, 623–635. [Google Scholar] [CrossRef]
- Langella, I.M.; Zanoni, S. Eco-efficiency in logistics: A case study on distribution network design. Int. J. Sustain. Eng. 2011, 4, 115–126. [Google Scholar] [CrossRef]
- Hau, J.L.; Bakshi, B.R. Expanding exergy analysis to account for ecosystem products and services. Environ. Sci. Technol. 2004, 38, 3768–3777. [Google Scholar] [CrossRef] [PubMed]
- Scofield, J.H. Do LEED-certified buildings save energy? Not really…. Energy Build. 2009, 41, 1386–1390. [Google Scholar] [CrossRef]
- Newsham, G.R.; Mancini, S.; Birt, B.J. Do LEED-certified buildings save energy? Yes, but…. Energy Build. 2009, 41, 897–905. [Google Scholar] [CrossRef]
- Lou, B.; Ulgiati, S. Identifying the environmental support and constraints to the Chinese economic growth—An application of the Emergy Accounting method. Energy Policy 2013, 55, 217–233. [Google Scholar] [CrossRef]
- Pouriyeh, A.; Khorasani, N.; Hosseinzadeh Lotfi, F.; Farshchi, P. Efficiency evaluation of urban development in Yazd City, Central Iran using data envelopment analysis. Environ. Monit. Assess. 2016, 188, 618. [Google Scholar] [CrossRef] [PubMed]
- Lou, B.; Qiu, Y.; Ulgiati, S. Emergy-based indicators of regional environmental sustainability: A case study in Shanwei, Guangdong, China. Ecol. Indic. 2015, 57, 514–524. [Google Scholar] [CrossRef]
- Odum, H.T. Environmental Accounting. Emergy and Environmental Decision Making; John Wiley & Sons: New York, NY, USA, 1996. [Google Scholar]
- Brown, M.T.; Ulgiati, S. Updated evaluation of exergy and emergy driving the geobiosphere: A review and refinement of the emergy baseline. Ecol. Model. 2010, 221, 2501–2508. [Google Scholar] [CrossRef]
- Liu, G.Y.; Yang, Z.F.; Chen, B. A spatial comparative analysis of environmental impacts in Chinese urban metabolic processes. Energy Procedia 2011, 5, 43–50. [Google Scholar] [CrossRef]
- Falkowski, T.B.; Martinez-Bautista, I.; Diemont, S.A.W. How valuable could traditional ecological knowledge education be for a resource-limited future? An emergy evaluation in two Mexican villages. Ecol. Model. 2015, 300, 40–49. [Google Scholar] [CrossRef]
- Liu, G.; Yang, Z.; Chen, B.; Ulgiati, S. Emergy-based dynamic mechanisms of urban development, resource consumption and environmental impacts. Ecol. Model. 2014, 271, 90–102. [Google Scholar] [CrossRef]
- Zhou, S.Y.; Zhang, B.; Cai, Z.F. Emergy analysis of a farm biogas project in china: A biophysical perspective of agricultural ecological engineering. Commun. Nonlinear Sci. Numer. Simul. 2010, 15, 1408–1418. [Google Scholar] [CrossRef]
- Merlin, G.; Boileau, H. Eco-efficiency and entropy generation evaluation based on emergy analysis: Application to two small biogas plants. J. Clean. Prod. 2016, 143, 257–268. [Google Scholar] [CrossRef]
- Guangzhou District Statistical Bureau. Guangzhou Statistical Yearbook, 2000–2014. Available online: http://210.72.4.52/gzStat1/chaxun/njsj.jsp (accessed on 29 January 2017).
- Lomas, P.L.; Alvarez, S.S.; Rodriguez, M.F.; Montes, C. Environmental accounting as a management tool in the Mediterranean context: The Spanish economy during the last 20 years. J. Environ. Manag. 2008, 88, 326–347. [Google Scholar] [CrossRef] [PubMed]
- Odum, H.T. Systems Ecology: An Introduction; Wiley: New York, NY, USA, 1983; p. 644. [Google Scholar]
- Viglia, S.; Civitillo, D.F.; Cacciapuoti, G.; Ulgiati, S. Indicators of environmental loading and sustainability of urban systems. An emergy-based environmental footprint. Ecol. Indic. 2017. [Google Scholar] [CrossRef]
- Chen, S.Q.; Chen, B. Sustainability and future alternatives of biogas-linked agrosystem (BLAS) in China: An emergy synthesis. Renew. Sustain. Energy Rev. 2012, 16, 3948–3959. [Google Scholar] [CrossRef]
- Wang, C.D.; Zhang, S.Y.; Yan, W.L.; Wang, R.Q.; Liu, J.; Wang, Y.T. Evaluating renewable natural resources flow and net primary productivity with a GIS-Emergy approach: A case study of Hokkaido, Japan. Sci. Rep. 2016, 6, 37552. [Google Scholar] [CrossRef] [PubMed]
- Dong, H.J.; Fujita, T.; Geng, Y.; Dong, L.; Ohnishi, S.; Sun, L.; Dou, Y.; Fujii, M. A review on eco-city evaluation methods and highlights for integration. Ecol. Indic. 2016, 60, 1184–1191. [Google Scholar] [CrossRef]
- Vega-Azamar, R.; Romero-López, R.; Oropeza-García, N.; Glaus, M.; Hausler, R.; Silva-Poot, H. Emergy evaluation of dwelling operation in five housing units of Montreal Island, Canada. Sustainability 2017, 9, 663. [Google Scholar] [CrossRef]
- Costanza, R.; De Groot, R.; Farberk, S.; Grasso, M.; Hannon, B.; Limburg, K.E. The value of the world's ecosystem services and natural capital. Nature 1987, 387, 253–260. [Google Scholar] [CrossRef]
- Liu, G.; Brown, M.T.; Casazza, M. Enhancing the sustainability narrative through a deeper understanding of sustainable development indicators. Sustainability 2017, 9, 1078. [Google Scholar] [CrossRef]
- Chen, S.Q.; Chen, B. Energy efficiency and sustainability of complex biogas systems: A 3-level emergetic evaluation. Appl. Energy 2014, 115, 151–163. [Google Scholar] [CrossRef]
- Li, F.; Liu, X.S.; Hu, D.; Wang, R.; Yang, W.S.; Li, D.; Zhao, D. Measurement indicators and an evaluation approach for assessing urban sustainable development: A case study for China’s Jining City. Landsc. Urban Plan. 2009, 90, 134–142. [Google Scholar] [CrossRef]
- Liu, X.; Liu, G.; Yang, Z.; Chen, B.; Ulgiati, S.; Kazmerski, L. Comparing national environmental and economic performances through emergy sustainability indicators: Moving environmental ethics beyond anthropocentrism toward ecocentrism. Renew. Sustain. Energy Rev. 2016, 58, 1532–1542. [Google Scholar] [CrossRef]
- Sweeney, S.; Cohen, M.J.; King, D.M.; Brown, M.T. Creation of a Global Emergy Database for Standardized National Emergy Synthesis. In Proceedings of the 4th Biennial Emergy Research Conference, Gainesville, FL, USA, 19–21 January 2006. [Google Scholar]
Figure 1.
Geographic location and three economic zones of Zengcheng.

Figure 2.
Emergy system in Zengcheng.

Figure 3.
Changes in the total input emergy, non-renewable emergy, foreign input emergy, and renewable emergy in Zengcheng, 2000–2016.
Figure 3.
Changes in the total input emergy, non-renewable emergy, foreign input emergy, and renewable emergy in Zengcheng, 2000–2016.

Figure 4.
Changes of emergy yield ratio (EYR), 2000–2016.

Figure 5.
Changes in emergy use per unit land, the ratio of emergy use to GDP, and emergy use per capita, 2000–2016.
Figure 5.
Changes in emergy use per unit land, the ratio of emergy use to GDP, and emergy use per capita, 2000–2016.

Figure 6.
The changes of environmental loading ratio (ELR), Ratio of waste to yield, and ratio of waste to total import (EWR), 2000–2016.
Figure 6.
The changes of environmental loading ratio (ELR), Ratio of waste to yield, and ratio of waste to total import (EWR), 2000–2016.

Figure 7.
Changes of emergy sustainability index (ESI), 2000–2016.

Table 1.
The types and resources of emergy.
| Types | Resources | Emergy Code |
|---|---|---|
| Local renewable energy | Sunlight, wind, rain, earth cycle | EmR1 |
| Local renewable resources | Foods (Grain, vegetable, fruit, egg, meat, fishery) | EmR2 |
| Import renewable resources | Foods (Grain, vegetable, fruit, egg, meat) | EmR3 |
| Local non-renewable resources | Water, electricity, metal, cement, oil | EmN1 |
| Import non-renewable resources | Coal, fuel oil, metal | EmN2 |
| Foreign Import | Foreign assets, international tourism income | EmIMP1 |
| Net Output | GDP, total annual exports | EmY |
| Wastes | Solid waste, waste water, waste gas | EmW |
Note: The total import emergy (EmU) = EmR1 + EmR2 + EmR3 + EmN1 + EmN2 + EmIMP1; External input emergy (EmIMP) = EmR3 + EmN2 + EmIMP1. Foods, solid waste, waste water, waste gas, water, metal, cement, coal and fuel oil are measured in unit of tons; Foreign assets, international tourism income, foreign assets, total annual exports and GDP are measured in the unit of USD; electricity are measured in the unit of kWh.
Table 2.
Emergy evaluation index system.
| First-Level Indicator | Second-Level Indicator | Formula |
|---|---|---|
| Structure | Ratio of renewable emergy | (EmR1 + EmR2 + EmR3)/EmU |
| Ratio of non-renewable emergy | (EmN1 + EmN2)/EmU | |
| Ratio of foreign import emergy | EmIMP1/EmU | |
| Function | Emergy to money ratio (EMR) | EmU/GDP |
| Emergy yield ratio (EYR) | EmU/EmIMP | |
| Emergy use per person | EmU/Population | |
| Emergy use per unit area | EmU/A | |
| Efficiency | Environmental loading ratio (ELR) | (EmU − EmR1 − EmR2)/(EmR1 + EmR2) |
| Ratio of waste to total import (EWR) | EmW/EmU | |
| Ratio of waste to yield | EmW/EmY | |
| Comprehensive index | Emergy sustainability index (ESI) | EYR/ELR |
Table 3.
Emergy of inputs and outputs at Zengcheng (unit: seJ).
| Emergy | 2000 | 2001 | 2002 | 2003 | 2004 | 2005 | 2006 | 2007 | 2008 | 2009 | 2010 | 2011 | 2012 | 2013 | 2014 | 2015 | 2016 |
|---|---|---|---|---|---|---|---|---|---|---|---|---|---|---|---|---|---|
| Local renewable energy (×1020) | 5.42 | 5.98 | 4.29 | 4.01 | 3.47 | 5.71 | 6.56 | 4.93 | 6.78 | 4.87 | 5 | 3.78 | 5.18 | 5.46 | 5.34 | 6.47 | 6.98 |
| Import renewable resources (×1020) | 8.45 | 11.11 | 12.63 | 7.19 | 11.09 | 11.83 | 15.84 | 10.77 | 10.54 | 10.03 | 16.93 | 12.74 | 9.89 | 10.64 | 11.27 | 10 | 11.63 |
| Local renewable resources (×1021) | 7.15 | 6.7 | 7.25 | 7.34 | 6.55 | 6.49 | 5.68 | 6.31 | 5.86 | 5.54 | 4.72 | 5.11 | 5.24 | 5.07 | 5.31 | 5.4 | 5.67 |
| The total renewable emergy (×1021) | 7.99 | 7.81 | 8.51 | 8.05 | 7.66 | 7.67 | 7.26 | 7.38 | 6.91 | 6.55 | 6.41 | 6.38 | 6.23 | 6.13 | 6.43 | 6.4 | 6.84 |
| Import non-renewable resources (×1021) | 2.32 | 2.27 | 2.29 | 2.31 | 2.34 | 2.44 | 2.54 | 3.13 | 3.31 | 3.3 | 4.09 | 4.52 | 5.3 | 5 | 5.11 | 5.23 | 6.05 |
| Local non-renewable resources (×1021) | 8.84 | 9.4 | 10.92 | 13.58 | 14.1 | 15.51 | 16.39 | 16.48 | 15.23 | 15.49 | 16.8 | 17.29 | 17.2 | 18.47 | 18.32 | 20.8 | 21.5 |
| The non-renewable resources (×1022) | 1.12 | 1.12 | 1.17 | 1.32 | 1.59 | 1.64 | 1.79 | 1.89 | 1.96 | 1.85 | 1.88 | 2.09 | 2.18 | 2.25 | 2.35 | 2.61 | 2.75 |
| Foreign input (×1020) | 5.88 | 7.2 | 7.95 | 8.32 | 10.23 | 12.19 | 14.51 | 19.93 | 17.98 | 17.98 | 25.16 | 28.07 | 21.31 | 19.38 | 19.9 | 14.1 | 14.4 |
| Net output (×1022) | 1.65 | 1.91 | 2.11 | 2.46 | 2.86 | 3.42 | 4.3 | 5.33 | 6.49 | 7.15 | 9.08 | 10.84 | 11.93 | 14.01 | 14.36 | 15.2 | 16.6 |
| Wastes (×1020) | 5.62 | 6.75 | 7.24 | 8.47 | 9.36 | 8.28 | 9.34 | 8.13 | 9.22 | 10.24 | 11.35 | 9.97 | 9.08 | 8.68 | 6.86 | 9.23 | 10.1 |
Table 4.
Changes in the emergy evaluation index of the circular economy.
| 2000 | 2001 | 2002 | 2003 | 2004 | 2005 | 2006 | 2007 | 2008 | 2009 | 2010 | 2011 | 2012 | 2013 | 2014 | 2015 | 2016 | |
|---|---|---|---|---|---|---|---|---|---|---|---|---|---|---|---|---|---|
| EYR | 5.41 | 5.07 | 5.28 | 6.52 | 5.70 | 5.66 | 5.08 | 4.76 | 4.53 | 4.53 | 3.65 | 3.65 | 3.73 | 4.01 | 3.94 | 4.52 | 4.22 |
| ELR | 1.64 | 1.85 | 1.99 | 2.25 | 2.69 | 2.88 | 3.47 | 3.34 | 3.27 | 3.58 | 4.81 | 4.72 | 4.45 | 4.71 | 4.55 | 4.71 | 4.73 |
| Ratio of waste to yield (%) | 3.41 | 3.53 | 3.43 | 3.45 | 3.28 | 2.42 | 2.17 | 1.53 | 1.42 | 1.43 | 1.25 | 0.92 | 0.76 | 0.62 | 0.48 | 0.61 | 0.61 |
| Ratio of emergy use to GDP (seJ/$10,000) | 12.15 | 10.8 | 10.66 | 10.02 | 8.86 | 8.33 | 7.01 | 6.03 | 6.03 | 4.53 | 3.93 | 3.50 | 2.96 | 2.64 | 2.33 | 2.24 | 2.28 |
| EWR (%) | 2.77 | 3.25 | 3.16 | 3.36 | 3.68 | 3.02 | 3.30 | 2.76 | 3.30 | 3.71 | 3.74 | 3.18 | 2.89 | 2.70 | 2.12 | 2.67 | 2.77 |
| ESI | 3.30 | 2.74 | 2.66 | 2.89 | 2.12 | 1.96 | 1.46 | 1.43 | 1.38 | 1.26 | 0.76 | 0.77 | 0.84 | 0.85 | 0.87 | 0.96 | 0.89 |
© 2018 by the authors. Licensee MDPI, Basel, Switzerland. This article is an open access article distributed under the terms and conditions of the Creative Commons Attribution (CC BY) license (http://creativecommons.org/licenses/by/4.0/).
Share and Cite
MDPI and ACS Style
Liu, W.; Zhan, J.; Li, Z.; Jia, S.; Zhang, F.; Li, Y. Eco-Efficiency Evaluation of Regional Circular Economy: A Case Study in Zengcheng, Guangzhou. Sustainability 2018, 10, 453. https://doi.org/10.3390/su10020453
AMA Style
Liu W, Zhan J, Li Z, Jia S, Zhang F, Li Y. Eco-Efficiency Evaluation of Regional Circular Economy: A Case Study in Zengcheng, Guangzhou. Sustainability. 2018; 10(2):453. https://doi.org/10.3390/su10020453
Chicago/Turabian StyleLiu, Wei, Jinyan Zhan, Zhihui Li, Siqi Jia, Fan Zhang, and Yifan Li. 2018. "Eco-Efficiency Evaluation of Regional Circular Economy: A Case Study in Zengcheng, Guangzhou" Sustainability 10, no. 2: 453. https://doi.org/10.3390/su10020453
Note that from the first issue of 2016, this journal uses article numbers instead of page numbers. See further details here.