Blue Water Footprint Management in a UK Poultry Supply Chain under Environmental Regulatory Constraints


1
Centre for International Manufacturing, Institute for Manufacturing (IfM), Department of Engineering, School of Technology, University of Cambridge, Cambridge CB3 0FS, UK
2
Laboratory of Statistics and Quantitative Analysis Methods, Division of Industrial Management, Department of Mechanical Engineering, Aristotle University of Thessaloniki, P.O. Box 461, 54124 Thessaloniki, Greece
*
Author to whom correspondence should be addressed.
Sustainability 2018, 10(3), 625; https://doi.org/10.3390/su10030625
Submission received: 18 January 2018
/
Revised: 22 February 2018
/
Accepted: 23 February 2018
/
Published: 28 February 2018
(This article belongs to the Special Issue Water Footprint in Supply Chain Management)
Abstract
:Chicken is the most consumed meat in the UK, accounting for 40% of meat consumption, while national production sufficiency reaches about 80%. As a farmed animal product, chicken meat is responsible for significant freshwater appropriation volumes during its production cycle. In this context, this research aims at exploring freshwater dynamics in the UK processed poultry industry. Specifically, we develop a System Dynamics model to capture the blue water footprint, as a key sustainability performance indicator of a poultry supply chain, in the case that relevant environmental and regulatory constraints are applied. The model contributes towards investigating the impact of two potential policy-making scenarios, namely, the “water penalty” and the “water tax”, on the nexus between profitability and water usage across the poultry supply chain. Responding to the regulatory constraints, the food processor either reconfigures the supply chain through rethinking desired inventory levels or implements a water management intervention. The results indicate that investing in water-friendly production technologies could offer a greater advantage to sustainable supply chains in terms of blue water efficiency and profitability, compared to employing inventory management strategies. Overall, our analysis highlights that effective policy-making and technology-driven interventions could provide potential towards ensuring economic growth and environmental sustainability of the UK poultry sector.
1. Introduction
Food production requires significant amounts of natural resources, particularly that of freshwater [1]. In general, the production of animal-based food is responsible for greater water use compared to the production of plant-based food [2]. Nowadays, the water footprint (WF) of animal products is equal to one-third of the total WF of all agricultural production [3]; this ratio is expected to increase [4], given the rapid global transition in nutrition to richer food consumption patterns that include more animal products [5]. Notably, within the scientific literature, the WF assessment of livestock and dairy products constitutes more than 25% of the studies in the wider agrifood sector [6].
Focusing on the British food industry, poultry chicken meat constitutes the most consumed meat product, accounting for 40% of meat consumption in the UK, while the national self-sufficiency of chicken production is approximately 80% [7]. With respect to the water impact of the poultry industry, the WF of chicken products is normally the lowest among other meat products, such as pork, beef, or sheep meat [2,8]; however, this may occasionally differ depending on the food conversion efficiency, as well as the food composition and origin [9,10]. Compared to other agricultural products, such as cereals or fresh vegetables, poultry meat exhibits higher consumptive WF, which further relates to the additional feed and the food conversion ratios [11].
The high requirements of freshwater resources in the poultry industry, along with the increased consumption and production of processed chicken meat in the UK, highlight the need for water stewardship initiatives in the sector. Outside the UK, few chicken-related food processing companies have already incorporated water management strategies, such as the treatment, recycle, and reuse of wastewater, to reduce the WF of their products [12,13]. However, to the best of our knowledge, there is an absence of poultry industries within the country that focus on mitigating the water usage of food production. This fact may be further supported by the lack of water-related environmental regulations [14] that would either set a price/tax to water appropriation reflecting water scarcity or impose a penalty to farmers and food manufacturers in the case that their water use exceeds a certain limit/cap [15]. The legislative scheme has become somewhat tougher only under the Water Framework Directive (Directive 2000/60/EC) that sets targets to European Member States for the preservation of freshwater resources [16].
In this context, the aim of this paper is to investigate the dynamics of the blue WF as a main indicator of freshwater consumption [17] in the UK processed poultry industry, in the case that relevant environment-driven regulatory constraints are applied. The green WF (i.e., rain water consumed [17]) of the feed production and the grey WF (i.e., freshwater required for diluting contaminated water [18]) of the poultry processing are excluded from the analysis. In addition, since this paper examines the volumetric amount of freshwater consumed during poultry breeding and meat processing, our analysis is based on the WF assessment manual [17]. As this study focuses mainly on freshwater productivity from an economic perspective, the impact assessment of water use on natural resources, which constitutes a core phase of water-related life cycle assessment approaches [19,20], is not taken into consideration at this point.
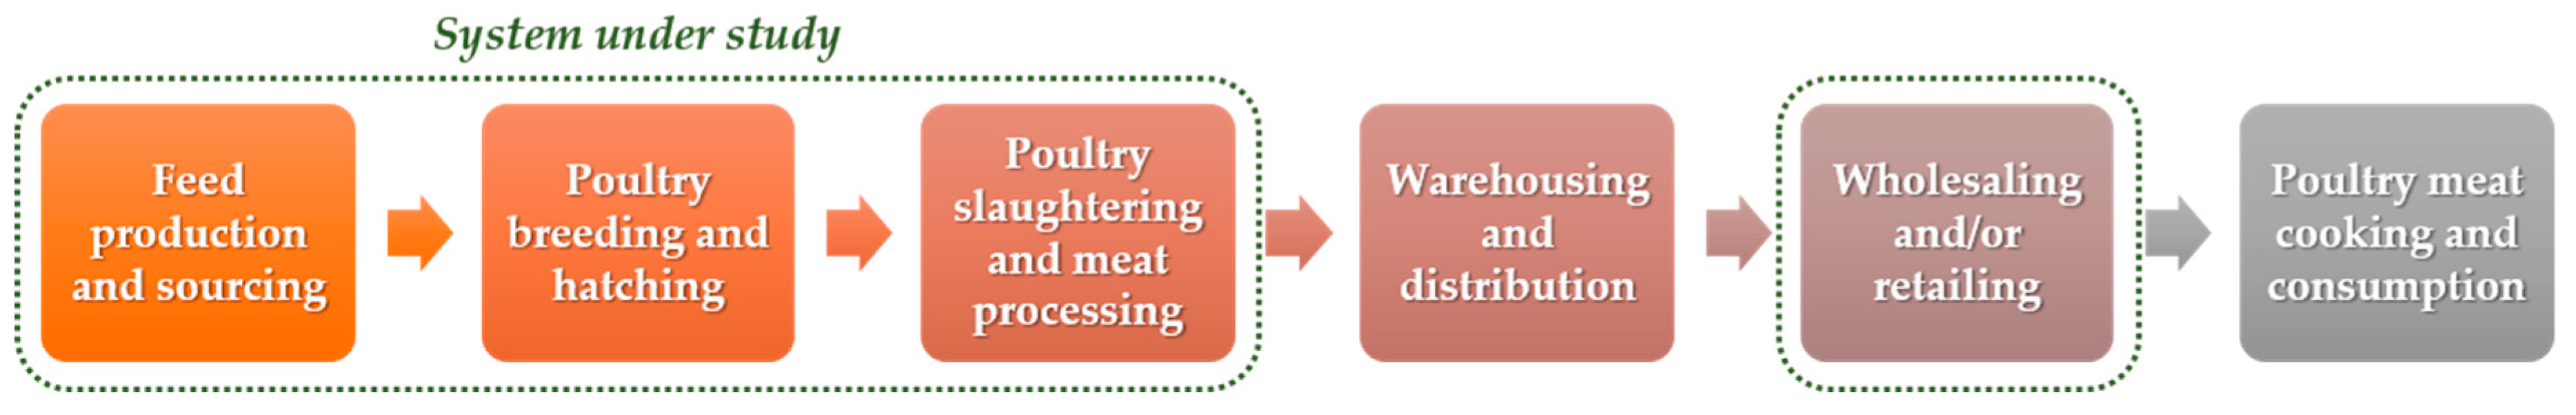
Figure 1 represents a typical poultry supply chain. However, the system under study considers the first three stages of the supply chain, which demonstrate the major freshwater requirements of the poultry industry, and the retailing stage, for assessing the profitability of the system according to the consumers’ demand.
Building upon our previous research effort in the field of WF mitigation using the System Dynamics (SD) methodology [21], we developed a novel simulation-based model for capturing both water use and profitability in a processed chicken supply network under two potential regulation schemes, namely, the “water penalty” and the “water tax”. Overall, this research work contributes towards: (i) assisting decision-makers in the poultry industry in selecting between the reconfiguration of the supply chain and the implementation of water management technological interventions to respond effectively to environmental regulations; (ii) providing suggestions to policy-makers with regard to the viability of the proposed water-related regulations.
The remainder of the paper is structured as follows. In Section 2, the SD method is described, and a corresponding modelling framework is developed for assessing the environmental and economic sustainability impact of alternative policy-making scenarios under water-related constraints. The application of the proposed framework is illustrated by the real-world case study of a poultry supply chain in the UK. The results of the system’s dynamic behaviour are presented in Section 3, while a brief discussion of the obtained insights is performed in Section 4. Finally, conclusions and recommendations for future research are discussed in Section 5.
2. Materials and Methods
Considering the dynamic evolution of food consumption, along with the related freshwater appropriation ramifications, this paper adopts a systems engineering-driven approach towards food supply chain design and therefore applies the SD methodology to support decision-making on water sustainability [22]. SD is a simulation methodology for analysing the non-linear behaviour of complex systems over time, supporting institutions and organisations in understanding the long-term impact of management policies [23]. The first step of the SD approach is to represent the actual system as a causal loop diagram, including the interactions among the system’s variables and parameters. The next step involves the interpretation of the causal loop diagram into a dynamic simulation model, including stock and flow variables, time delays, auxiliary variables, and constants. More specifically, stock variables are states that represent accumulations within the system, while flow variables are rates that fill or empty the stock variables. Essentially, an SD model constitutes a system of: (i) integral equations expressing the integration of flows into stock variables; (ii) supplementary equations connecting the model’s variables through mathematical functions.
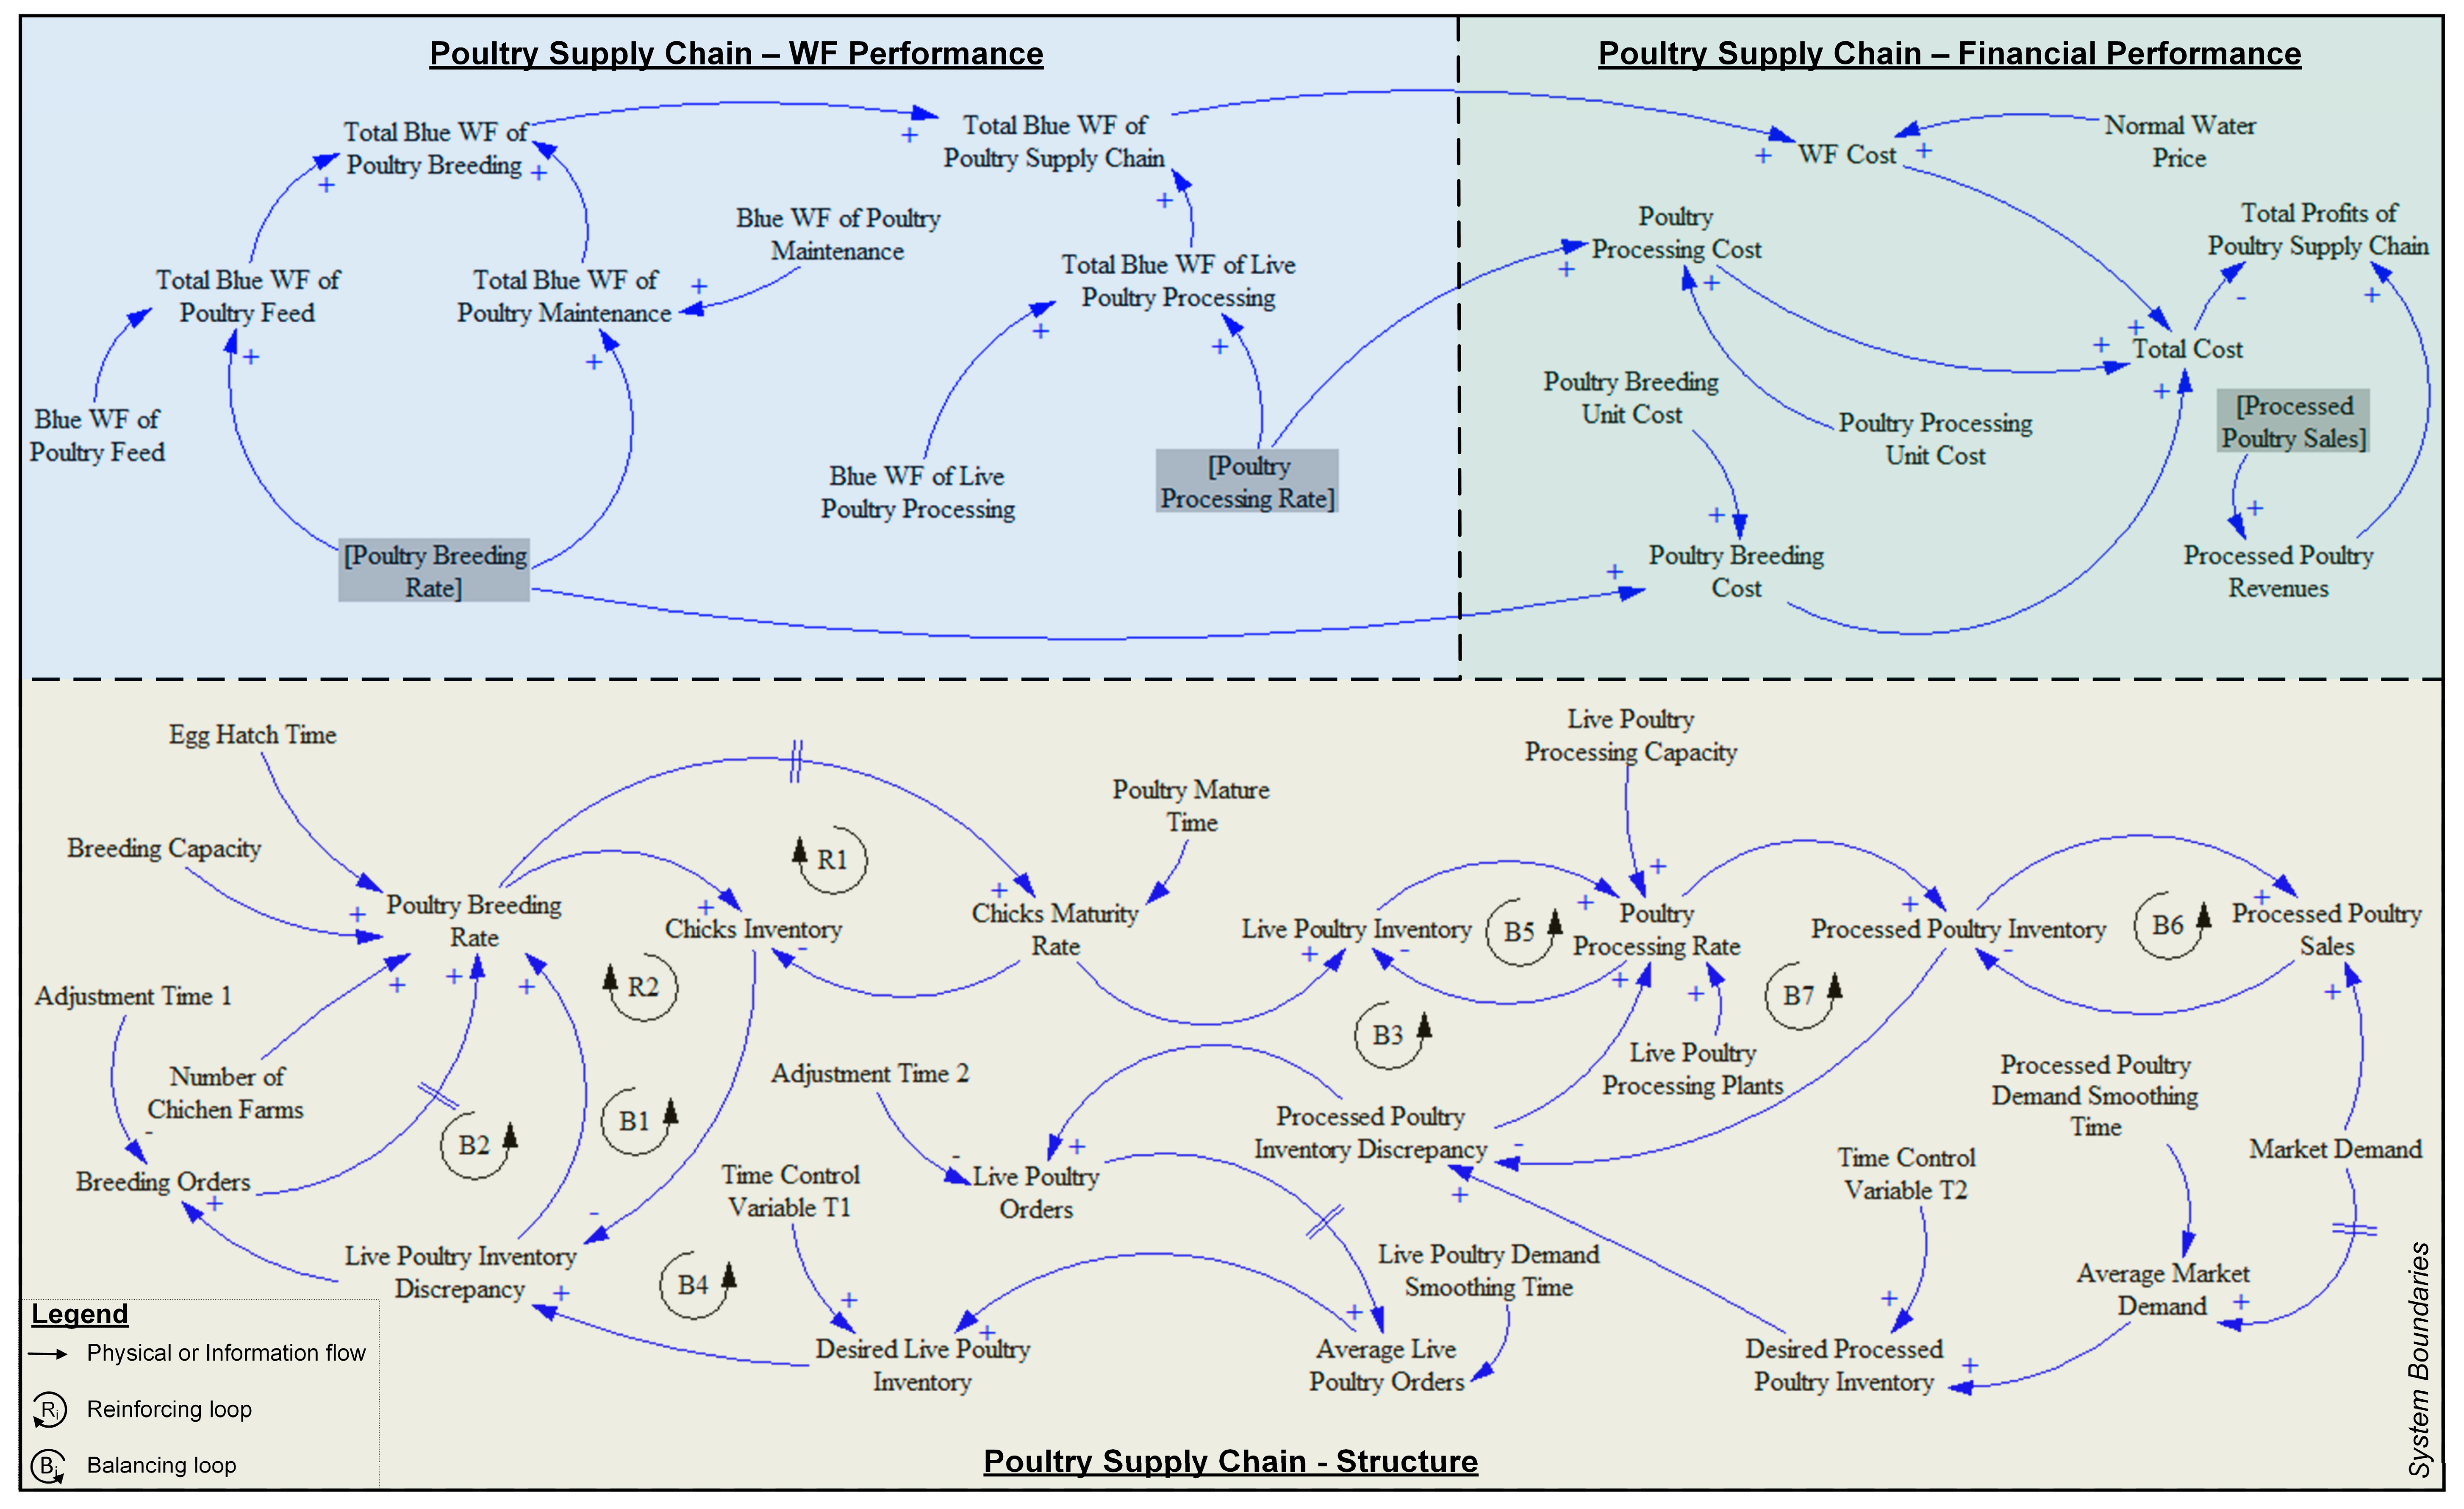
Figure 2 illustrates the causal loop diagram of the processed poultry supply network that captures all feedback structures of the system, along with the causes of dynamics. In the causal loop diagram, two reinforcing and seven balancing loops are represented, as specified in Table A1 in Appendix A. The poultry supply system under study is comprised of two discrete levels of operations, namely, the live chicken breeding and the processed chicken production echelons. Each stage is responsible for the direct consumption of freshwater. Specifically, chicken breeding accounts for the blue (i.e., consumptive) WF of poultry feed, watering, and cleaning, while chicken production is related to the blue WF of meat processing. We clarify that the supply chain under study does not focus on breeding hens for egg production, but rather for serving white meat demand. In addition, we quantify the costs of breeding and processing and we calculate the supply chain profits by taking into consideration the costs and revenues associated with processed chicken meat sales.
Furthermore, we consider the implementation of two potential water-related environmental regulations, namely, the “water penalty” and the “water tax”. In the “water penalty” regulatory scheme, a fixed penalty cost is imposed in case the consumptive WF exceeds a certain cap. In the “water tax” case, high taxation is imposed on the normal water price for any excessive volume of freshwater used above the cap. To respond to the “water penalty” and the “water tax” regulations, the processed chicken producer proceeds separately to the following interventions: (i) reconfiguring the poultry supply chain in terms of adjusting the desired processed poultry inventory level (henceforth referred to as the “Reconfiguration” scenario), or (ii) implementing a technological intervention for improving water management in the poultry processing stage, for example, wastewater recycling and reuse (henceforth referred to as the “Water Policy” scenario).
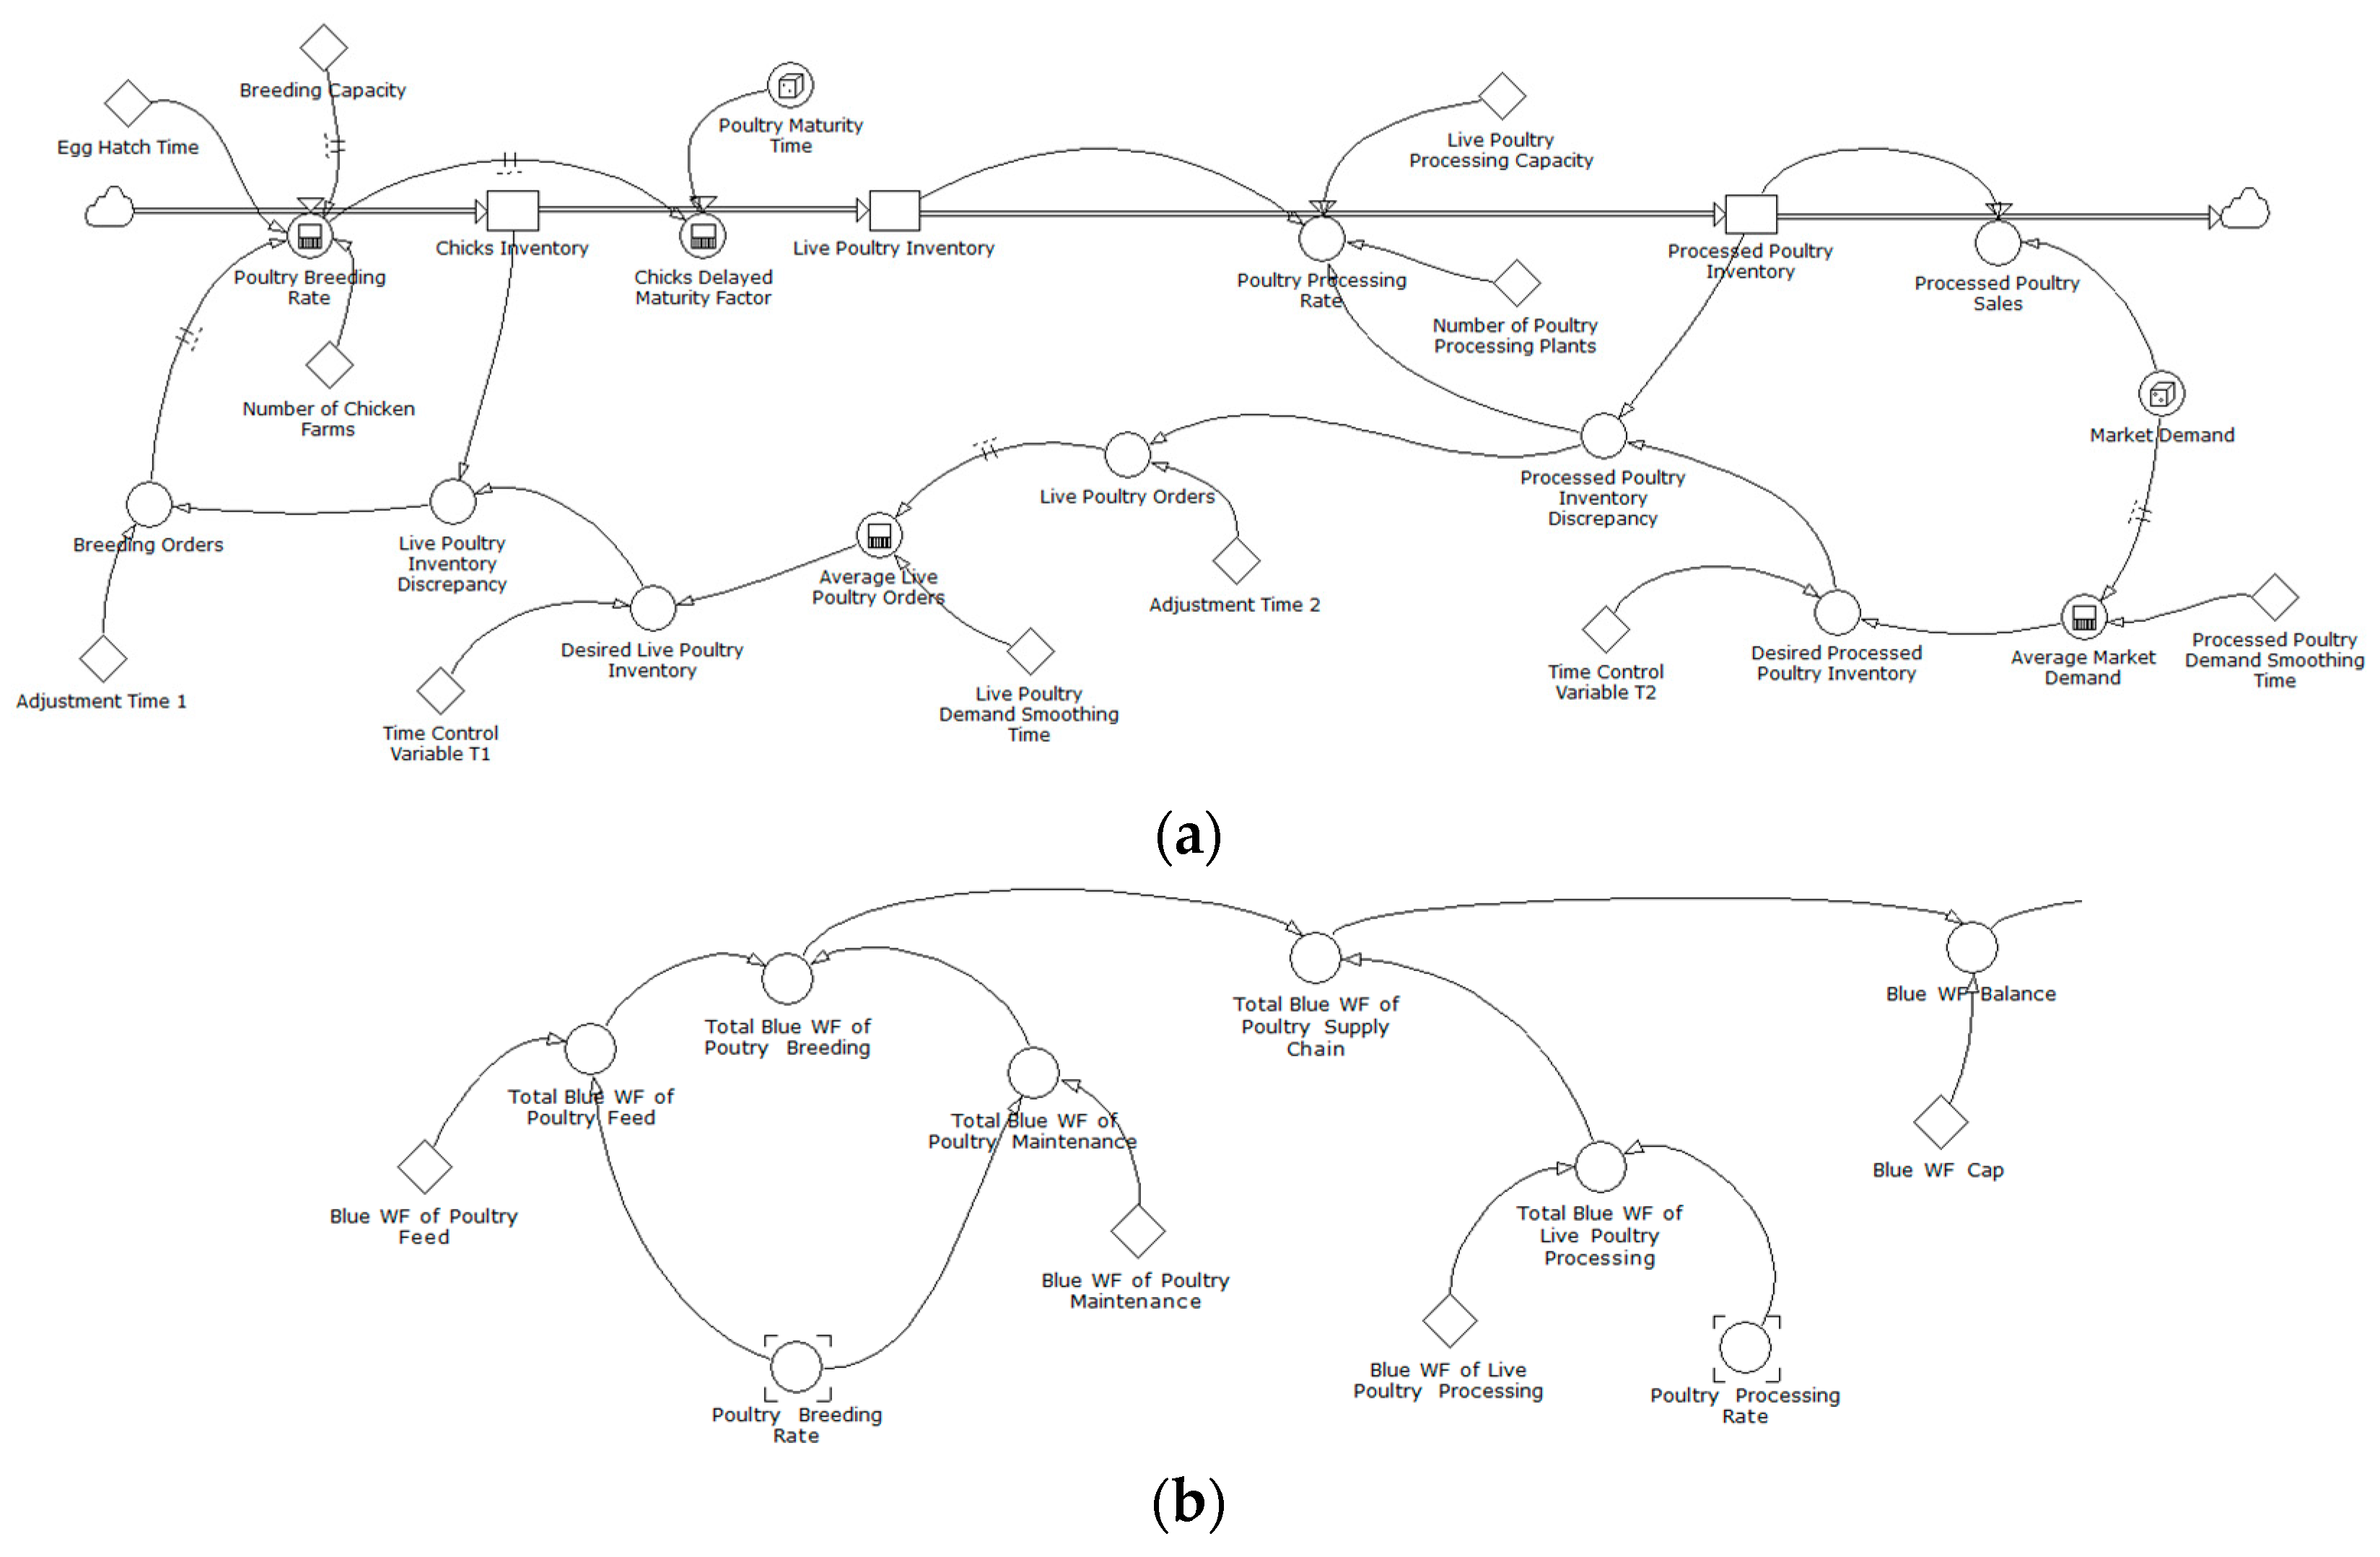
To demonstrate the applicability of the proposed SD framework, we developed a corresponding simulation model using the SD software Powersim® Studio 10 Academic (Bergen, Norway). To evaluate the enviro-economic performance of the system, the SD model investigates the impact of the policy interventions on the blue WF (in litres) and the profitability (in British Pounds) of the entire poultry supply chain over a strategic time horizon of five years (with a simulation time step of one month), assuming no processed meat demand growth. The stock and flow diagram of the processed poultry supply chain is presented in Figure 3a. Secondary data is the object of scrutiny in this research. In particular, the chicken egg hatching time is set to 21.5 days [24], with the mature chicken slaughter age typically ranging between 21 and 170 days (on average 5 to 7 weeks) [25], at an average weight of 2.6 kg per live poultry. The pullet-raising farm (or broiler breeder rearing house) has a recommended capacity of about 11,000 birds [26], while a typical poultry meat processing industry has a maximum capacity of 12,000 chickens [27]. On the demand side, in the UK, the annual consumption of poultry meat in 2015 was estimated at approximately 35.4 kg per capita [28].
In terms of WF (Figure 3b), we utilise secondary data provided by Ibidhi et al. [8]. In particular, the blue WF of feed is considered to be 2.5 litres per kilogram, while the blue WF of poultry maintenance (i.e., drinking and service water) is 6.2 litres per kilogram. In terms of cost (Figure 3c,d), the breeding cost per poultry unit is approximately £1.126 to achieve the weight for culling [29], while the poultry processing cost is estimated at approximately £0.6 per unit [30]. The typical water charges are estimated at £0.0022525 per litre (including freshwater appropriation and wastewater treatment charges) [31]. Furthermore, the SD model is based on the assumptions that the resulting processed chicken meat has a retail price of £3.5 per kilogram [28] and that only a proportion of the UK population is served.
Considering the defined regulatory schemes, an annual fixed charge of £15,766 is assumed for the “water penalty” regulation [31] (Figure 3c), while an increased taxation rate of 35% is assumed for the “water tax” case (Figure 3d). In response to the aforementioned regulatory schemes, the processed chicken producer applies either of the following interventions: (i) the adjustment of the desired processed poultry inventory level by decreasing the respective time control variable from 3 to 2 months; (ii) the implementation of a water-friendly poultry processing technology that reduces the processing blue WF from 8 to 3.5 litres per unit of live poultry processed [32]. Table A2 in Appendix A contains the mathematical equations and parameters that justify the SD model. The developed SD simulation model was tested concerning its validity and reliability, while further verification analysis steps against the model’s structure and functionality were taken according to the tests described by Sterman [33].
3. Results
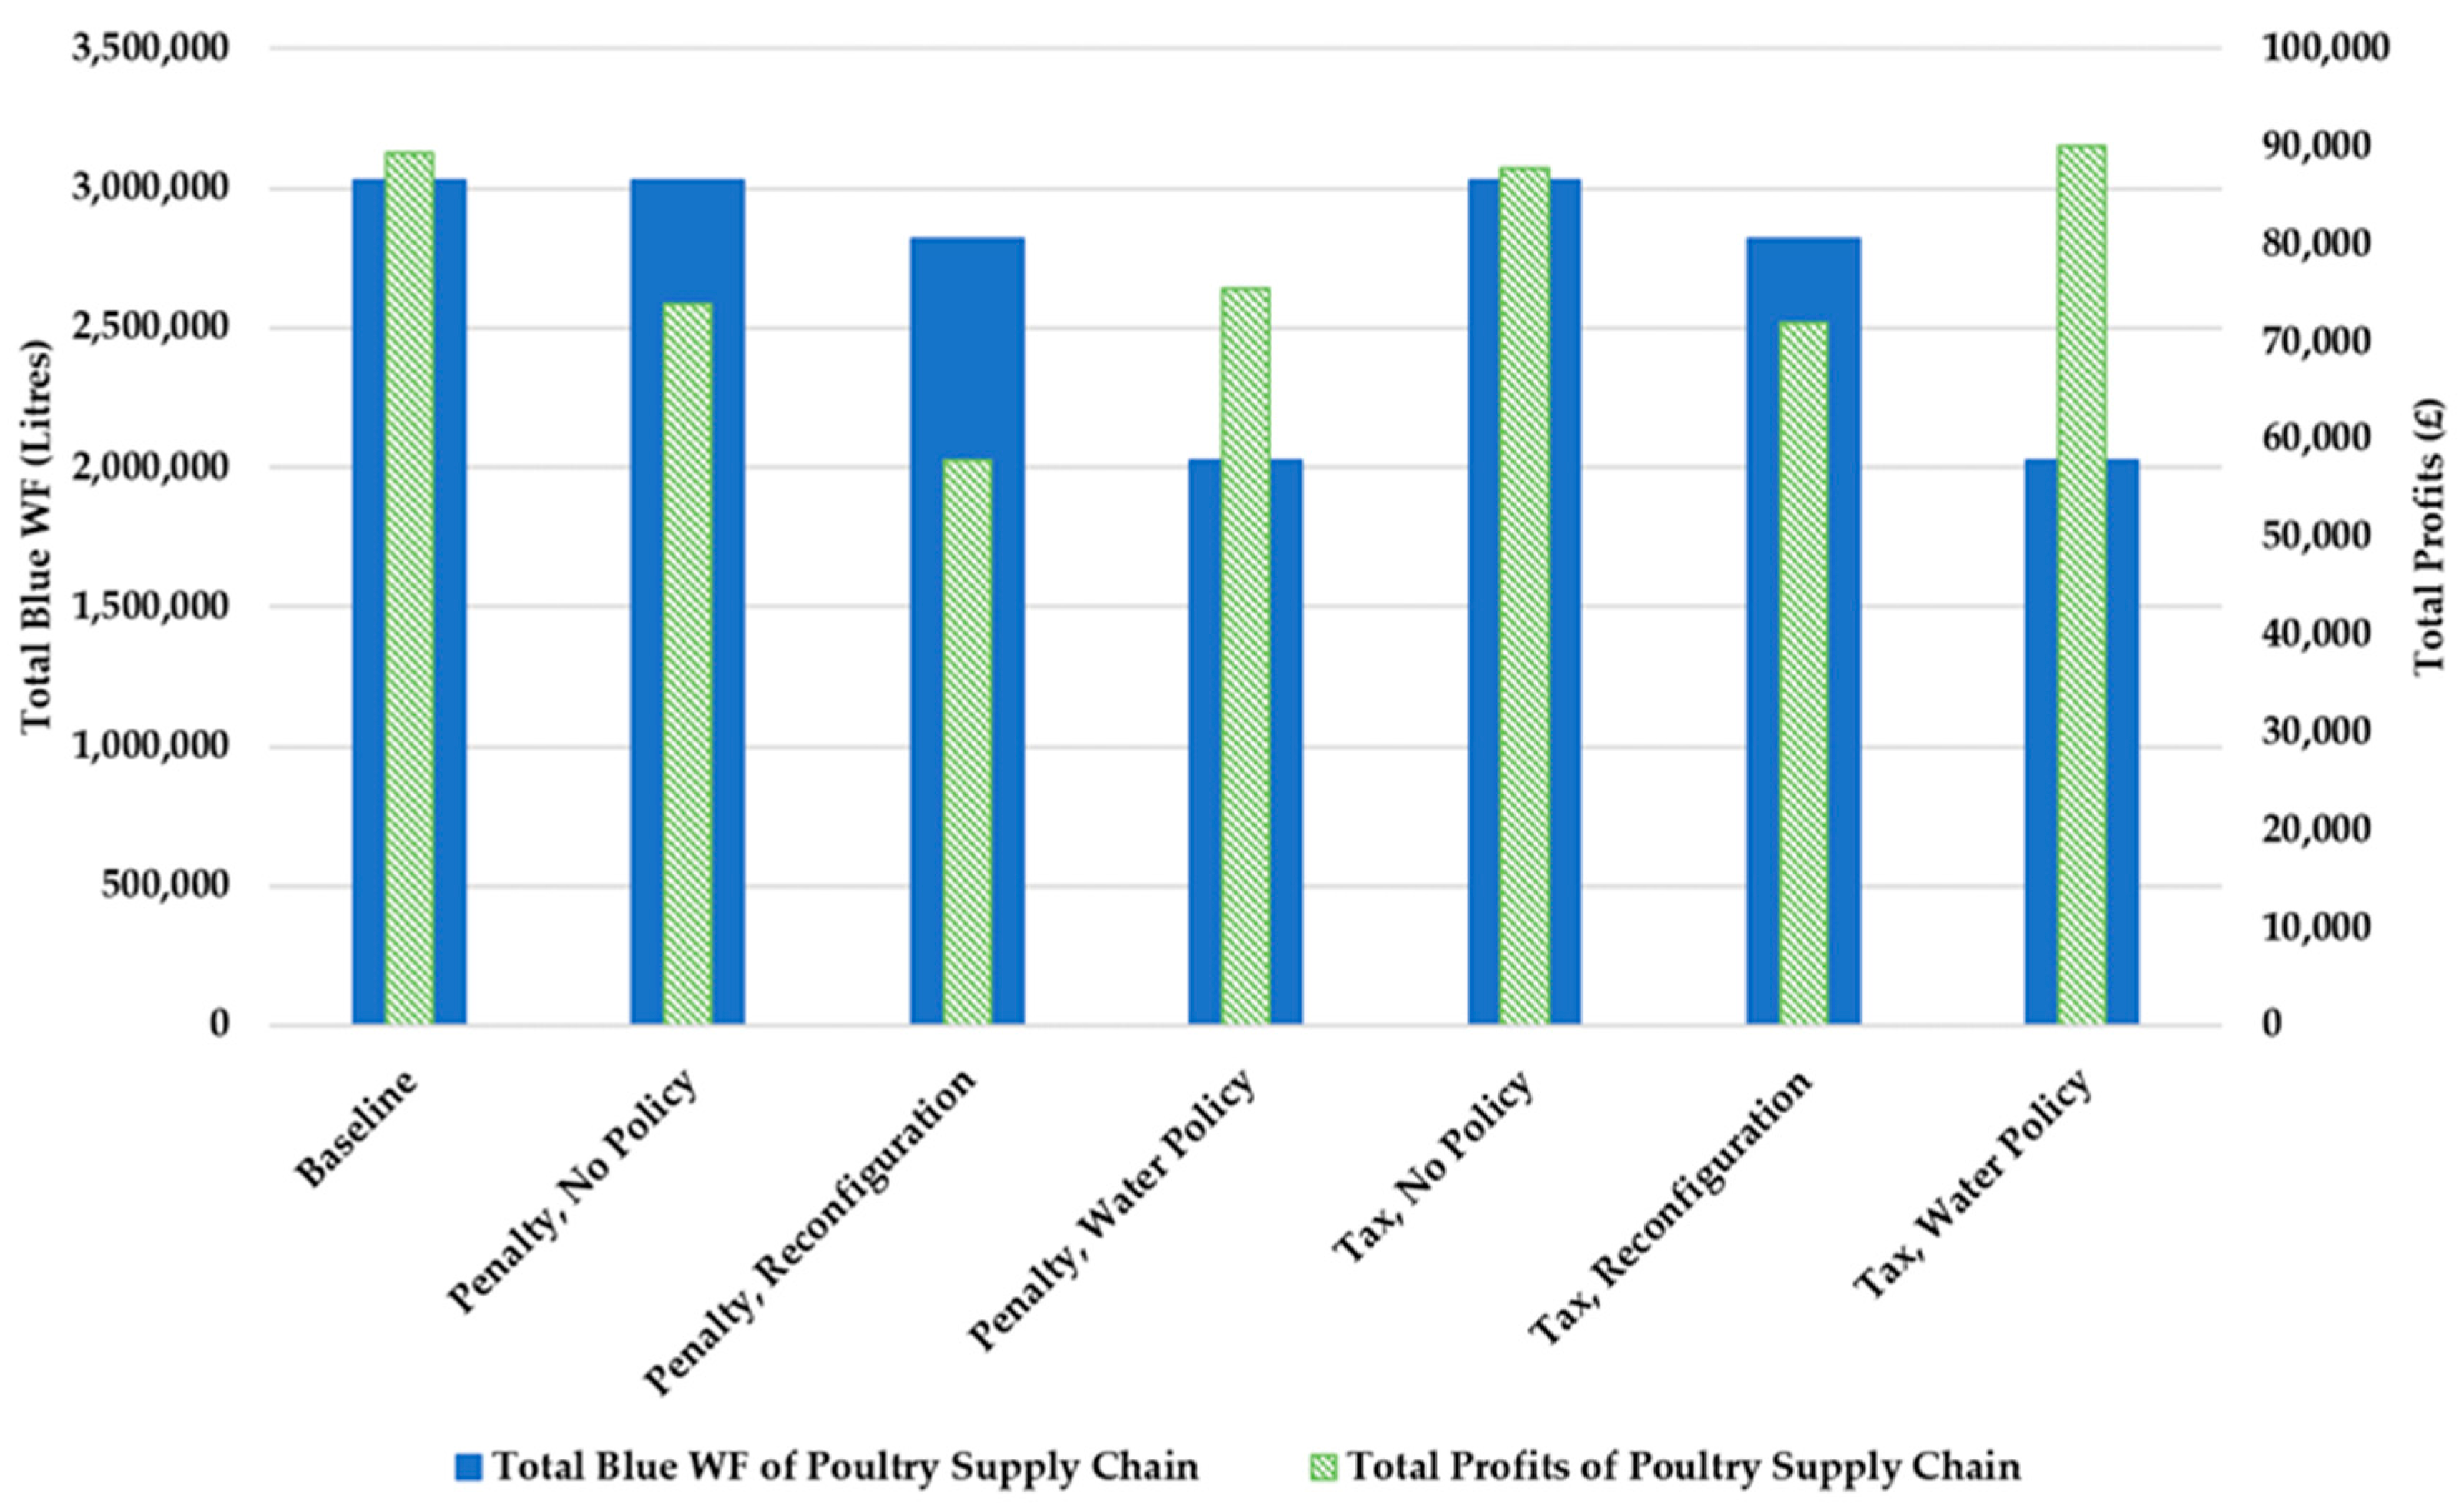
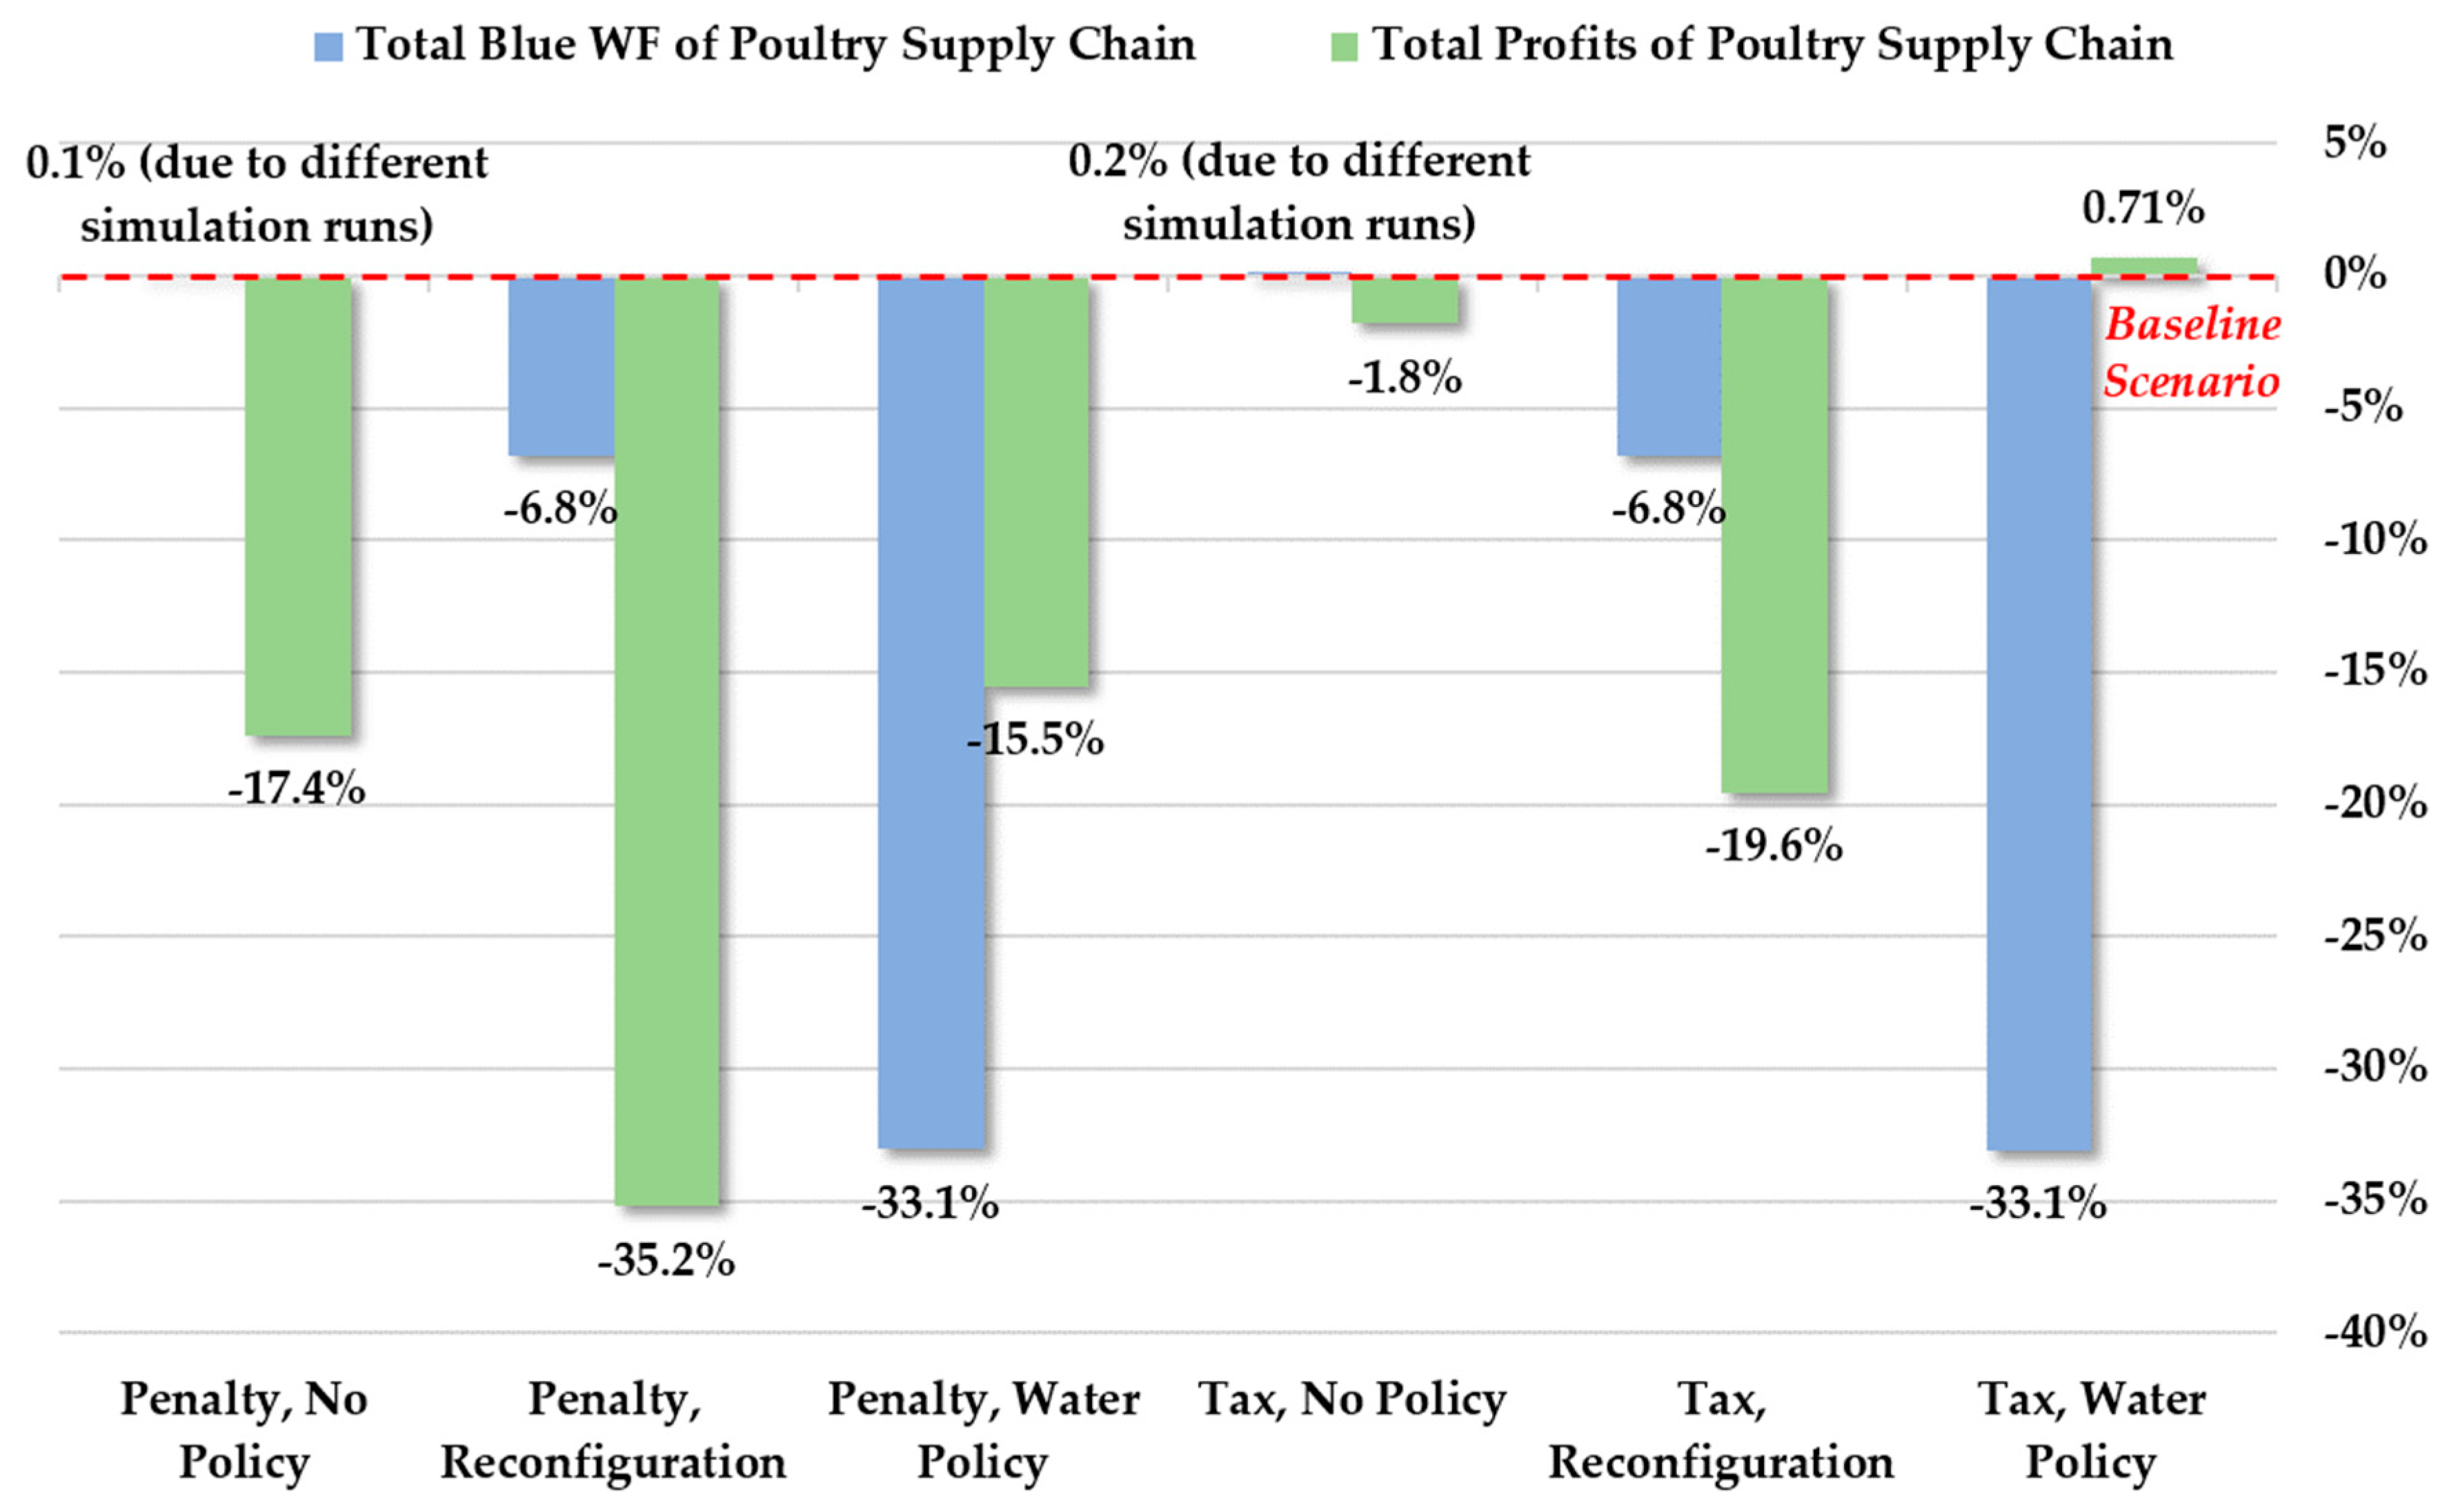
The simulation results demonstrate the impact of the alternative interventions on the blue WF generated and the profits of a specific poultry supply chain under “water tax” and “water penalty” regulations (Figure 4). In the “Baseline” scenario, the poultry supply chain under study operates with the assumption of no regulatory schemes being imposed and no policy interventions on the system. In this sense, the supply chain profits and blue WF appropriation are influenced only by the inherent characteristics of the system’s end-to-end operations.
Next, in the “water penalty” regulatory case, the “No Policy” scenario results in a blue WF similar to the one of the “Baseline” scenario (the trivial WF variation is observed because of different simulation runs, as the supply chain and the water use systems remain the same), albeit with profits decreased by 17.4% under the induced penalty cost, as the supply chain stakeholders do not proceed to apply interventions to mitigate freshwater appropriation. Moreover, as the “Reconfiguration” scenario implies lower levels of desired processed poultry inventory, the resulting blue WF is reduced by 6.8%, while the yielded profits decrease significantly (−35.2%) as a consequence of lost sales. On the contrary, the “Water Policy” scenario associates with a fixed investment in water-friendly poultry processing technologies (applied at the beginning of the analysis period) to encourage water conservation, hence resulting in a decreased blue WF (−33.1%), while maintaining considerably lower market sales levels and profits (−15.5%) as compared to the “Baseline” scenario.
Furthermore, the “water tax” case demonstrates a similar impact to the “water penalty” case in terms of the blue WF, but a diversified financial performance. In particular, in the ‘No Policy’ scenario, both the environmental and profitability impacts are similar to the “Baseline” scenario. As in the “water penalty” case, the “Reconfiguration” scenario results in a slightly reduced blue WF (−6.8%) and profits (−19.6%). Compared to the “Baseline” scenario, the ‘Water Policy’ case further promotes freshwater appropriation reductions (−33.1%) due to the installation of advanced poultry processing technologies, while ensuring high profitability (+0.71%) as market sales increase in tandem with water tax savings. Figure 5 depicts the diversified impact of the applied interventions in each of the considered regulatory schemes, as compared to the “Baseline” scenario.
Overall, under both regulatory schemes, the “Reconfiguration” scenario results in the reduction of the blue WF compared to the “No Policy” scenario, along with decreased profits due to the associated losses in market sales. On the contrary, the “Water Policy” scenario implies significant freshwater savings in tandem with enhanced profitability. The implementation of the “Water Policy” scenario under a water taxation scheme appears to have the most desired impact in terms of blue WF and profits.
4. Discussion
This research sets out the development process for the systematic evaluation of WF, regulation-driven interventions, and firms’ profitability into viable food supply chain propositions. A systems analysis approach is adopted, beginning with supply chain assessment in terms of blue WF and costs at a poultry livestock farming level, then progressing to processing, while finally considering an end-to-end view.
The pursuit of truly sustainable supply networks exerts considerable pressure on the frontiers of environmental regulations and firms’ financial performance. In this sense, workable relationships among regulators, corporate actors, and research and institutional stakeholders are necessitated to support the development of viable food supply networks. Taking into consideration this perspective, this paper provides a simulation tool for assessing the impact of different regulations and interventions on supply networks in the poultry (i.e., chicken) meat sector. In the extant literature, few key studies that investigate the water-focused sustainability performance of poultry meat systems exist, taking, however, either a production [8,9,27,34] or consumption [2,11] viewpoint. Furthermore, our approach is unique in terms of capturing the dynamics in sustainability management across a poultry supply chain. In addition, the scope of our modelling approach clearly differentiates from existing publications that elaborate the SD methodology focusing either on evaluating carbon emissions [35] or recycling wastes [36] across poultry meat supply chains. The specific decision-making and policy-making insights deriving from our research results are described in the following subsections.
4.1. Business Decision-Making Insights
The simulation tool provided in this study can be applied by actors in the meat food industry to assess the environmental and economic sustainability impact of strategy-focused or technology-focused processing investments, in response to imposed water stewardship-oriented regulations. More specifically, considering the linear correlation of food processing operations to blue WF, our findings suggest that firms need to invest in water-friendly technologies to significantly reduce the resulting freshwater appropriation, while maintaining elevated market service levels and profitability. Exploring supply chain strategies that focus on desired inventory levels could lead to a slight reduction of the freshwater levels; however, this is not an economically viable option because of the resulting market sale losses. Generally, environmentally responsible supply chains could benefit from operating in markets with established taxation schemes to improve water efficiency and maintain profitability, while expecting further positive responsiveness by environmentally aware consumers.
4.2. Regulatory Policy-Making Insights
Decision-makers in charge of water resources management encounter the challenge of stimulating investments in freshwater management solutions towards reducing the WF of the existing industrial production systems. In this context, the proposed SD modelling framework could be employed by public authorities as a strategic policy-making tool for investigating the impact of alternative regulations. The simulation results indicate that regulations imposing a fixed monetary penalty are not as effective as schemes that inflict proportional taxation charges to expended water volumes exceeding a set water appropriation cap. However, the results reveal that manufacturers with considerable orders and poultry processing capacity are characterized by an elevated WF that renders them more sensitive to “water tax” incentives compared to “water penalty” schemes. On the contrary, small manufacturers are typically associated with low WF levels, and thus they are particularly sensitive to “water penalty” regulatory constraints.
5. Conclusions
WF management across industry supply chains arises as a pivotal issue in the public agenda; however, major regulations supporting a water-oriented corporate responsibility behaviour are lacking. In addition, a lack of approaches and tools that could be systematically used to evaluate WF appropriation across supply chains and assess the impact of tailored regulatory interventions is evident. The provision of such tools could also be used to motivate discussions among corporate stakeholders and communicate the associated environmental benefits in tandem with economic returns.
In this context, this paper proposes a first-effort SD modelling framework that captures WF use across a poultry supply chain in the UK, while an analysis of alternative policy-making scenarios indicates that public stakeholders should support investments in water-friendly food processing technologies to tackle natural resources overexploitation and promote corporate profitability.
The conceptual point of this study is not to provide optimised results about the WF of a poultry meat supply system in the UK. Rather, it lies in the fact that targeted financially driven regulations could motivate supply network-focused interventions with beneficial sustainability impact, and thus an SD approach should be considered [37]. The simulation tool developed in this paper can be usefully applied in other meat industries to facilitate comparative studies in the food sector at a supply network systems level. Although this study gives emphasis to a local supply chain system within UK borders, prospective research should extend towards global agrifood networks, given that a great number of food products are traded internationally, entailing further enviro-economic impacts due to virtual water trade [38].
Moreover, this work provides a simulation-based model that proposes the implementation of policy interventions under environmental regulations based on the freshwater volume consumed across supply chains. Future research efforts may upgrade the developed model by adding the assessment of the water use impact on water stress, scarcity, and/or degradation, as a part of a broader water-based life cycle analysis [20,39]. To this end, potential environmental regulations should incorporate the local aspect of water scarcity, further taking into consideration the global nature of modern supply networks.
Finally, the major limitation of this study is the reliance on secondary research data to develop the proposed simulation model. Hence, we envisage that the provided SD modelling approach could motivate focused applied research in the field to outline robust regulatory schemes that promote WF responsibility and water-sustainable food supply chains, both in the UK and internationally.
Acknowledgments
This research has received funding from the EPSRC under Reference No. EP/K02888X/1, Project Title: “Engineering Driven Sustainable Supply Networks—A UK/India Collaborative Study”.
Author Contributions
N.T. and J.S.S. conceived the general idea of the paper; E.A. designed the conceptual system; N.T. developed the model and performed the simulations; all authors analysed and discussed the results; N.T. and E.A. wrote and revised the paper.
Conflicts of Interest
The authors declare no conflict of interest.
Appendix A
Table A1 includes all feedback loop structures of the system under study, while Table A2 contains the values of the parameters and the expressions of the variables of the poultry supply chain.

Table A1.
Feedback loops.
| Feedback Loop | Causal Effect Sequence |
|---|---|
| R1 | Poultry Breeding Rate → Chicks Maturity Rate → Chicks Inventory → Live Poultry Inventory Discrepancy → Poultry Breeding Rate |
| R2 | Poultry Breeding Rate → Chicks Maturity Rate → Chicks Inventory → Live Poultry Inventory Discrepancy → Breeding Orders → Poultry Breeding Rate |
| B1 | Poultry Breeding Rate → Chicks Inventory → Live Poultry Inventory Discrepancy → Poultry Breeding Rate |
| B2 | Poultry Breeding Rate → Chicks Inventory → Live Poultry Inventory Discrepancy → Breeding Orders → Poultry Breeding Rate |
| B3 | Poultry Breeding Rate → Chicks Maturity Rate → Live Poultry Inventory → Poultry Processing Rate → Processed Poultry Inventory → Processed Poultry Inventory Discrepancy → Live Poultry Orders → Average Live Poultry Orders → Desired Live Poultry Inventory → Live Poultry Inventory Discrepancy → Poultry Breeding Rate |
| B4 | Poultry Breeding Rate → Chicks Maturity Rate → Live Poultry Inventory → Poultry Processing Rate → Processed Poultry Inventory → Processed Poultry Inventory Discrepancy → Live Poultry Orders → Average Live Poultry Orders → Desired Live Poultry Inventory → Live Poultry Inventory Discrepancy → Breeding Orders → Poultry Breeding Rate |
| B5 | Live Poultry Inventory → Poultry Processing Rate → Live Poultry Inventory |
| B6 | Processed Poultry Inventory → Processed Poultry Sales → Processed Poultry Inventory |
| B7 | Processed Poultry Inventory → Processed Poultry Inventory Discrepancy → Poultry Processing Rate → Processed Poultry Inventory |
Table A2.
Parameters’ values and variables’ expressions.
| Name | Type | Unit | Definition |
|---|---|---|---|
| Average Live Poultry Orders | auxiliary | chicken/month | DELAYINF(‘Live Poultry Orders’, ‘Live Poultry Demand Smoothing Time’, 1) |
| Average Market Demand | auxiliary | chicken/month | DELAYINF(‘Market Demand’, ’Processed Poultry Demand Smoothing Time’, 1) |
| Blue WF Balance | auxiliary | litre | ‘Total Blue WF of Poultry Supply Chain’-’Blue WF Cap’ |
| Breeding Orders | auxiliary | chicken/month | INTEGER((‘Live Poultry Inventory Discrepancy’/’Adjustment Time 1′)) * TIMESTEP |
| Chicks Delayed Maturity Factor | auxiliary | chicken | DELAYMTR(‘Poultry Breeding Rate’, ’Poultry Maturity Time’,6) |
| Desired Live Poultry Inventory | auxiliary | chicken/month | INTEGER(‘Average Live Poultry Orders’*’Time Control Variable T1′)/TIMESTEP |
| Desired Processed Poultry Inventory | auxiliary | chicken/month | INTEGER((‘Average Market Demand’*’Time Control Variable T2′))/TIMESTEP |
| Live Poultry Inventory Discrepancy | auxiliary | chicken/month | MAX(‘Desired Live Poultry Inventory’-’Chicks Inventory’, 0<<chicken>>) |
| Live Poultry Orders | auxiliary | chicken/month | INTEGER((‘Processed Poultry Inventory Discrepancy’/’Adjustment Time 2′)) * TIMESTEP |
| Market Demand | auxiliary | chicken/month | INTEGER(((NORMAL(1.36<<chicken>>, 0.3<<chicken>>))/12) * 6,5300,000/150)/TIMESTEP |
| Poultry Breeding Cost | auxiliary | pound | ‘Poultry Breeding Rate’*’Poultry Breeding Unit Cost’ |
| Poultry Breeding Rate | auxiliary | chicken | MIN(DELAYMTR(‘Breeding Capacity’,’Egg Hatch Time’, 3),INTEGER(DELAYMTR(‘Breeding Orders’, ’Egg Hatch Time’, 3))) * ’Number of Chicken Farms’ |
| Poultry Maturity Time | auxiliary | month | RANDOM(1.25,1.75) * TIMESTEP |
| Poultry Processing Cost | auxiliary | pound | ‘Poultry Processing Rate’ * ’Poultry Processing Unit Cost’ |
| Poultry Processing Investment Cost | auxiliary | pounds | PULSE(‘Poultry Processing Fixed Investment Cost’, 0<<month>>, 900,000<<month>>) |
| Poultry Processing Rate | auxiliary | chicken | INTEGER(MIN(‘Live Poultry Inventory’,’Processed Poultry Inventory Discrepancy’, ’Live Poultry Processing Capacity’ * ’Number of Poultry Processing Plants’)) |
| Processed Poultry Inventory Discrepancy | auxiliary | chicken/month | INTEGER(MAX(‘Desired Processed Poultry Inventory’-’Processed Poultry Inventory’, 0<<chicken>>)) |
| Processed Poultry Sales | auxiliary | chicken | INTEGER(MIN(‘Processed Poultry Inventory’,’Market Demand’)) |
| Processed Poultry Revenues | auxiliary | pound | ‘Processed Poultry Sales’ * ’Processed Poultry Unit Price’ |
| Total Blue WF of Live Poultry Processing | auxiliary | litre | ‘Blue WF of Live Poultry Processing’ * ’Poultry Processing Rate’ |
| Total Blue WF of Poultry Feed | auxiliary | litre | ‘Poultry Breeding Rate’ * ’Blue WF of Poultry Feed’ |
| Total Blue WF of Poultry Maintenance | auxiliary | litre | ‘Poultry Breeding Rate’ * ’Blue WF of Poultry Maintenance’ |
| Total Blue WF of Poultry Supply Chain | auxiliary | litre | ‘Total Blue WF of Poultry Breeding’ + ’Total Blue WF of Live Poultry Processing’ |
| Total Blue WF of Poultry Breeding | auxiliary | litre | ‘Total Blue WF of Poultry Feed’ + ’Total Blue WF of Poultry Maintenance’ |
| Total Cost | auxiliary | pound | Poultry Breeding Cost’+’Poultry Processing Cost’ + ’WF Cost’ + 0 * ’Poultry Processing Investment Cost’ (No Policy/Supply Chain Reconfiguration Policy) or ‘Poultry Breeding Cost’ + ’Poultry Processing Cost’ + ’WF Cost’ + 1 * ’Poultry Processing Investment Cost’ (Water Management Policy) |
| Total Profits of Poultry Supply Chain | auxiliary | pound | ‘Processed Poultry Revenues’-’Total Cost’ |
| WF Cost (Baseline Case) | auxiliary | pound | ‘Total Blue WF of Poultry Supply Chain’*’Normal Water Price’ |
| WF Cost (WF Penalty Case) | auxiliary | pound | IF(‘Blue WF Balance’ ≤ 0<<litres>>,’Total Blue WF of Poultry Supply Chain’*’Normal Water Price’, ’Total Blue WF of Poultry Supply Chain’ * ’Normal Water Price’ + ’WF Penalty’) |
| WF Cost (WF Tax Case) | auxiliary | pound | IF(‘Blue WF Balance’ ≤ 0<<litres>>,’Total Blue WF of Poultry Supply Chain’*’Normal Water Price’, ’Blue WF Cap’*’Normal Water Price’ + (‘Total Blue WF of Poultry Supply Chain’-’Blue WF Cap’) * ’Normal Water Price’ * (1 + ’WF Tax’)) |
| Adjustment Time 1 | constant | month | (0.75) * TIMESTEP |
| Adjustment Time 2 | constant | month | (0.75) * TIMESTEP |
| Blue WF Cap | constant | litre | 500,000<<litres>> |
| Blue WF of Live Poultry Processing | constant | litre/chicken | 8<<gallon/chicken>>*4.54 // 1 gallon = 4.54 litres (No Policy) or 3.5<<gallon/chicken>>*4.54 // 1 gallon = 4.54 litres (Water Management Policy) |
| Blue WF of Poultry Feed | constant | litre/chicken | 2.5<<litre/kilogram>>*2.6<<kilogram/chicken>> |
| Blue WF of Poultry Maintenance | constant | litre/chicken | 6.2<<litre/kilogram>>*2.6<<kilogram/chicken>> |
| Breeding Capacity | constant | chicken | 11,000<<chicken>> |
| Egg Hatch Time | constant | month | 0.7*TIMESTEP |
| Live Poultry Demand Smoothing Time | constant | month | 2*TIMESTEP |
| Live Poultry Processing Capacity | constant | chicken | 12,000<<chicken>> |
| Normal Water Price | constant | pound/litre | 2.2525<<pounds/litre>>/1000 |
| Number of Chicken Farms | constant | (number) | 5 |
| Number of Poultry Processing Plants | constant | (number) | 7 |
| Poultry Breeding Unit Cost | constant | pound/chicken | 1.126<<pounds/chicken>> |
| Poultry Processing Fixed Investment Cost | constant | pound | 50,000<<pounds>> |
| Poultry Processing Unit Cost | constant | pound/chicken | 0.6<<pounds/chicken>> |
| Processed Poultry Demand Smoothing Time | constant | month | 2*TIMESTEP |
| Processed Poultry Unit Price | constant | pound/chicken | 3.95<<pounds/chicken>> |
| Time Control Variable T1 | constant | month | 6*TIMESTEP |
| Time Control Variable T2 | constant | month | 3*TIMESTEP (No Policy) or 2*TIMESTEP (Supply Chain Reconfiguration Policy) |
| WF Penalty | constant | pounds | 15766<<pounds>> |
| WF Tax | constant | % | 35% |
| Chicks Inventory | level | chicken | 1000<<chicken>> |
| Live Poultry Inventory | level | chicken | 1000<<chicken>> |
| Processed Poultry Inventory | level | chicken | 1000<<chickens>> |
References
- Hoekstra, A.Y.; Chapagain, A.K. Globalization of Water: Sharing the Planet’s Freshwater Resources, 1st ed.; Wiley-Blackwell: Hoboken, NJ, USA, 2007; ISBN 978-1-4051-6335-4. [Google Scholar]
- Mekonnen, M.M.; Hoekstra, A.Y. A global assessment of the water footprint of farm animal products. Ecosystems 2012, 15, 401–415. [Google Scholar] [CrossRef]
- Hoekstra, A.Y.; Mekonnen, M.M. The water footprint of humanity. Proc. Natl. Acad. Sci. USA 2012, 109, 3232–3237. [Google Scholar] [CrossRef] [PubMed]
- Liu, J.; Savenije, H.H.G. Food consumption patterns and their effect on water requirement in China. Hydrol. Earth Syst. Sci. 2008, 12, 887–898. [Google Scholar] [CrossRef]
- FAO (Food and Agriculture Organization). The State of Food and Agriculture–Leveraging Food Systems for Inclusive Rural Transformation; Food and Agriculture Organization: Rome, Italy, 2017. [Google Scholar]
- Aivazidou, E.; Tsolakis, N.; Vlachos, D.; Iakovou, E. The emerging role of water footprint in supply chain management: A critical literature synthesis and a hierarchical decision-making framework. J. Clean Prod. 2016, 137, 1018–1037. [Google Scholar] [CrossRef]
- UK Government. Available online: https://www.gov.uk/government/collections/poultry-and-poultry-meat-statistics#documents (accessed on 5 December 2017).
- Ibidhi, R.; Hoekstra, A.Y.; Gerbens-Leenes, P.W.; Chouchane, H. Water, land and carbon footprints of sheep and chicken meat produced in Tunisia under different farming systems. Ecol. Indic. 2017, 77, 304–312. [Google Scholar] [CrossRef]
- Gerbens-Leenes, P.W.; Mekonnen, M.M.; Hoekstra, A.Y. The water footprint of poultry, pork and beef: A comparative study in different countries and production systems. Wat. Resour. Ind. 2013, 1–2, 25–36. [Google Scholar] [CrossRef]
- Miglietta, P.-P.; De Leo, F.; Ruberti, M.; Massari, S. Mealworms for food: A Water Footprint Perspective. Sustainability 2015, 7, 6190–6203. [Google Scholar] [CrossRef]
- Harris, F.; Green, R.F.; Joy, E.J.M.; Kaytz, B.; Haines, A.; Dangour, A.D. The water use of Indian diets and socio-demographic factors related to dietary blue water footprint. Sci. Total Environ. 2017, 587–588, 128–136. [Google Scholar] [CrossRef] [PubMed]
- Rainbow Chicken Limited. Available online: http://www.rclfoods.com/sites/default/files/2012sustainability.pdf (accessed on 5 December 2017).
- Pilgrim’s. Available online: http://sustainability.pilgrims.com/mobile/index.html#p=96 (accessed on 5 December 2017).
- The Guardian. Available online: https://www.theguardian.com/sustainable-business/farmers-guidance-sustainable-water-management-leaf (accessed on 5 December 2017).
- Hoekstra, A.Y. The Water Footprint of Modern Society, 1st ed.; Routledge: Abingdon, UK, 2013; ISBN 978-1-8497-1427-3. [Google Scholar]
- European Union, 2000. Available online: http://eur-lex.europa.eu/resource.html?uri=cellar:5c835afb-2ec6-4577-bdf8-756d3d694eeb.0004.02/DOC_1&format=PDF (accessed on 5 December 2017).
- Hoekstra, A.Y.; Chapagain, A.K.; Aldaya, M.M.; Mekonnen, M.M. The Water Footprint Assessment Manual—Setting the Global Standard, 1st ed.; Earthscan: London, UK, 2011. [Google Scholar]
- Miglietta, P.-P.; Toma, P.; Fanizzi, F.-P.; De Donno, A.; Coluccia, B.; Migoni, D.; Bagordo, F.; Serio, F. A Grey Water Footprint Assessment of Groundwater Chemical Pollution: Case Study in Salento (Southern Italy). Sustainability 2017, 9, 799. [Google Scholar] [CrossRef]
- Pfister, S.; Boulay, A.-M.; Berger, M.; Hadjikakou, M.; Motoshita, M.; Hess, T.; Ridoutt, B.; Weinzettel, J.; Scherer, L.; Döll, P.; et al. Understanding the LCA and ISO water footprint: A response to Hoekstra (2016) “A critique on the water-scarcity weighted water footprint in LCA”. Ecol. Indic. 2017, 72, 352–359. [Google Scholar] [CrossRef]
- Boulay, A.-M.; Bare, J.; Benini, L.; Berger, M.; Lathuillière, M.J.; Manzardo, A.; Margni, M.; Motoshita, M.; Núñez, M.; Pastor, A.-V.; et al. The WULCA consensus characterization model for water scarcity footprints: assessing impacts of water consumption based on available water remaining (AWARE). Int. J. Life Cycle Assess. 2018, 23, 368–378. [Google Scholar] [CrossRef]
- Aivazidou, E.; Tsolakis, N.; Iakovou, E.; Vlachos, D. Water footprint management policies for agrifood supply chains: A critical taxonomy and a System Dynamics modelling approach. Chem. Eng. Trans. 2015, 43, 115–118. [Google Scholar] [CrossRef]
- Nabavi, E.; Daniell, K.A.; Najafi, H. Boundary matters: The potential of system dynamics to support sustainability? J. Clean Prod. 2017, 140, 312–323. [Google Scholar] [CrossRef]
- Forrester, J.W. Industrial Dynamics, 1st ed.; The MIT Press: Cambridge MA, USA, 1961. [Google Scholar]
- Akil, R.; Zakaria, A.H. Egg laying characteristics, egg weight, embryo development, hatching weight and post-hatch growth in relation to oviposition time of broiler breeders. Anim. Reprod. Sci. 2015, 156, 103–110. [Google Scholar] [CrossRef] [PubMed]
- European Food Safety Authority. Scientific opinion on the influence of genetic parameters on the welfare and the resistance to stress of commercial broilers. EFSA J. 2010, 8, 1666–1747. [Google Scholar] [CrossRef]
- Aviagen. Available online: http://en.aviagen.com/assets/Uploads/Env-MgtRearing.pdf (accessed on 5 December 2017).
- Kist, L.T.; Moutaqi, S.E.; Machado, Ê.L. Cleaner production in the management of water use at a poultry slaughterhouse of Vale do Taquari, Brazil: A case study. J. Clean Prod. 2009, 17, 1200–1205. [Google Scholar] [CrossRef]
- Agriculture and Horticulture Development Board. Poultry pocketbook. Available online: https://pork.ahdb.org.uk/media/271530/poultry-pocketbook-2016.pdf (accessed on 5 December 2017).
- Sheppard, A. The Structure and Economics of Broiler Production in England. Available online: https://ore.exeter.ac.uk/repository/bitstream/handle/10036/67675/Brreport.pdf?sequence=2 (accessed on 5 December 2017).
- Ecotrust. Differentiated Cost of Production in the Northwest: An Analysis of Six Food Categories. Available online: https://ecotrust.org/media/CFFP_chicken_8_16_16.pdf (accessed on 5 December 2017).
- Thames Water. Charges Schedule 2017-2018: For the Supply of Water and Wastewater Services. Available online: https://www.thameswater.co.uk/-/media/Site-Content/Thames-Water/Help-and-Advice/Helpful-literature/Charges-schedule-2017-18.pdf (accessed on 5 December 2017).
- Merka, W.C. Water management in poultry processing. In Proceedings of the Reciprocal Meat Conference (AMSA 1992), Mandurah, Australia, 1992; Volume 45, pp. 145–146. [Google Scholar]
- Sterman, J.D. Business Dynamics: Systems Thinking and Modeling for a Complex World, 1st ed.; McGraw-Hill Higher Education: Boston, MA, USA, 2000. [Google Scholar]
- Leinonen, I.; Williams, A.G.; Wiseman, J.; Guy, J.; Kyriazakis, I. Predicting the environmental impacts of chicken systems in the United Kingdom through a life cycle assessment: Egg production systems. Poult. Sci. 2012, 91, 26–40. [Google Scholar] [CrossRef] [PubMed]
- Bai, J.; Mu, D. Impacts of carbon emission policies on the supply chain based on System Dynamics. Proceedings the of 11th International Conference on Service Systems and Service Management (ICSSSM), Beijing, China, 25–27 June 2014; pp. 1–7. [Google Scholar] [CrossRef]
- Shamsuddoha, M. Integrated supply chain model for sustainable manufacturing: A System Dynamics approach. In Sustaining Competitive Advantage Via Business Intelligence, Knowledge Management, and System Dynamics, 1st ed.; Quaddus, M., Woodside, A.G., Eds.; Emerald Group Publishing Limited: Bingley, UK, 2015; Volume 22B, pp. 155–399. ISBN 978-1-78560-707-3. [Google Scholar]
- Tsolakis, N.; Srai, J.S. A System Dynamics approach to food security through smallholder farming in the UK. Chem. Eng. Trans. 2017, 57, 2023–2028. [Google Scholar] [CrossRef]
- Lamastra, L.; Miglietta, P.-P.; Toma, P.; De Leo, F.; Massari, S. Virtual water trade of agri-food products: Evidence from italian-chinese relations. Sci. Total Environ. 2017, 599–560, 474–482. [Google Scholar] [CrossRef] [PubMed]
- Manzardo, A.; Mazzi, A.; Loss, A.; Butler, M.; Williamson, A.; Scipioni, A. Lessons learned from the application of different water footprint approaches to compare different food packaging alternatives. J. Clean Prod. 2016, 112, 4657–4666. [Google Scholar] [CrossRef]
Figure 1.
The typical poultry supply chain.

Figure 2.
Causal loop diagram of the poultry supply chain. WF: water footprint.

Figure 3.
Stock and flow diagram of the system: (a) poultry supply chain; (b) freshwater consumption; (c) costs (“water penalty” case); (d) costs (“water tax” case).
Figure 3.
Stock and flow diagram of the system: (a) poultry supply chain; (b) freshwater consumption; (c) costs (“water penalty” case); (d) costs (“water tax” case).

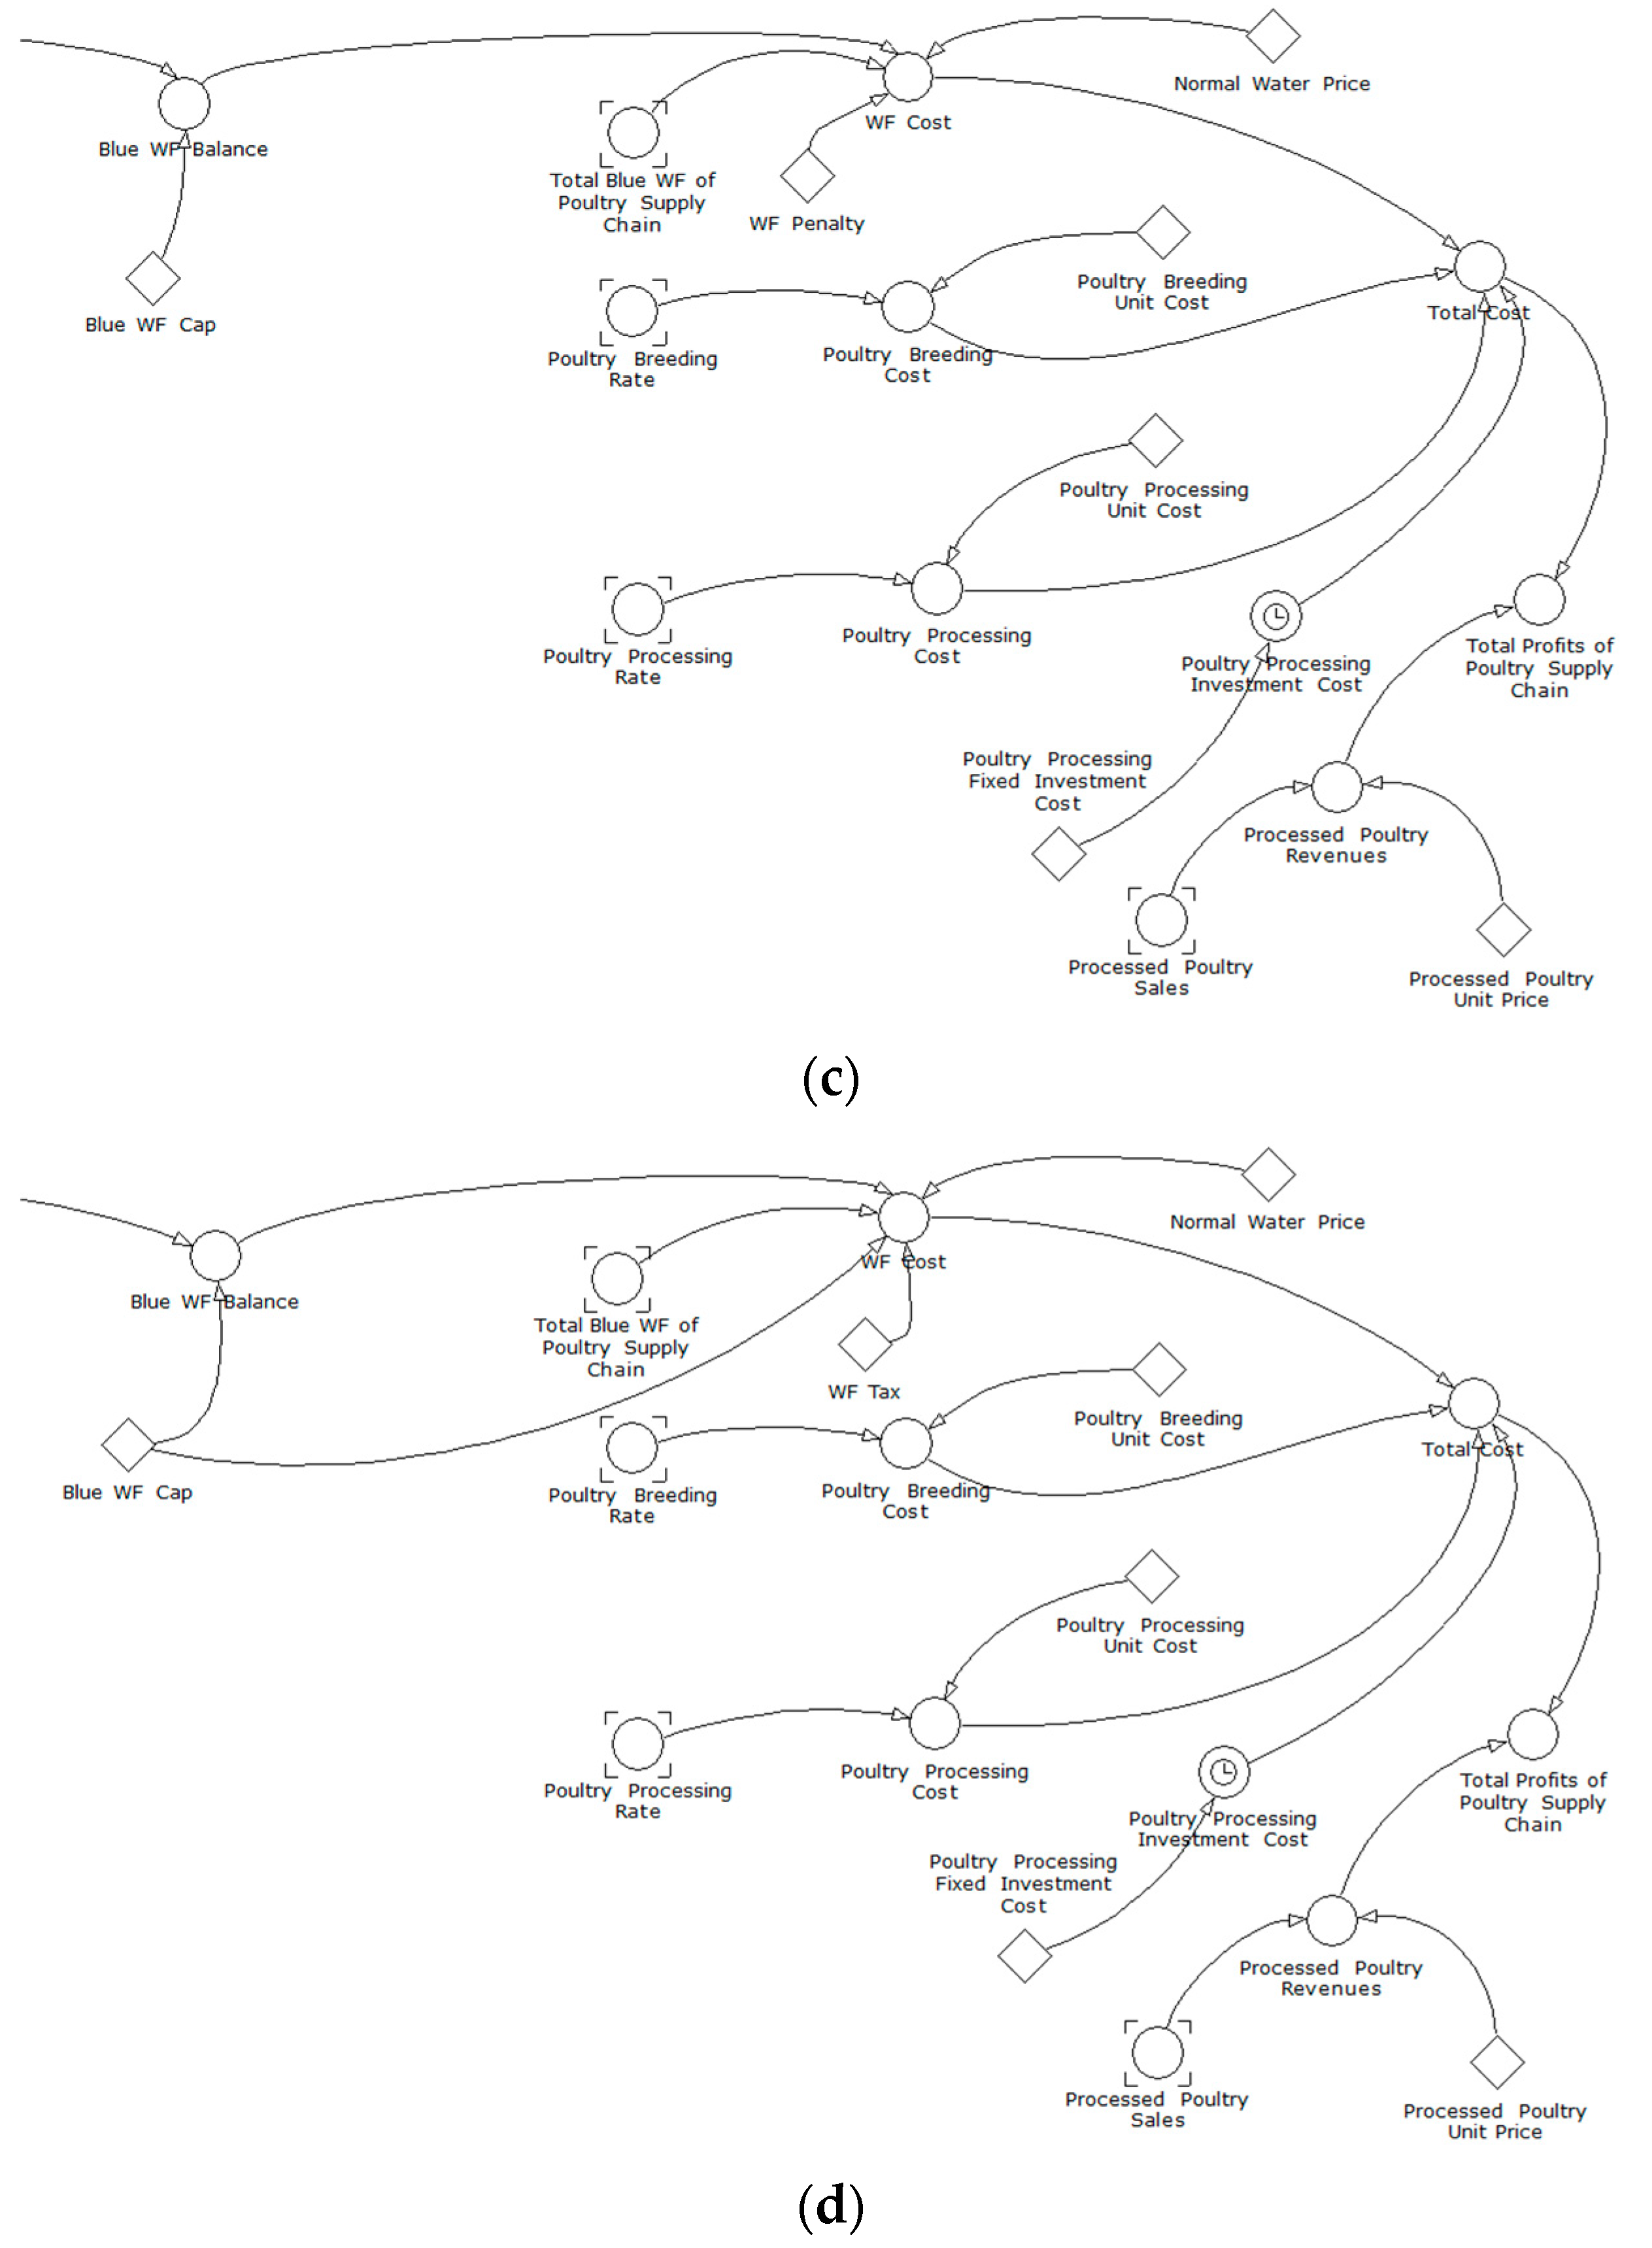
Figure 4.
Total blue WF and profits of the poultry supply chain.

Figure 5.
Impact of policy interventions under every regulatory scheme.
© 2018 by the authors. Licensee MDPI, Basel, Switzerland. This article is an open access article distributed under the terms and conditions of the Creative Commons Attribution (CC BY) license (http://creativecommons.org/licenses/by/4.0/).
Share and Cite
MDPI and ACS Style
Tsolakis, N.; Srai, J.S.; Aivazidou, E. Blue Water Footprint Management in a UK Poultry Supply Chain under Environmental Regulatory Constraints. Sustainability 2018, 10, 625. https://doi.org/10.3390/su10030625
AMA Style
Tsolakis N, Srai JS, Aivazidou E. Blue Water Footprint Management in a UK Poultry Supply Chain under Environmental Regulatory Constraints. Sustainability. 2018; 10(3):625. https://doi.org/10.3390/su10030625
Chicago/Turabian StyleTsolakis, Naoum, Jagjit Singh Srai, and Eirini Aivazidou. 2018. "Blue Water Footprint Management in a UK Poultry Supply Chain under Environmental Regulatory Constraints" Sustainability 10, no. 3: 625. https://doi.org/10.3390/su10030625
Note that from the first issue of 2016, this journal uses article numbers instead of page numbers. See further details here.