Evolution of Rural Livelihood Strategies in a Remote Sino-Mongolian Border Area: A Cross-Country Analysis
by
Munkhnasan Tsvegemed
1,†,‡, 
Alimu Shabier
1,2,‡,
Eva Schlecht
1,
Greta Jordan
3 and
Martin Wiehle
3,4,* 1
Section Animal Husbandry in the Tropics and Subtropics, University of Kassel and University of Göttingen, Steinstrasse 19, 37213 Witzenhausen, Germany
2
Rangeland Research Institute, Xinjiang Academy of Animal Science, Urumqi 830011, China
3
Section Organic Plant Production and Agroecosystems Research in the Tropics and Subtropics, University of Kassel, Steinstrasse 19, 37213 Witzenhausen, Germany
4
Tropenzentrum and International Center for Development and Decent Work (ICDD), University of Kassel, Steinstrasse 19, 37213 Witzenhausen, Germany
*
Author to whom correspondence should be addressed.
†
Current address: Department of Coordination and Implementation of Livestock Policy, Ministry of Food, Agriculture and Light Industry, 13381 Ulanbataar, Mongolia.
‡
The first two authors have contributed equally to this paper.
Sustainability 2018, 10(4), 1011; https://doi.org/10.3390/su10041011
Submission received: 13 February 2018
/
Revised: 19 March 2018
/
Accepted: 20 March 2018
/
Published: 29 March 2018
(This article belongs to the Special Issue Achieving Sustainable Village Development though Traditional and Innovative Approaches)
Abstract
:Ecologically sound natural resources management is still the backbone of rural livelihoods in many regions of the world. The Altai-Dzungarian region between China and Mongolia constitutes an ideal site to study how political, economic, infrastructural, and cultural differences affect rural livelihoods. Structured semi-quantitative interviews were conducted with 483 households on both sides to characterise their current livelihood strategies and assess the importance of the various activities for the households’ current socio-economic situation by means of the categorical principal component and two-step cluster analysis. In total, four livelihood clusters were identified across both regions, whereby one cluster was only present in Mongolia. In general, all clusters mirrored the transition from almost pure pastoralist to agro-pastoralist livelihood strategies. While animal husbandry was more common in Mongolia and crop farming more common in China, most households in both countries pursued a rather mixed approach. The composition of the herds, as well as the richness and diversity of the livestock species, differed significantly between the countries and was generally higher in Mongolia. Supplementary feedstuff and pesticide and fertiliser use were higher in China, along with diversification of produces. Our analysis indicates that until very recently the livelihood strategies on both sides of the border were the same, manifesting in the fact that we can define three identical clusters across countries (environment factor) even though there are slight differences in land, livestock and asset endowment.
1. Introduction
Recent phenomena such as climate change, population growth, rural out-migration and urbanisation, amalgamation of lifestyles and digitisation of all domains of human life affect people worldwide, yet to different degrees and with different consequences [1]. To mitigate or even reverse the negative impacts of global change phenomena, the Sustainable Development Goals were adopted by the United Nations in September 2015 and frame the global development agenda towards 2030 [2]. Sustainable development, which concomitantly and equitably considers the “three pillars” (ecological, economic and social dimensions [3]) of transformation processes, is not a new concept. Yet, its adoption as an overarching goal by the global community obliges policymakers, as well as scientists, to evaluate ongoing societal evolution with respect to the sustainability dimensions. The sustainable livelihoods concept that was developed in the late 1990s also includes the “three pillars” but concentrates on the much smaller scales of local and regional communities [4]. The sustainable livelihoods concept is often applied to support poorer societal strata and rural communities in their quest for resource use options that would render their livelihoods economically more sustainable through, for example, diversification of produce [5] and ecologically sound natural resource management [1]. The latter is still the backbone of rural livelihoods in many regions of the world, especially in the so-called transition and developing countries, independent of these countries’ riches in crude minerals or industrialisation level—as, for example, in China and Mongolia [6].
The Altai-Dzungarian border region between Xinjiang Uighur Autonomous Region (XUAR) in Northwest China and the westernmost Mongolian provinces Khovd and Bayan-Ölgii constitutes an ideal site to study how political, economic, infrastructural, and cultural differences [7] shape the adaptation strategies of rural dwellers to global change phenomena. The region is close to the most distant terrestrial point of Eurasia, is sparsely populated and it offers the potential for sustainable rural development. This region is, on both sides of the border, characterised by harsh environmental conditions, sparse transport and communication infrastructure, a low to very low level of industrialisation, and a high dependence of rural livelihoods on agricultural activities [8,9]. In XUAR, the central government’s campaign to “open up the West” has led since the 1990s to a massive in-migration of Han Chinese from the eastern and central provinces, a rapid expansion of the nationally very important gas and oil mining activities, a certain support of industrial development across the vast countryside (1.6 million km2) and especially a massive expansion of state-controlled agricultural perimeters (up to the late 1990s), including flood irrigated wheat and cotton cultivation, and recently a rapid enlargement of drip-irrigated maize and potato cultivation [10,11,12,13,14]. Furthermore, national and regional policies foster livestock production while strictly regulating the utilisation of natural rangelands for grazing [11,15,16,17,18] and sedentarising formerly mobile livestock keepers [17,19] of the ethnic minority groups within XUAR, such as Kazakhs, Mongols, and Uyghurs. Yet, livestock production is only one of their professions, seconded by small-scale cereal cropping, vegetable production (sometimes even greenhouse-based), petit commerce and salaried or waged labour [20,21,22].
In the neighbouring Republic of Mongolia, animal husbandry has always been and still is a very important sector for rural employment and the national economy [23,24,25] despite the fact that in the past two decades coal and mineral mining became indispensable for the country’s economy [6]. In the year 1990, which marked the end of the 70-year socialist era in Mongolia, privatisation and liberalisation of formerly state-owned and centralised animal husbandry started [26] and massive unemployment occurred [27], triggering a return of many city dwellers to animal husbandry in the countryside. This development was not paralleled by the release of consolidated management plans for the natural rangelands [28] and hence led to a huge increase in livestock numbers, particularly of goats [8,29,30,31]. Even though the number of livestock keepers decreased again since 2005 when the mining industry and massive rural-to-urban (back-)migration gained momentum [32,33], the agricultural sector still accounts for 15% of the country’s gross domestic product of which 80% is derived from the livestock sector [34].
Regionally, global change phenomena also manifested since the mid-1990s when the (Chinese) border post Takashiken (46°08′37′′ N, 90°57′14′′ E) saw a certain amount of cross-country travel by the local inhabitants. Since the end of 2006, the border post regularly opened for Chinese and Mongolian citizens and since 2011, it is open year-round for travellers of any nationality; the number of commercial travellers is especially large [35]. Overall, Mongolia depends on China for more than 60% of its external trade. China receives some 90% of Mongolia’s exports and supplies Mongolia with more than one-third of its imports [25]. With Mongolian citizens not needing a visa to enter China, the purchase and import of Chinese manufactured goods and agricultural products into the Mongolian border region started flourishing [35]. On the other hand, it is difficult for the Mongolian border population to export their agricultural products into China because the quality, quantity and diversity of the Mongolian vegetables are much lower than that of the Chinese. Furthermore, the export of raw livestock meat and live animals into China is not allowed since zoonoses, such as foot and mouth disease, are not yet eradicated in the Mongolian border provinces [36]. However, regular travel of Chinese businesspeople into Mongolian border towns fuels the local restaurant and hotel sector. According to the Statistical Department of Khovd Province [37], the positive implications of the open border have resulted in an increase in the local population by about 10% since 1990.
Given the ecological and climatic homogeneousness of this border region but its contrasting infrastructural, socio-economic and political settings [7], the present study aimed to understand whether environmental or anthropogenic components are more decisive in shaping the present evolution of rural livelihood strategies. The focus is (i) on the characterisation of current livelihood strategies and (ii) on the evaluation of the importance of the various activities for the households’ current socio-economic situation and future prospects (that is, their sustainability) [38].
2. Materials and Methods
2.1. Study Region
The present study was carried out at the transnational border along the Chinese and Mongolian Altai Mountains and the Dzungarian Basin (Xinjiang Uyghur Autonomous Region, People’s Republic of China and Western Mongolia, respectively). In total, three countries were covered: the county of Qinghe (also spelt Qinggil) in Altai Prefecture (China), Bulgan County (sum) of Khovd Province and Bulgan sum of Bayan-Ölgii Province, both located in Western Mongolia (Figure A3A). The main settlements in these regions—Qinghe (China) and Bulgan sum city (Mongolia)—are located in the valleys of the Qinghe River and Bulgan River, respectively, and are typical areas for winter pasture and river oases at comparatively low altitudes of 1100–1600 meter above sea level (m a.s.l.). The corresponding summer pasture areas are located in the Altai Mountains at altitudes above 2100 m a.s.l.; they are characterised by cryophyte vegetation on permafrost soils, whereas fluvial and alluvial soil types characterise the lower reaches. Agro-pastoralism is the predominant form of land use on both sides of the border [19]. The local livestock herds are comprised of cattle, sheep, goats, horses, and camels; additionally, yaks are found on the Mongolian side [9,35].
The study region is located in the temperate semi-arid and arid climatic belt including steppe and semi-desert biomes. Long and cold winters, dry and hot summers, low precipitation (rainfall and snow) and pronounced temperature fluctuations determine the local climate [24,39,40]. The average annual temperature is generally lower in the mountainous regions and increases towards the lower reaches of the Qinghe and Bulgan watersheds. The mean minimum/maximum annual air temperatures on the Chinese and Mongolian sides range between 23 °C and 26 °C in the summer and between −33 °C and −40 °C in the winter [7]. Across the region, a slight increase in the mean annual temperature was observed from 1987 to 2000, ranging between 0.7 °C (128 meteorological stations in Northwest China) [32] and 1.4 °C [41]. The mean annual precipitation amounts to 174 ± 50 mm in Qinghe and 75 ± 34 mm in Bulgan sum city [42]; precipitation amounts increase with altitude, reaching 214 mm (China) and 305 mm (Mongolia) at sites above 2000 m a.s.l. [7].
Qinghe County hosts seven towns and is inhabited by approximately 64,300 people from 16 ethnic groups [43]. The county is renowned as a cradle of wheat and alfalfa for human food and animal forage, respectively. Both crops are irrigated throughout the growing period with water from the Qinghe River and its tributaries. Other forms of farming include commercial mushroom and vegetable production in traditional greenhouses.
The Bulgan sums of Khovd and Bayan-Ölgii provinces are governed by elected local municipalities residing in the respective central settlements; the sum centres and their vast hinterlands are inhabited by about 9018 and 5164 people, respectively, belonging to three ethnicities [7,34]; the rural dwellers are mostly engaged in livestock farming, and—to a much lesser extent than their Chinese neighbours—in crop production.
2.2. Data Collection
On both sides of the border, study sites were selected along a decreasing temperature gradient from the lowland towns and adjacent winter pastures to high altitude summer pastures. Based on topographic features and the altitudinal gradient, eleven focal geographical points representing a specific permanent or temporary settlement area were chosen, five in China and six on the Mongolian side (Table 1 and Figure 1). All households (HHs) within a 5 km radius around the focal points were visited in the summer of 2012. After introducing the purpose of the study and asking for the interviewees’ consent to participate, the coordinates (latitude, longitude, altitude) of the household’s current home (fixed house or temporary yurt) were recorded with a handheld GPS (HOLUX M-241 wireless GPS logger, HOLUX Technology Inc., Hsinchu, Taiwan; accuracy ±3 m).
Pre-tested structured interviews were conducted in local languages (C: Kazakh, Mandarin Chinese, and Uyghur; M: Kazakh and Mongolian) with the help of assistants; answers were translated into English. A total of 483 (C: 258; M: 225) HHs were thereby covered. The interview contained questions related to the socio-economic characteristics of the HHs (size, ethnicity, gender and age of the family members, education level and status of employment of the family members), cropping activities (croplands: gardens, vegetable plots, staple food fields; hayfields; major crops; cropping practices; product marketing), household assets (transportation: car, motorcycle, bicycle, cart; electronic devices: radio, television, electric cooker/heater, solar panel; other: kerosene cooker, gas cooker, sewing machine; agricultural machinery: tractor, plough, seeder, grass mower) and livestock activities (livestock ownership, herd size, livestock species, feeding management, yearly transhumance distances covered by the herd (Figure A3B), animal and product marketing, and cash revenue from animal (product) sales). Both the value of assets and cash income from animals (incl. meat, wool, skin and live animals) were calculated based on the responses (sale prices) by the interviewees and summed up for the previous year 2011.
Animals owned were grouped into small livestock (sheep and goat), large livestock (cattle and yak) and status animals (horse and camel) and numbers were converted to sheep units (SU). One SU is defined as a ewe of 40 kg live weight and its nursing lamb(s) with a daily forage consumption of 5 to 7.5 kg of dry matter; for the conversion, the used the factors proposed by [44]. All monetary values were converted into Euro from the national currencies (Chinese Renminbi and Mongolian Tugrik) based on the average exchange rate during May to September 2012 (www.xe.com).
2.3. Statistical Analysis
To determine the HHs’ main livelihood strategies, a categorical principal component analysis (CATPCA) was employed, followed by a two-step cluster analysis [45]. Both techniques allow for the simultaneous integration of different data scales (nominal, ordinal, and metric) [46,47]. CATPCA is a multivariate technique that intermediates between standard (linear) PCA and nonlinear multiple correspondence analysis [48]. The CATPCA approach was used to reduce the initial set of 16 variables considered relevant for the characterisation of livelihood strategies (Table 2). Variables with component loading values (eigenvalues) higher than 0.5 in either of the two principal dimensions were successively selected; auto-correlated variables were not considered for further cluster analysis. The two-step cluster approach was applied to group individual households that share common characteristics and to identify the relative importance of the variables used. The number of clusters was set based on the Bayesian information criterion (BIC) and cluster goodness was evaluated based on the silhouette measure of cohesion and separation following [45,49,50] with a value ≥ 0.6 indicative for cluster goodness. The alternating runs of both techniques and subsequent evaluation (two-step cluster visualisation) each resulted in a final set of nine variables most relevant for cluster determination.
Prior to descriptive statistical analysis, the residuals of the continuous variables were checked for normal distribution using the Kolmogorov–Smirnov test. As all variables were found to be distributed non-normal, differences between clusters were explored using non-parametric tests depending on the scale of the data (Chi-square (Fisher’s exact) test for categorical variables; Mann-Whitney-U or Kruskal-Wallis test for continuous variables). The standard error of the mean (SEM) and the standard deviation (±) were used to express variability of larger and smaller datasets, respectively. Wilcoxon signed rank-statistics were used to assign significant differences between clusters. Linear relationships were analysed applying Spearman’s correlation coefficient. All data were analysed with SPSS (IBM SPSS Statistics for Windows, Version 20.0. Armonk, NY, USA: IBM Corp.). Significance was declared at p < 0.05.
Species-specific livestock numbers were used to analyse species richness, species diversity and evenness of species representation in the individual HH’s herds by calculating Simpson diversity and Shannon evenness (J’), which are based on the formulas summarised by [51]. The Simpson diversity index expresses the probability that two random samples from a community do belong to the same species, whereas J’ is derived from the Shannon diversity index H’ divided by H’max (highest possible value if all species are equally abundant) and indicates the distribution of individuals over the different species in a given community. Indices were calculated with the MS® Excel-based Diversity Add-In Calculator (SSC, Reading, UK). To allow for the comparison of differently large animal sample sets per cluster, sample-based species accumulation curves were generated with EstimateS (Version 9, R. K. Colwell, Connecticut, Storrs, CT USA, http://purl.oclc.org/estimates) using the Mao Tao estimator and the SEM to indicate significant differences. Numerical livestock data were only based on HHs owning livestock while richness and diversity indices comprise all cases.
If not otherwise indicated and to maintain consistency during descriptions of between-country data, China is mentioned prior to Mongolia throughout the following sections.
3. Results
3.1. General Characteristics of Rural Households
The average size of a rural family in the border region of China and Mongolia was four and five members, respectively, including two children. In both cases, male-to-female and adult-to-child ratios were similar with about 23% (China) and 33% (Mongolia) more males than females, and 58% and 44% more adults than children. The average age of the (male) household heads differed marginally and was 44 and 47 years.
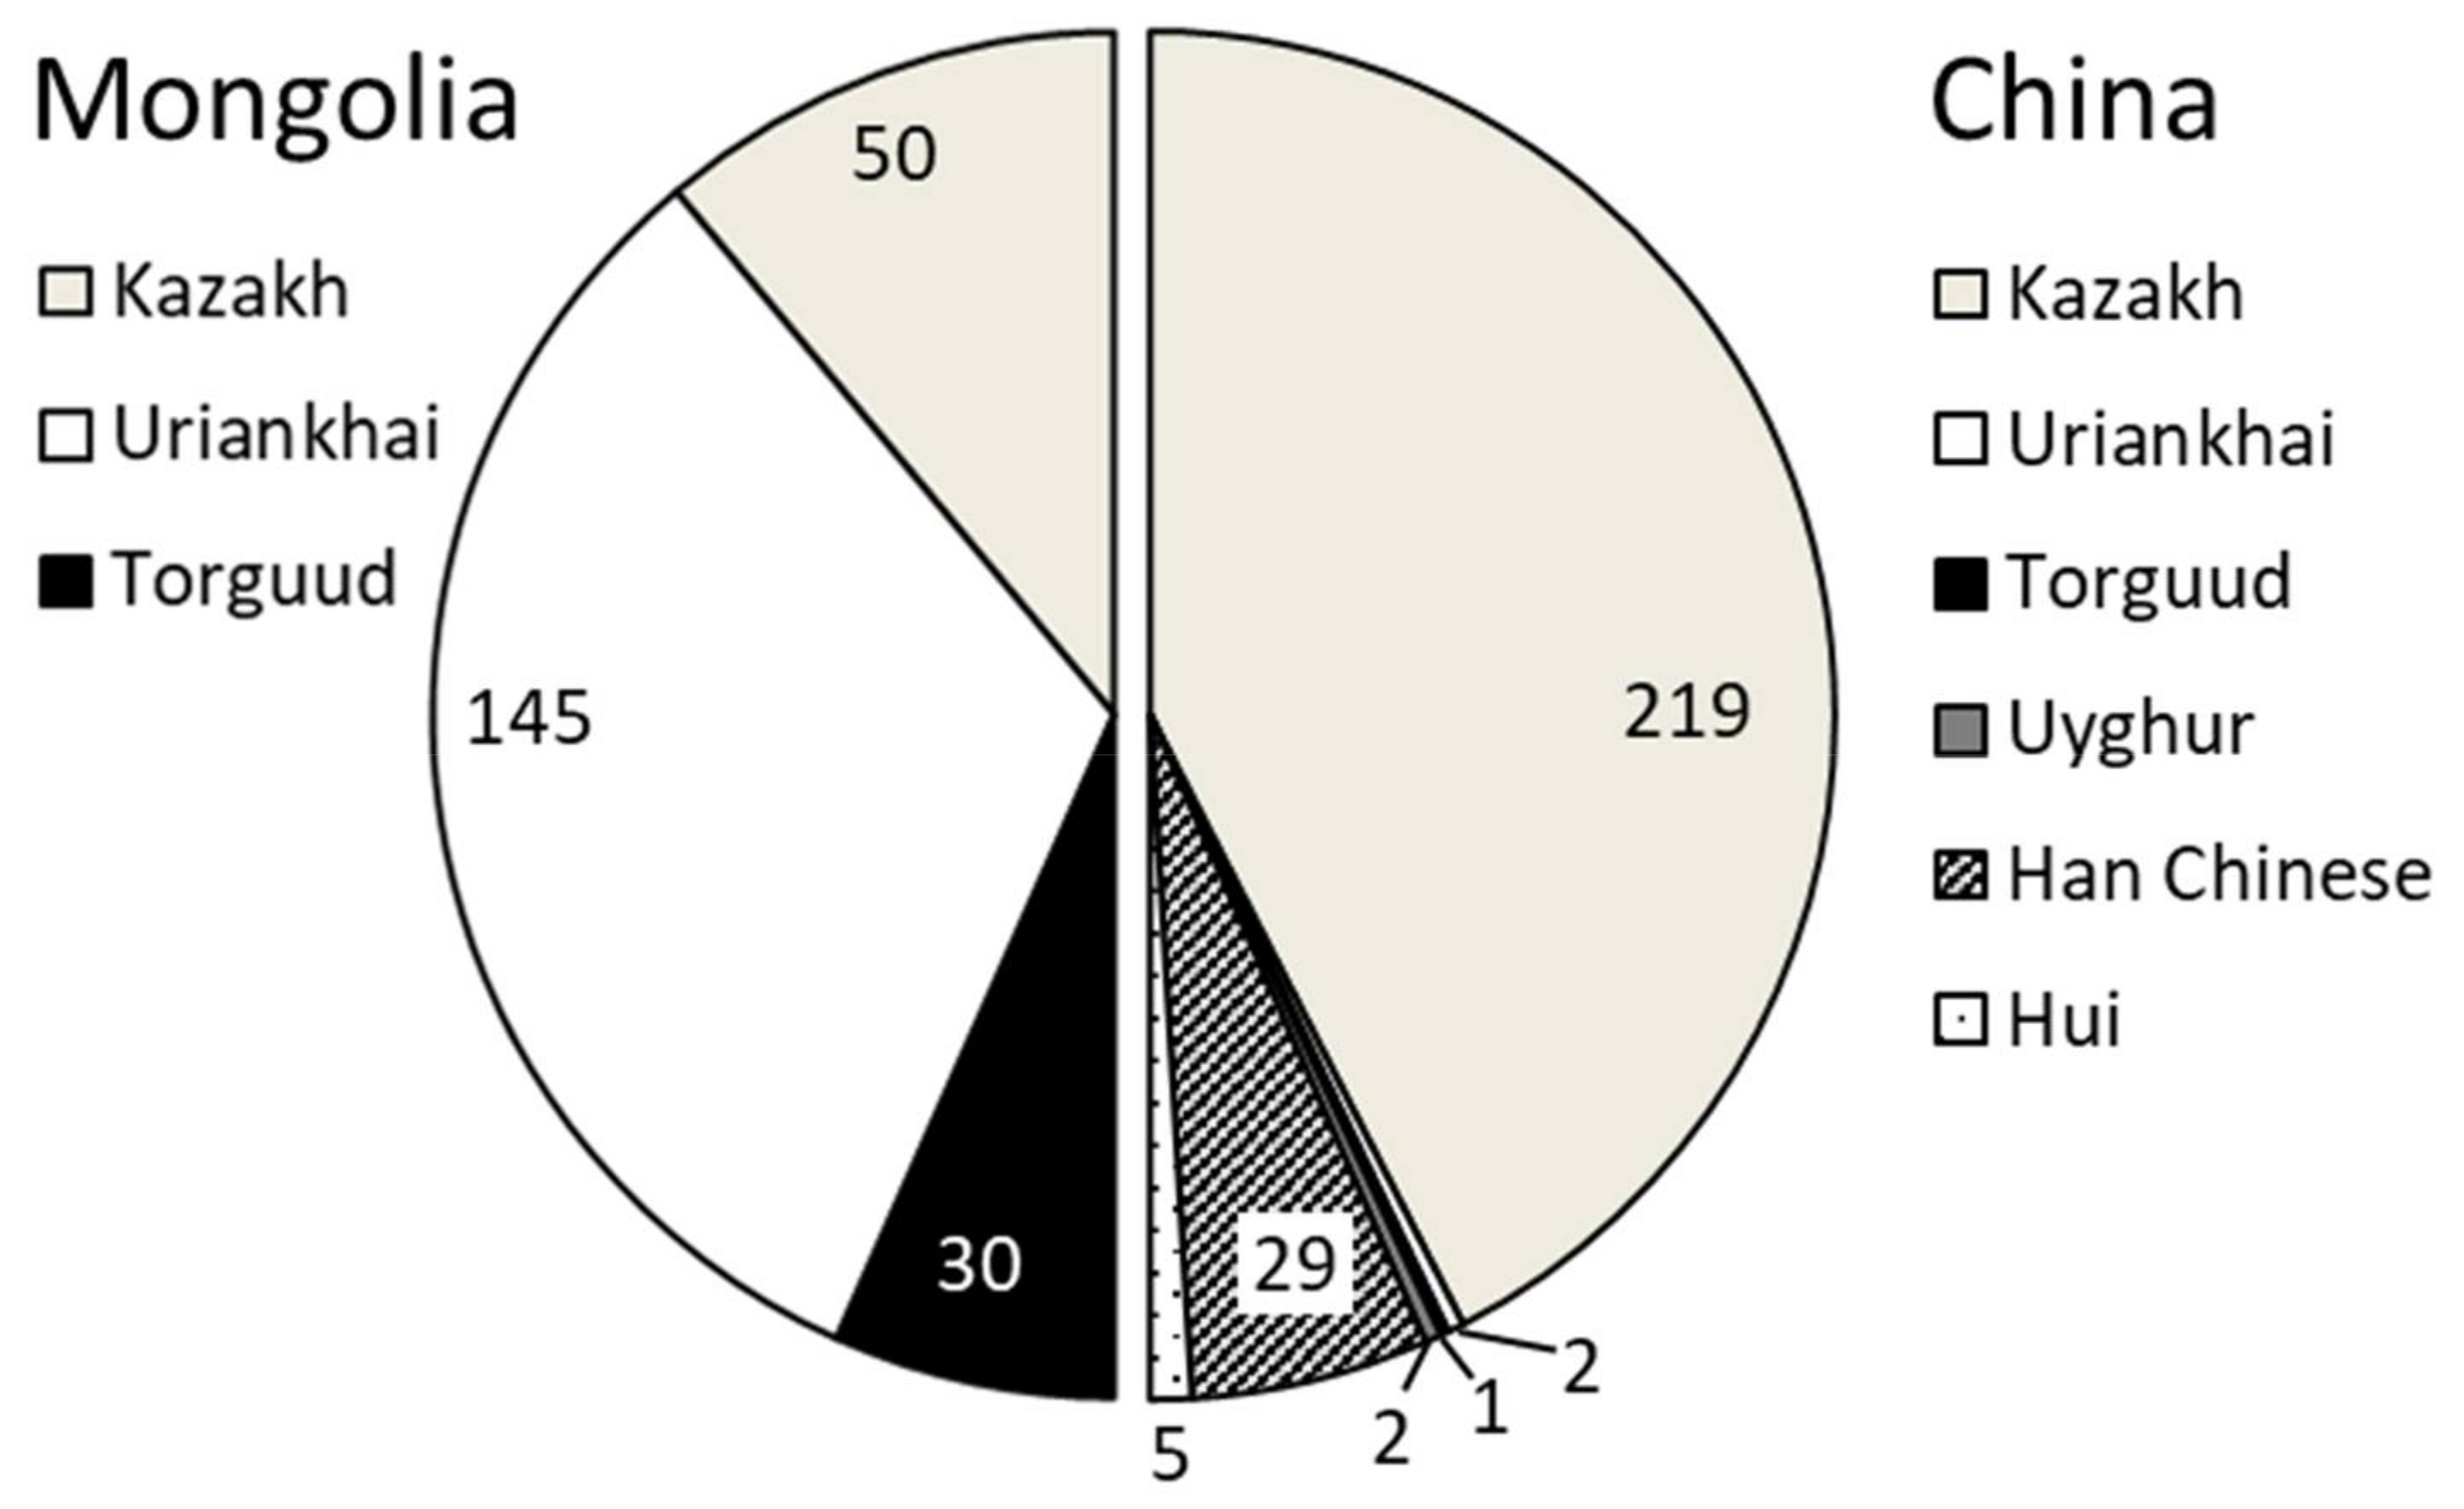
The study sites were dominated by three ethnic groups (Figure 2), namely Kazakhs (45.3% and 10.4%), Torguud (0.2% and 6.2%) and Uriankhai (0.4% and 30.0%). The remaining interviewees belonged to the Han Chinese (6.0%) and the two Islamic minorities, the Hui (1.0%) and Uyghurs (0.4%)—all only recorded in China.
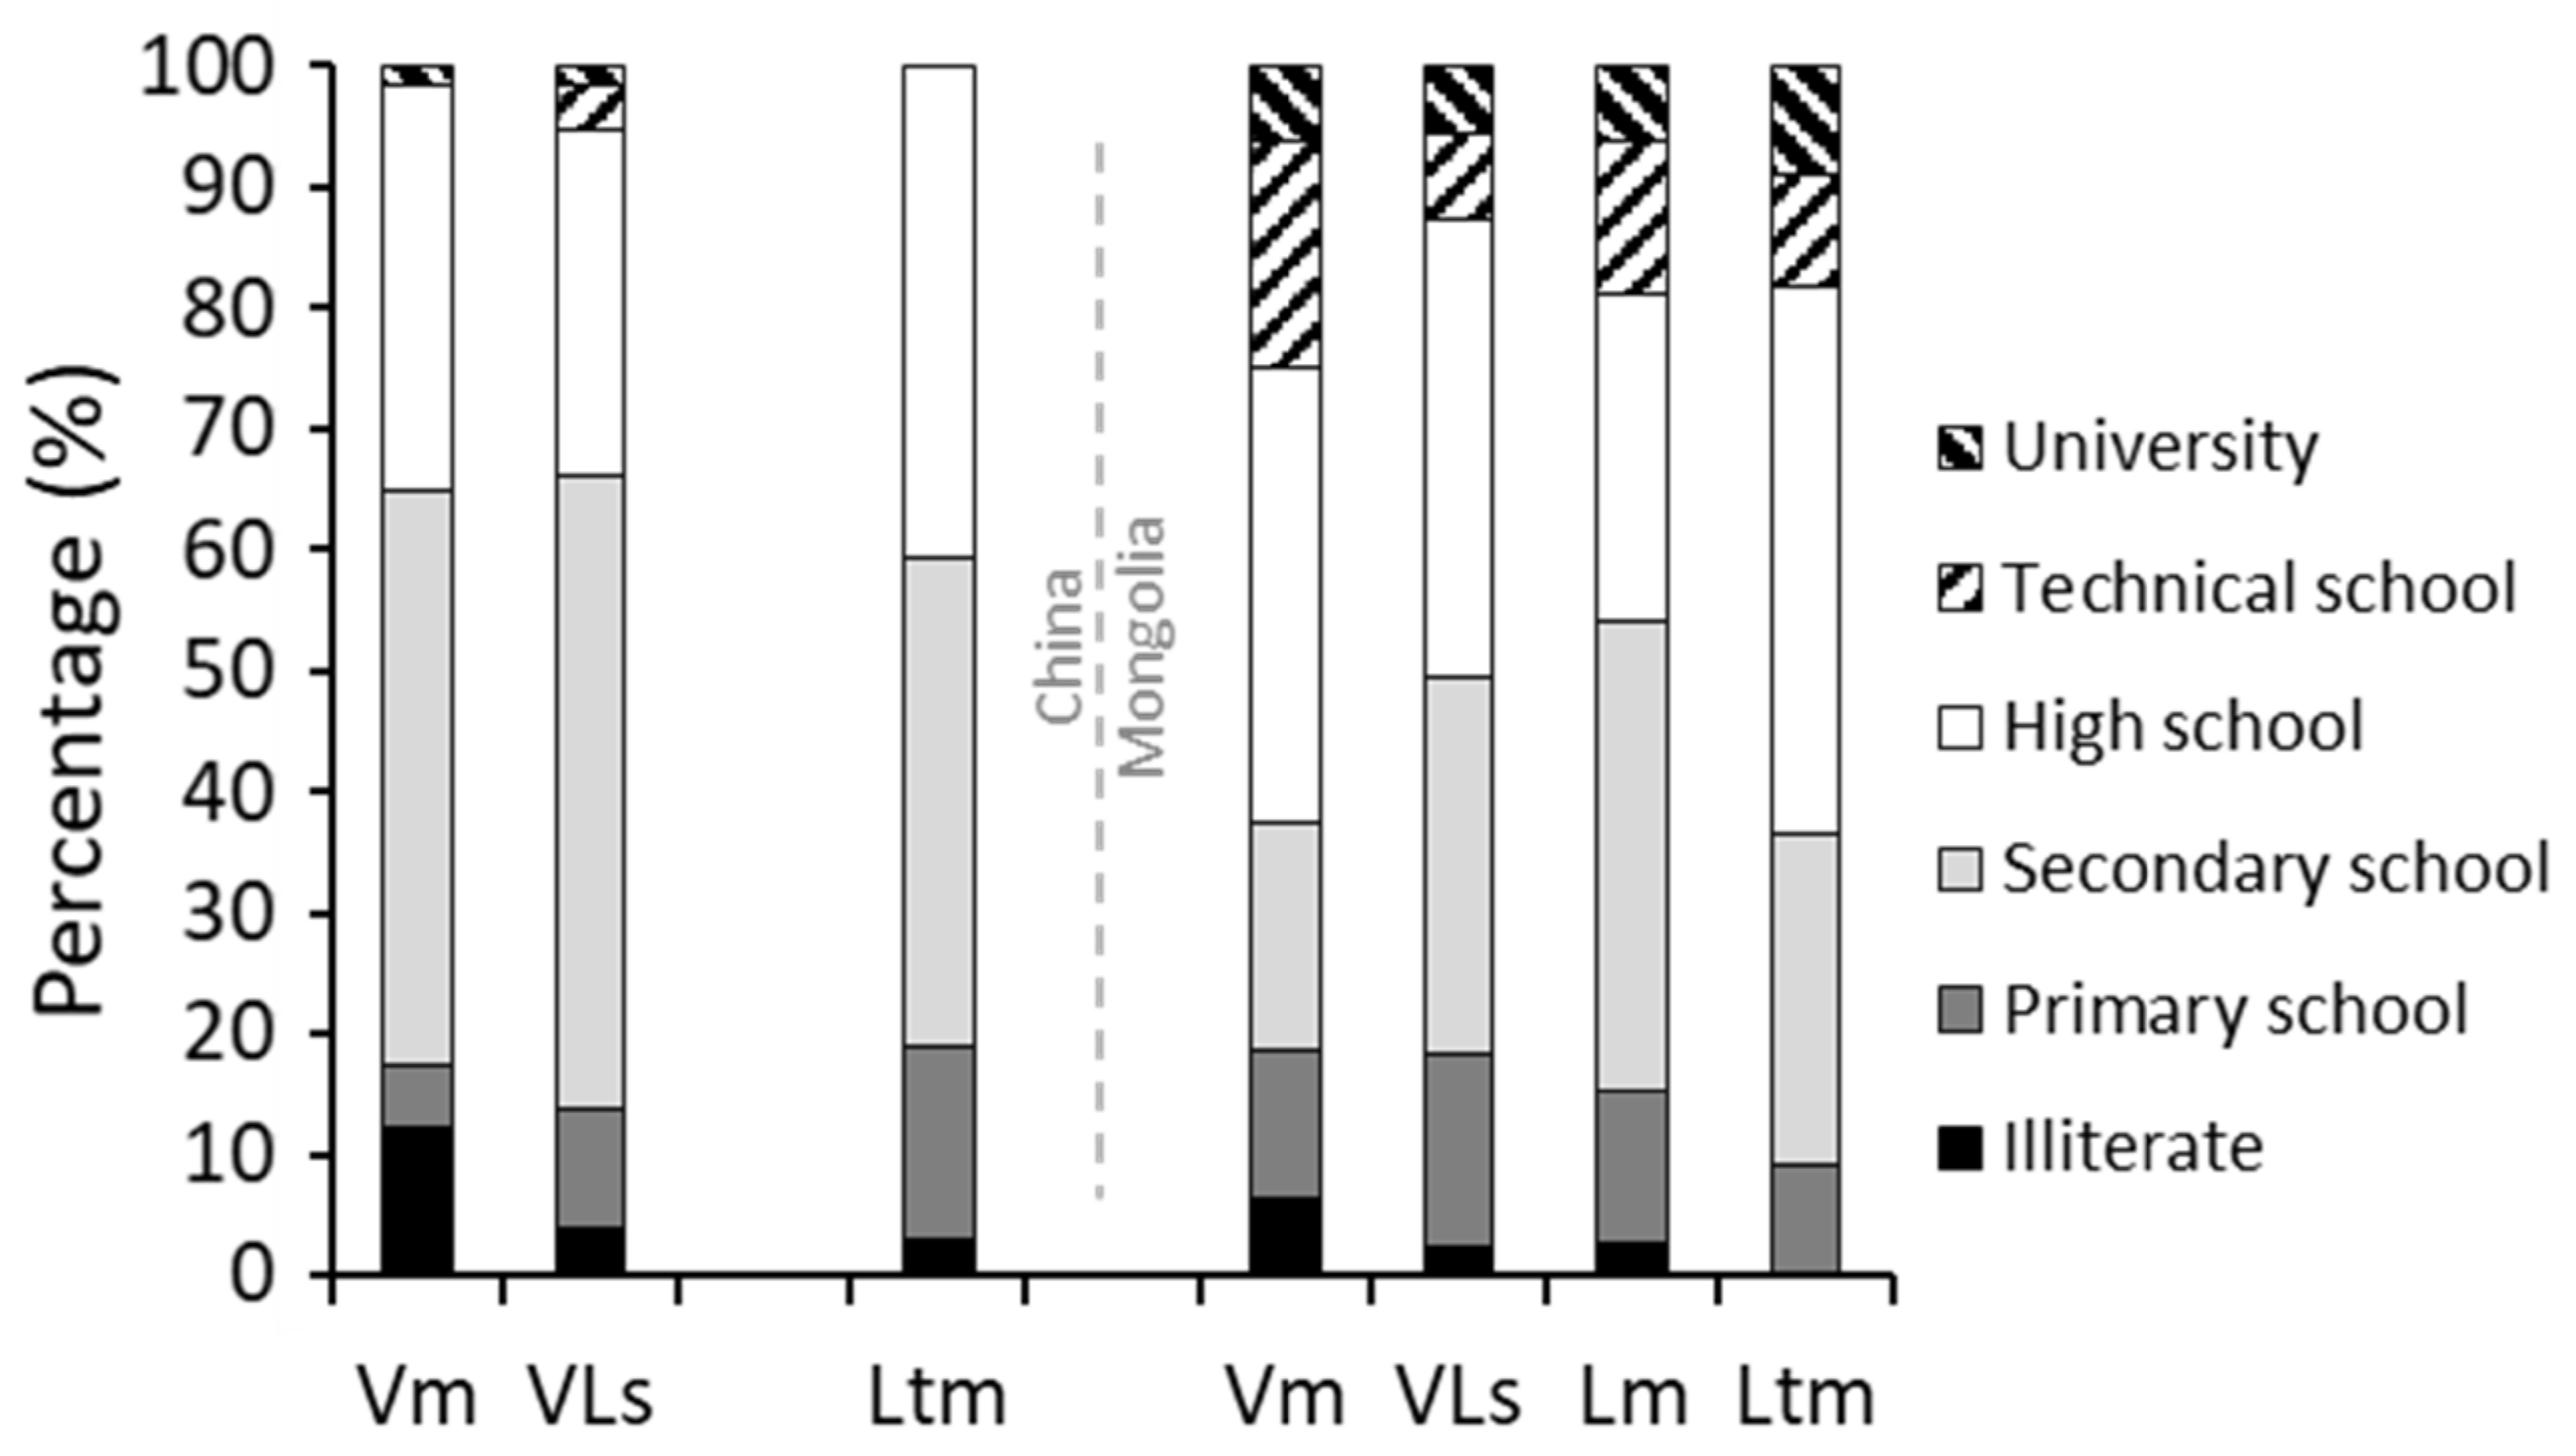
Although the educational levels of the household heads were in part comparable between the two countries, the overall test statistics differed significantly. The illiteracy rate was generally low (5% and 3%) and most of the household heads had visited secondary school (48% and 34%) or high school (33% in both countries). While more Chinese (59%) than Mongolian (48%) household heads had obtained a primary or secondary schooling certificate, more Mongolian (17%) than Chinese (3%) household heads held an advanced study degree (university or technical school). The number of family members employed in a regular job outside agriculture averaged 3 (±0.9) and 2 (±1.2), respectively.
Own or long-term leased land for crop production was managed by 79% and 66% (p < 0.01) of the interviewed HHs. The size of the hayfields and croplands was similar or smaller in Mongolia than in China (Table 3).
Four-fifths (78%) of Chinese households kept livestock as compared to 92% in Mongolia. Based on the absolute animal numbers, goats and sheep were most popular while cattle played a moderate role, and camels, horses and yaks showed a low importance for local livelihoods. Except for yaks, which were only encountered in 43 herds in Mongolia (4.9 ± 4.21 animals), all other species were found on both sides of the border. The average herd size (in head counts) was almost twice as high (p < 0.001) in Mongolia (113, n = 223 HH) than in China (64, n = 201 HH). Whereas in China the herds comprised on average 2.1 times more sheep than in Mongolia (p < 0.001), the number of goats, cattle, horses and camels was 4.2, 1.3, 2.1 and 2.4 times higher (all 0.002) in the Mongolian herds. In general, the total number of animals, total income from animal production and the yearly transhumance distances were inversely related with the size of the cropped land (r = −0.54, p ˂ 0.001; r = −0.37, p = 0.013; r = −0.54, p < 0.001, respectively). The size of the hayfields, instead, was positively correlated with the total number of animals (r = 0.52, p < 0.001) and the total income from animal production (r = 0.51, p < 0.001). The yearly transhumance distance was also highly correlated with the total number of animals (r = 0.77, p < 0.001).
3.2. Livelihood Diversity
The most influential variables emerging from CATPCA were the number of family members, the presence (or absence) of livestock, the total number of animals, the number of goats, the number of horses, and the number of camels, the total income from animal production, cropland, and the total number of assets owned (Appendix A, Table A1, Figure A1). Across both countries, the rural households could be grouped according to four major livelihood strategies (Table 3), defined as:
- Vm: Vegetable production for the market (15%)
- VLs: Vegetable production and livestock keeping for subsistence (45%)
- Ltm: Livestock keeping, traditional but market oriented (17%)
- Lm: Livestock keeping for the market (23%)
Households belonging to cluster Vm (15% of all HH, 78% thereof in China) inhabited the lower reaches (<1450 m a.s.l.) of the surveyed region. In China, the cluster was dominated by Han Chinese with 28 of the total 29 Han HHs found in cluster Vm. In addition, two out of five Hui and one out of two Uyghur HHs were also found in this cluster. On the Mongolian side, 10 Uriankhai, 4 Kazakh and 2 Torguud HHs made up cluster Vm. The level of illiteracy was highest and the proportion of household heads with an advanced study degree was amongst the lowest on the Chinese side, whereas on the Mongolian side this cluster had the highest proportion of household heads with a high school or university degree (Figure 3). Land (particularly a garden) was cultivated by 89% (C: 96% and M: 81%, respectively) of all Vm HHs; this activity was hence more frequent than in all the other clusters. Whereas in China Vm HHs cultivated on average 1.2 ha of cropland, their Mongolian counterparts only cultivated 0.7 ha; yet, with 1.0 the standard deviation was about one-third higher than the mean, which shows the wide range of plot sizes in the Mongolian cluster Vm. In China, the Vm HHs primarily cultivated wheat and a variety of vegetables (such as cabbage, tomatoes, melons, and carrots); potatoes dominated over vegetables (the same species as in China) and rye on the Mongolian side (Figure 4). In Mongolia, HHs in cluster Vm even owned livestock; they did however not herd their animals but just let them graze on communal land near the settlements to obtain animal produce for home consumption and sporadic sale. Consequently, income from animal production was also only obtained by Mongolian Vm HHs but ranked lowest across all clusters (Table 4). On the Chinese side, the size of the cropland was large in this cluster, while only moderate in Mongolia. In contrast, the number of assets owned and their monetary value was lowest for HHs in cluster Vm on both sides of the border (Table 3).
Cluster VLs (45% of all HH, 61% thereof in China) was dominated by Kazakh HHs (65.3%) followed by Uriankhai (30.6%) and all other minorities (4.1%). Similar to cluster Vm, HHs of cluster VLs were primarily encountered in mountainous reaches below 1450 m a.s.l. In both countries, the proportion of household heads with secondary and high school degrees was highest in this cluster (Figure 3); on the Chinese side, VLs HHs also hosted the highest number of members employed off-farm. Total assets averaged 4.7 and 7.0 and valued about 500 € more than the assets in cluster Vm. More than two-thirds (78%) of VLs HHs cultivated a piece of land, whereby its average size was the second largest among the four clusters (Table 3). Crops grown by Chinese VLs HHs were mainly wheat and alfalfa for fodder; on the Mongolian side primarily potatoes, vegetables and rye were cultivated (Figure 4). Livestock keeping, though practised by all VLs HHs, was characterised by very short yearly transhumance distances and minor sales revenues (nearly seven times lower than those of cluster Ltm; see below).
Cluster Ltm comprised 16% of all HHs (86% thereof living in China) and all but one being Kazakh. In Mongolia, three of the eleven Ltm HHs were Torguud, the remaining were Uriankhai. At the time of the interview, most Ltm HHs were encountered between 1130 and 2420 m a.s.l. The illiteracy rate of the household heads was the lowest and the primary and secondary schooling rate the highest among all clusters (Figure 3). With an average of 2.5 and 1.9 adults having off-farm employment on the Chinese and Mongolian sides, respectively, these values were in agreement with the number of employed household members in the other clusters. Assets owned were dominated by electronic devices (Table 3) and across the two countries the total value of assets ranked highest among all clusters. Ltm HHs managed the smallest land area in China, whereas land cropped by Ltm HHs in Mongolia showed numerically higher values; mainly alfalfa and wheat were cultivated in China and rye and vegetables in Mongolia. All Ltm HHs owned livestock with the average numbers of goats, cattle and camels ranking second highest after cluster Lm. The yearly transhumance distance averaged 256 km and was thus the greatest across the clusters. Similarly, the average annual income from livestock (5500 € across countries) was the highest among all clusters in China and Mongolia.
Cluster Lm only comprised Mongolian HHs (23% of all interviewed HH) that were all located between 1100 and 2200 m a.s.l. at the time of the interview. The highest shares of Torguud (19%) and Uriankhai people (56%) were found in this cluster. With 4% of household heads having completed university or equivalent studies, the educational level of household heads was similar to that of Mongolian Vm members, as was the number of adults employed off-farm. Moreover, the cluster also hosted the second highest share of household heads with completed secondary school education (Figure 3). Both the number of assets owned and their cumulated value were highest for cluster Lm than the other clusters on the Mongolian side of the border (Table 3). With 0.89 ha, the average size of cultivated land was moderate among the clusters on the Mongolian side and the crops grown were clearly dominated by potatoes followed by rye. As indicated by the cluster name, livestock husbandry was very important for these HHs that kept the highest number of animals per species (except yak) but bridged only moderate transhumance distances per year and earned the second highest income from livestock in Mongolia (Table 4).
3.3. Livestock Richness and Diversity
Livestock richness ranged between zero and six species and was high in herds of clusters Lm and Ltm, moderate in herds of cluster VLs and low, but with the highest standard deviation, in herds of cluster Vm (Table 4). Across clusters, livestock species richness in Mongolian herds was 69% higher than in Chinese herds (p < 0.001). Expressed in SU, the highest number of small ruminants was determined for Chinese HHs in cluster Ltm. Least differences between clusters were observed for SU of status animals.
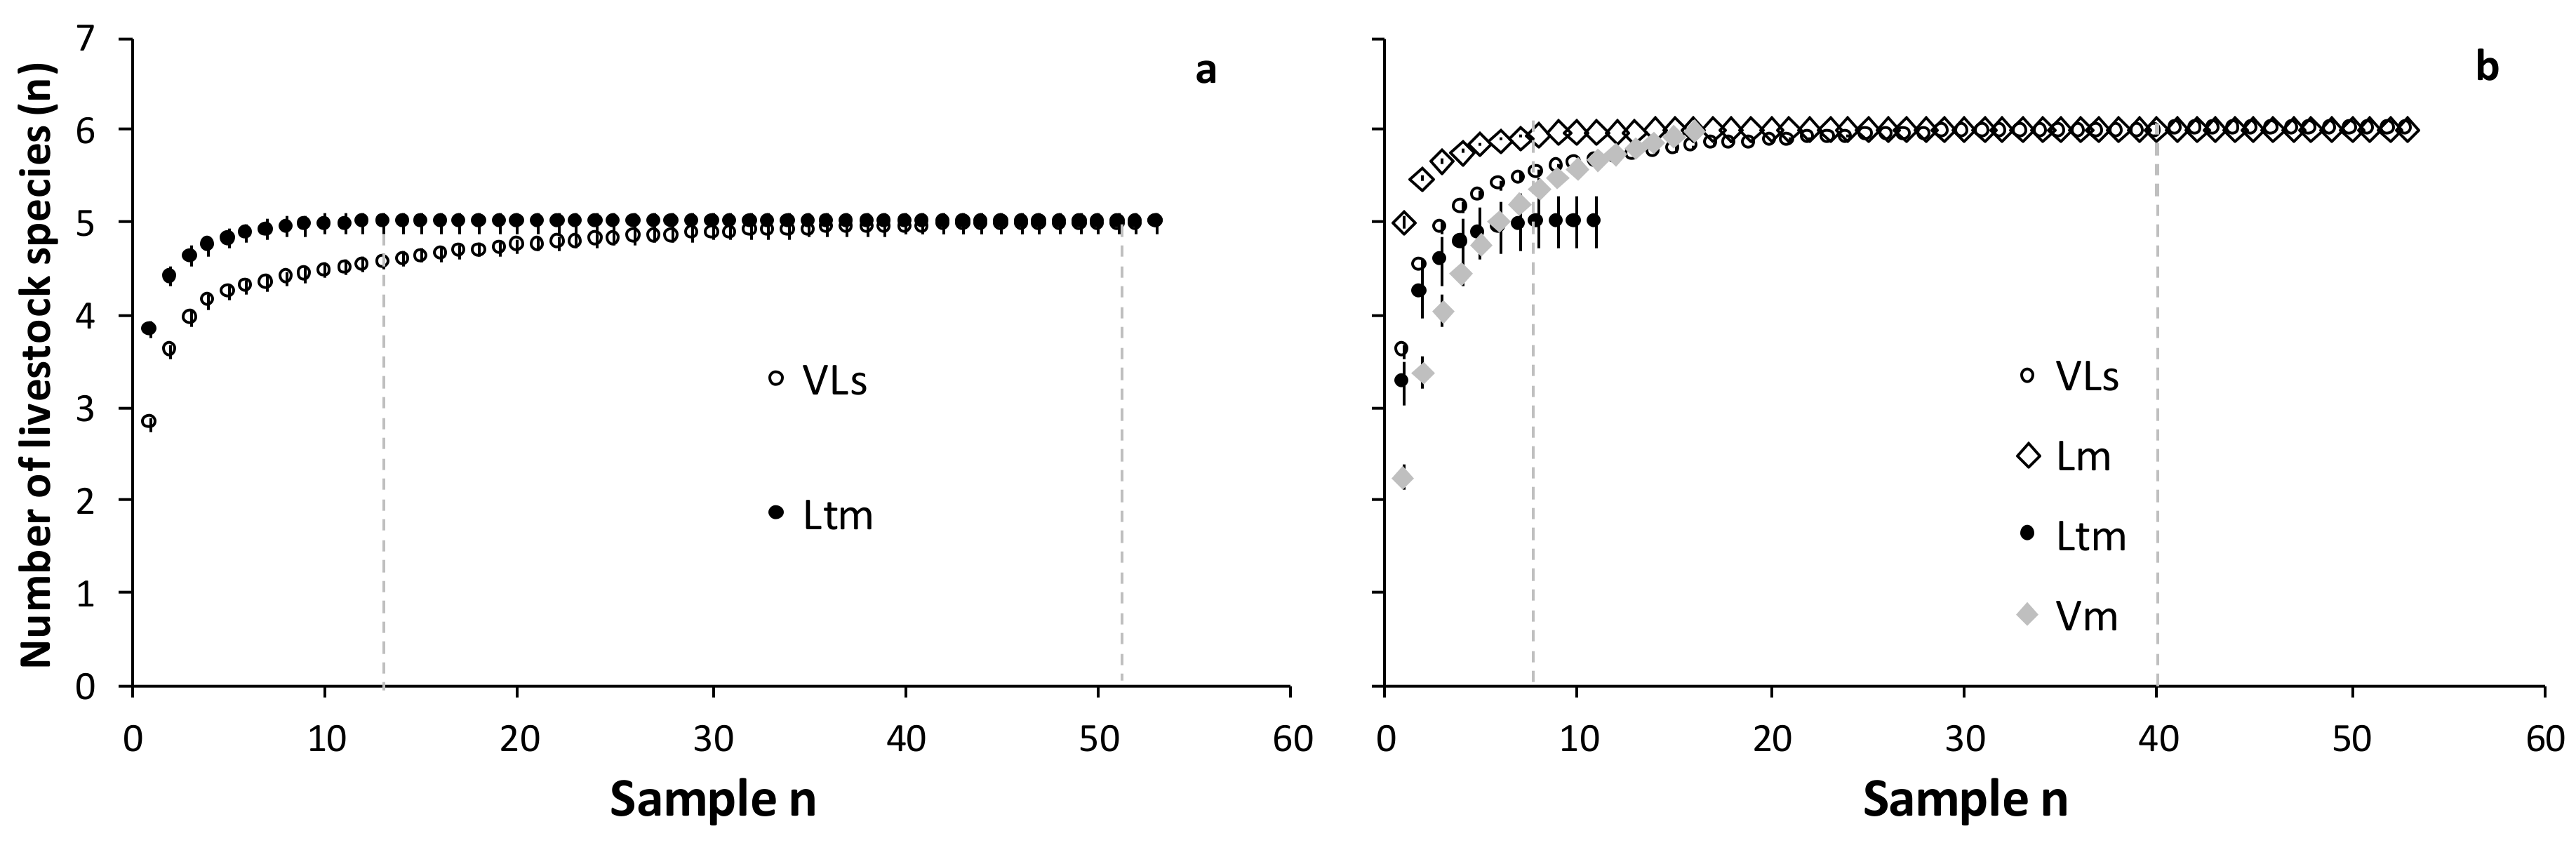
The Simpson diversity was lowest for the herds of cluster Vm, which on average harboured no (China) or only two (Mongolia) species, and highest for species-rich (Mongolian) herds of cluster Lm. Species evenness behaved slightly differently with herds of cluster VLs showing the highest values while Ltm and Vm herds had a moderate to low species evenness. Across clusters, Simpson diversity was 30% higher in Mongolian than in Chinese herds (p = 0.001); species evenness was also 20% higher in Mongolia (p > 0.05). The sample-based livestock species accumulation curves reached complete saturation at a number of five (Figure 5a) and six species (Figure 5b), respectively. The minimum and maximum saturation numbers of samples instead were reached after 13 and 52 (China, Figure 5a) and 8 to 40 (Mongolia, Figure 5b) samples in cluster Ltm and VLs, respectively. Both clusters differed significantly from each other (no overlap of SEM during incline or after curve saturation).
3.4. Household Assets Ownership and Management Strategies
The average number (and the monetary value) of household assets averaged 5 (2166 €) and 8 (1738 €), respectively; hence, Mongolian HHs possessed more items whereas Chinese HHs captured more monetary value with their assets (Table 3). There was a positive correlation between the monetary value captured in assets and a household’s income from livestock production (r = 0.53; p < 0.001). The transportation means (descended share: 1. motorbike (both countries); 2. bicycle (China) and tractor (Mongolia); 3. car (China) and bicycle (Mongolia)) possessed by any household in China averaged 1.6 whereas the average was 1.3 in Mongolia. On the other hand, electronic items (descended share: 1. TV (China) and solar panel (Mongolia); 2. radio (China) and TV (Mongolia); 3. solar panel (China) and radio (Mongolia)) were less widespread among Chinese than Mongolian HHs (1.4–1.7 versus 2.0–2.7). Although more agricultural devices were owned by Mongolian HHs (2.0–4.3) than by their Chinese counterparts (1.1–1.3), their monetary value was much lower.
Cropland was manured by 89%, 78% and 45% of the Chinese HHs in clusters Vm, VLs and Ltm. While the Vm HHs used mostly mineral fertiliser (75%), a mix of mineral and organic fertiliser was preferred by 56% of the VLs HHs. Ltm farmers who applied fertiliser, used mineral, organic and a combination of both at around 33% each. Even though in each cluster more than half of the Mongolian HHs applied fertiliser, the frequencies were lower than in Qinghe (Vm: 88%; VLs: 69%; Ltm: 55%; Lm: 62%). Here, organic inputs (Figure 6) were most frequently applied by Vm (57%), VLs (60%) and Lm (100%) HHs whereas Ltm farmers claimed to prefer mineral fertiliser (65%).
Pesticides (particularly for vegetables) were intensely used by HHs in the Chinese clusters Vm (91%) and VLs (77%), while in Mongolia only 56% and 44% of Vm and VLs farmers applied pesticides—but also 55% of the Lm HHs. On both sides of the border, cropland was flood irrigated by more than half of the HHs in each cluster with Chinese Vm (98%) and VLs (81%) as well as Mongolian Vm (88%) HHs particularly relying on this measure.
Livestock feeding strategies differed between countries and among clusters. With 91% (VLs) and 96% (Ltm) in China and 75% (Vm), 98% (VLs) and 100% (Ltm and Lm) in Mongolia, the vast majority of livestock-keeping HHs offered hay and other feedstuffs to their animals in the wintertime. Thereby, Chinese HHs used on average a similar number of different feeds (2.8–3.2) as Mongolian HHs (2.2–2.9). The largest differences were found within cluster VLs where almost twice as many types of feed were offered in China as Mongolia. Salt (mostly sodium chloride) was supplied throughout the year and especially during the winter months, grass and alfalfa hay, brans, grains and meal leftovers were offered to the animals and complemented the feed intake on pasture. Thereby, combinations of feedstuffs offered were manifold, resulting in 18 different feeding strategies across the surveyed HHs.
4. Discussion
4.1. Cross-Country Comparison of Rural Households’ Socio-Economic Settings
With the restriction of our interviews to rural HHs, we wanted to avoid bias that might otherwise have been introduced by the very rapid infrastructural and economic development of Qinghe in comparison to Bulgan sum city [35,52], since the latter is smaller and has a greater disadvantage in terms of physical infrastructure [53]. Based on the data collected using the same questionnaire on both sides of the border, a separation of four distinct but homogeneous clusters across the two countries was possible (Appendix A, Figure A1). This is in agreement with outcomes of cross-country studies from Africa [45,54] and shows that the rural livelihood strategies are not very different in the remote regions of these two countries despite their divergent economic and infrastructural development, as well as political setting [55]. This conclusion is furthermore supported by the fact that the relative representation of HHs in clusters Vm, VLs and Vtm was analogous in both countries. Moreover, as in other rural areas of Asia [56], the subsistence-oriented crop–livestock system (VLs) dominated, especially in China (51% of interviewed Chinese HHs).
One striking difference was the higher rural illiteracy rate found in China compared to Mongolia where more advanced educational levels prevailed. In the past, minority groups in China had fewer chances to obtain higher education [57]; therefore, many Kazakhs lack knowledge of Mandarin Chinese [5,58], which until today prevents them (and other minorities) from efficiently starting off-farm activities in China [59].
In Mongolia, the communist system had enforced education on everyone, even in rural areas [35]. Given the average age of the interviewed farmers of about 50 years, most of them have benefitted from the pro-education policy of the communist era. After the abandonment of socialism in the early 1990s and until recently, this policy vanished [60,61]. Yet, good education is still highly valued in rural areas and many families of Bulgan sum send their children to high school and later to university in Khovd or Ulaanbaatar [35], many of them envisaging that their children will leave the border area for good. Since the introduction of government settlement plans in China, older people and children of rural (mobile herding) families have been staying throughout the year in the low-laying winter settlements [62]. According to our survey data, many young people have benefitted from this policy and have better education than their parents have. Concurrently, most of the interviewed household heads were eager to offer their children good career options by sending them to school.
Whereas in China 12%, 27% and 14% of the Vm, VLs and Ltm HHs benefitted from off-farm income earned by one or more members, the respective proportions in Mongolia were only 3%, 18% and 2%, despite on average better education of the Mongolian interviewees. This was similarly described by [63] for a region at the southeastern border of Mongolia and Inner Mongolia (China). These authors narrowed the phenomenon down to the inferior development of infrastructure and local economy in Mongolia, which is, in contrast to China, only weakly and communally regulated by governmental bodies. With completion of the paved road between the city of Khovd and our study region in the summer of 2017, employment and other off-farm income earning opportunities may now improve for the Mongolian HHs studied and might accelerate the process of sedentarisation of so-far mobile HHs (especially of clusters Vm and VLs) in the sum centres. In addition, temporary migration of household members to Khovd might be triggered, which is similar to what has been reported by [63] for the easternmost border region of Mongolia with China.
4.2. Livestock Contribution to Livelihoods
Our sample-based species accumulation curves reached, on average, saturation after 25 samples and at a level of five and six species, indicating a sufficient sampling of the observed livestock species in the Chinese and Mongolian study sites. Most courses behaved similarly, (i) indicating the robustness of the cluster assignments and (ii) suggesting that other species, such as chicken or pig (which have been sighted but were not encountered in the sample set), are extremely rare due to climatic (chicken and pigs) and cultural reasons (pigs are not kept by Muslim Kazakh and Hui families). The higher livestock species richness in the market-oriented (Lm) and the traditional (Ltm) livestock clusters as compared to the mixed subsistence-oriented cluster (VLs) is in agreement with the findings of [64] in Uganda where the highest livestock species richness was found on semi-commercial farms. Analogous to the higher crop species diversity in market-oriented than in subsistence-oriented urban gardens in West Africa [65], higher (plant or animal) species diversity allows them to exploit several market niches and reduces the production risks immanent in a specialised system [66]. Such findings also contradict the common impression that commercialisation of agricultural activities always leads to specialisation and loss of agrobiodiversity [67,68]. While in natural plant and animal community studies the species richness approach is frequently used to characterise ecosystems (cf. [69]), as well as to evaluate sample size and predict potential species richness based on species accumulation curves (cf. [70]), the application of this approach is under-utilised in livestock-related research [71,72]. Recently, [73] proposed livestock species richness (one indicator out of five) to easily assess agrobiodiversity on a farm scale. As our results show, livestock species richness can be reliably determined from a sample of thirty herds in the study area. This and the related diversity and evenness indices allow an evaluation of the following: (i) the use of rangeland resources through animals complementing one another in their selectivity or exerting pressure on the same forage species [74] and (ii) the scope of livestock functions such as insurance, fungibility [66], self-sufficiency and food security [75].
Concerning livestock ownership, a higher overall proportion of people in Mongolia kept animals than in China. After the disastrous winter (dzud) of 2009/2010, livestock numbers across Mongolia and our study region declined abruptly to the values of the 1980s, but immediately afterwards the animal numbers of all species rapidly increased again [37]. While sheep dominate the Chinese herds and prevailed in the Mongolian herds until 1993, goats dominate the Mongolian herds today on the provincial level [37] as well as in our study [7]. The shares of cattle and horses were and still are relatively stable, whereas the share of camels has steadily decreased throughout the last decades [34,37]. Total revenue from livestock activities was lower in Mongolia (1040 €) than in China (2270 €). While in China, live animal (sheep) sales dominated over product sales, cashmere wool sales (from goats) were the primary commodity in Mongolia. Generally, in China, the price of mutton increased more than three times from 2007 (1.9 €/kg) to 2013 (7.2 €/kg) and continues to rise [76]. This is partly due to governmental incentives promoting animal sales in the case of Inner Mongolia, China [63], as well as to good road infrastructure and transportation facilities that enable herders to sell their animals directly at larger regional and urban markets [77] rather than to local traders for a low price [63]. In addition, a rising standard of living and rapid urbanisation in Xinjiang Province (promoted by the government-supported settlement of Han Chinese [78]) is stimulating the regional meat consumption.
In Mongolia, raw cashmere wool yields 63–70% of a family’s yearly cash income [8]. Hence, livestock-related cash income in the Mongolian study HHs was mainly coming from sales of cashmere wool (71%), whereas sales of live animals (20%), animal skins (7%) and sheep and camel wool (2%) were of subordinate importance. However, sheep wool sales are currently promoted by the Mongolian government [79] to offset the high goat numbers and the related problems of rangeland (over)use [80,81]. In our study region, 15 out of the 225 interviewed HHs sold sheep wool in 2011; in 2017, their number has increased to 456 (own observation in summer 2017) due to the relatively attractive governmental price for raw sheep wool of 1.19 € per kilogram.
4.3. Relevance of Land for Livelihood Strategies
Even if not owned but only managed based on a long-term lease [63], croplands, though mostly small, are an integral part of all rural livelihood strategies in China as well as in our Mongolian study region, whereby the average plot size for all clusters is smaller on the Mongolian side. Yet, even in the clusters focussing on livestock activities (Ltm, Lm), a high share of HHs managed croplands [82]. Likewise, haymaking areas are vast and are present in each cluster on both sides of the border and used to build up winter hay stocks (Figure A3C). These hayfields are mostly located along the Qinghe (China) and Bulgan (Mongolia) Rivers, in less productive sites with poor soil, temporary flooding and the absence of irrigation facilities [82]. Fertiliser is not applied and the herbaceous biomass production (of natural vegetation) is low. Even though the livestock-less Chinese Vm families sell hay, they do not earn much from it. In Mongolia, hayfields of Lm and VLs HHs are twice as large as those of the livestock-richest cluster Ltm. Many of the latter families overcome the winter fodder shortage by long distance tracking with small ruminants [7]. Whereas the Chinese Ltm HHs practise transhumance in a similarly intensive manner (distances > 200 km/year), haymaking replaces tracking [35,82] in clusters VLs (both countries) and Lm (Mongolia). Even though haymaking is a rather new strategy on both sides of the border, introduced in Mongolia during the socialist era [35] while allocated to households of Qinghe in 1985 [83], in both countries “the purchase and storage of forage has become an important adaptation strategy to cope with uncertainties in precipitation and vegetation productivity” [63].
4.4. Intensity of Crop and Livestock Activities
The higher number of transportation assets, including tractors, in the Chinese clusters Vm, VLs and Ltm as compared to their Mongolian counterparts were counterbalanced by a higher number of agricultural assets in these clusters, as well as a higher number of electronic (telecommunication) devices on the Mongolian side. These differences may have various explanations, such as better road infrastructure [35], a higher labour force in China, and the need for up-to-date weather information of the many still mobile HHs in Mongolia. The advent of large-scale agricultural production in both regions from the early 1980s onwards [35,52] focused on wheat and potato and led to yield increases until the 1990s. However, poor management of these areas (over-irrigation, poor drainage) led to salinisation of topsoil and abandonment in Qinghe [52] as well as parts of Bulgan sum [82,84]. This is also reflected in the yield data, which stagnated or declined from the 1990s onwards and shows since then large inter-annual variation (Appendix A, Figure A2).
Even though in Qinghe County sedentary Han HHs (mainly cluster Vm) manage their crop fields more intensely than sedentary Kazakhs (mainly cluster VLs), differences between these clusters with regard to irrigation and fertiliser and pesticide applications are moderate, whereas the still mobile (transhumant) Kazakh HHs of cluster Ltm recur less frequently to these practices. On the Mongolian side, mineral fertiliser application, pesticide use and irrigation are less frequently used, not only in the livestock-based clusters of Ltm and Lm but also in clusters Vm and VLs where cropping is a prominent aspect of the livelihood strategy. Concerning livestock activities, winter stall-feeding [85] and haymaking (Section 4.3) are ubiquitous strategies across the study area but with a higher intensity in China.
From these insights, it appears that next to the sale of multiple animal products (Section 4.2), crop–livestock integration is the predominant livelihood strategy in Mongolia across all clusters. In neighbouring Qinghe County, on the other hand, between 75% and 90% of the sedentary rural HHs (73% of our Chinese sample) are following a specialisation (Vm) and intensification strategy in their agriculture (Vm, VLs) and animal husbandry (VLs, Ltm) activities.
The biggest drawback of this study is certainly the spatial limitation as the entire area and adjacent provinces and counties, respectively, are large and by no means homogeneously structured in terms of environment, economy and political conditions. The integration and/or exclusion of one of the study locations may affect tremendously the outcomes of the study. Moreover, it only depicts the current status of the livelihood strategies in the region, which are obviously subject to significant transformation processes. Therefore, generalisations and transferability of results to neighbouring regions within China and Mongolia, respectively, might be limited. Findings by [63] in the easternmost border area between China and Mongolia have drawn a picture of governmental-shaped livelihood strategies similar to our findings in the westernmost border area. This, in our view, indicates that (1) along the 4677 km Chinese–Mongolian border there are similar differences between the rural areas on the Chinese and Mongolian sides; and (2) the socio-economic developments within each country along that border seem to be related. Further case studies along the border region would be needed to verify this hypothesis.
5. Conclusions
This cross-border comparison of rural livelihoods in the westernmost territories of China and Mongolia departed from the question of whether environmental or anthropogenic components are more decisive in shaping the evolution of rural livelihood strategies. Our analysis indicates that up to very recently the livelihood strategies on both sides of the border were the same, manifesting in the fact that we can define three identical clusters across the countries (environment factor), even though there are slight differences in land, livestock, and asset endowment. Yet, we perceive a more rapid and decisive livelihood specialisation (anthropogenic factor) in China as an effect of population growth, market development, infrastructure build-up, educational improvements and promotion of sedentarisation. In Mongolia, livelihood diversification and intensification remain in the initial stages, although trial plots (sea buckthorn plantations), innovative value chain initiatives for livestock (coloured cheese; Appendix A, Figure A3D) and niche products (fruit jam and juice) are existing at the farm level (small-scale). In contrast, vegetable and meat products in China appeal to consumers demanding diverse food items (for instance, Han Chinese favour a diverse range of vegetables and even halal food, which is considered as being cleaner) compared to Mongolia. As land privatisation will unlikely be promoted in the near future, a major socio-economic change in the next couple of years is not expected. However, a complete turn to off-farm income earning is gaining momentum in both countries, whereby China offers more diverse opportunities. Further improving education, infrastructure and value chain development could in both rural areas foster (supplementary) income earning from either on- or off-farm activities and therefore may increase agricultural specialisation. Further improvements that could be explored by local and regional government bodies, farmer associations and national as well as international non-governmental organisations are organic livestock and crop production, product diversification and marketing (farmers’ markets, labelling incl. geographical indication) across the border and within Mongolia. Such strategies could foster the ongoing trends of integration as well as specialisation of livelihood strategies in the region and on the Mongolian side and enhance its attraction for younger generations.
Acknowledgments
This research was carried out within the WATERCOPE Project funded by the International Fund for Agricultural Development, Rome, Italy (IFAD; grant I-R-1284). We are grateful to the large number of families who made this research possible with substantial and interesting aspects of their daily lives. Great thanks go to Baigal Ulziisuren who contributed a considerable amount of household data from Bulgan sum city. We are grateful to the administrative and logistic support provided by Nergui Soninkishig and Nyambayar Dashzeveg from the National University of Mongolia in Ulaanbaatar, by Ximing Zhang and Guojun Liu from the Chinese Academy of Sciences in Urumqi, and by Andreas Buerkert from the University of Kassel. Finally, yet importantly, sincere thanks go to Andrew Siess for his diligent proofreading.
Author Contributions
Munkhnasan Tsvegemed, Alimu Shabier, Eva Schlecht, and Greta Jordan conceived and designed the sampling design and conducted the interviews; Eva Schlecht and Martin Wiehle analysed the data and wrote the paper.
Conflicts of Interest
The authors declare no conflict of interest. The founding sponsors had no role in the design of the study; in the collection, analyses, or interpretation of data; in the writing of the manuscript, and in the decision to publish the results.
Appendix A

Table A1.
Categorical principal component analysis (CATPCA) component loadings of the most explanatory variables.
Table A1.
Categorical principal component analysis (CATPCA) component loadings of the most explanatory variables.
| Variable | Component Loadings | |
|---|---|---|
| 1 | 2 | |
| No. of family members | 0.670 | −0.525 |
| Cropland | −0.366 | 0.275 |
| Livestock | −0.739 | 0.981 |
| No. of goats | 0.727 | 0.468 |
| No. of horses | 0.623 | 0.439 |
| No. of camels | 0.605 | 0.271 |
| Total no. of animals | 0.809 | 0.619 |
| Total income from animals | 0.392 | 0.460 |
| Total no. of assets | 0.831 | −0.339 |
Figure A1.
Categorical principal component analysis (CATPCA) biplot indicating the observed cases (households) and component loadings (adjusted to the scale of objects) of the most explanatory variables.
Figure A1.
Categorical principal component analysis (CATPCA) biplot indicating the observed cases (households) and component loadings (adjusted to the scale of objects) of the most explanatory variables.

Figure A2.
Official yield data (fresh matter) for three major crop species/categories in Bulgan sum between 1983 and 2006/09. Discontinuity of lines indicates year data gaps. Source: Animal Breeding and Veterinary Unit of Bulgan sum, Khovd Province, 2012.
Figure A2.
Official yield data (fresh matter) for three major crop species/categories in Bulgan sum between 1983 and 2006/09. Discontinuity of lines indicates year data gaps. Source: Animal Breeding and Veterinary Unit of Bulgan sum, Khovd Province, 2012.

Figure A3.
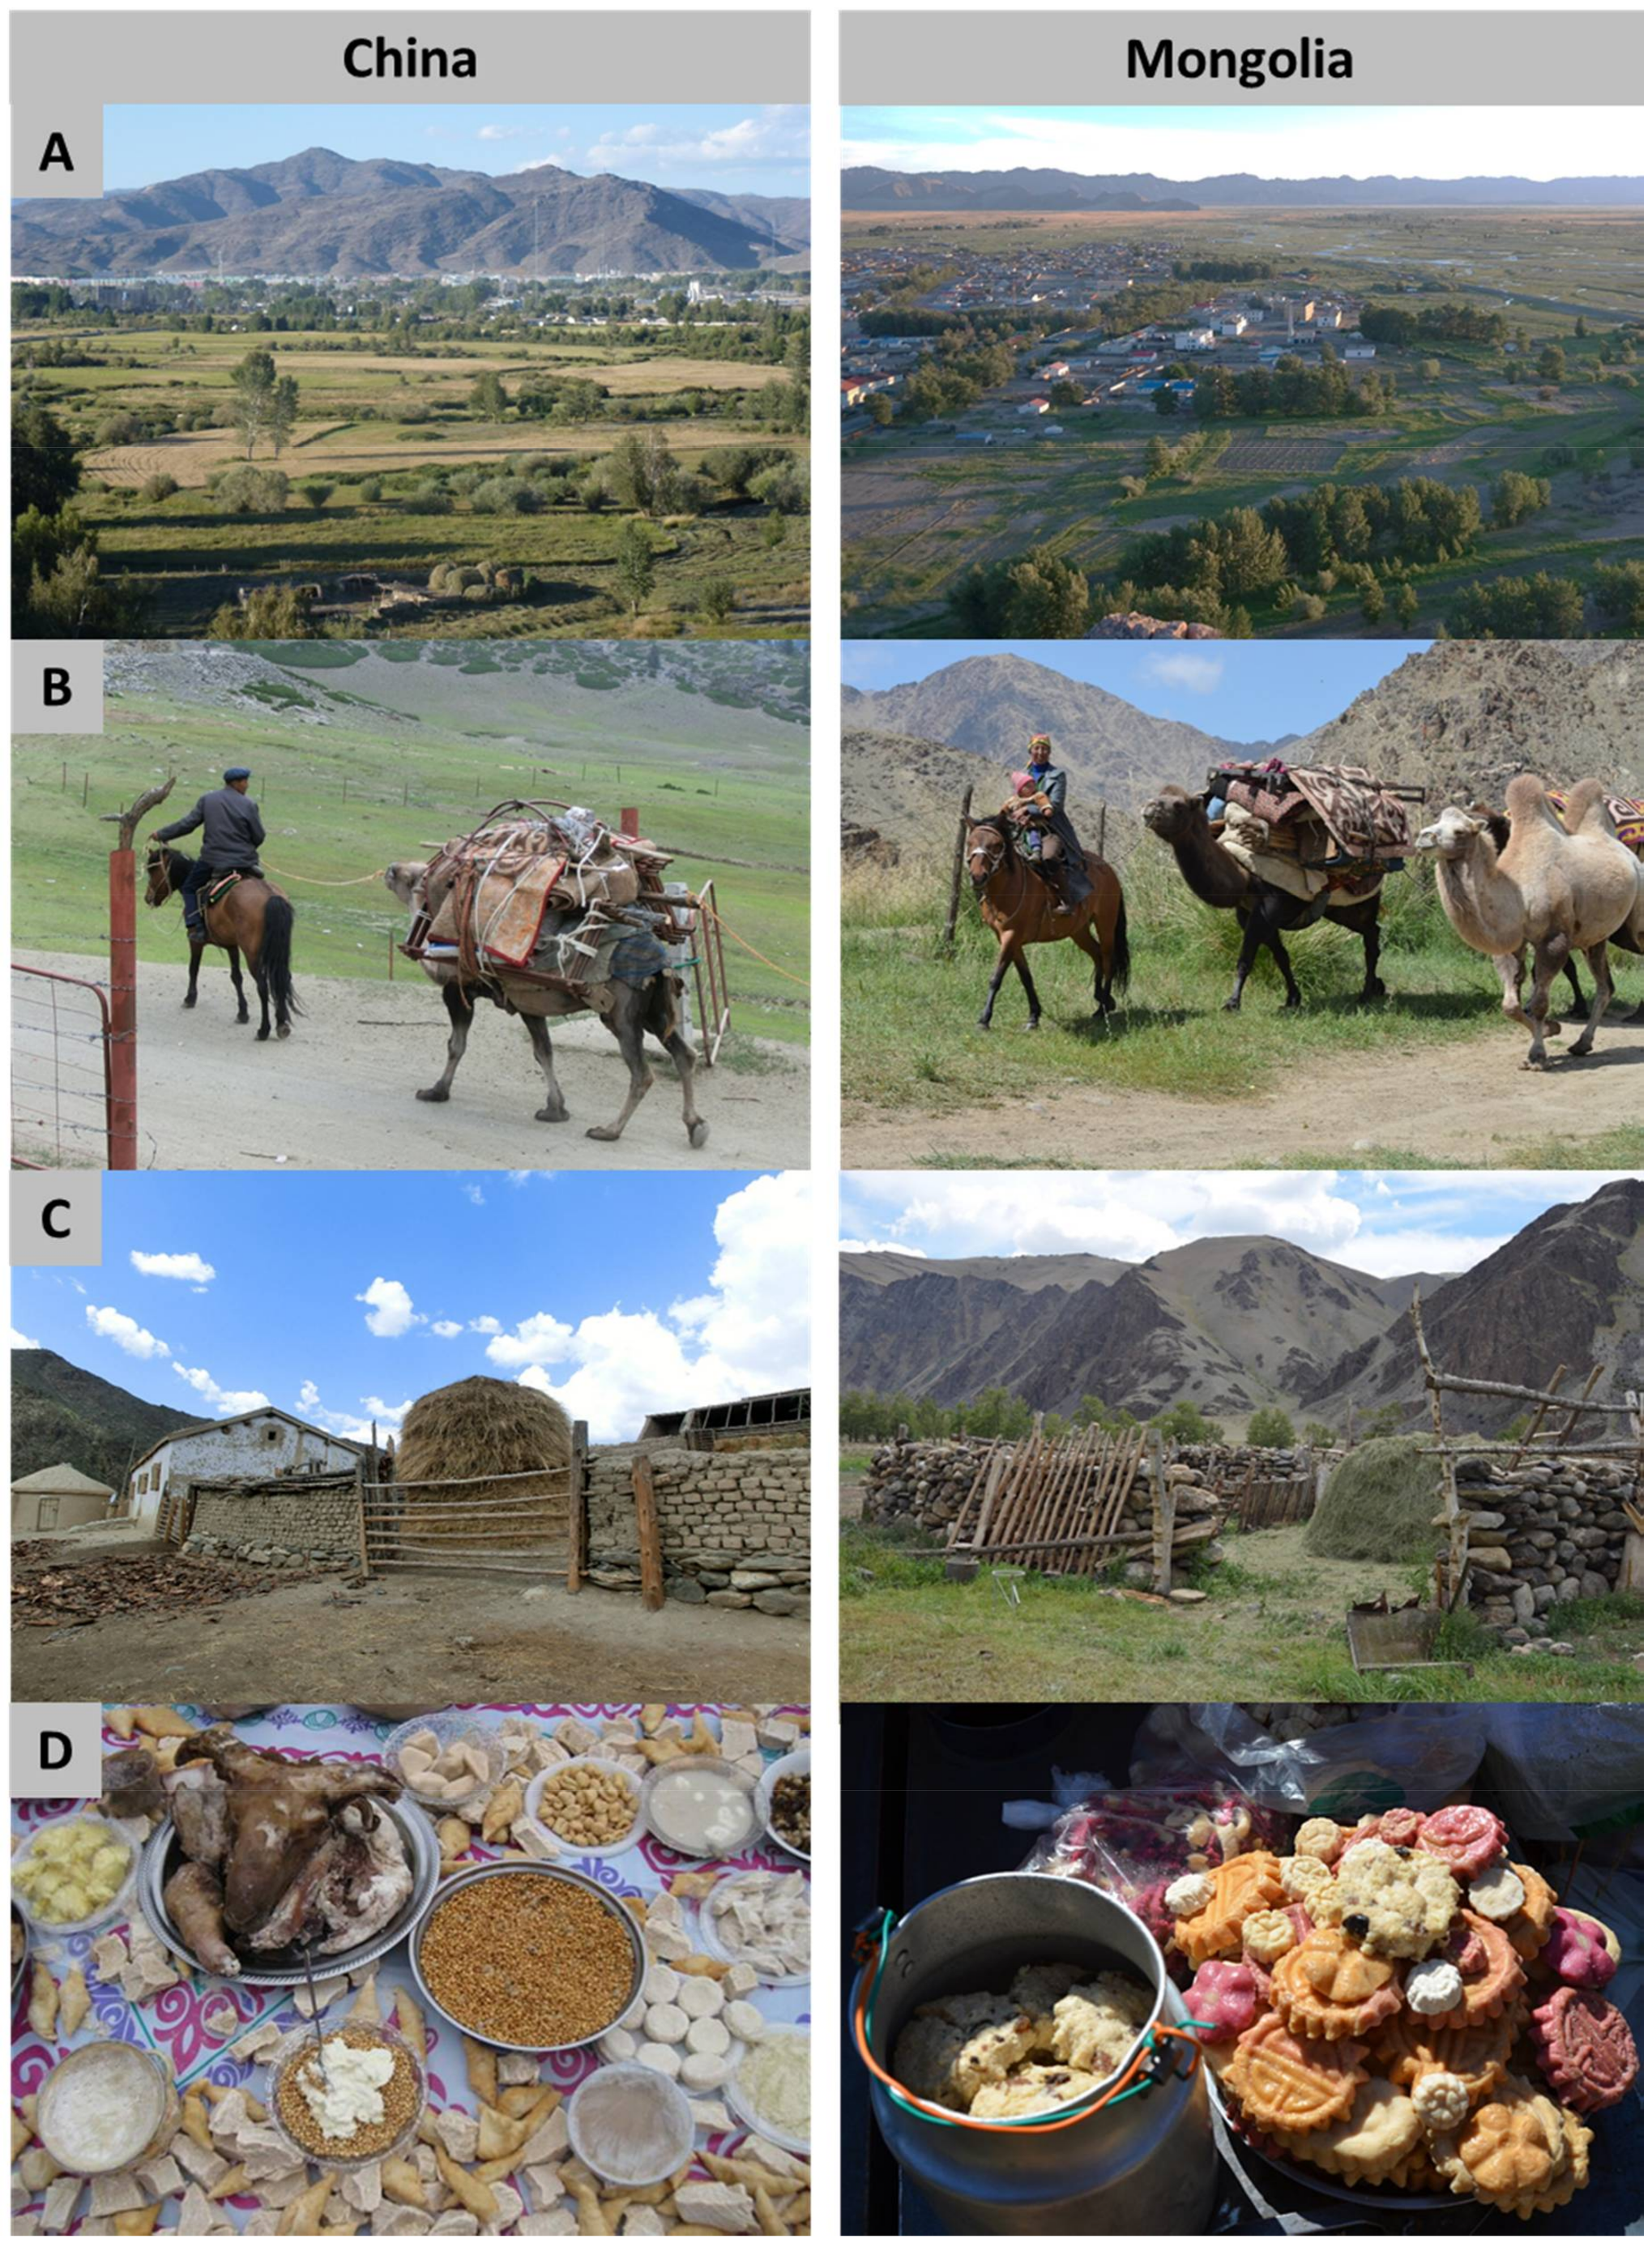
(A–D) Similar features in China (left) and Mongolia (right). (A) View on the river oases (riparian forests) of the centres of Qinghe and Bulgan sum; (B) Migration from spring to summer pastures in China, thereby passing through an officially regulated pasture gate; free migration from summer to autumn pasture in Mongolia; (C) Hay stocks in both countries (please note: hay in both countries is deposited close to houses as well as within riparian forest areas—it is anyhow fenced); (D) Typical food stuffs (local cheese, butter, cream, cooked meat, fried wheat grains) offered by herders in China; differently coloured and flavoured cheeses at a local fair in Bulgan sum, a kind of innovative product.
Figure A3.
(A–D) Similar features in China (left) and Mongolia (right). (A) View on the river oases (riparian forests) of the centres of Qinghe and Bulgan sum; (B) Migration from spring to summer pastures in China, thereby passing through an officially regulated pasture gate; free migration from summer to autumn pasture in Mongolia; (C) Hay stocks in both countries (please note: hay in both countries is deposited close to houses as well as within riparian forest areas—it is anyhow fenced); (D) Typical food stuffs (local cheese, butter, cream, cooked meat, fried wheat grains) offered by herders in China; differently coloured and flavoured cheeses at a local fair in Bulgan sum, a kind of innovative product.

References
- Zimmerer, K.S.; Carney, J.A.; Vanek, S.J. Sustainable smallholder intensification in global change?: Pivotal spatial interactions, gendered livelihoods, and agrobiodiversity. Curr. Opin. Environ. Sustain. 2015, 14, 49–60. [Google Scholar] [CrossRef]
- United Nations. Transforming Our World: The 2030 Agenda for Sustainable Development: A/RES/70/1; United Nations, Division for Sustainable Development: New York, NY, USA, 2015. [Google Scholar]
- Hosseini, M.H.; Kaneko, S. Causality between pillars of sustainable development: Global stylized facts or regional phenomena? Ecol. Indic. 2012, 14, 197–201. [Google Scholar] [CrossRef]
- Serageldin, I. Promoting Sustainable Development towards a New Paradigm; Rajiv Gandhi Institute for Contemporary Studies: New Delhi, India, 1994. [Google Scholar]
- Liao, C.; Barrett, C.; Kassam, K.-A. Does diversification improve livelihoods?: Pastoral households in Xinjiang, China. Dev. Chang. 2015, 46, 1302–1330. [Google Scholar] [CrossRef]
- Suzuki, Y. Conflict between mining development and nomadism in Mongolia. In The Mongolian Ecosystem Network: Environmental Issues under Climate and Social Changes; Yamamura, N., Fujita, N., Maekawa, A., Eds.; Springer: Tokyo, Japan; New York, NY, USA, 2013. [Google Scholar]
- Jordan, G.; Goenster, S.; Munkhnasan, T.; Shabier, A.; Buerkert, A.; Schlecht, E. Spatio-temporal patterns of herbage availability and livestock movements: A cross-border analysis in the Chinese-Mongolian Altay. Pastoralism 2016, 6, 12. [Google Scholar] [CrossRef]
- Lkhagvadorj, D.; Hauck, M.; Dulamsuren, C.; Tsogtbaatar, J. Pastoral nomadism in the forest-steppe of the Mongolian Altai under a changing economy and a warming climate. J. Arid. Environ. 2013, 88, 82–89. [Google Scholar] [CrossRef]
- Middleton, N.; Rueff, H.; Sternberg, T.; Batbuyan, B.; Thomas, D. Explaining spatial variations in climate hazard impacts in western Mongolia. Landsc. Ecol. 2015, 30, 91–107. [Google Scholar] [CrossRef]
- Becquelin, N. Staged development in Xinjiang. China Q. 2004, 178, 358–378. [Google Scholar] [CrossRef]
- Conte, T.J.; Tilt, B. The effects of China’s grassland contract policy on pastoralists’ attitudes towards cooperation in an Inner Mongolian banner. Hum. Ecol. 2014, 42, 837–846. [Google Scholar] [CrossRef]
- Kreutzmann, H. The tragedy of responsibility in high Asia: Modernizing traditional pastoral practices and preserving modernist worldviews. Res. Policy Pract. 2013, 3. [Google Scholar] [CrossRef]
- Liao, C.; Morreale, S.J.; Kassam, K.-A.S.; Sullivan, P.J.; Fei, D. Following the green: Coupled pastoral migration and vegetation dynamics in the Altay and Tianshan Mountains of Xinjiang, China. Appl. Geogr. 2014, 46, 61–70. [Google Scholar] [CrossRef]
- Squires, V.R.; Lu, X.; Lu, Q.; Wang, T.; Yang, Y. Rangeland Degradation and Recovery in China’s Pastoral Lands; CABI: Wallingford, CT, USA, 2009. [Google Scholar]
- Brown, C.G.; Waldron, S.A.; Longworth, J.W. Sustainable Development in Western China: Managing People, Livestock and Grasslands in Pastoral Areas; Brown, C.G., Waldron, S.A., Longworth, J.W., Eds.; Edward Elgar: Cheltenham, UK, 2008. [Google Scholar]
- Gongbuzeren; Li, Y.; Li, W. China’s rangeland management policy debates: What have we learned? Rangel. Ecol. Manag. 2015, 68, 305–314. [Google Scholar] [CrossRef]
- Hua, L.; Squires, V.R. Managing China’s pastoral lands: Current problems and future prospects. Land Use Policy 2015, 43, 129–137. [Google Scholar] [CrossRef]
- Yeh, E.T. Green governmentality and pastoralism in western China: Converting pastures to grasslands. Nomad. Peoples 2005, 9, 9–30. [Google Scholar] [CrossRef]
- Harris, R.B. Rangeland degradation on the Qinghai-Tibetan plateau: A review of the evidence of its magnitude and causes. J. Arid. Environ. 2010, 74, 1–12. [Google Scholar] [CrossRef]
- Moll, H.A.J.; Staal, S.J.; Ibrahim, M.N.M. Smallholder dairy production and markets: A comparison of production systems in Zambia, Kenya and Sri Lanka. Agric. Syst. 2007, 94, 593–603. [Google Scholar] [CrossRef]
- FAO. The State of Food and Agriculture: Livestock in the Balance; Food and Agriculture Organization of the United Nations: Rome, Italy, 2009. [Google Scholar]
- Pica-Ciamarra, U.; Tasciotti, L.; Otte, J.; Zezza, A. Livestock Assets, Livestock Income and Rural Households: Cross-Country Evidence from Household Surveys; FAO: Rome, Italy, 2011. [Google Scholar]
- Fernández-Giménez, M.E. Sustaining the steppes: A geographical history of pastoral land use in Mongolia. Geogr. Rev. 1999, 89, 315–342. [Google Scholar] [CrossRef]
- Batima, P.; Natsagdorj, L.; Gombluudev, P.; Erdenetsetseg, B. Observed Climate Change in Mongolia. Assessments of Impacts and Adaptations to Climate Change AIACC Working Paper 2005. Available online: http://www.start.org/Projects/AIACC_Project/working_papers/Working%20Papers/AIACC_WP_No013.pdf (accessed on 26 April 2017).
- CIA. CIA World Factbook 2017. Available online: www.indexmundi.com/mongolia/economy_profile.html (accessed on 20 January 2018).
- Griffin, K.B. Poverty and the Transition to a Market Economy in Mongolia; Macmillan: Basingstoke, UK, 1995. [Google Scholar]
- Anderson, J.H.; Lee, Y.; Murrell, P. Competition and privatization amidst weak institutions: Evidence from Mongolia. Econ. Inq. 2000, 38, 527–549. [Google Scholar] [CrossRef]
- MFA and SDC. National Report on the Rangeland Health of Mongolia; Swiss Agency for Development and Cooperation’s (SDC); Ministry of Food and Agriculture; Administration of Land Affairs, Geodesy and Cartography; Information and Research Institute of Meteorology and Hydrology: Ulaanbatar, Mongolia, 2015; Available online: https://jornada.nmsu.edu/files/Mongolia-Rangeland-health-Report_EN.pdf (accessed on 22 March 2018).
- Lise, W.; Hess, S.; Purev, B. Pastureland degradation and poverty among herders in Mongolia: Data analysis and game estimation. Ecol. Econ. 2006, 58, 350–364. [Google Scholar] [CrossRef]
- Lkhagvadorj, D.; Hauck, M.; Dulamsuren, C.; Tsogtbaatar, J. Twenty years after decollectivization: Mobile livestock husbandry and its ecological impact in the Mongolian forest-steppe. Hum. Ecol. 2013, 41, 725–735. [Google Scholar] [CrossRef]
- Saizen, I. Change in livestock species and their spatial distribution. In The Mongolian Ecosystem Network: Environmental Issues under Climate and Social Changes; Yamamura, N., Fujita, N., Maekawa, A., Eds.; Springer: Tokyo, Japan; New York, NY, USA, 2013. [Google Scholar]
- Shi, Y.; Shen, Y.; Kang, E.; Li, D.; Ding, Y.; Zhang, G.; Hu, R. Recent and future climate change in Northwest China. Clim. Chang. 2007, 80, 379–393. [Google Scholar] [CrossRef]
- Batbaatar, M.; Bold, T.; Marshall, J.; Oyuntsetseg, D.; Tamir, C.; Tumennast, G. Children on the Move: Rural-Urban Migration and Access to Education in Mongolia; Childhood Poverty Research and Policy Centre (CHIP): London, UK, 2005. [Google Scholar]
- National Statistics of Mongolia. Mongolian Statistical Yearbook; National Statistics of Mongolia: Ulaanbaatar, China, 2013. [Google Scholar]
- Mróz, L. The trans-Altai Torgut and Bulgan after forty years. Ethnol. Pol. 2016, 2015, 31–51. [Google Scholar]
- Wieland, B.; Batsukh, B.; Enktuvshin, S.; Odontsetseg, N.; Schuppers, M. Foot and mouth disease risk assessment in Mongolia—Local expertise to support national policy. Prev. Vet. Med. 2015, 120, 115–123. [Google Scholar] [CrossRef] [PubMed]
- Statistical Department of Khovd Province. Statistical Yearbook of Khovd Province; Statistical Department of Khovd Province: Jargalant, Mongolia, 2013. [Google Scholar]
- Suess-Reyes, J.; Fuetsch, E. The future of family farming: A literature review on innovative, sustainable and succession-oriented strategies. J. Rural. Stud. 2016, 47, 117–140. [Google Scholar] [CrossRef]
- Fu, Q.; Li, B.; Yang, L.; Wu, Z.; Zhang, X. Ecosystem services evaluation and its spatial characteristics in Central Asia’s arid regions: A case study in Altay Prefecture, China. Sustainability 2015, 7, 8335–8353. [Google Scholar] [CrossRef]
- Reynolds, S.G. Providing Winter Bases for Transhumant Herders in Altai, Xinjiang China: Some Consequences and Lessons Learned. Available online: www.treesearch.fs.fed.us/pubs/22872 (accessed on 26 April 2017).
- Gomboluudev, P.; Davaanyam, L. Some issue regarding climate change in Khovd Province. In Climate Changes of High Altitude Mountain Zone; Admon Print LLC: Ulaanbaatar, Mongolia, 2012. [Google Scholar]
- Frerkes, M. Adaptation of the Community Land Model to the Mongolian Altay Region. Master’s Thesis, University of Bonn, Bonn, Germany, 2013. [Google Scholar]
- ADB. Xinjiang Altay Urban Infrastructure and Environment Improvement Project: Resettlement Plan for Qinghe County Municipal Infrastructure and Environmental Improvement Project; ADB: Qinghe County Construction Bureau, China, 2010; Available online: https://www.adb.org/projects/documents/xinjiang-altay-urban-infrastructure-and-environment-improvement-project-qinghe-co (accessed on 30 August 2015).
- Hu, Z.; Zhang, D. China Country Pasture/Forage Resource Profiles; FAO: Rome, Italy, 2006. [Google Scholar]
- Dossa, L.H.; Abdulkadir, A.; Amadou, H.; Sangare, S.; Schlecht, E. Exploring the diversity of urban and peri-urban agricultural systems in Sudano-Sahelian West Africa: An attempt towards a regional typology. Lands. Urban Plan. 2011, 102, 197–206. [Google Scholar] [CrossRef]
- Linting, M.; Meulman, J.J.; Groenen, P.J.F.; van der Koojj, A.J. Nonlinear principal components analysis: Introduction and application. Psychol. Methods 2007, 12, 336–358. [Google Scholar] [CrossRef] [PubMed]
- Chiu, T.; Fang, D.; Chen, J.; Wang, Y.; Jeris, C. A robust and scalable clustering algorithm for mixed type attributes in large database environment. In Proceedings of the Seventh ACM SIGKDD International Conference on Knowledge Discovery and Data Mining, San Francisco, CA, USA, 26–29 August 2001; Provost, F., Srikant, R., Eds.; ACM Press: New York, NY, USA, 2001. [Google Scholar]
- Greenacre, M.J.; Blasius, J. Correspondence analysis and related methods. In Multiple Correspondence Analysis and Related Methods; Greenacre, M.J., Blasius, J., Eds.; Chapman & Hall/CRC Press: London, UK; Boca Raton, FL, USA, 2006. [Google Scholar]
- Rousseeuw, P.J. Silhouettes: A graphical aid to the interpretation and validation of cluster analysis. J. Comput. Appl. Math. 1987, 20, 53–65. [Google Scholar] [CrossRef]
- Jain, R.; Koronios, A. Innovation in the cluster validating techniques. Fuzzy Optim. Decis. Mak. 2008, 7, 233–241. [Google Scholar] [CrossRef]
- Hill, M.O. Diversity and evenness: A unifying notation and its consequences. Ecology 1973, 54, 427–432. [Google Scholar] [CrossRef]
- Dittrich, A.; Buerkert, A.; Brinkmann, K. Assessment of land use and land cover changes during the last 50 years in oases and surrounding rangelands of Xinjiang, NW China. J. Agric. Rural. Dev. Trop. 2010, 111, 129–142. [Google Scholar]
- Soma, T.; Schlecht, E. The relevance of herders’ local ecological knowledge on coping with livestock losses during harsh winters in western Mongolia. Pastoralism 2018, 8, 54. [Google Scholar] [CrossRef]
- Roessler, R.; Mpouam, S.; Muchemwa, T.; Schlecht, E. Emerging development pathways of urban livestock production in rapidly growing West African cities. Sustainability 2016, 8, 1199. [Google Scholar] [CrossRef]
- Li, Y.; Long, H.; Liu, Y. Spatio-temporal pattern of China’s rural development: A rurality index perspective. J. Rural. Stud. 2015, 38, 12–26. [Google Scholar] [CrossRef]
- Devendra, C. Perspectives on animal production systems in Asia. Livest. Sci. 2007, 106, 1–18. [Google Scholar] [CrossRef]
- Hannuum, E.; Yu, X. Ethnic stratification in northwest China: Occupational differences between Han Chinese and national minorities in Xinjiang, 1982–1990. Demography 2001, 35, 323–333. [Google Scholar] [CrossRef]
- Liao, C.; Sullivan, P.J.; Barrett, C.B.; Kassam, K.-A.S. Socioenvironmental threats to pastoral livelihoods: Risk perceptions in the Altay and Tianshan Mountains of Xinjiang, China. Risk Anal. 2014, 34, 640–655. [Google Scholar] [CrossRef] [PubMed]
- Wang, H. Access to higher education in China: Differences in opportunity. Front. Educ. China 2011, 6, 227–247. [Google Scholar]
- Stiftung, B. Bertelsmann Transformation Index—Mongolia; Bertelsmann Foundation: Gütersloh, Germany, 2003; Available online: https://www.bti-project.org/fileadmin/files/BTI/Downloads/Reports/2003/pdf/BTI_2003_Mongolia.pdf (accessed on 22 March 2018).
- Robinson, B. Mongolia in transition: A role for distance education? Open Learn. 1995, 10, 3–15. [Google Scholar] [CrossRef]
- Fan, S.G.; Zhang, X.B. Infrastructure and regional economic development in rural China. China Econ. Rev. 2004, 15, 203–214. [Google Scholar] [CrossRef]
- Wang, J.; Brown, D.G.; Agrawal, A. Climate adaptation, local institutions, and rural livelihoods: A comparative study of herder communities in Mongolia and Inner Mongolia, China. Glob. Environ. Chang. 2013, 23, 1673–1683. [Google Scholar] [CrossRef]
- Nkwiine, C.; Tumuhairwe, J.K. Effect of market-oriented agriculture on selected agrobiodiversity, household income and food security. Uganda J. Agric. Sci. 2004, 9, 680–687. [Google Scholar]
- Bernholt, H.; Kehlenbeck, K.; Gebauer, J.; Buerkert, A. Plant species richness and diversity in urban and peri-urban gardens of Niamey, Niger. Agrofor. Syst. 2009, 77, 159–179. [Google Scholar] [CrossRef]
- Herrero, M.; Thornton, P.K.; Notenbaert, A.M.; Wood, S.; Msangi, S.; Freeman, H.A.; Bossio, D.; Dixon, J.; Peters, M.; van de Steeg, J.; et al. Smart investments in sustainable food production: Revisiting mixed crop-livestock systems. Science 2010, 327, 822–825. [Google Scholar] [CrossRef] [PubMed]
- Kehoe, L.; Romero-Muñoz, A.; Polaina, E.; Estes, L.; Kreft, H.; Kuemmerle, T. Biodiversity at risk under future cropland expansion and intensification. Nat. Ecol. Evol. 2017, 1, 1129–1135. [Google Scholar] [CrossRef] [PubMed]
- Abebe, T.; Wiersum, K.F.; Bongers, F. Diversity and dynamics in homegardens of southern Ethiopia. In Tropical Homegardens: A Time-Tested Example of Sustainable Agroforestry; Kumar, B.M., Nair, P.K.R., Eds.; Springer: Dordrecht, The Netherlands, 2006. [Google Scholar]
- McKinney, M.L. Effects of urbanization on species richness: A review of plants and animals. Urban Ecosyst. 2008, 11, 161–176. [Google Scholar] [CrossRef]
- Deng, C.; Daley, T.; Smith, A.D. Applications of species accumulation curves in large-scale biological data analysis. Quant. Biol. 2015, 3, 135–144. [Google Scholar] [CrossRef] [PubMed]
- Homann, S. Indigenous Knowledge of Borana Pastoralists in Natural Resource Management: A Case Study from Southern Ethiopia. Ph.D. Thesis, Justus-Liebig-Universität Gießen, Gießen, Germany, 2004. [Google Scholar]
- Noromiarilanto, F.; Brinkmann, K.; Faramalala, M.H.; Buerkert, A. Assessment of food self-sufficiency in smallholder farming systems of south-western Madagascar using survey and remote sensing data. Agric. Syst. 2016, 149, 139–149. [Google Scholar] [CrossRef]
- Last, L.; Arndorfer, M.; Balazs, K.; Dennis, P.; Dyman, T.; Fjellstad, W.; Friedel, J.K.; Herzog, F.; Jeanneret, P.; Luescher, G.; et al. Indicators for the on-farm assessment of crop cultivar and livestock breed diversity: A survey-based participatory approach. Biod. Conserv. 2014, 23, 3051–3071. [Google Scholar] [CrossRef]
- Lechner-Doll, M.; Hume, I.D.; Hofmann, R.R. Comparison of herbivore forage selection and digestion. In Proceedings of the IVth International Symposium on the Nutrition of Herbivores, Clermont-Ferrand, France, 11–15 September 1995. [Google Scholar]
- Ng’ang’a, S.K.; van Wijk, M.T.; Rufino, M.C.; Giller, K.E. Adaptation of agriculture to climate change in semi-arid Borena, Ethiopia. Reg. Environ. Chang. 2016, 16, 2317–2330. [Google Scholar] [CrossRef]
- Yu, J.; Han, X.; He, Z.-W.; Liu, F. Study on the Transmission Mechanism of Price of Cattle and Sheep in China; Atlantis Press: Changsha, China, 2014. [Google Scholar]
- Shombodon, D.; Williams, G.W. Mongolia: An Agricultural Marketing System in Transition; Texas Agricultural Market Research Center: College Station, TX, USA, 2001. [Google Scholar]
- Bhattacharji, P. Uighurs and China’s Xinjiang Region. Available online: http://www.columbia.edu/cu/news/clips/2008/08/01/UighursTWPOST.pdf (accessed on 13 January 2018).
- Mongolian Government. Camel and Sheep Wool Subsidy Program; Mongolian Government: Ulaanbaatar, Mongolia, 2011.
- Gonchigsumlaa, G. Competitiveness of Pastoral Livestock Production and Sea Buckthorn Farming in Mongolia: Application of Policy Analysis Matrix. Ph.D. Thesis, Georg-August-Universität Göttingen, Göttingen, Germany, 2016. [Google Scholar]
- Naidansuren, E.; Bayasgalan, O. An Economic Analysis of the Environmental Impacts of Livestock Grazing, 1st ed.; LAP LAMBERT Academic Publishing: Saarbrücken, Germany, 2016. [Google Scholar]
- Jordan, G.; Goenster-Jordan, S.; Lamparter, G.-J.; Ulziisuren, B.; Soninkishig, N.; Schlecht, E.; Buerkert, A. Water use in agro-pastoral livelihood systems within the Bulgan River watershed of the Altay Mountains, Western Mongolia. Agric. Ecosyst. Environ. 2018, 251, 180–193. [Google Scholar] [CrossRef]
- Banks, T. Property rights and the environment in pastoral China: Evidence from the field. Dev. Chang. 2001, 32, 717–740. [Google Scholar] [CrossRef]
- Goenster, S.; Gründler, C.; Buerkert, A.; Joergensen, R.G. Soil microbial indicators across land use types in the river oasis Bulgan sum center, Western Mongolia. Ecol. Indic. 2017, 76, 111–118. [Google Scholar] [CrossRef]
- Kreutzmann, H. Transformation of high altitude livestock-keeping in China’s mountainous western periphery. Emscat 2013. [Google Scholar] [CrossRef]
Figure 1.
Map of the studied areas in Northwest China (Xinjiang) and Western Mongolia, summer 2012. Sonkhel (administrative subunit), Bulgan (sum), Qinghe (county). Source: spatial data modified from diva-gis.org (accessed 16 August 2017).
Figure 1.
Map of the studied areas in Northwest China (Xinjiang) and Western Mongolia, summer 2012. Sonkhel (administrative subunit), Bulgan (sum), Qinghe (county). Source: spatial data modified from diva-gis.org (accessed 16 August 2017).

Figure 2.
Share (size of slice) and absolute numbers of the ethnic groups within the surveyed households (HH) in China (right half of pie chart) and Mongolia (left part of pie chart) in summer 2012.
Figure 2.
Share (size of slice) and absolute numbers of the ethnic groups within the surveyed households (HH) in China (right half of pie chart) and Mongolia (left part of pie chart) in summer 2012.

Figure 3.
Educational level of the household heads according to cluster in the studied regions of Northwest China (Xinjiang) and Western Mongolia, summer 2012. Vm: Market-oriented vegetable production; VLs: Subsistence vegetable production and livestock keeping; Lm: Market-oriented livestock keeping; Ltm: Livestock keeping, traditional but market oriented.

Figure 4.
First (upper graph) and second (lower graph) most important crops per cluster in the studied regions of Northwest China (Xinjiang) and Western Mongolia, summer 2012. Vm: Market-oriented vegetable production; VLs: Subsistence vegetable production and livestock keeping; Lm: Market-oriented livestock keeping; Ltm: Livestock keeping, traditional but market oriented.

Figure 5.
Species accumulation curves within clusters and between countries. (a) Northwest China (Xinjiang) and (b) Western Mongolia, summer 2012, based on the Mao Tao estimator ± standard error of the mean (SEM, black bars). Grey dashed lines indicate the minimum and maximum sample n to reach curve saturation. Note to (a), cluster Vm is not present due to non-possession of livestock species and cluster Lm does not exist. Vm: Market-oriented vegetable production; VLs: Subsistence vegetable production and livestock keeping; Lm: Market-oriented livestock keeping; Ltm: Livestock keeping, traditional but market oriented.

Figure 6.
Organic inputs (mainly manure from respective livestock species) by cluster in the studied regions of Northwest China (Xinjiang) and Western Mongolia, summer 2012. Vm: Market-oriented vegetable production; VLs: Subsistence vegetable production and livestock keeping; Lm: Market-oriented livestock keeping; Ltm: Livestock keeping, traditional but market oriented.

Table 1.
Biophysical characteristics of the surveyed locations, each in ascending order of altitude for Northwest China (Xinjiang) and Western Mongolia, until 2015.
Table 1.
Biophysical characteristics of the surveyed locations, each in ascending order of altitude for Northwest China (Xinjiang) and Western Mongolia, until 2015.
| Country | No | Locations | Coordinates N E | Altitude m a.s.l. | Annual Average Temperature °C (Measurement Period) ‡ | Site Description |
|---|---|---|---|---|---|---|
| China | 1 | Akekaren | 46°25′, 90°14′ | 1131 | 3.6 (2008–2009) | Winter home base |
| 2 | Qinghe | 46°39′, 90°24′ | 1223 | 0.7 (1958–2007) | County centre | |
| 3 | Arele | 46°44′, 90°19′ | 1283 | 1.5 (2009–2010, 2013) | Agricultural village (township centre) | |
| 4 | Buluhe | 46°48′, 90°19′ | 1374 | 1.3 (2009–2010) | Agro-pastoral village | |
| 5 | Akbulak | 47°12′, 90°14′ | 2418 | na | Summer pasture | |
| Mongolia | 1 | Bulgan Gol | 46°07′, 91°04′ | 1133 | 2.3 (2008–2009,2012,2014–2015) | Spring and autumn pasture |
| 2 | Bulgan sum city | 46°05′, 91°34′ | 1181 | 2.5 (1963–2014) | County centre and crop fields | |
| 3 | Bayan Gol | 46°20′, 91°24′ | 1323 | 5.7 (2013–2015) | Crop fields and pasture | |
| 4 | Kheltgiikhad | 46°38′, 91°21′ | 1611 | 3.0 (2012–2014) | Spring and winter pasture | |
| 5 | Turgen | 46°49′, 91°20′ | 1889 | −0.2 (2014) | Crop fields spring and winter pasture | |
| 6 | Sonkhel Lake | 46°39′, 91°30′ | 2170 | −5.9 (2012–2015) | Summer pasture |
No: location in ascending order of altitude per country; ‡: data and time horizons are the only ones available for the locations, hence annual average temperatures should not be overestimated but may serve as a rough indicator for the climatic conditions of low and high altitudinal regions; na: not available.
Table 2.
Naming, coding, and description of variables used in the two-step cluster analysis and categorical principal component analysis (CATPCA).
Table 2.
Naming, coding, and description of variables used in the two-step cluster analysis and categorical principal component analysis (CATPCA).
| Variable | Data Scale and Description | Unit |
|---|---|---|
| Age | metric | Year (year) |
| Education of household head | ordinal (illiterate = 1, primary school = 2, secondary school = 3, high school = 4, technical school = 5, university = 6) * | - |
| No. of family members | metric | - |
| No. of children | metric | - |
| No. of adults employed | metric | - |
| Garden/field | nominal (yes = 1/no = 2) | - |
| Cropland | metric | Hectare (ha) |
| Hayfield | metric | Hectare (ha) |
| Livestock | nominal (yes = 1/no = 2) | - |
| No. of goats | metric (heads of goat) | - |
| No. of horses | metric (heads of horse) | - |
| No. of camels | metric (heads of camel) | - |
| Total no. of animals | metric (all heads) | - |
| Total income from animals | metric (incl. meat, wool, skin, live animals) | Euro (€) |
| Total no. of assets | metric | - |
| Annual transhumance distance | metric (distance bridged with flock per year) | Kilometre per year (km year−1) |
Bold-marked variables are the explaining variables of the two-step cluster analysis. * Obtained technical school and university degrees were summarised as “advanced studies” in the text.
Table 3.
Average household characteristics within clusters and between countries (Northwest China (Xinjiang) and Western Mongolia), summer 2012.
Table 3.
Average household characteristics within clusters and between countries (Northwest China (Xinjiang) and Western Mongolia), summer 2012.
| Variable | China | Mongolia | SEM | Significance | |||||||
|---|---|---|---|---|---|---|---|---|---|---|---|
| Unit | Vm | VLs | Ltm | Vm | VLs | Ltm | Lm | Cluster | Country × Cluster | ||
| Elevation | m a.s.l. | 1279 b | 1355 b | 2122 a | 1420 b | 1471 b | 1356 b | 1651 b | - | - | - |
| Household (HH) | n | 57 | 132 | 69 | 16 | 87 | 111 | 11 | - | - | - |
| Age of HH head | year | 47 ab | 44 ab | 41 b | 47 ab | 46 ab | 47 ab | 48 a | 9.7 | 0.003 | 0.012 |
| Family members | n | 3.2 c | 4.0 b | 4.0 b | 5.1 b | 4.4 b | 4.3 abc | 5.7 a | 0.9 | ˂0.001 | ˂0.001 |
| Male-female ratio | - | 1.3 | 1.2 | 1.3 | 1.3 | 1.2 | 1.6 | 1.4 | 0.3 | 0.680 | 0.213 |
| Adult-child ratio | - | 1.7 | 1.5 | 1.6 | 2.3 | 1.6 | 2.0 | 1.8 | 0.5 | 0.391 | 0.167 |
| HH with off-farm income | n | 0.0 | 1.0 | 1.0 | 2.0 | 7.0 | 4.0 | 2.0 | 2.6 | 1.000 | 0.001 |
| Adults employed off-farm | n | 2.3 ab | 2.7 a | 2.5 a | 1.9 b | 1.9 b | 1.9 ab | 2.4 a | 0.5 | 0.640 | ˂0.001 |
| HH managing land | % | 96 | 83 | 58 | 81 | 71 | 61 | 55 | 5.8 | ˂0.001 | ˂0.001 |
| Cropland | ha | 1.2 a | 1.3 a | 0.8 ab | 0.7 ab | 0.6 b | 0.8 ab | 0.9 b | 0.3 | ˂0.001 | ˂0.001 |
| Hayfield | ha | 11.3 ab | 37.3 ab | 35.1 a | 31.2 ab | 30.7 b | 13.4 ab | 30.5 b | 12 | 0.124 | 0.003 |
| Transportation means | n | 1.4 b | 1.9 a | 1.8 a | 1.2 b | 1.4 b | 1.5 ab | 1.9 a | 0.4 | 0.001 | ˂0.001 |
| Electronic devices | n | 1.4 b | 1.6 b | 1.8 b | 2.1 ab | 2.3 a | 2.2 ab | 2.7 a | 0.4 | ˂0.001 | ˂0.001 |
| Agricultural devices | n | 1.1 c | 1.3 c | 1.2 c | 2.0 b | 3.2 b | 2.0 b | 4.3 a | 0.7 | ˂0.001 | ˂0.002 |
| Other devices | n | 1.3 b | 1.2 b | 1.0 b | 1.5 ab | 1.4 a | 1.6 a | 1.3 ab | 0.4 | 0.319 | 0.123 |
| Total assets | n | 3.7 c | 4.7 b | 4.6 b | 5.6 b | 7.0 a | 6.2 ab | 9.4 a | 1.2 | ˂0.001 | ˂0.001 |
| Monetary value of assets | € | 1543 b | 2226 a | 2573 a | 700 c | 1118 b | 1329 b | 2397 a | 638 | 0.001 | ˂0.001 |
Vm: Market-oriented vegetable production, VLs: Subsistence vegetable production and livestock keeping, Lm: Market-oriented livestock keeping, Ltm: Livestock keeping, traditional but market oriented. SEM = Standard error of the mean, HH = Household; different superscript letters for means indicate significant cluster-wise differences based on Wilcoxon signed rank-statistics. 1 € ~ 8 RMB and 1680 Mongolian Tugrik, respectively (May–September 2012).
Table 4.
Average richness and diversity indices for the livestock herds within clusters and between countries (Northwest China (Xinjiang) and Western Mongolia), summer 2012.
Table 4.
Average richness and diversity indices for the livestock herds within clusters and between countries (Northwest China (Xinjiang) and Western Mongolia), summer 2012.
| Group | Variable | Unit | China | Mongolia | SEM | Significance | ||||||
|---|---|---|---|---|---|---|---|---|---|---|---|---|
| Vm | VLs | Ltm | Vm | VLs | Ltm | Lm | Cluster | Country × Cluster | ||||
| HH with livestock only | Household (HH) | n | 57 | 132 | 69 | 16 | 87 | 111 | 11 | - | - | - |
| HH managing livestock | n | 0 | 100 | 100 | 0 | 100 | 99 | 100 | - | - | - | |
| Goats | n | - | 14.9 c | 21.9 b | 25.7 b | 32.1 b | 113.3 a | 40.8 b | 34.5 | ˂0.001 | ˂0.001 | |
| Sheep | n | - | 24.3 c | 94.8 a | 12.5 c | 14.9 c | 33.4 b | 20.7 b | 29.6 | ˂0.001 | ˂0.001 | |
| Cattle | n | - | 9.8 bc | 10.7 b | 9.9 c | 9.7 c | 16.6 a | 11.4 abc | 3.6 | ˂0.001 | ˂0.001 | |
| Horses | n | - | 2.3 c | 4.5 b | 3.7 c | 3.3 c | 9.0 a | 3.3 b | 2.5 | ˂0.001 | ˂0.001 | |
| Camels | n | - | 2.1 c | 2.5 b | 1.3 c | 2.9 bc | 6.8 a | 4.0 bc | 1.8 | ˂0.001 | ˂0.001 | |
| Yaks | n | - | - | - | 2.0 | 5.5 | 4.9 | - | 1.7 | ˂0.001 | ˂0.001 | |
| Total livestock | n | - | 35 c | 121 b | 32 c | 52 bc | 176 a | 61 b | 56.3 | ˂0.001 | ˂0.001 | |
| Total livestock | SU | - | 73 b | 175 a | 56 b | 85 b | 236 a | 90 b | 71.4 | ˂0.001 | ˂0.001 | |
| Total income livestock production | € year−1 | - | 1149 c | 6281 a | 180 c | 363 c | 1688 b | 1089 b | 2122.9 | ˂0.001 | ˂0.001 | |
| All HH | Richness | n | - | 3 c | 4 b | 2 c | 4 b | 5 a | 3 b | 1.2 | ˂0.001 | ˂0.001 |
| Simpson’s diversity (index) | - | - | 0.46 ab | 0.42 b | 0.31 ab | 0.50 a | 0.44 b | 0.40 ab | 0.1 | ˂0.001 | 0.001 | |
| Evenness (index) | - | - | 0.69 b | 0.57 b | 0.47 c | 0.70 a | 0.56 c | 0.55 bc | 0.2 | ˂0.001 | ˂0.001 | |
| Transhumance distance | km year−1 | - | 1 c | 248 a | 44 b | 36 b | 126 a | 288 a | 34.5 | ˂0.001 | ˂0.001 | |
HH: household; Vm: Market-oriented vegetable production; VLs: Subsistence vegetable production and livestock keeping; Lm: Market-oriented livestock keeping; Ltm: Livestock keeping, traditional but market oriented. SEM = Standard error of the mean, SU = Sheep unit; different superscript lettersfor means indicate significant cluster-wise differences based on Wilcoxon signed rank-statistics.
© 2018 by the authors. Licensee MDPI, Basel, Switzerland. This article is an open access article distributed under the terms and conditions of the Creative Commons Attribution (CC BY) license (http://creativecommons.org/licenses/by/4.0/).
Share and Cite
MDPI and ACS Style
Tsvegemed, M.; Shabier, A.; Schlecht, E.; Jordan, G.; Wiehle, M. Evolution of Rural Livelihood Strategies in a Remote Sino-Mongolian Border Area: A Cross-Country Analysis. Sustainability 2018, 10, 1011. https://doi.org/10.3390/su10041011
AMA Style
Tsvegemed M, Shabier A, Schlecht E, Jordan G, Wiehle M. Evolution of Rural Livelihood Strategies in a Remote Sino-Mongolian Border Area: A Cross-Country Analysis. Sustainability. 2018; 10(4):1011. https://doi.org/10.3390/su10041011
Chicago/Turabian StyleTsvegemed, Munkhnasan, Alimu Shabier, Eva Schlecht, Greta Jordan, and Martin Wiehle. 2018. "Evolution of Rural Livelihood Strategies in a Remote Sino-Mongolian Border Area: A Cross-Country Analysis" Sustainability 10, no. 4: 1011. https://doi.org/10.3390/su10041011
Note that from the first issue of 2016, this journal uses article numbers instead of page numbers. See further details here.