A Novel Method of Protection to Prevent Reverse Power Flow Based on Neuro-Fuzzy Networks for Smart Grid

1
Department of Engineering Electrical Power, Engineering Technical College, Southern Technical University, Al-Zubair Road, Basrah 61001, Iraq
2
School of Electrical and Electronic Engineering, Huazhong University of Science and Technology, Wuhan 430074, Hubei, China
*
Author to whom correspondence should be addressed.
Sustainability 2018, 10(4), 1059; https://doi.org/10.3390/su10041059
Submission received: 28 February 2018
/
Revised: 27 March 2018
/
Accepted: 29 March 2018
/
Published: 3 April 2018
(This article belongs to the Special Issue Smart Power Grid for Sustainable Energy Transition)
Abstract
:This paper addresses the energy challenges related to the weak protection of renewable energy from reverse energy flow and expanding access to high-quality energy at the same time. Furthermore, this paper focuses on participation in the global transition to clean and low-carbon energy systems. Moreover, the increased demand for renewable energy seems to likely depend on whether it will be possible to greatly accelerate rates of progress toward increased efficiency, de-carbonization, greater generating diversity and lower pollutant emissions. This paper focuses on the protection of renewable energy technologies because they can be particularly attractive in dispersed areas and therefore, represent an important option for rural areas that lack electrical energy and distribution infrastructure. This paper proposes an improved protection device for a reverse power protection system using a new intelligent decision support system (IDSS). The IDSS is a support system for decision making, which makes extensive use of artificial intelligence (AI) techniques. The new method integrates the powerful specification for neural networks and fuzzy inference systems. The main advantage of this method is that it causes a decrease in the steady state oscillation for the reverse power relay. In addition, the proposed method has the ability to monitor extreme environmental conditions. The generator can be converted into a motor when the steam supply to a turbine is interrupted while the generator is still connected to a grid (or operates in parallel with another generator). As a result, the generator will become a synchronous motor and will actually cause significant mechanical damage. The reverse energy protection device should be included in the generator protection scheme. Smart grids use communication networks with sophisticated algorithms to ensure coordination between protection systems. ZigBee is a newly developed technology that can be used in wireless sensor networks (WSNs) to comply with the IEEE 802.15.4 standard. Low data rates, low power consumption and low cost are key features of ZigBee. The execution of star, tree and mesh topologies as well as support comparison is based on end-to-end delay, throughput, medium access control load in addition to sent and received traffic parameters. The use of star topology obtained a delay of 0.2 s. The simulation results show that this method is superior to the traditional method in terms of speed and steady-state oscillation.
1. Introduction
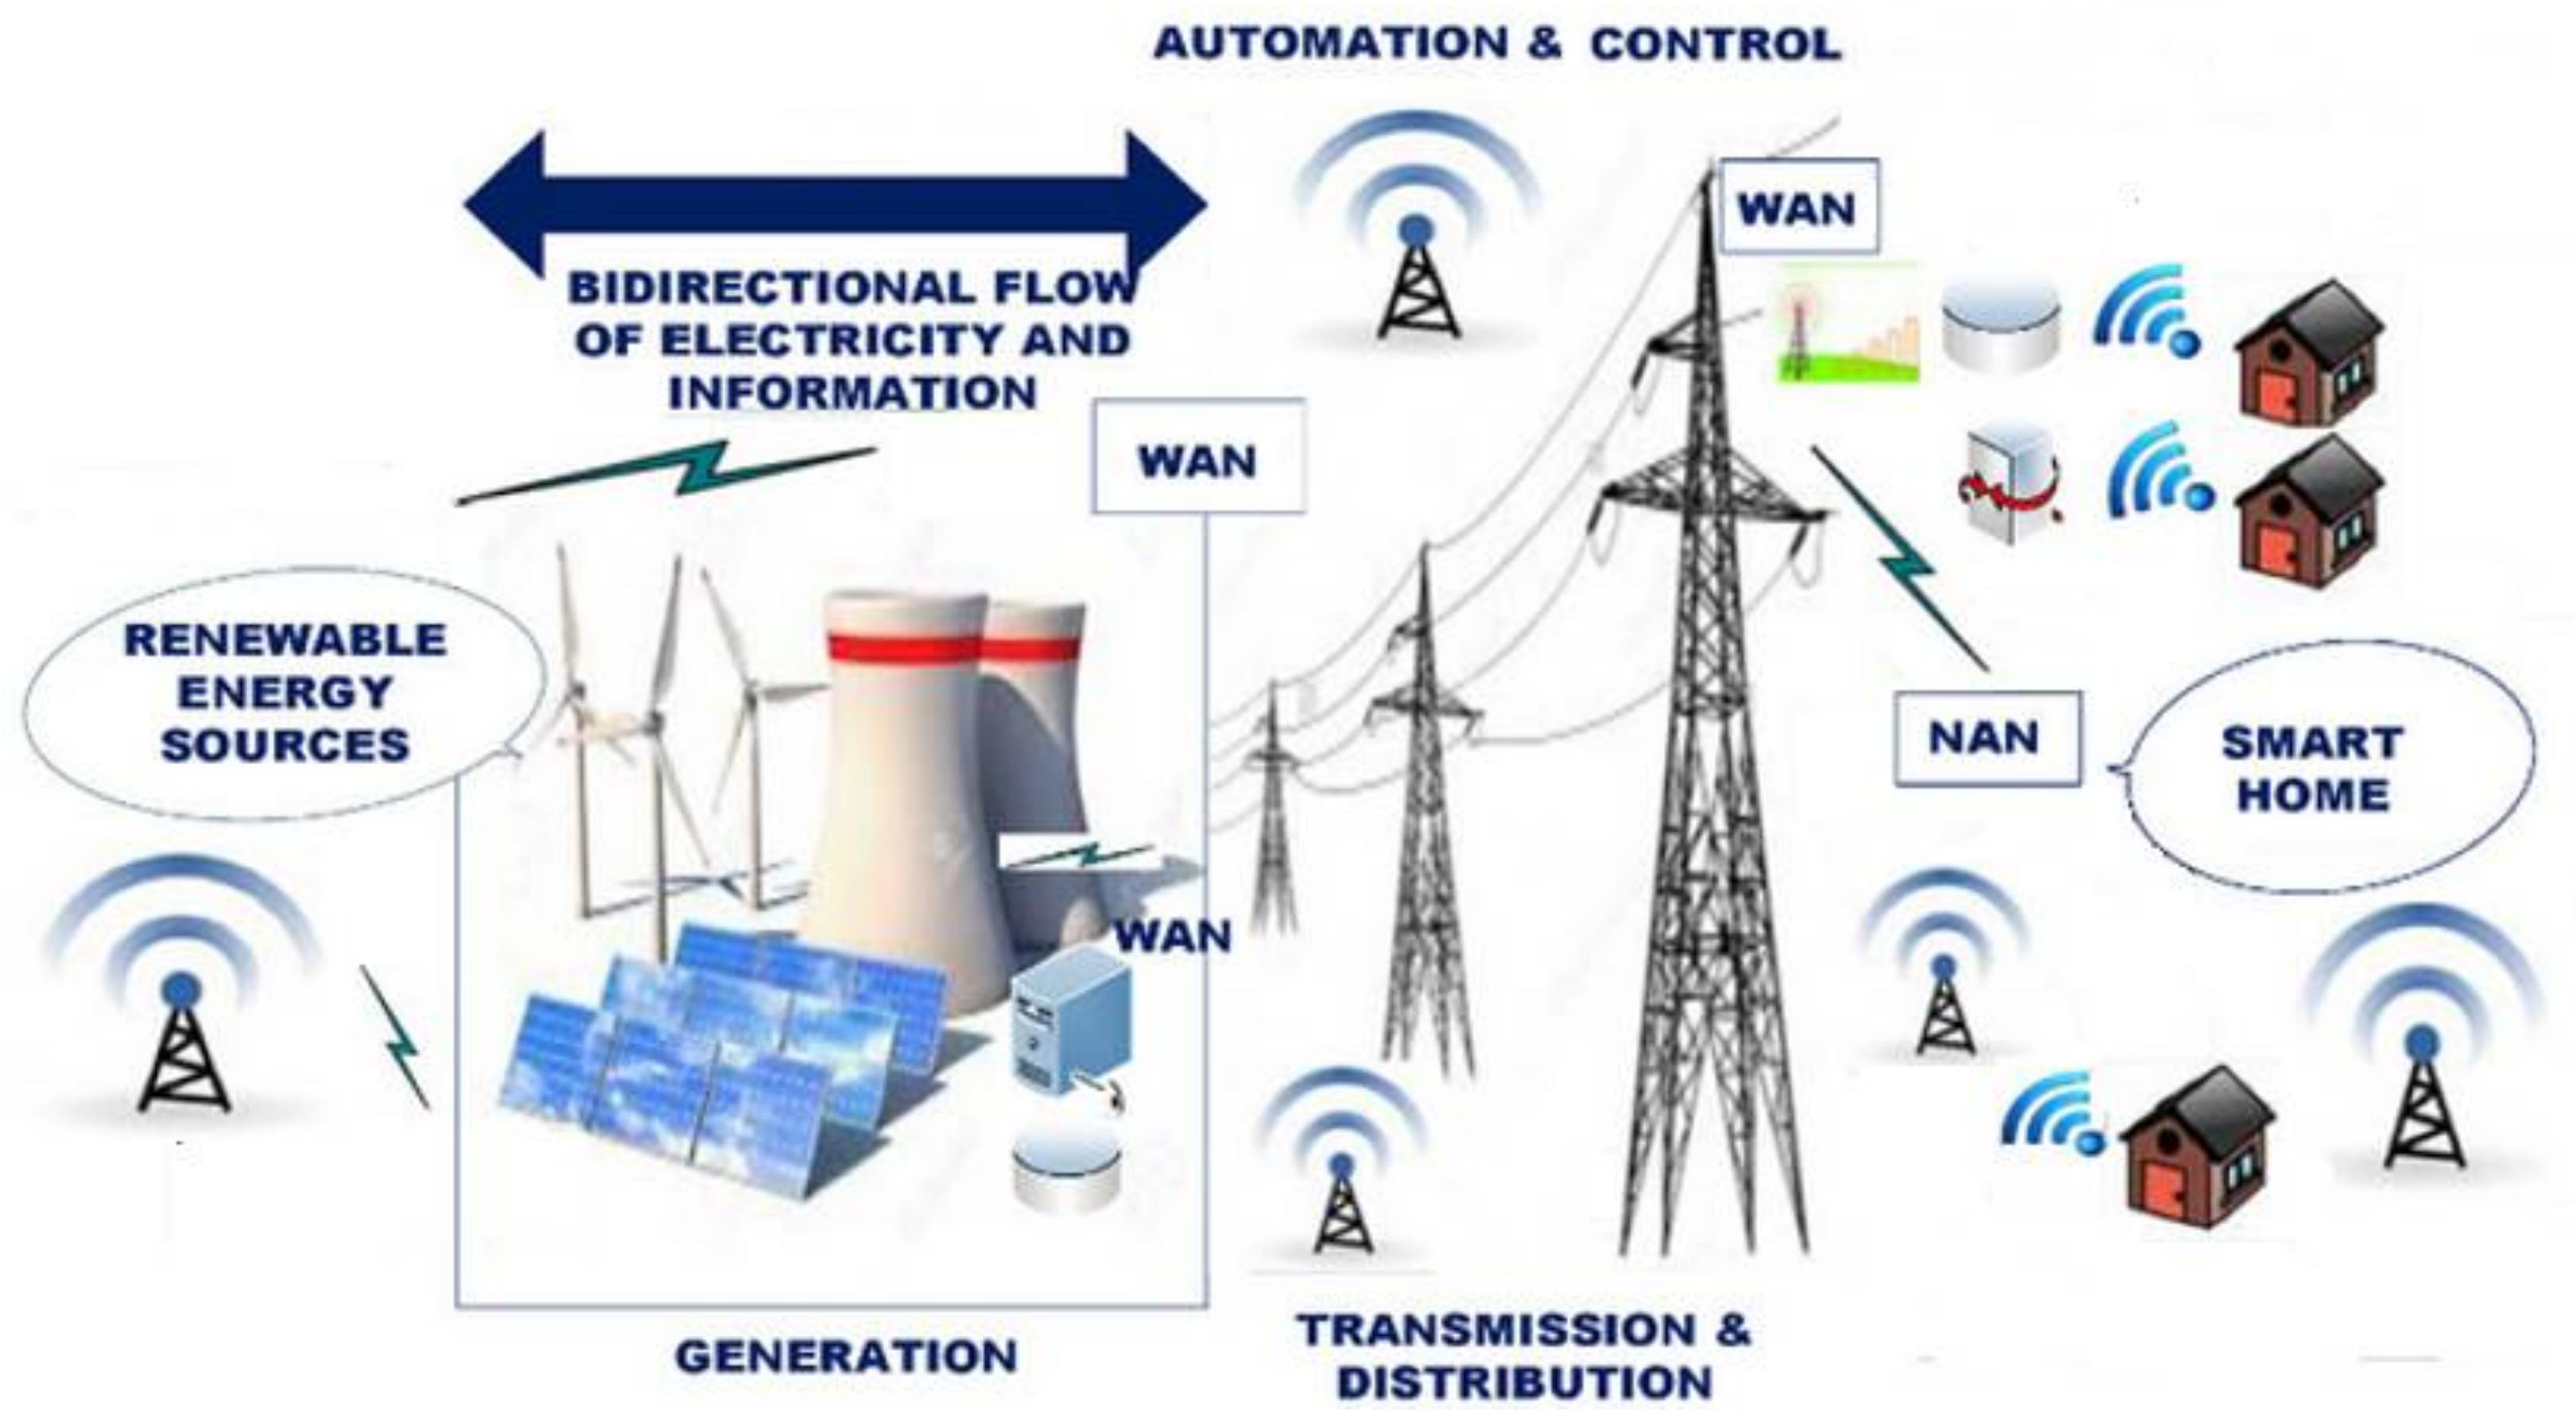
Microgrid distribution networks are the next generation of electric power. The purpose of smart distribution networks is to overcome the problems of traditional electrical energy. Traditional energy systems are generally used to transport power from a central generator to customers [1,2]. In contrast, a smart grid utilizes bi-directional flows of electrical energy and information to create an advanced and automated power distribution network. Table 1 presents a brief comparison between the existing grid and the smart grid. In general, a smart grid can respond more efficiently to events that occur anywhere on the network through acting on appropriate strategies during electrical energy production, transmission, distribution and consumption.
Using a communication networks ensures full coordination between generation and protection. The reliable flow of real-time information among all network components is critical to the success of the smart grid process. The process can be reliable and efficient with the use of modern communication [3]. A wireless sensor network (WSN) is distributed between the generation station and the load, where many sensors are wirelessly connected to communicate with one another. These electronic applications are known as detectors or sensors, which detect physical units. Sensors have the capability to detect many physical units, such as electric current, voltage, resistance, magnetic flux density and so on. Different types of sensor nodes are available in the market, such as micaZ (San Jose, CA, USA), TelosA (Palo Alto, CA, USA) and IMote2 (San Jose, CA, USA), which are able to generate WSNs (Chicago, IL, USA) [4,5].
Many wireless standards are used in industrial applications [6,7,8,9,10,11]. ZigBee is one of the most useful technologies in WSNs, which is based on the IEEE 802.154 standard created in 2003. The ZigBee system is different from other communication standards, such as WiFi, Bluetooth and Worldwide Interoperability for Microwave Access (WiMAX), and has the advantages of small data transmission and low power consumption. In addition, the ZigBee system is more cost-effective than other wireless communication standard sensors because it provides flexible bandwidth performance, scalability and self-organization [12].
This paper is structured as follows: Section 2 compares the communication infrastructure between traditional power grids and smart grids. Section 3 provides a general description of the communication, which can be implemented in the smart grid. Section 4 analyses the proposed method of the protection model and the use of the OPNET simulator. Section 6 analyses the results of the simulation and three scenarios applied to the results. Section 6 presents the results of the study.
2. Brief Description of the Communications Infrastructure
The communications infrastructure of the power system is designed to support the one-way flow of power from central power stations to consumers, with limited efficiency in the exchange of information. Therefore, the smart grid has a number of sensors that are larger than those of the traditional network [13,14]. These sensors are used in the collection of data and exchange of information between devices and data centers. They are optimized to control all network components. To cope with this large data flow, the smart grid communication infrastructure should be reliable and powerful in addition to having the ability to secure communication in real time. In addition, it should automatically adapt to changes.
3. Overview Communication Technology for Smart Grid
The communication infrastructure is based on three types of networks: home area network, neighborhood area network and wide area network, which is shown in Figure 1. We have provided some techniques that can be applied in the following sections.
3.1. ZigBee
ZigBee is based on the Standard IEEE 802.15 and is used in applications that require a low data rate, long battery life, low cost and network security. Its applications include smart meters and industrial equipment, which require a short range of wireless data transmission and a relatively low cost. ZigBee has the capability to connect up to 60,000 devices in one network [15,16]. This technology has been developed to be simpler, easier to implement and more cost-effective than other wireless networks. The ZigBee network provides a 128-Bit symmetric encryption key. The use of this application allows for the integration of smart meters in the ZigBee network with other devices. These intelligent measurement devices can collect information from integrated devices and act as monitoring systems [17,18].
3.2. Wireless Local Area Network (WLAN)
WLAN uses spread-spectrum techniques or frequency-division multiplexing, which is usually performed by connecting two or more devices to a network through an access point. It enables the user to move in the field of the local coverage and to connect to a network. Most wireless local networks use the 802.11 modern standard in the market under the brand name WiFi. WLAN can be easily integrated into the network due to its large and widespread deployment in the world. WLAN works in the range of 2.4–3.5 GHz. Its advantages are its low-cost equipment and wide application throughout the world. The main drawback of this network is the high likelihood of interference with communication devices in the same frequency [19,20].
3.3. Cellular Networks
Most countries are working toward the deployment of a mobile network and the establishment of infrastructure. Cellular networks enable high-speed data communication of up to 100 Mbps and they can be used in the interaction between various components of the network and devices of a smart grid. WiMAX cellular communication technology is the most remarkable application of smart grid deployment [21]. Working at a data exchange frequency of 2.5, 3.5 and 70 Mbps and coverage of up to 50 km, WiMAX is integrated into the smart meter (smart grid) through deployment. A mobile network has a wide area deployment, high data transmission and secure communication. The main drawback of this system is that it is shared with other systems that are not fully dedicated to a smart grid and can cause a serious emergency situation [22,23].
3.4. Power Line Communication
Transmission lines enable data exchange between devices on the power line. A power line carrier communication system is implemented to realize the modulation of a carrier signal. The orthogonal frequency division multiplexing-based data rate of information may be several Mbps, while the carrier frequency on transmission lines is about 100–200 kHz. However, the circuit can be many kilometers in length [24].
Different types of contact in power lines use different frequency bands. The purpose of the power distribution system is the initial transmission of the AC power source in a typical frequency of 50 or 60 Hz. Therefore, the line power is only able to perform at high frequencies. The problem is the propagation of a limiting factor in the communication of the wires. In addition, interference of communication signals may exist and high harmonics are generated by the non-linear loads present in the grids. An advanced active filter must be used to overcome these problems. In smart grid applications, the Powerline Carrier (PLC) system is used in the connection of the communication area network between the smart meter and the local data concentrator. The advantage of PLC is related to its building costs, as its extensive infrastructure reduces installation costs. Its shortcomings include the existence of high-order harmonics, interference of the communication signal and limited frequency of communication [25].
4. Power System Protection
When the engine fails, the generator stops producing power and begins to draw power from parallel sources. This situation can damage the prime mover (turbine or motor) and this situation is undesirable. Therefore, the reverse power state should be detected and the power supply should be disconnected to reduce losses in the prime mover, thus protecting the generator from damage.
4.1. Reversed Power Flow Detection
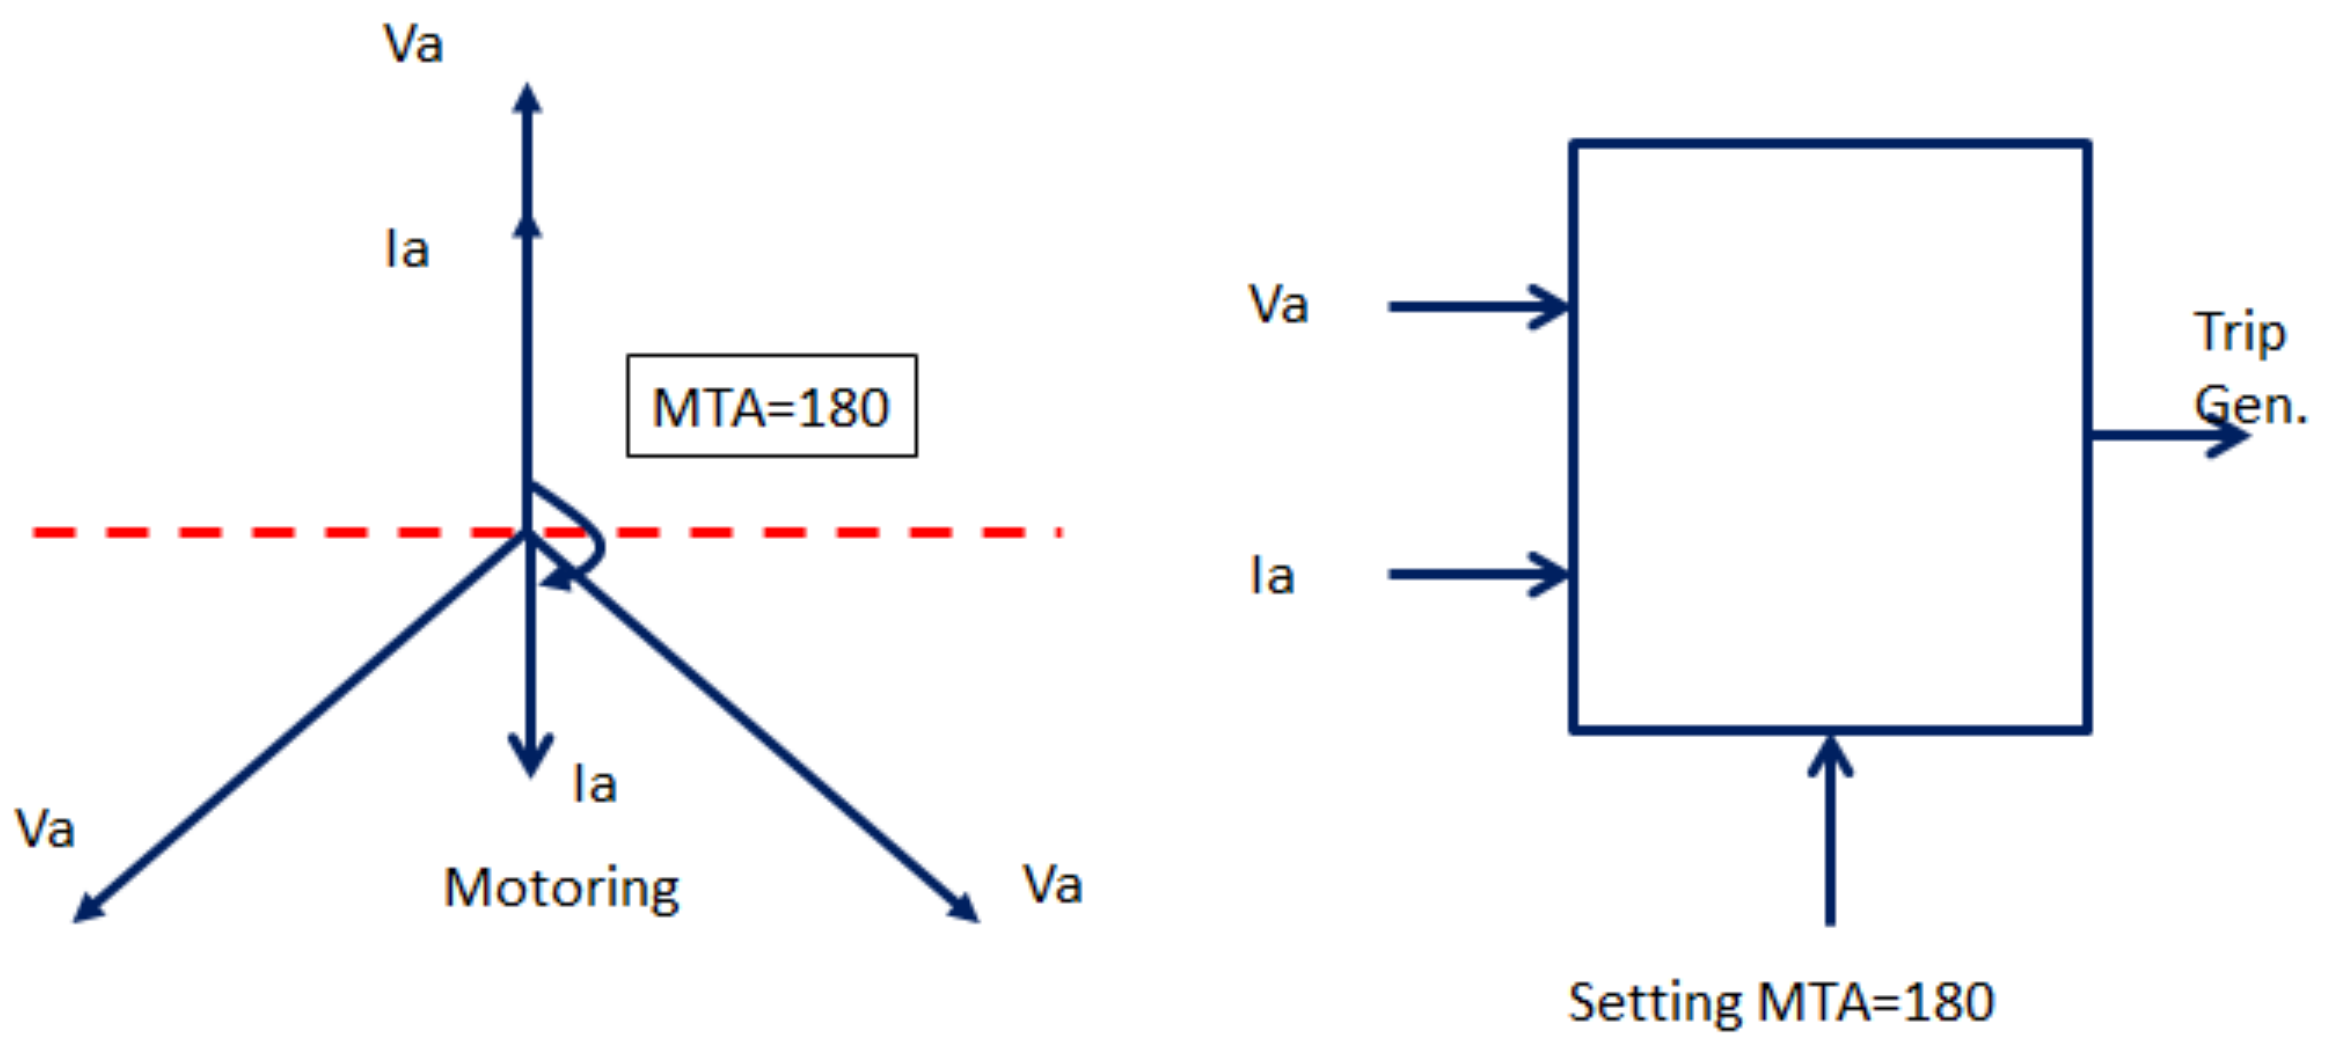
Reversed Power Relay (RPR) are power directional relays, which are used to monitor the power flow and enact appropriate actions during abnormal conditions. Under an exceptional condition, the power direction changes from the Busbar to the generator. This situation usually occurs when the prime mover has failed. It is natural for the power in the grid to be sufficiently lower than the rated power of the generator [26].
The current stator phase shift is commonly referred to as the Maximum Torque Angle (MTA). The system uses a power directional relay with a MTA of 180°, which is shown in Figure 2. As a result, the system can detect the loss of the prime mover. Accordingly, the phasor current is reversed and enters the trip zone. However, the reverse flow of the current is smaller than the moving average and the current of the actual power generator should only be carried out in the off-turbine loss and driving. Therefore, directional relays in detecting loss require a higher degree of sensitivity compared to overcurrent relays [27,28].
The best protection can be achieved using a Rogowski coil current sensor instead of the current transformer (CT), which avoids the erroneous behavior caused by the fault [29,30]. When the power response provided by the generator is substantially closer to the zero power factor, incorrect behavior is avoided due to the phase–angle error of the current transformer. If the angle between the vector of the current and voltage is Δ, the load flow in the normal direction is between −90° < Δ < 90° in the reverse case, while the flow of power is at +90° < Δ < 270°. The overlap between the voltage and current ranges is greater than their non-overlapping intervals under normal circumstances. Nevertheless, this overlap reduces to a lower level when reversing the flow of energy. The difference in the overlap interval during natural flow is used and the flow of energy is reversed in the implementation of the directional relay component [31].
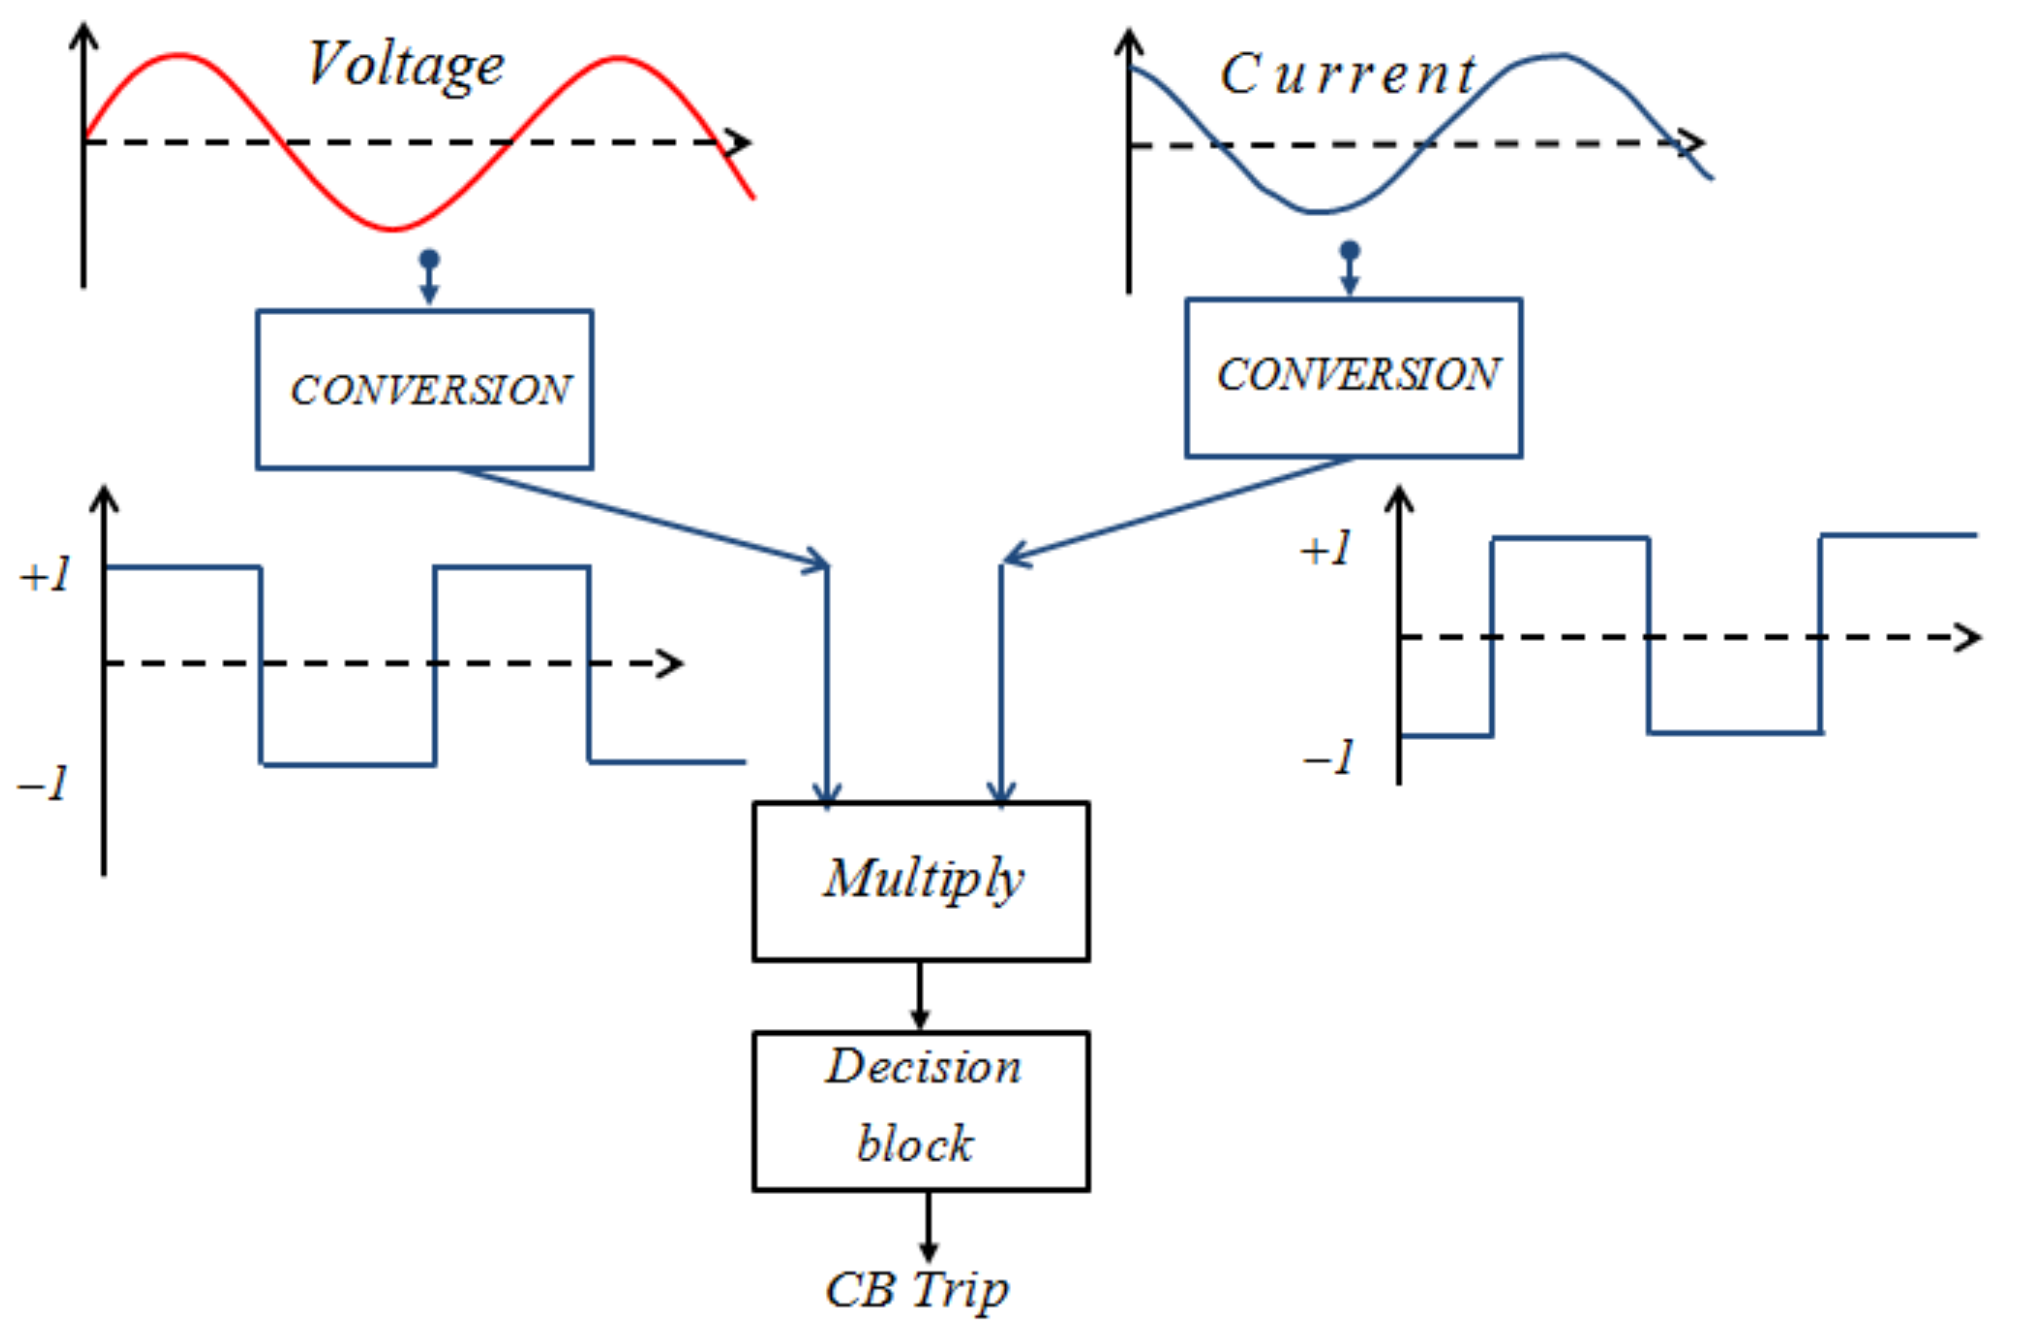
Figure 3 shows the implementation of the RPR component. The low signals of the current and voltage of the current transformer and voltage transformer have been found to change to the form of a square wave, which has a value of “±1”. After this, these levels of signals are multiplied to yield a positive number in the overlap interval and a negative number in the non-overlap interval [32].
In the diagram, the upper limit of integration for the system is set to zero, so that the integral of the load is always less than zero in normal conditions. However, in the reverse trend, the production conditions include integral parts that tend to decline until they reach a threshold constant. In this case, the constant is set to 0.01. However, no value can be selected according to the reverse power amount. The application of RPR for directional characteristics based on Simulink is shown in Figure 4. The output of the element Block RPR is sent to a decision, in which the output is 1 for the tripping signals during normal operations and 0 under abnormal conditions [33].
4.2. Implementation Neuro-Fuzzy Controller
An intelligent decision support system (IDSS) is a support system for decision making that makes extensive use of artificial intelligence (AI) techniques. A new AI technique integrates powerful specification for neural networks and fuzzy inference systems. In contrast, fuzzy logic performs an inference mechanism under cognitive uncertainty using neural networks and exciting skills, such as learning and adaptation. The fuzzy unit is designed according to the linguistic form of the rules of control. However, the translation of the linguistic rules for the theory of fuzzy sets depends on the choice of parameters. The optimization of these parameters can be obtained by neural networks, which are designed to verify the data. In this proposal, the fuzzy control unit and the neural network are combined. The neuro-fuzzy wizard shows a fuzzy logic controller (FLC) with self-tuning scale factors, which are based on the structure of an artificial neural network (Figure 5). The first part uses the fuzzy logic rules for the control, before utilizing the neural network structure to automatically adjust the output. The reference power (input 1) is calculated with respect to the existing power (input 2), product e(t) and incremental change Δe(t).
The main drawback of the conventional controller is its lack of ability to react to immediate changes in the error signal, because it is only able to determine the instantaneous value of the error signal without considering any changes in the increase and reduction of the error. To resolve these drawbacks, we used the intelligent decision support system. In this paper, we proposed the integration of the fuzzy logic with the neural network to form the new processor. This adaptive built-in system modifies the characteristics of rules and the topology of the fuzzy sets. The fundamental concept of the control model Neuro-Fuzzy is the use of learning algorithms structures to find logical rules that are mostly appropriate, before applying the algorithms and learning parameters to adjust the function of membership and other parameters. The determination of the output control signal is conducted in an inference engine with the rule of IF-THEN in the form of [34,35]:
IF error signal is … AND derivative of error signal is … THEN output is…,
Based on this rule, the value of output is changed according to the value of the error and the derivative of error signals. A neuro-fuzzy controller has two input variables. Both variables have seven Gaussian type fuzzy membership functions, which are labeled as Positive Big (PB), Positive Medium (PM), Positive Small (PS), Zero (Z), Negative Small (NS), Negative Medium (NM) and Negative Big (NB). The fuzzy control rule is illustrated in Table 2.
The eN and ΔeN scale factors are the outputs, which are considered to be the input signals for the fuzzy logic controller. The output signal of the fuzzy logic controller is ΔuN, which is the input for the scale factor. The neural network has two inputs, e(t) and Δe(t), while the α neural network signal output is used to fine-tune the worker output control (Figure 6). The output signal of the scale factor can be expressed by the following equation [36,37]:
The neuro-fuzzy controller output signal can be written as follows:
The selected fuzzy set and the membership functions were determined, which is shown in Figure 7. A FLC rule represents the set of selected fuzzy rules.
The structure of the neural network consists of three layers (two input layers, one output layer and three hidden layers).
The input structure for neural networks has the same number of input signals and outputs as the fuzzy observer in Figure 8. The signal of the output layer α has a certain value of −1 to +1. The activated function for the nodes in the hidden layer is determined as follows [38,39]:
The activation function neuron in the output layer is:
The intelligent decision support system output signal u(t) is scaled to control the tripping signal. The resulting switching can be written as follows:
where the θinitial is the initial switching output and k is a constant.
It should be noted that the simulation in the MatLab program is suitable for the simulation of mathematical modeling and feedback control, while OPNET is a software tool that can simulate the behavior of network communication. Furthermore, simulating the communication behavior of the decentralized type of wireless network within MATLAB is difficult. This is because it is also difficult to create and manipulate complex queue models, which is simple in OPNET.
4.3. ZigBee Based on Wireless Sensor Networks
The advantages of ZigBee are listed as follows:
- Setting up the network is very simple and easy.
- It does not have a central controller and loads are distributed evenly across the network.
- It is easy to monitor and control appliances from the remote.
- This will replace existing infrared technology-based devices. This will save the cost of battery replacement as ZigBee uses lithium batteries, which lasts for a long period of time.
- The network is scalable and it is easy to add/remove the ZigBee end device to/from the network.
The WSN of ZigBee technology is easier to use than other WSN simulators. The IEEE 802.15.4 network is renowned for its low power consumption, low data transfer rate, low cost and long battery life. The ZigBee protocol was developed to address low-power wireless networks, which is characterized by reliability, security and is usually easy to implement. The scenario includes a workstation with one coordinator, six routers and eight terminals for a total of 15 nodes, which is shown in Figure 9. These nodes are placed at a distance of 100 m from one another. The sole purpose of this scenario is to simulate a scenario in OPNET for properly participating in the calculation of the system variables. In each case, a large number of variable systems and indicators available for OPNET collections provide two types of statistical uses: local and global statistics. The local statistics are not adequate for informing a specific node in the system model. However, in this case, when studying network performance, we are more interested in obtaining quantitative information about the entire system. Therefore, this research works with data derived from global statistics. Device parameter values are shown in Figure 10, while the router parameter values are shown in Figure 11. The device parameter values are shown in Figure 10, while the router parameter values are shown in Figure 11.
The transmission power level is increased in the scenario. The transmitted power is set to 0.1 W as shown below.
The ZigBee coordinator parameters are illustrated in Figure 12.
5. Results & Discussion
5.1. Simulation Results of the Proposed Method
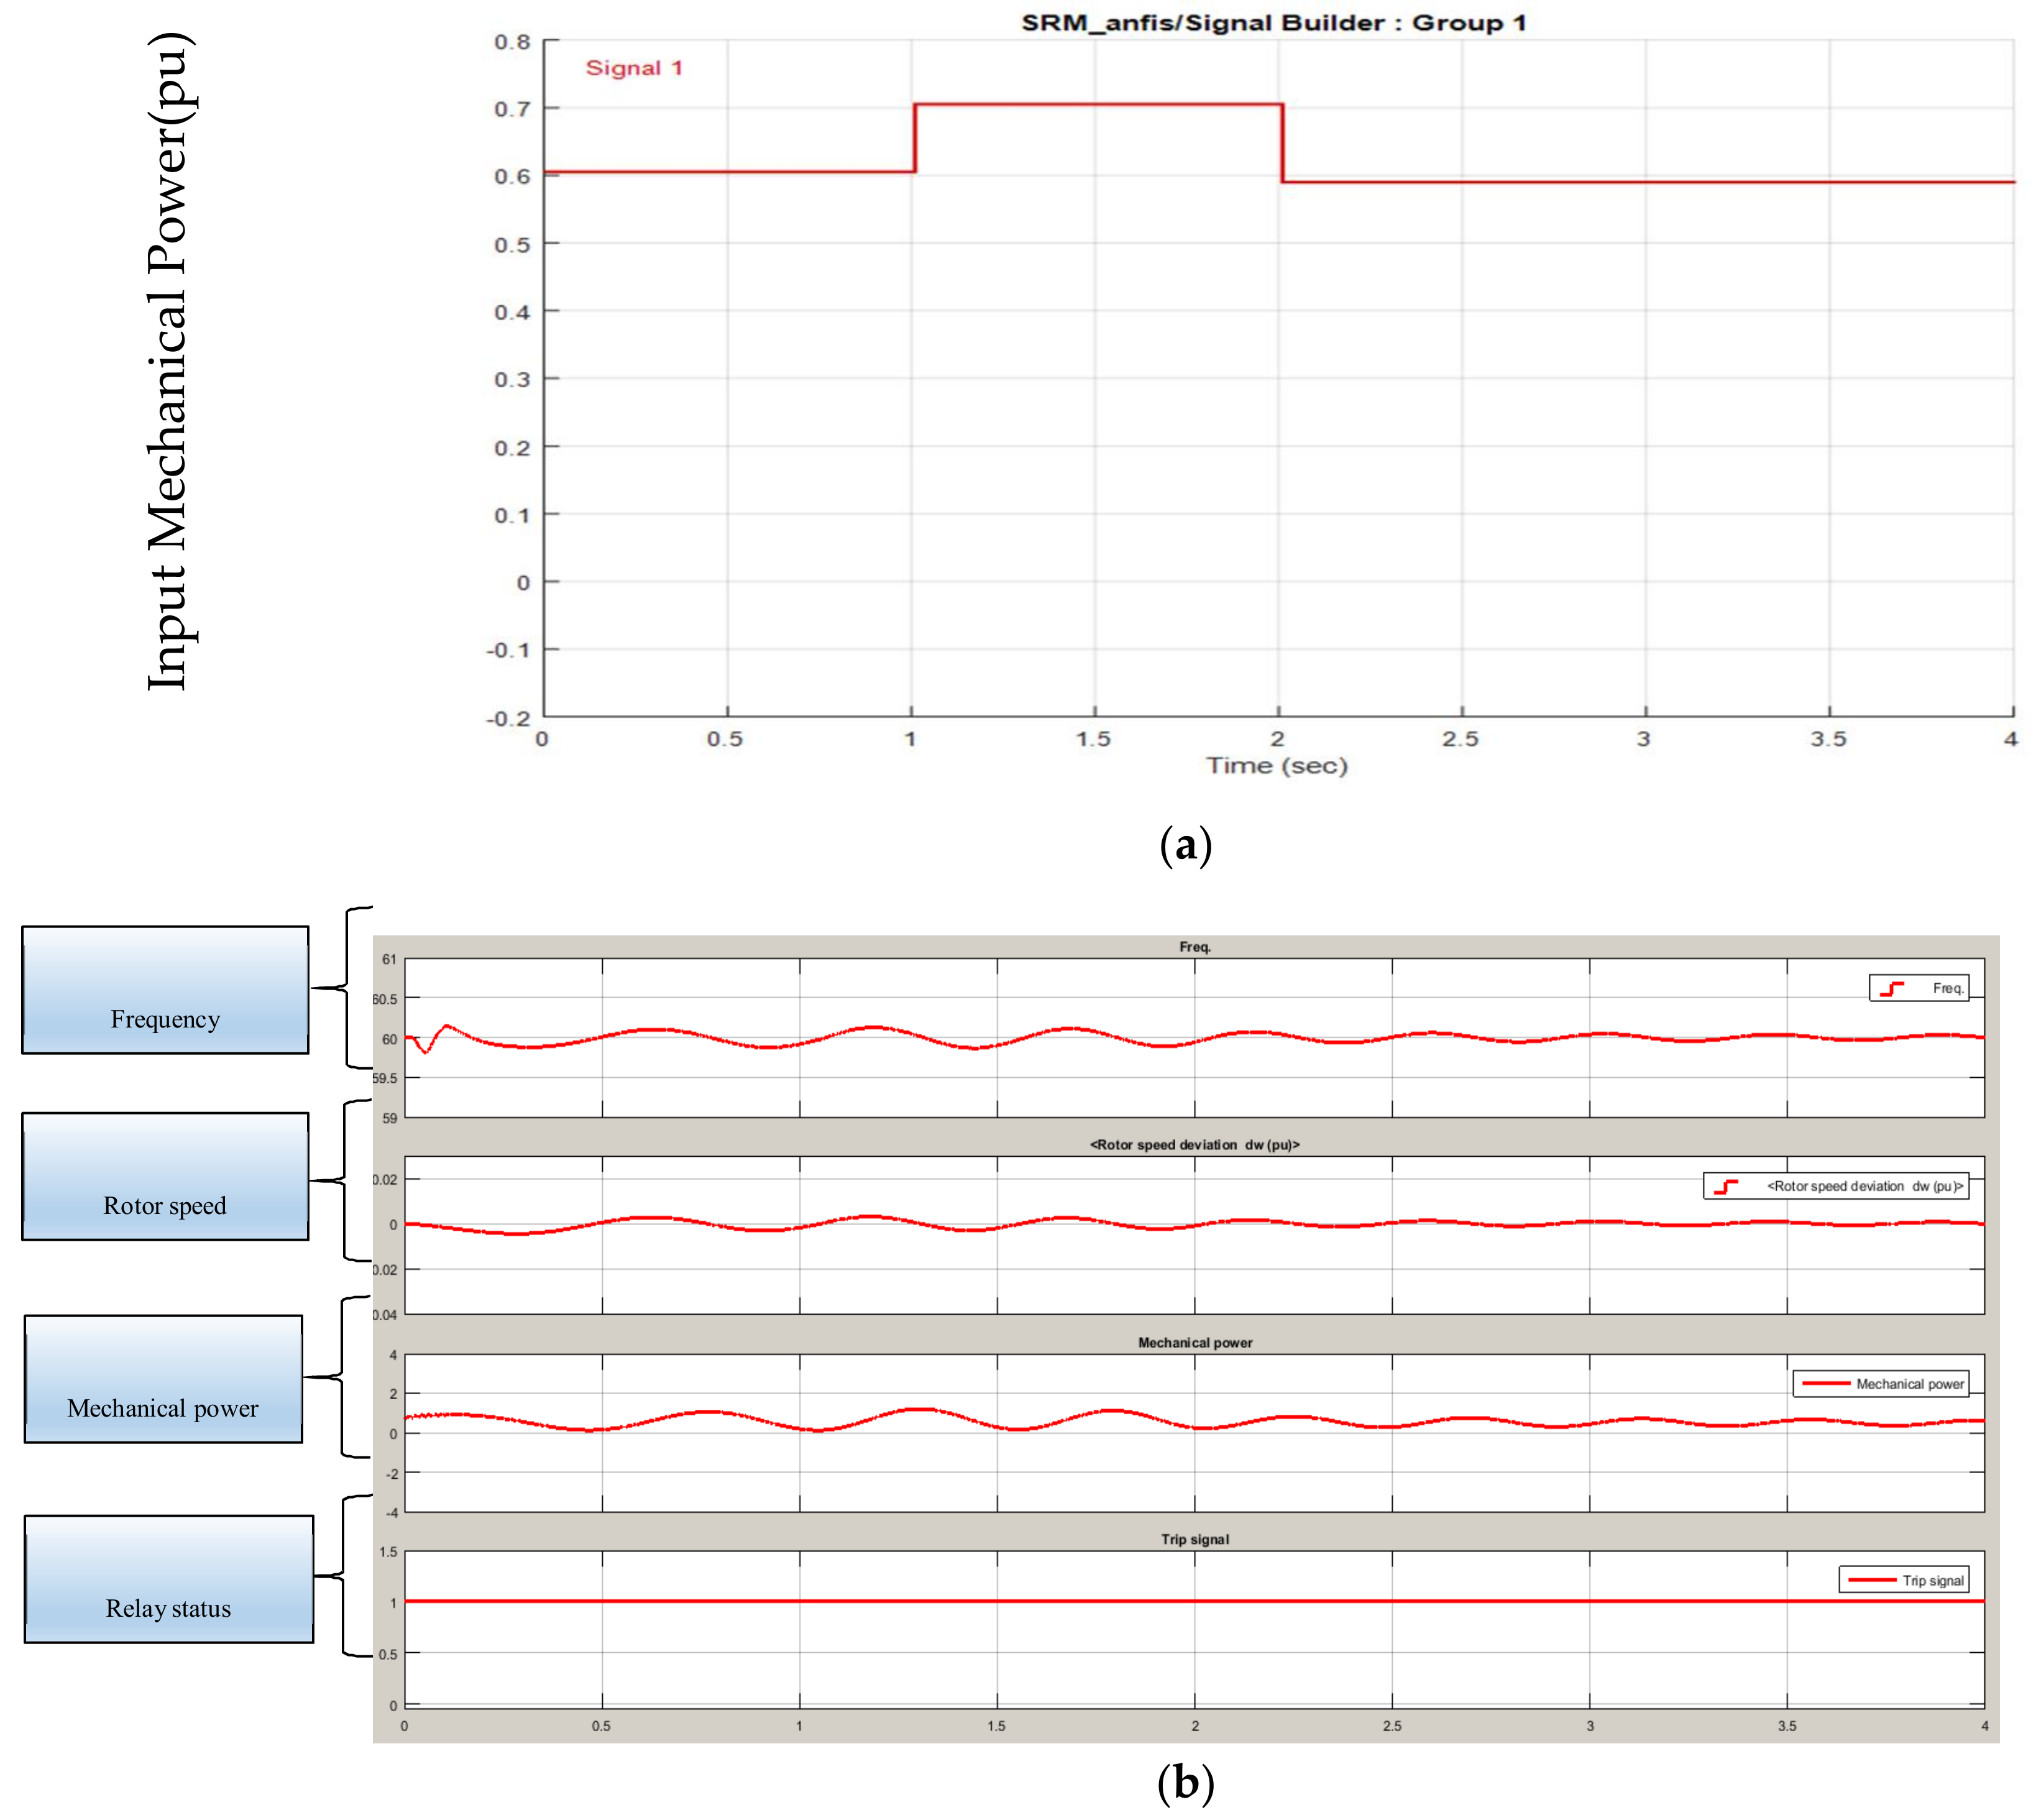
As shown in the Figure 13, reversible power data are collected for the synchronous generator at 200 MVA/11 KVA, 60 Hz, Load10 MW and 3 MVAR. The reverse energy relay function is to prevent a reverse energy state in which the energy flow from the Basbar is towards the generator. In Figure 4, the proposed security migration function appears. The inverted power data collected during the transition from the abnormal state of the generator to the engine position will be monitored using current, voltage, active and reactive data. In this sense, this will be monitoring the changes in the time domain of mechanical power, rotor speed and frequency, which is shown in the Figure 14b.
We used protective relays to collect reverse power data. The relay can also detect interference. When these disturbances occur, all signals are processed through the fuzzy neural unit, including the fault and after the fault interval. We believe that the connection to the wireless sensor network can obtain reverse energy data measurements.
The structure of our neuro-fuzzy controller is depicted in Figure 4. The nodes input_1 and input_2 represent the input variables and deliver their crisp values to the modules containing the respective membership functions. The relay is tested under various scenarios. We have also provided details of this system in Appendix Table A2.
Case 1: Under normal conditions, the mechanical input of the generators varies in the range of 0.6–0.7 pu at 1–2 s. The input/output power and the observed status are shown in Figure 14. In this case, the relay does not trip.
Case 2: In this case, the input of the mechanical generator changes from 0.7 to −0.1 pu at 2–3 s. The status of power and relay during the input/output power is illustrated in Figure 15. The relay delay is about 0.15 s after the error has occurred for more than 2 s. After this, the relay is triggered.
5.2. Simulation Results of the ZigBee WSN
The results of the assessment show that the new algorithm provides good efficiency in reducing management and maintenance costs. In addition, the system can also provide an alarm for the fault in order to protect the equipment and can be used for tracking the location of service faults. Mobile solutions for most potential applications provides promising services, with wireless networks supporting:
- Low data rate,
- Low power consumption,
- Security and
- Reliability.
In this section, simulations are performed for different WSN topologies. The effects of different topologies on network efficiency are also discussed.
5.2.1. Throughput
Throughput is the average number of bits or packets that are successfully transmitted from the source to the destination. The results of the steady state are 0.041, 0.034 and 0.028 Mbit/s for the star, mesh and tree topologies, respectively (Figure 16). The maximum throughput can be achieved in the star topology. The mesh topology has the second highest throughput, followed by the tree topology. The reason for this finding is that the star topology interacts with the personal area network (PAN) coordinators and ZigBee devices, which are more efficient than the end devices of the system.
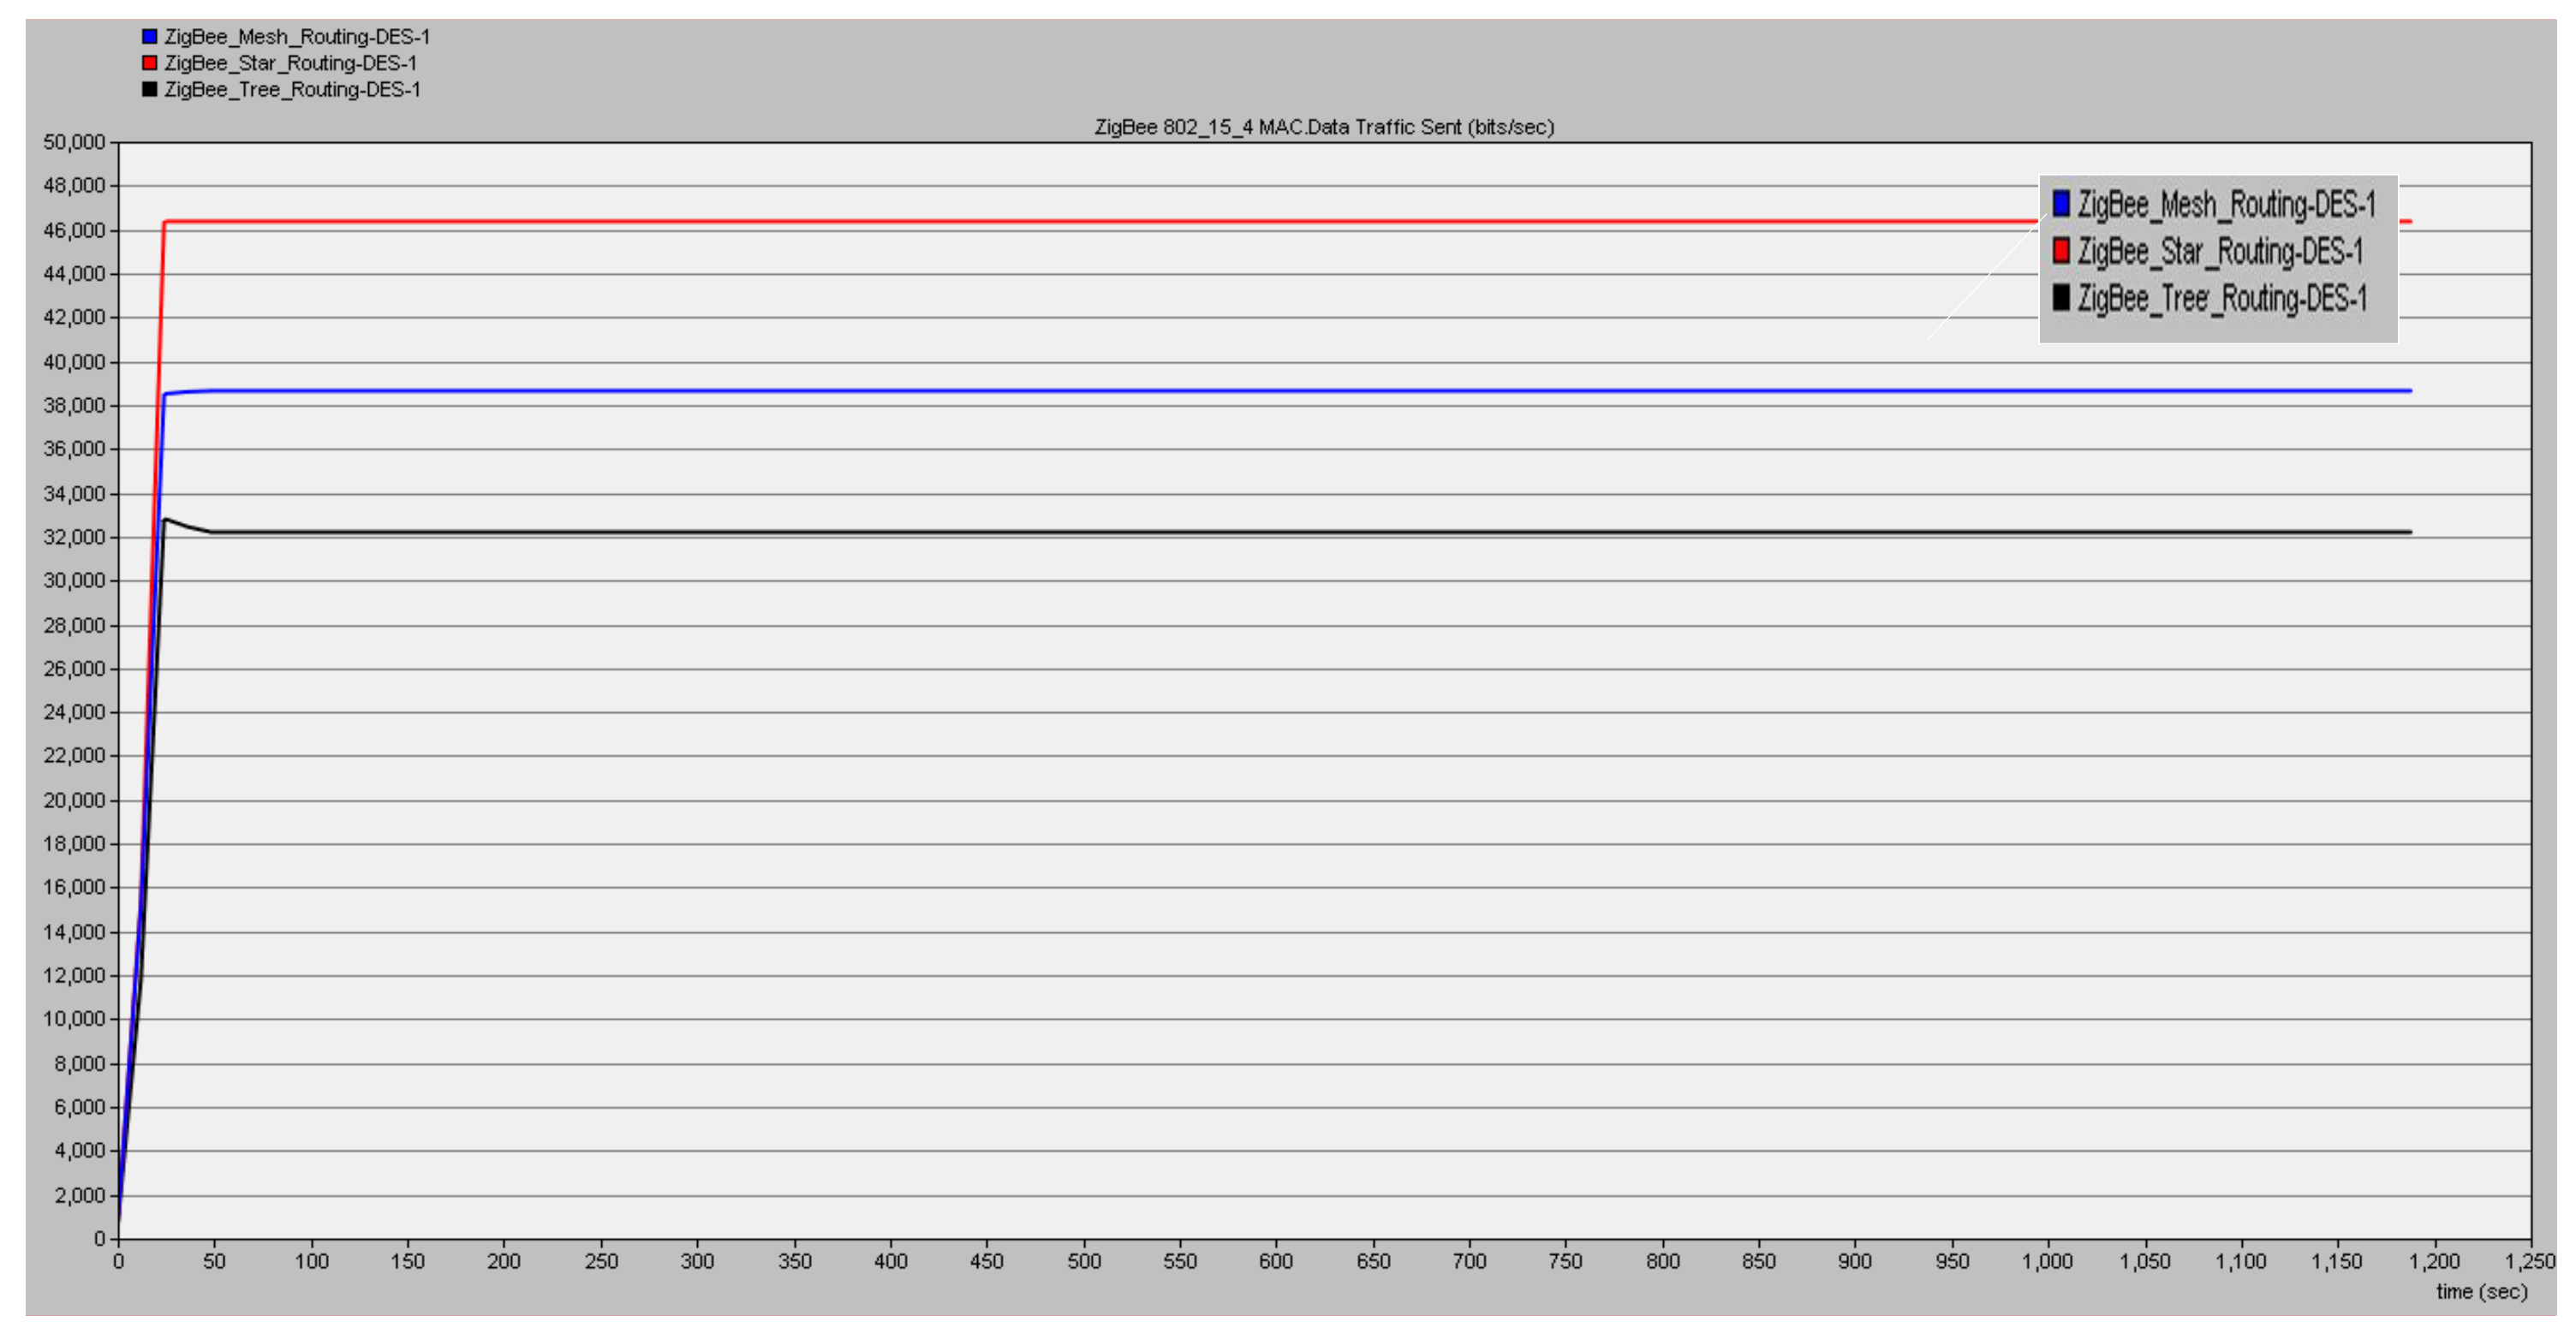
5.2.2. Data Traffic Sent
Data flow is defined as the total number of bits of data sent from the source to the destination per unit of time, which occurs independently of whether all the data bits have reached their destination. Figure 17 shows that the transmitted data rates are 0.165, 0.0385 and 0.0325 Mbit/s for the star, mesh and tree topologies. This result indicates that the maximum data traffic occurs in the topology of the stars because this type of topology allows the use of the coordinator and the router for communication. A full-function device (FFD) is responsible for generating traffic and maintaining a routing table in a PAN coordinator.
5.2.3. Data Traffic Received
Data traffic describes the movement of data received per unit of time. Figure 18 shows that the received data traffic is 0.650, 0.540 and 0.3805 Mbp/s for the star, mesh and tree topology, respectively. This discovery means that the received traffic reaches its maximum in the star topology since all devices communicate via the FFD or PAN coordinator and are responsible for traffic generation and routing. Fewer collisions and reduced packet loss cause the maximum data traffic in the star topology. The received data traffic is the smallest in the tree topology, especially considering that the use of the device (RFD) must be communicated through the coordinator. The communication topology increases the data communication between the device and the PAN coordinator. Moreover, the cause and effect of increased data packet loss can reduce the data traffic received.
5.2.4. End-to-End Delay
Figure 19 shows that the delay is 9.6 and 7.9 ms for the mesh/tree and star topologies, respectively. These results indicate that the mesh and tree topologies have a longer delay than the star topology. In the star topology, only one parent is represented by the ZigBee coordinator. Therefore, the final device mobility causes a certain delay.
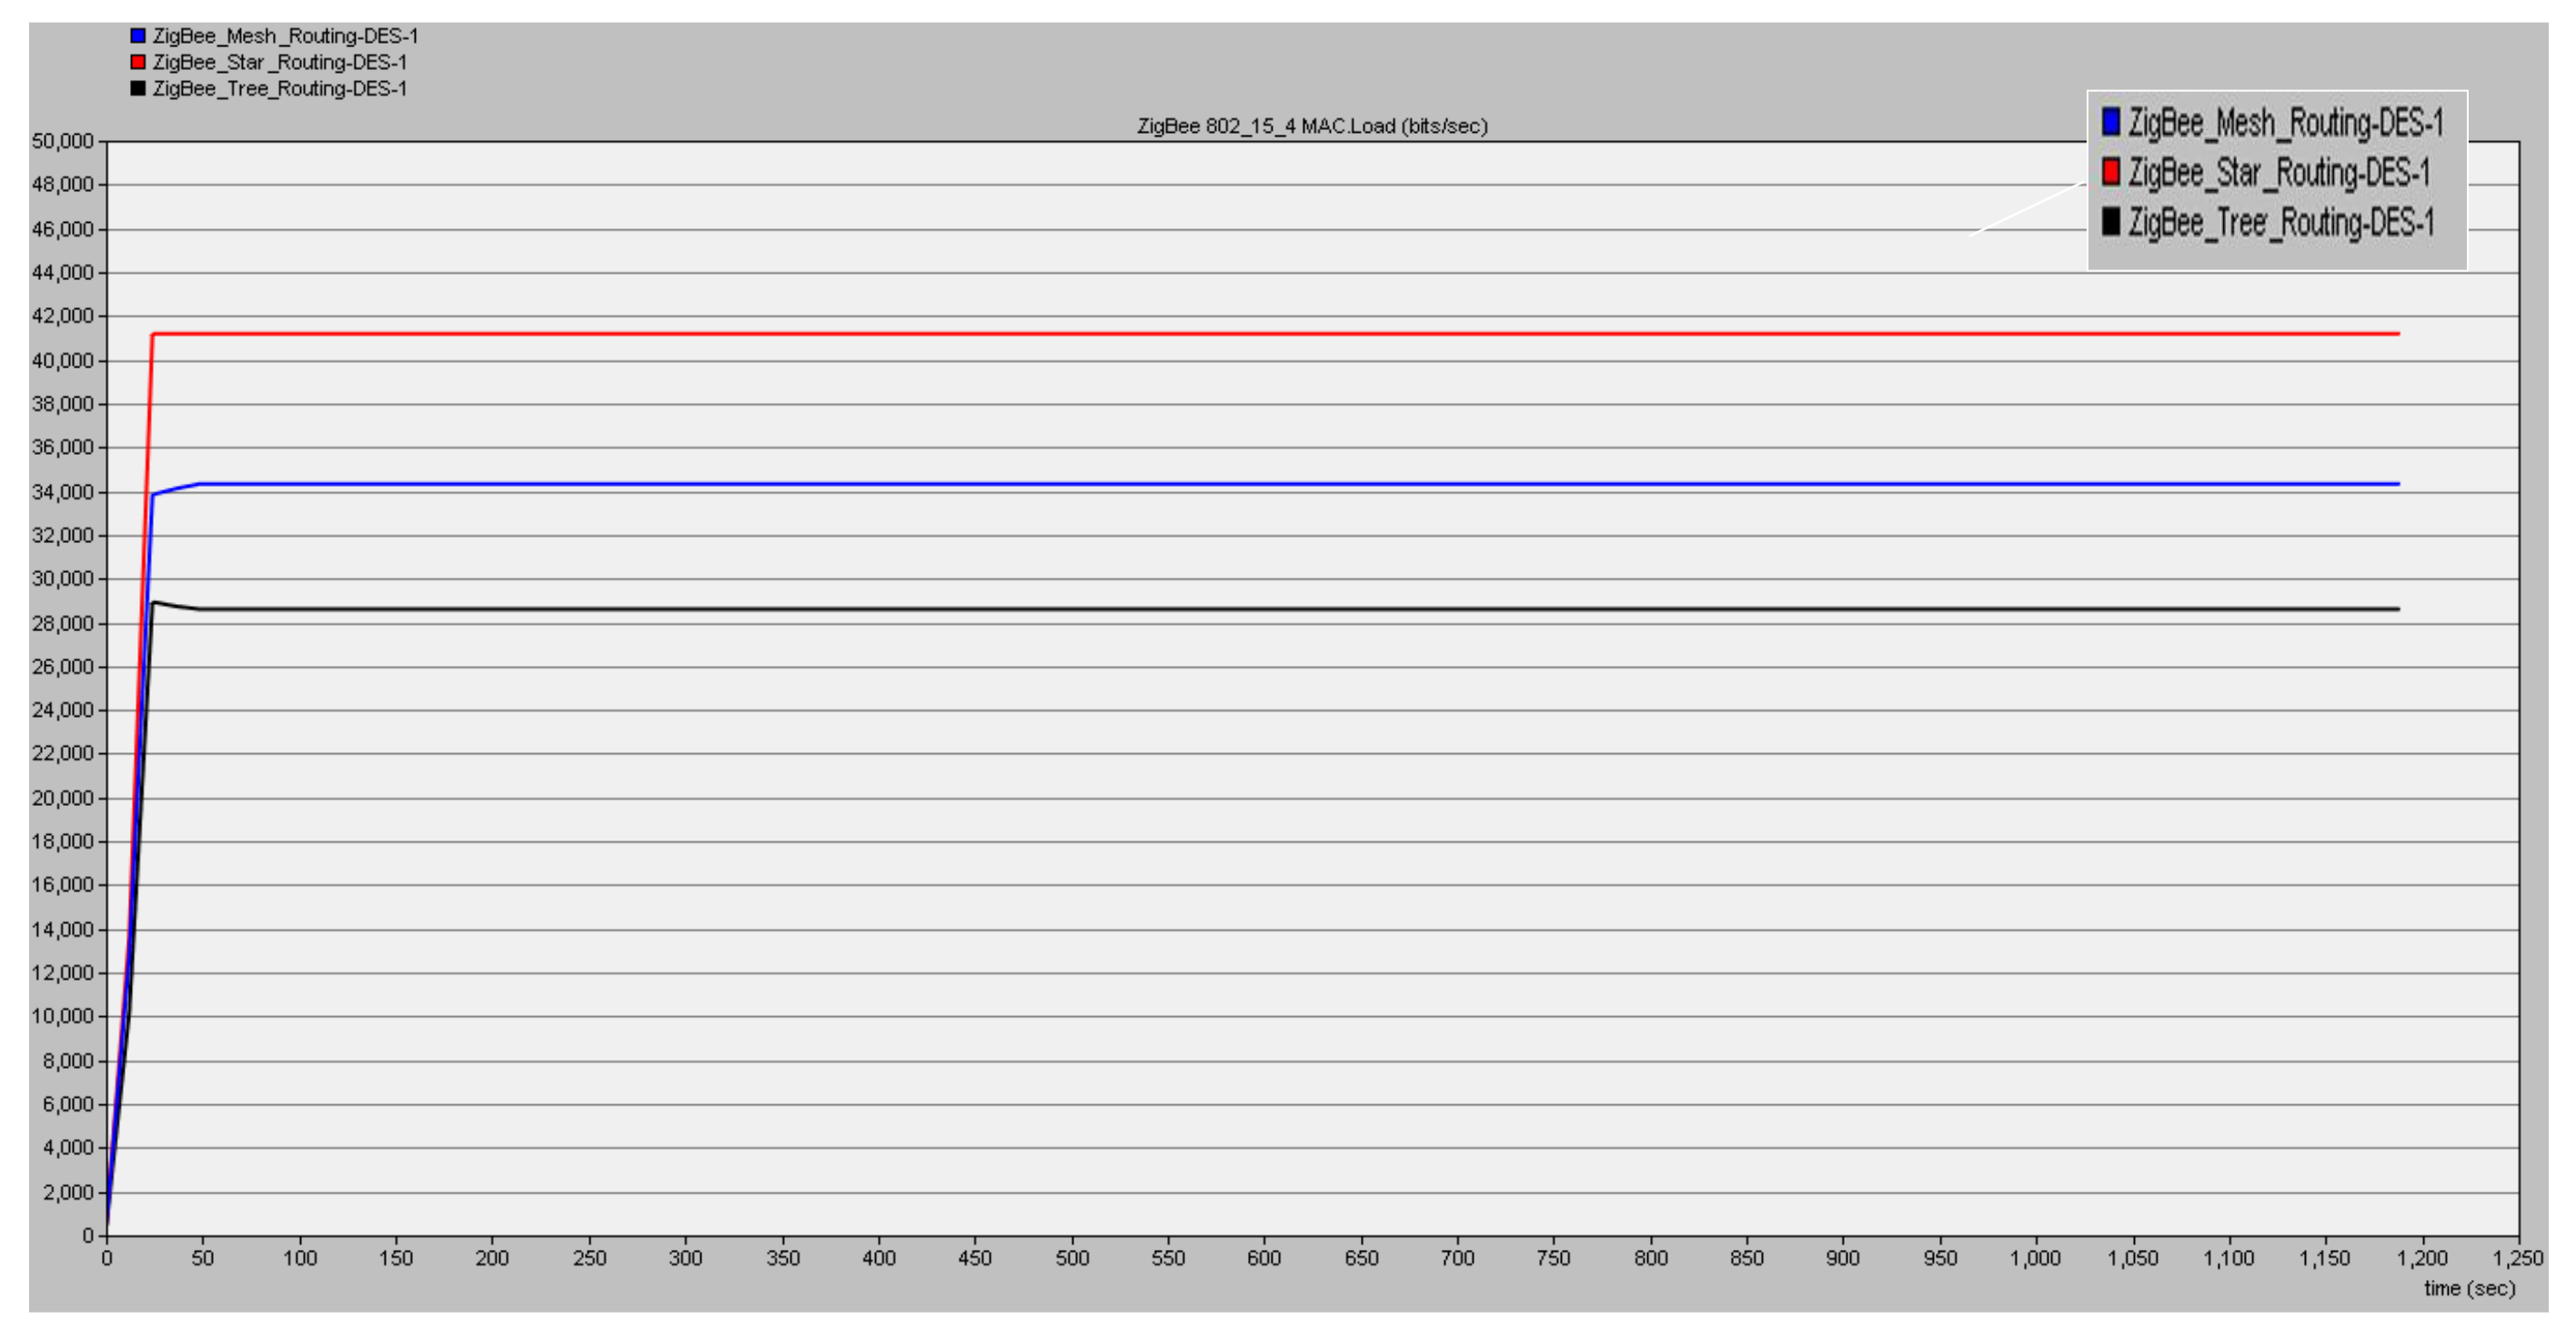
5.2.5. Medium Access Control (MAC) Load
In this paragraph, we proposed the application of MAC to wireless sensor networks. Wireless sensor networks use battery-operated and sensing devices. A network of these devices can act synchronously for monitoring. We expect that these sensor networks will be deployed in an ad hoc fashion, with nodes remaining largely in the monitoring mode for a long time, before becoming suddenly active when a fault is detected. This strategy places strong emphasis on energy efficiency. Energy conservation and self-configuration are the main goals, while per-node fairness and latency are less important. MAC uses a technique to reduce energy consumption and support self-configuration. It enables low-duty-cycle operation in a multi-hop network. Finally, the MAC applies the delivery of messages to reduce the disputed latency used for data processing that needs to be in the network, which is shown in Figure 20.
As mentioned in Table 3, the local routing information only covers a small area. The routing protocols for mobile ad-hoc networks tend to face the challenge of frequently changing topology and asymmetric links. The issue was related to small zones (diameter of the test distance was about 250 m) to some extent, which is shown in Figure 9.
6. Conclusions
Smart grid systems are often referred to as the next-generation system as many believe that these systems are the revolutionary and evolutionary replacement of existing power grids. The smart grid is expected to significantly increase the efficiency and reliability of future energy systems with renewable energy resources. WSN has excellent characteristics, such as high precision in sensing and low cost. Therefore, it can be useful in the development of interesting applications for remote sensing.
The generator is an important part of the power system. In order to ensure the quality and reliability of power supply, this generator should be constantly monitored and protected. Otherwise, when failure or improper operation occurs, the reverse power condition may occur. If the reverse current is not considered in the design of the protection system, this will create massive problems. The purpose of this study was to investigate the reverse power of generation units. After this, the reverse power data are collected from the generator protection relay. Relays are capable of detecting interference and the occurrence of disturbances. The point of tripping is adjustable in the range of 2–20% of the rated current through the control unit. There is also an adjustable time delay of 0.2–20 s to avoid unwanted tripping. The scheme is implemented on the AI controller. This method proves the effectiveness of the hardware platform in developing novel protection functions.
In this study, the performance analysis based on the technology of the ZigBee wireless network topology was conducted using the OPNET 14.5 simulator. The standard ZigBee wireless communication protocol and its high-level structure were also analyzed in relation to its low power consumption, efficient battery usage and low cost.
Based on four parameters, the network topologies of star, tree and mesh are compared in terms of end-to-end delay, throughput, MAC of the load of traffic and traffic parameters of sending and receiving. The star topology performs best with respect to throughput and has a higher MAC load and similar movements of the resultant values compared to the mesh topology.
Acknowledgments
The author would like to thank the editor and reviewers for their constructive comments and suggestions on this article. I would like to express my deep gratitude to the Janan A. Al-Hajji. The Ministry of Higher Education and Scientific Research, Southern Technical University, BETC supported this research. (N.12-2017)
Author Contributions
J.A. aided in interpreting the results and worked on the manuscript. All authors discussed the results and contributed to the final manuscript.
Conflicts of Interest
The authors declare no conflict of interest.
Appendix A

Table A1.
Technical data for Reverse power monitoring.
| Set Point | Value |
|---|---|
| Range | ~2–20% reverse current |
| Time delay | Adjustable 0–20 s |
Table A2.
Microgrid simulator parameters.
| Microgrid | Parameters | Value |
|---|---|---|
| Generator | Voltage | 11 k V L−L, S = 200 MVA |
| Transformer | Voltage | VP/VS (L−L) = 11 kV/220 kV |
| Frequency | 60 Hz | |
| Feeders | Line impedance | R = 0.02 X, L = 0.64 mH |
| 15 km Feeder | R/km = 0.4 Ω, X/km = 0.3 Ω | |
| Load | Dyn load | 10 MW, 3 MVAR |
References
- Abdulwahid, A.; Wang, S. Application of Differential Protection Technique of Domestic Solar Photovoltaic Based Microgrid. Int. J. Control Autom. 2016, 9, 371–386. [Google Scholar] [CrossRef]
- Khan, M.S.; Woo, M.; Nam, K.; Chathoth, P.K. Smart City and Smart Tourism: A Case of Dubai. Sustainability 2017, 9, 2279. [Google Scholar] [CrossRef]
- Amzucu, D.; Fledderus, E. Indoor radio propagation and interference in 2.4 GHz wireless sensor networks: Measurements and analysis. Wirel. Pers. Commun. 2014, 76, 245–269. [Google Scholar] [CrossRef]
- Baronti, P.; Pillai, P.; Chook, V.W.C.; Chesta, S.; Gotta, S.A.; Hu, Y.F. Wireless sensor networks: A survey on the state of the art and the 802.15.4 and ZigBee standards. Comput. Commun. 2007, 30, 1655–1695. [Google Scholar] [CrossRef]
- Akram, U.; Khalid, M.; Shafiq, S. Optimal sizing of a wind/solar/battery hybrid grid-connected microgrid system. IET Renew. Power Gener. 2018, 12, 72–80. [Google Scholar] [CrossRef]
- Llaria, A.; Terrasson, G.; Curea, O.; Jiménez, J. Application of Wireless Sensor and Actuator Networks to Achieve Intelligent Microgrids: A Promising Approach towards a Global Smart Grid Deployment. Appl. Sci. 2016, 6, 61. [Google Scholar] [CrossRef]
- Cagnetti, M.; Leccese, F.; Proietti, A. Energy saving project for heating system with ZigBee wireless control network. In Proceedings of the 11th International Conference on Environment and Electrical Engineering, Venice, Italy, 18–25 May 2012; pp. 580–585. [Google Scholar] [CrossRef]
- Mishra, B.C.; Panda, A.S.; Rout, N.K. A Novel Efficient Design of Intelligent Street Lighting Monitoring System Using ZigBee Network of Devices and Sensors on Embedded Internet Technology. In Proceedings of the 14th International Conference on Information Technology, Bhubaneswar, India, 21–23 December 2015; pp. 200–205. [Google Scholar] [CrossRef]
- Kaleem, Z.; Ahmad, I.; Lee, C. Smart and Energy Efficient LED Street Light Control System Using ZigBee Network. In Proceedings of the 12th International Conference on Frontiers of Information Technology, Islamabad, Pakistan, 17–19 December 2014; pp. 361–365. [Google Scholar] [CrossRef]
- Martinez-Sandoval, R.; Garcia-Sanchez, A.-J.; Garcia-Sanchez, F.; Garcia-Haro, J.; Flynn, D. A Comprehensive WSN-Based Approach to Efficiently Manage a Smart Grid. Sensors 2014, 14, 18748–18783. [Google Scholar] [CrossRef] [PubMed]
- Leccese, F.; Leonowicz, Z. Intelligent wireless street lighting system. In Proceedings of the 11th International Conference on Environment and Electrical Engineering, Venice, Italy, 18–25 May 2012; pp. 958–961. [Google Scholar] [CrossRef]
- Chen, K.-L.; Chen, Y.-R.; Tsai, Y.-P.; Chen, N. A Novel Wireless Multifunctional Electronic Current Transformer Based on ZigBee-Based Communication. IEEE Trans. Smart Grid 2017, 8, 1888–1897. [Google Scholar] [CrossRef]
- Berger, L.T.; Schwager, A.; Escudero-Garzás, J.J. Power line communications for smart grid applications. J. Electr. Comput. Eng. 2013, 2013, 712376. [Google Scholar] [CrossRef]
- Uribe-Pérez, N.; Angulo, I.; Vega, D.; Arzuaga, T.; Fernández, I.; Arrinda, A. Smart Grid Applications for a Practical Implementation of IP over Narrowband Power Line Communications. Energies 2017, 10, 1782. [Google Scholar] [CrossRef]
- Maw, H.A.; Xiao, H.; Christianson, B. A Survey of Access Control Models in Wireless Sensor Networks. J. Sens. Actuator Netw. 2014, 3, 150–180. [Google Scholar] [CrossRef] [Green Version]
- Callaway, E.; Gorday, P. Hester, Home networking with IEEE 802.15.4: A developing standard for low-rate wireless personal area networks. IEEE Commun. Mag. 2002, 40, 70–77. [Google Scholar] [CrossRef]
- Youn, M.; Lee, J. Topology control algorithm considering antenna radiation pattern in three-dimensional wireless sensor networks. Int. J. Distrib. Sens. Netw. 2014, 11. [Google Scholar] [CrossRef]
- Leccese, F.; Cagnetti, M.; Trinca, D. A Smart City Application: A Fully Controlled Street Lighting Isle Based on Raspberry-Pi Card, a ZigBee Sensor Network and WiMAX. Sensors 2014, 14, 24408–24424. [Google Scholar] [CrossRef] [PubMed]
- Pešović, U.; Mohorko, J. Hidden node avoidance mechanism for IEEE 802.15 4 wireless sensor networks. Electron. Compon. Mater. 2013, 43, 14–21. [Google Scholar]
- Ajay, M.L. Fundamentals of Cellular Network Planning and Optimization; Willey—Interacience Publication: Toronto, ON, Canada, 2004. [Google Scholar]
- Leccese, F.; Cagnetti, M.; Calogero, A.; Trinca, D.; di Pasquale, S.; Giarnetti, S.; Cozzella, L. A new acquisition and imaging system for environmental measurements: An experience on the Italian cultural heritage. Sensors 2014, 14, 9290–9312. [Google Scholar] [CrossRef] [PubMed]
- Qin, H.; Zhang, W. ZigBee-assisted power saving for more efficient and sustainable ad hoc networks. IEEE Trans. Wirel. Commun. 2013, 12, 6180–6193. [Google Scholar] [CrossRef]
- Leccese, F. Remote-control system of high efficiency and intelligent street lighting using a ZigBee network of devices and sensors. IEEE Trans. Power Deliv. 2013, 28, 21–28. [Google Scholar] [CrossRef]
- Shi, J.F.; Chen, M.; Yang, Z. Power control and performance analysis for full-duplex relay-assisted D2D communication underlaying fifth-generation cellular networks. IET Commun. 2017, 11, 2729–2734. [Google Scholar] [CrossRef]
- Sharaf, H.; Zeineldin, H.; El-Saadany, E. Protection Coordination for Microgrids With Grid-Connected and Islanded Capabilities Using Communication Assisted Dual Setting Directional Overcurrent Relays. IEEE Trans. Smart Grid 2018, 9, 143–151. [Google Scholar] [CrossRef]
- Ibrahim, M.E.; Abd-Elhady, A.M. Power frequency AC voltage measurement based on double wound Rogowski coil. IET High Volt. 2017, 2, 129–135. [Google Scholar] [CrossRef]
- Farjah, E.; Givi, H.; Ghanbari, T. Application of an Efficient Rogowski Coil Sensor for Switch Fault Diagnosis and Capacitor ESR Monitoring in Nonisolated Single-Switch DC-DC Converters. IEEE Trans. Power Electron. 2017, 32, 1442–1456. [Google Scholar] [CrossRef]
- Leccese, F.; Cagnetti, M.; Di Pasquale, S.; Giarnetti, S.; Caciotta, M. A new power quality instrument based on raspberry-pi. Electronics 2016, 5, 64. [Google Scholar] [CrossRef]
- Abdulwahid, A.; Wang, S. A Busbar differential protection based on fuzzy reasoning system and Rogowski-coil current sensor for microgrid. In Proceedings of the IEEE PES Asia-Pacific Power and Energy Engineering Conference, Xi’an, China, 25–28 October 2016; pp. 194–199. [Google Scholar] [CrossRef]
- Ibrahim, M.; Abd-Elhady, A.M. Differential Reconstruction Method for Power Frequency AC Current Measurement Using Rogowski Coil. IEEE Sens. 2016, 16, 8420–8425. [Google Scholar] [CrossRef]
- Aman, M.M.; Jasmon, G.B.; Khan, Q.A.; Abu Bakar, A.H.B.; Jamian, J.J. Modeling and simulation of reverse power relay for generator protection. In Proceedings of the IEEE International Power Engineering and Optimization Conference (PEDCO), Melaka, Malaysia, 6–7 June 2012; pp. 317–322. [Google Scholar]
- Ehrenberger, J.; Svec, J. Directional Overcurrent Relays Coordination Problems in Distributed Generation Systems. Energies 2017, 10, 1452. [Google Scholar] [CrossRef]
- Chan, Y.-K.; Gu, J.-C. Modeling of Turbine Cycles Using a Neuro-Fuzzy Based Approach to Predict Turbine-Generator Output for Nuclear Power Plants. Energies 2012, 5, 101–118. [Google Scholar] [CrossRef]
- Cervantes, J.; Salazar, S.; Chairez, I. Takagi-Sugeno Dynamic Neuro-Fuzzy Controller of Uncertain Nonlinear Systems. IEEE Trans. Fuzzy Syst. 2017, 25, 1601–1615. [Google Scholar] [CrossRef]
- Kermany, S.D.; Joorabian, M.; Deilami, S.; Mohammad, A.S. Masoum, Hybrid Islanding Detection in Microgrid with Multiple Connection Points to Smart Grids Using Fuzzy-Neural Network. IEEE Trans. Power Syst. 2017, 32, 2640–2651. [Google Scholar] [CrossRef]
- Abdulwahid, A.; Wang, S. A Novel Approach for Microgrid Protection Based upon Combined ANFIS and Hilbert Space-Based Power Setting. Energies 2016, 9, 1042. [Google Scholar] [CrossRef]
- Shahgoshtasbi, D.; Jamshidi, M.M. A New Intelligent Neuro-Fuzzy Paradigm for Energy-Efficient Homes. IEEE Syst. J. 2014, 8, 664–673. [Google Scholar] [CrossRef]
- Lin, W.M.; Hong, C.M.; Cheng, F.S. Fuzzy neural network output maximization control for sensorless wind energy conversion system. Energy 2015, 35, 592–601. [Google Scholar] [CrossRef]
- Garcia, P.; Garcia, C.A.; Fernandez, L.M.; Llorens, F.; Jurado, F. ANFIS-Based Control of a Grid-Connected Hybrid System Integrating Renewable Energies, Hydrogen and Batteries. IEEE Trans. Ind. Inform. 2014, 10, 1107–1117. [Google Scholar] [CrossRef]
Figure 1.
Smart grid communication infrastructure.

Figure 2.
Vector diagram of current and voltage according to the Reversed Power Relay in the system.
Figure 2.
Vector diagram of current and voltage according to the Reversed Power Relay in the system.

Figure 3.
Implementation of a directional component.

Figure 4.
Modeling of a directional element on MATLAB and Simulink.

Figure 5.
(a) Quadrants of current/voltage in a phasor diagram plane and (b) Quadrants of a power plane.
Figure 5.
(a) Quadrants of current/voltage in a phasor diagram plane and (b) Quadrants of a power plane.
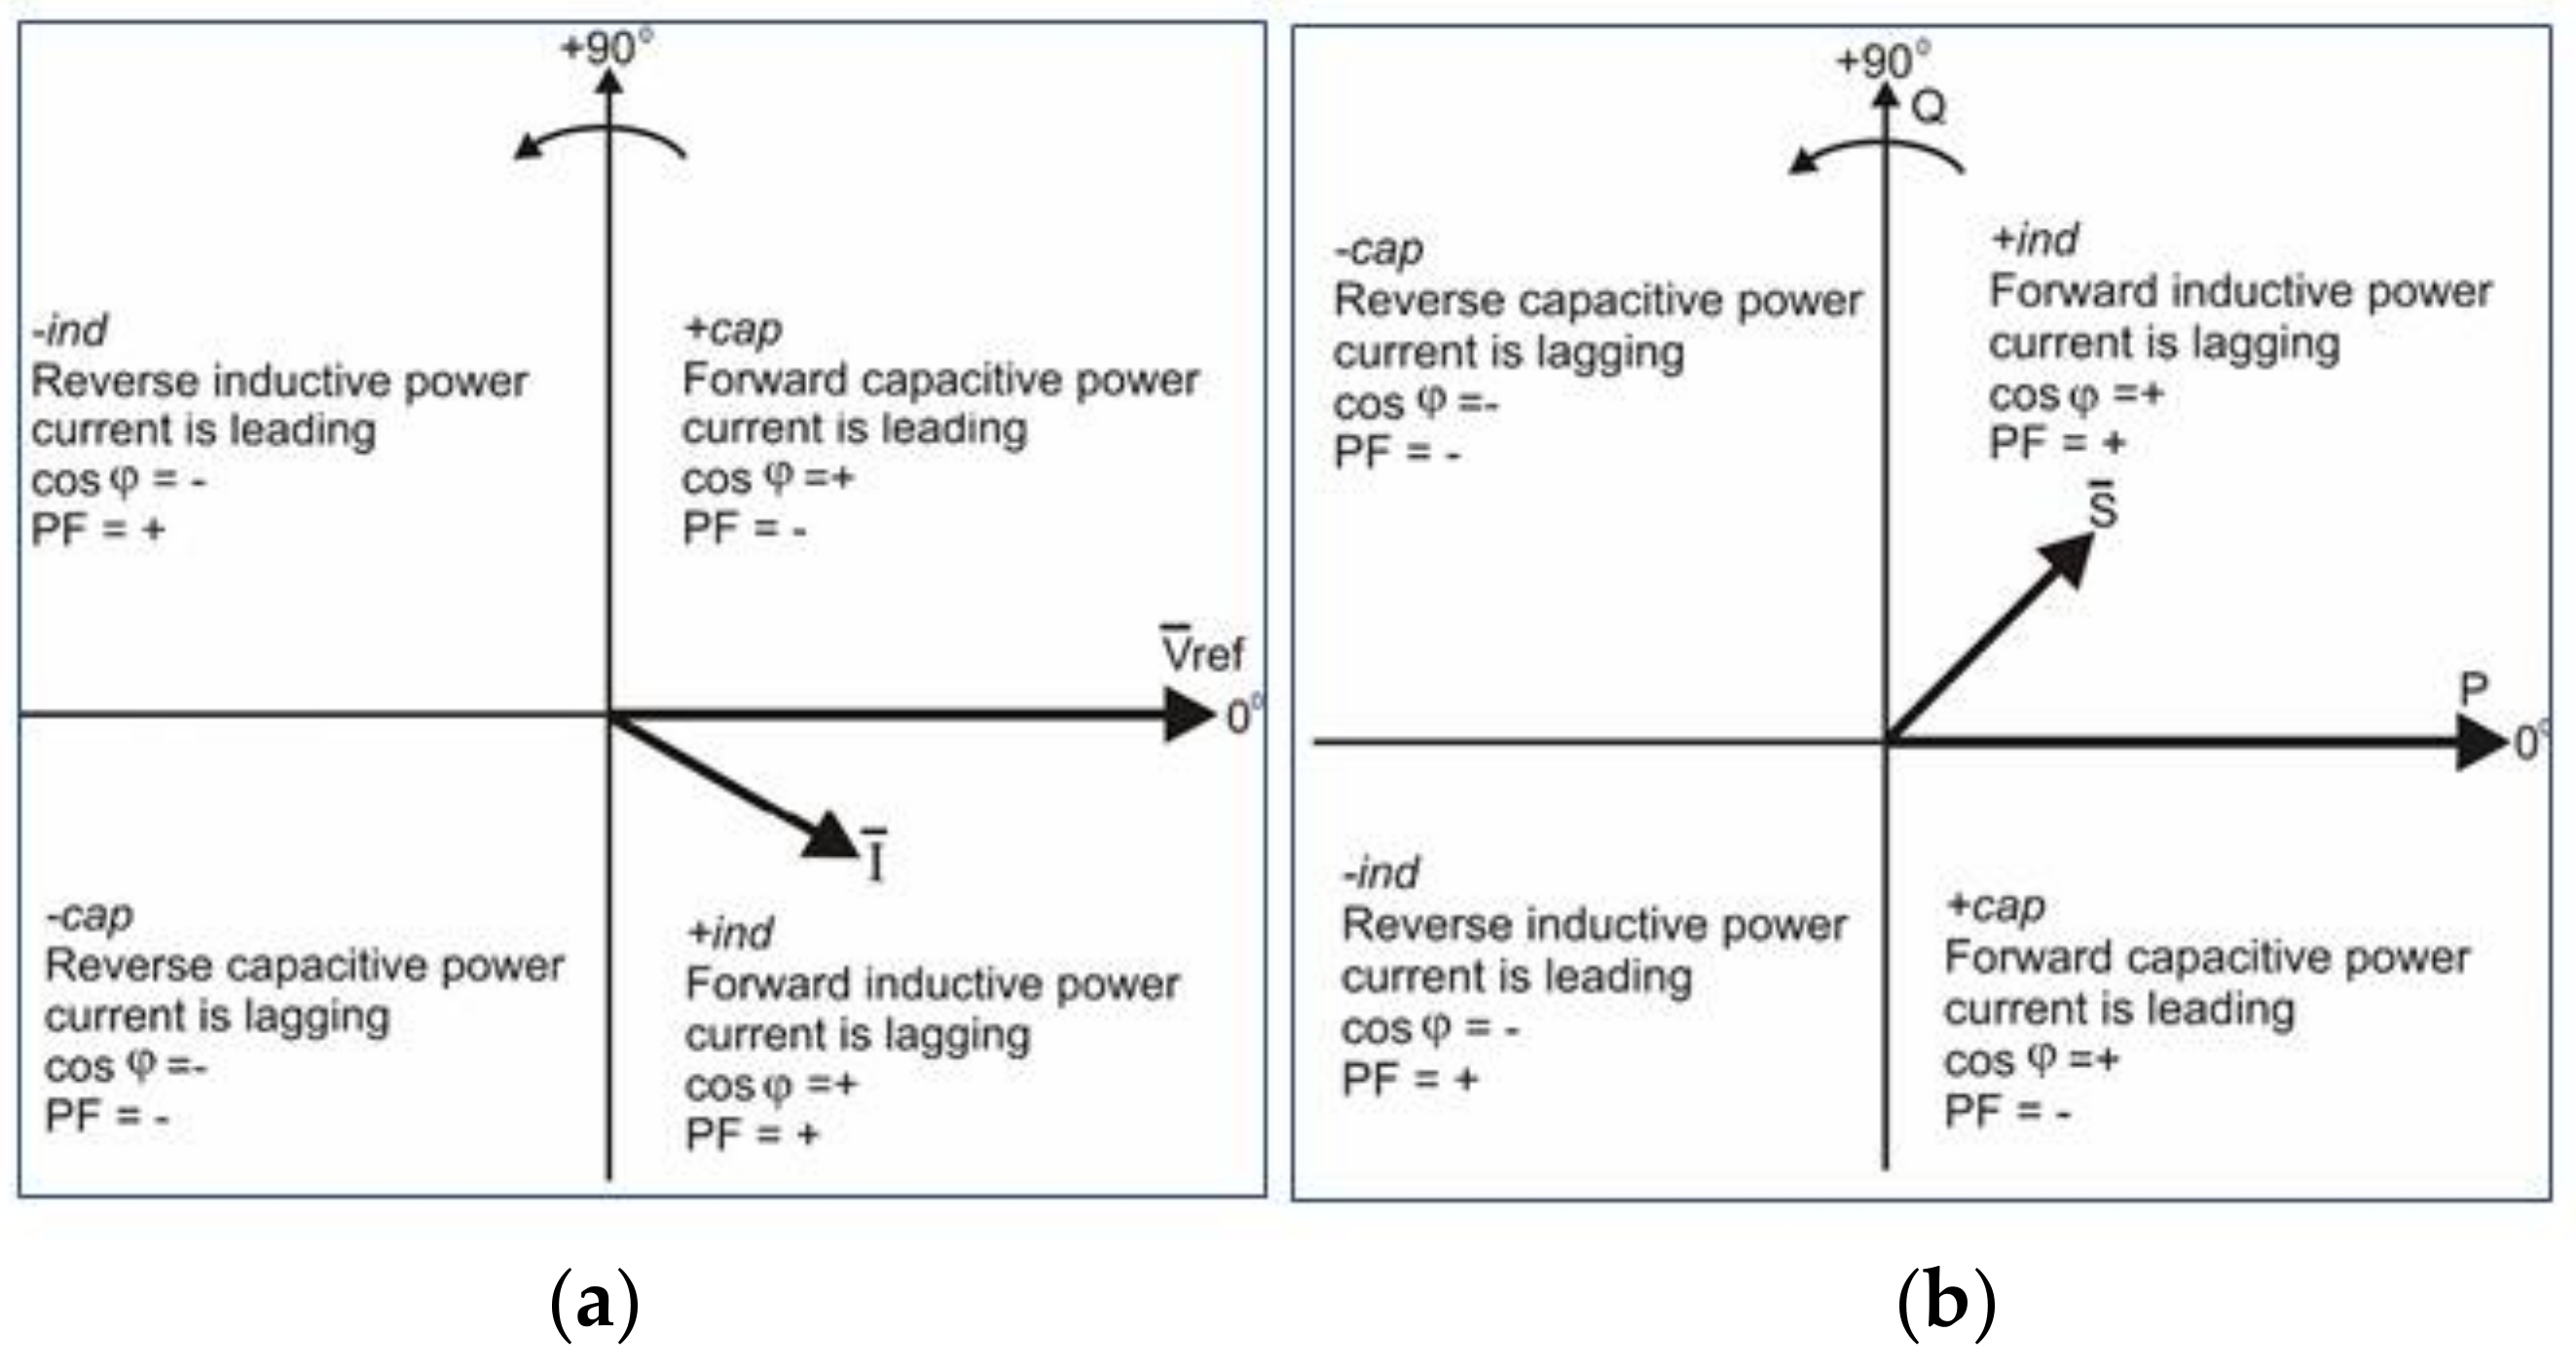
Figure 6.
Block diagram of the adaptive neuro-fuzzy approach.
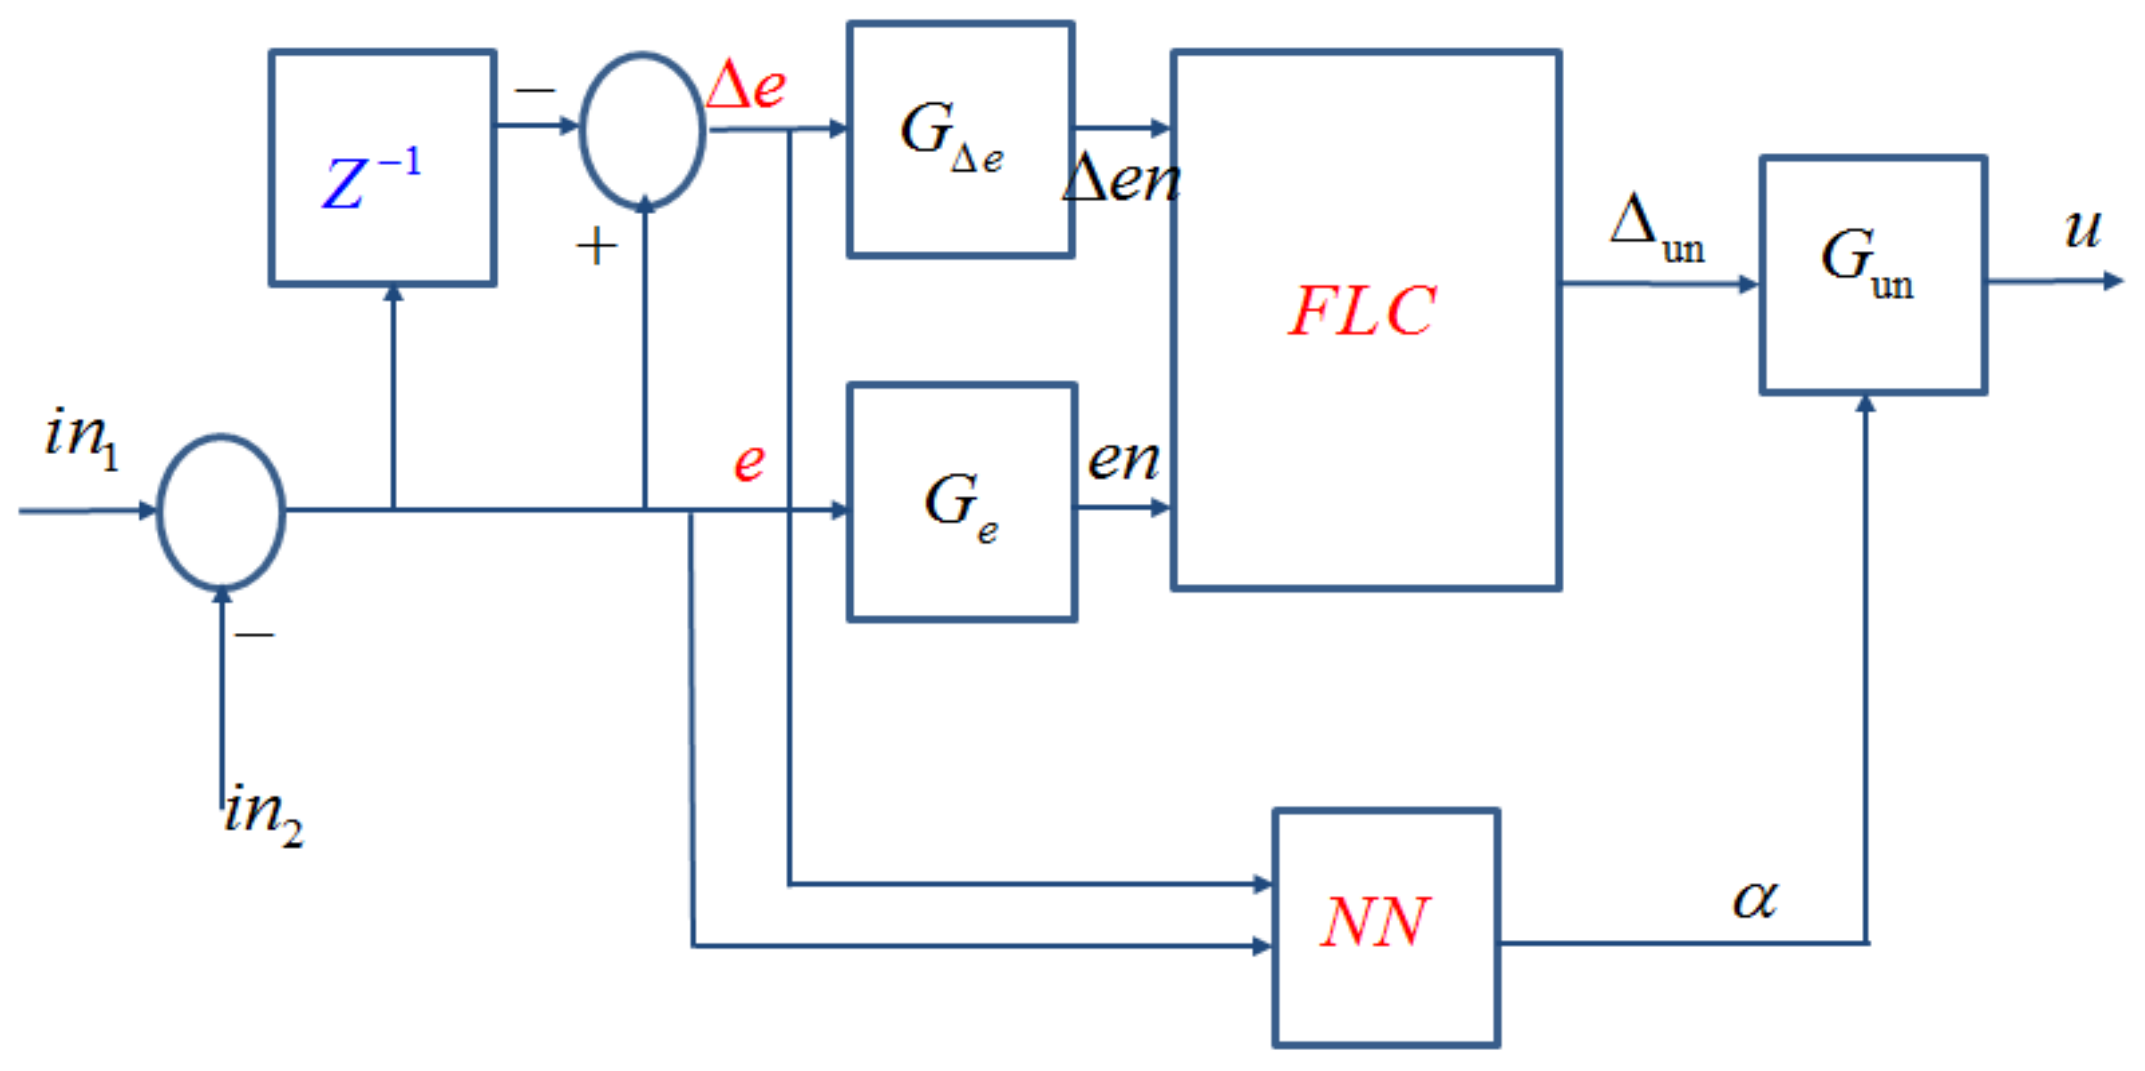
Figure 7.
Membership functions of FL.
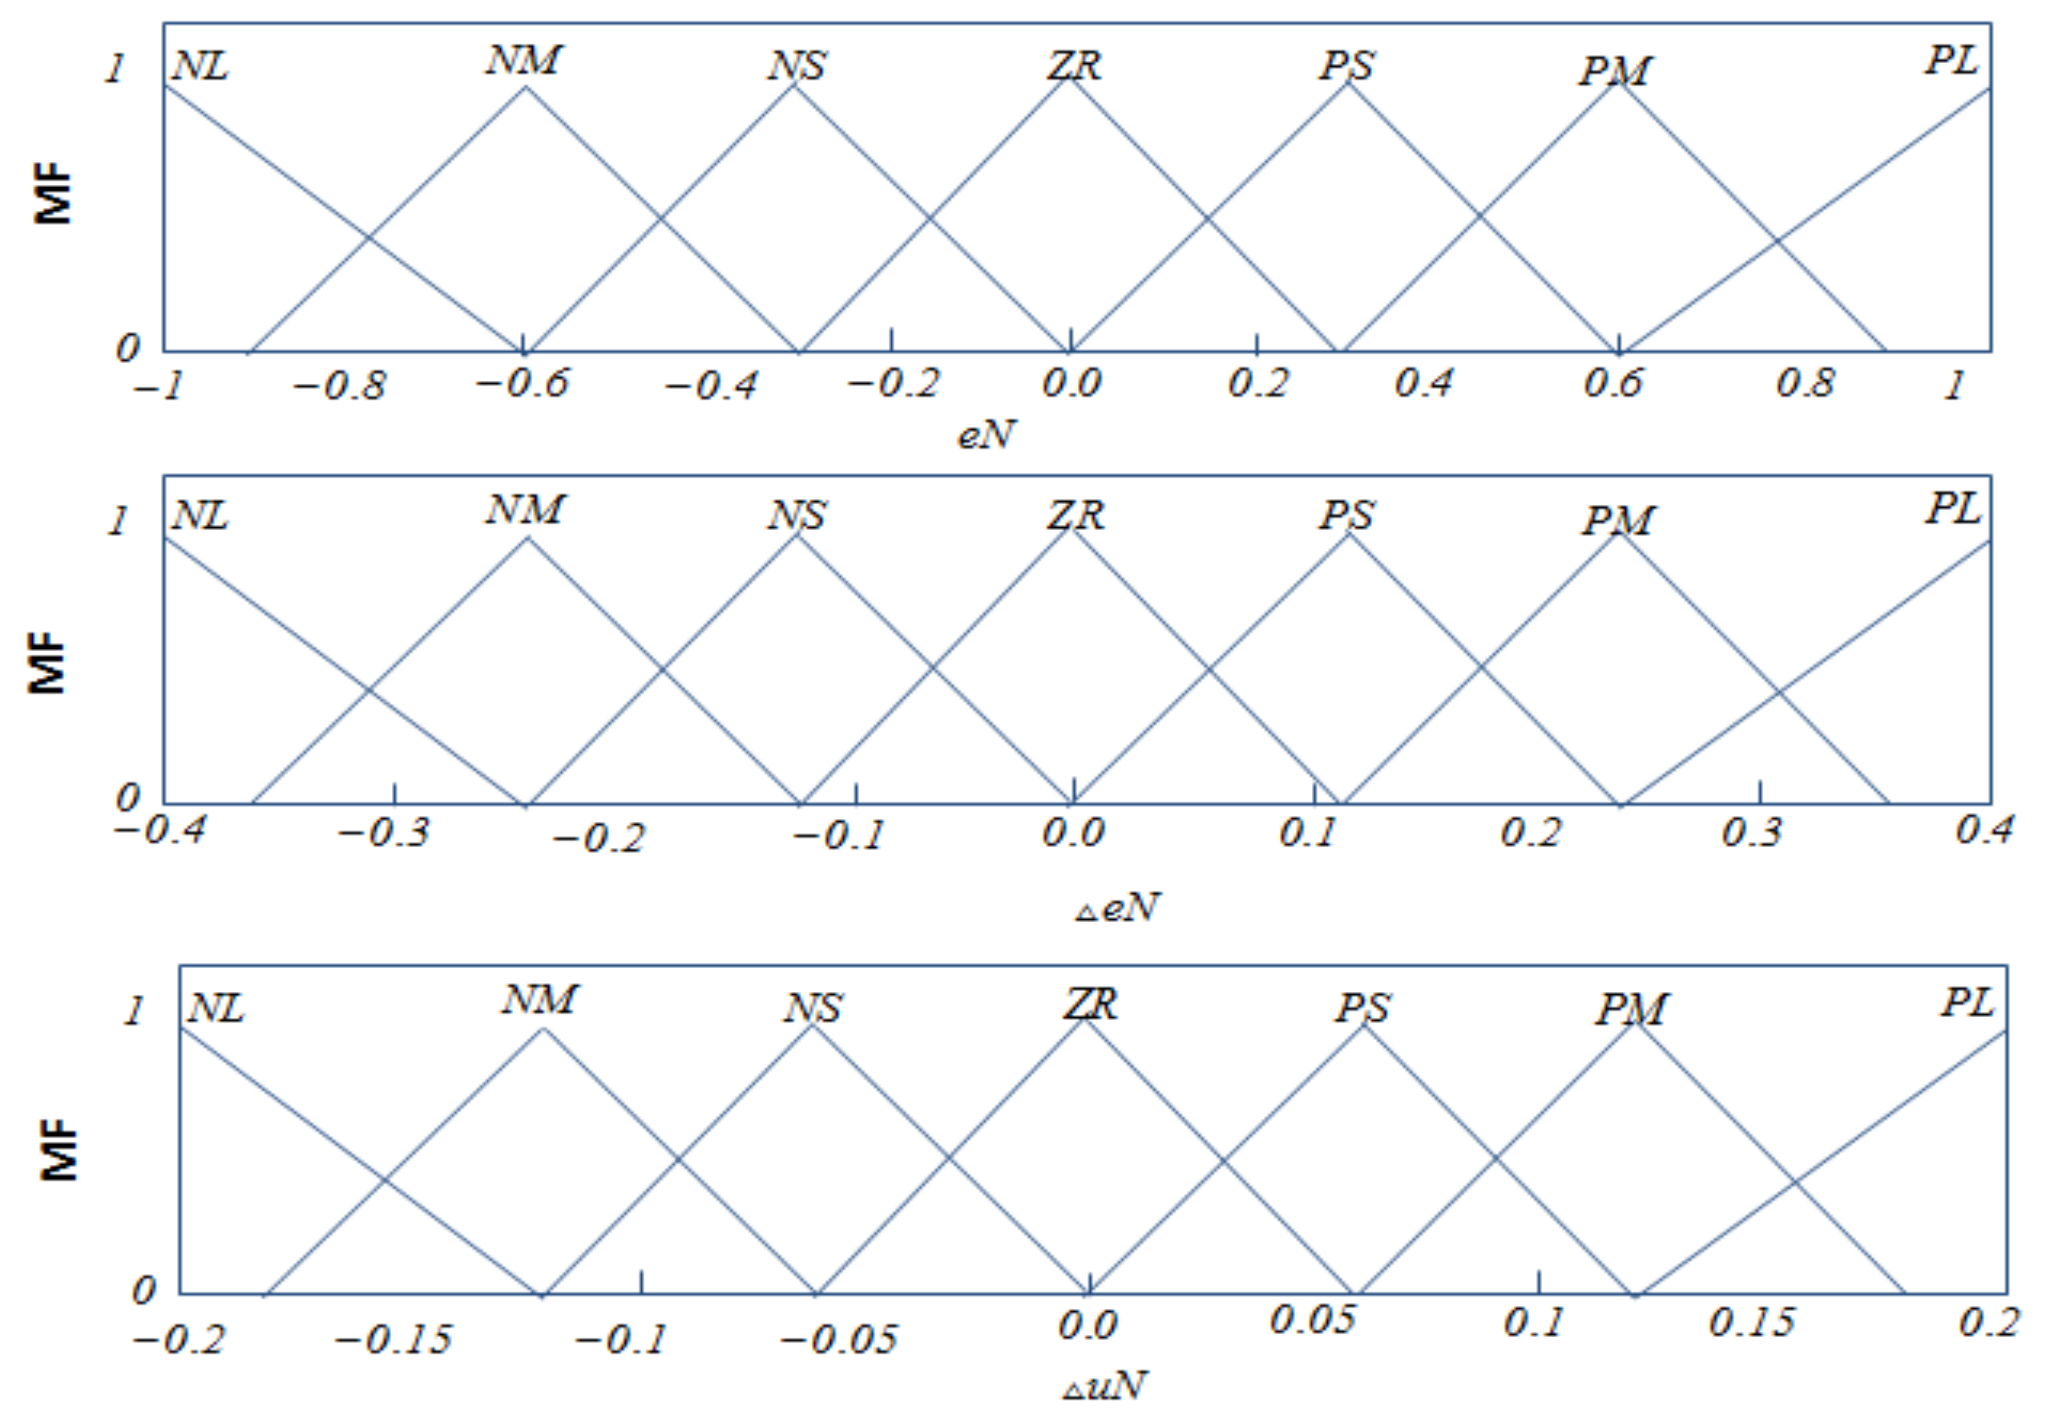
Figure 8.
Block diagram of the neural network structures.

Figure 9.
Basic scenario consisting of a one coordinator, (6) routers and (8) end devices.
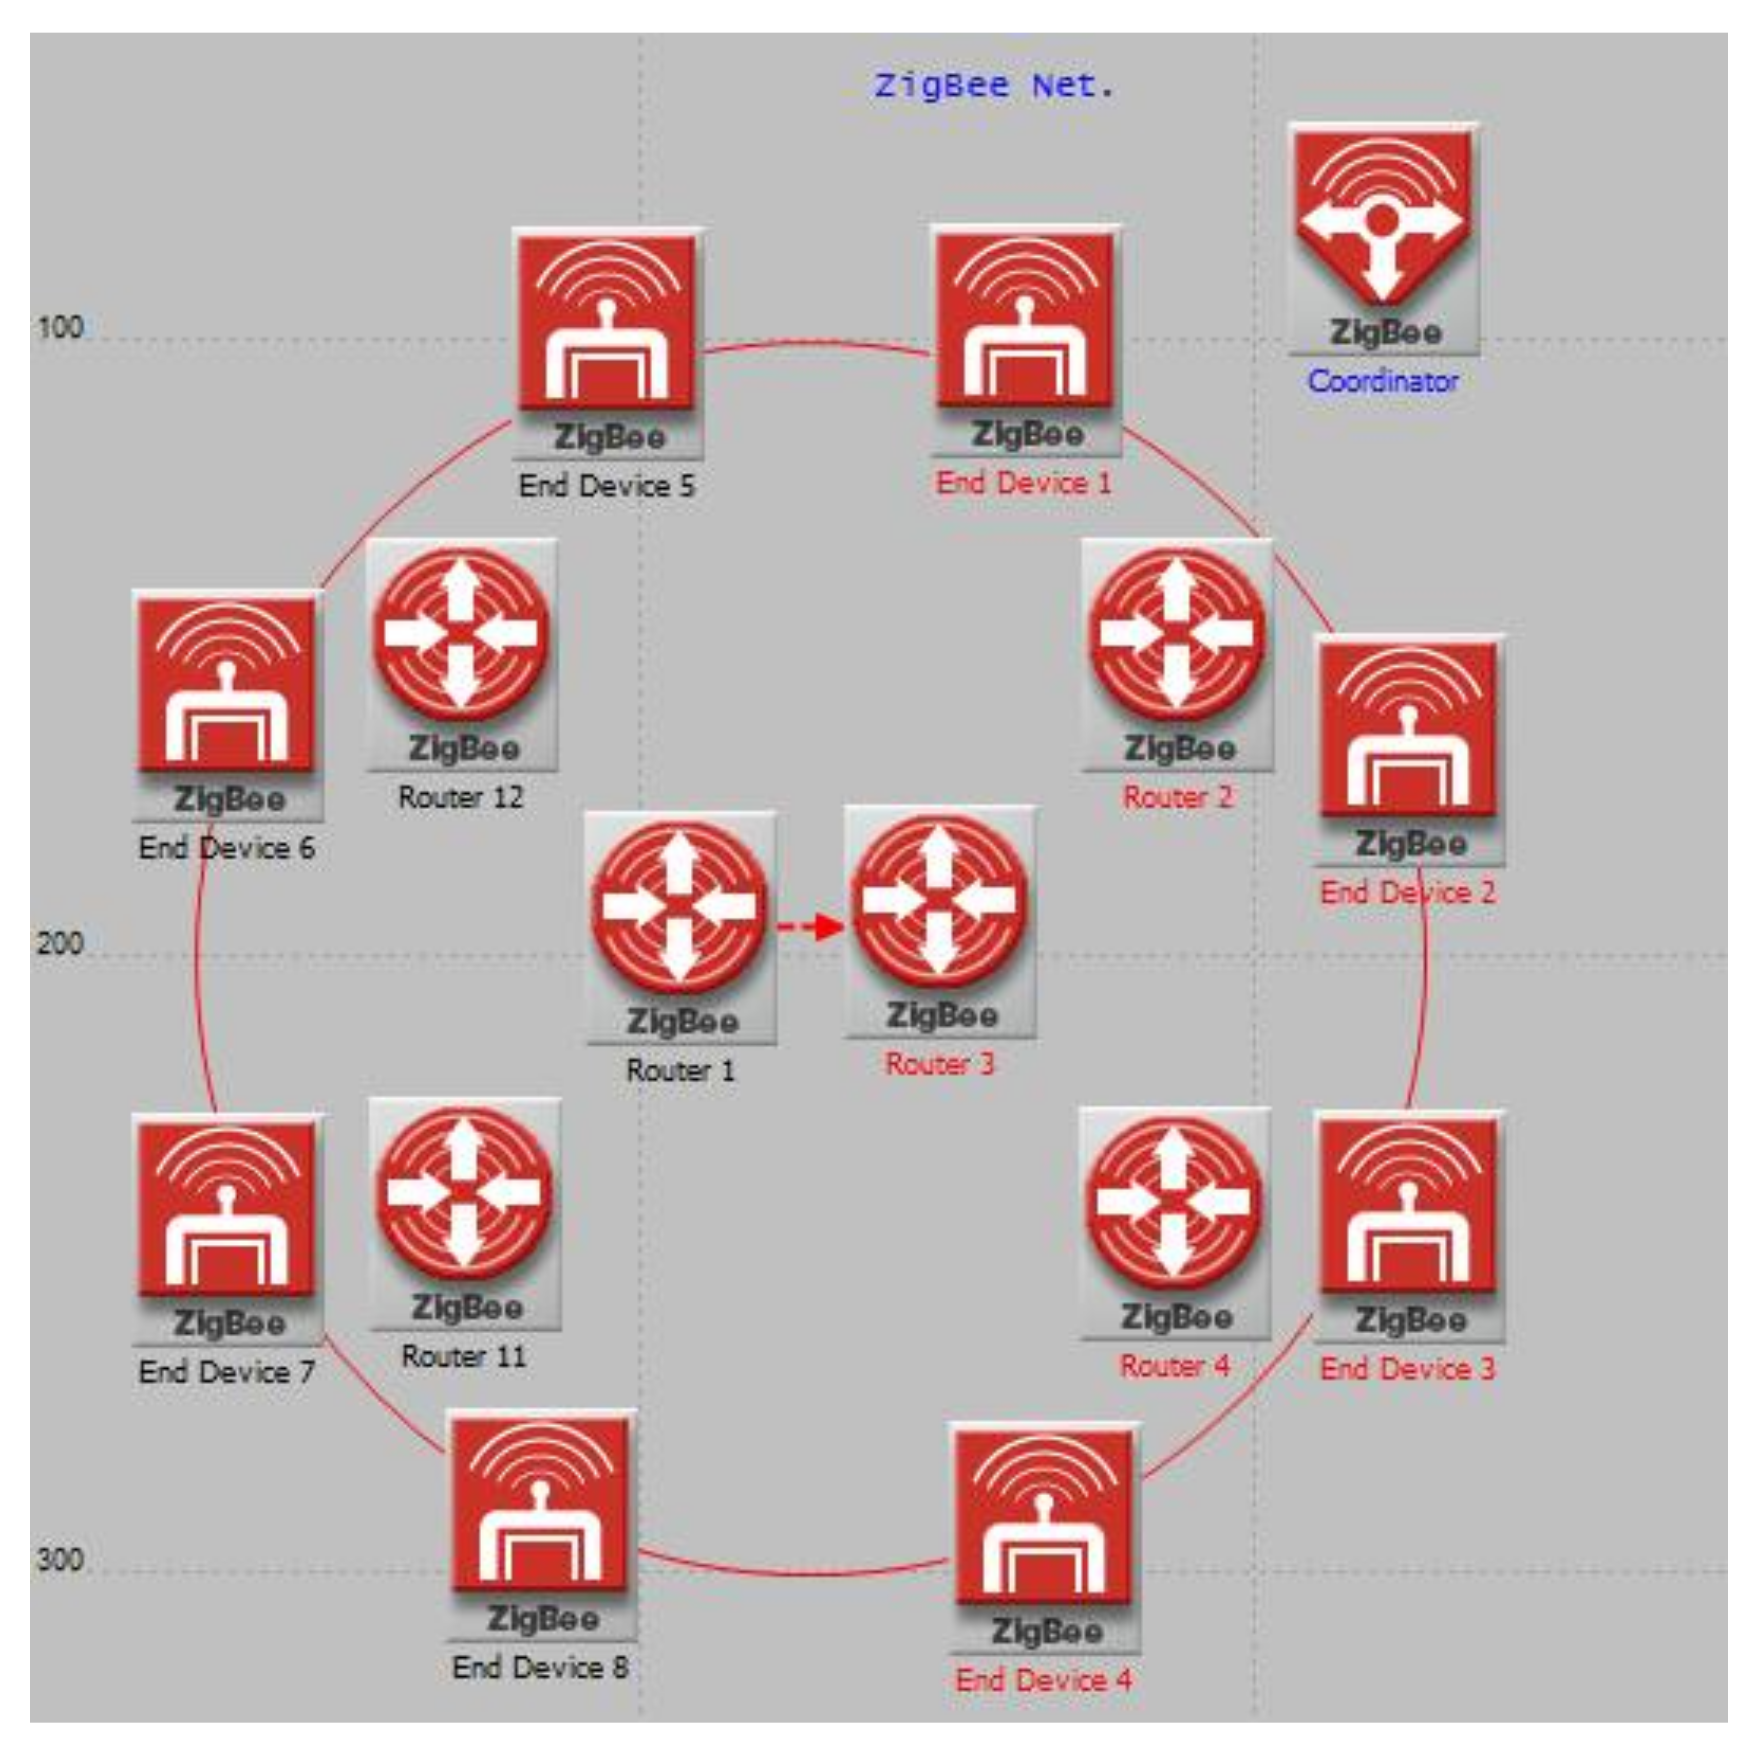
Figure 10.
End-device parameters.

Figure 11.
Router parameters.

Figure 12.
ZigBee coordinator parameters.
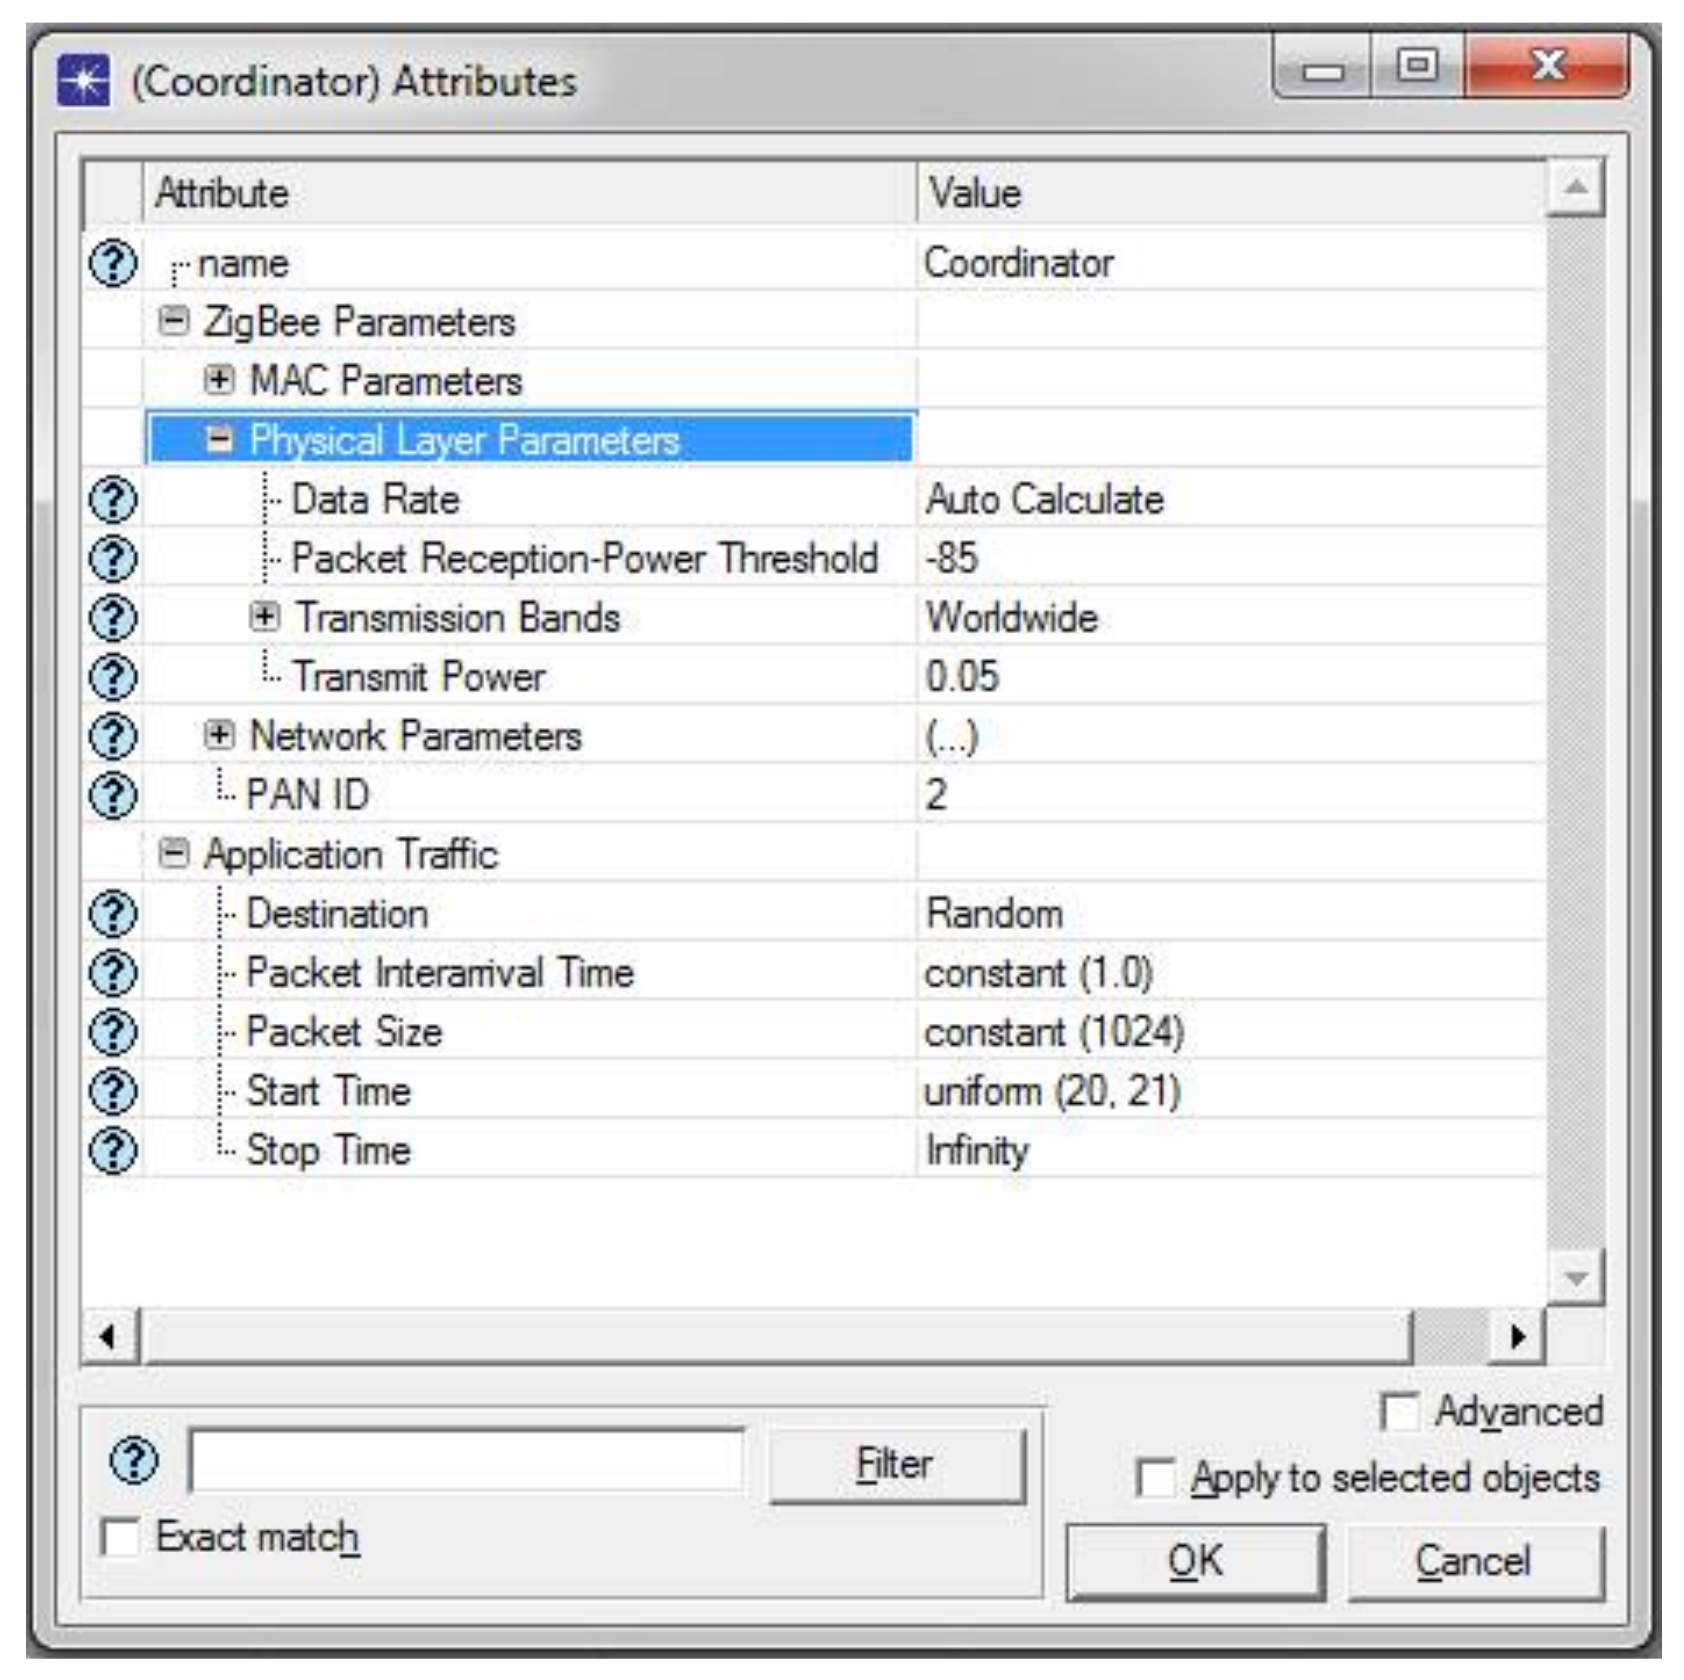
Figure 13.
Model of a Reverse Power Relay for Smart Villages.

Figure 14.
(a) Performance of input–output power; and (b) relay status.

Figure 15.
(a) Performance of the input–output power and (b) relay status.
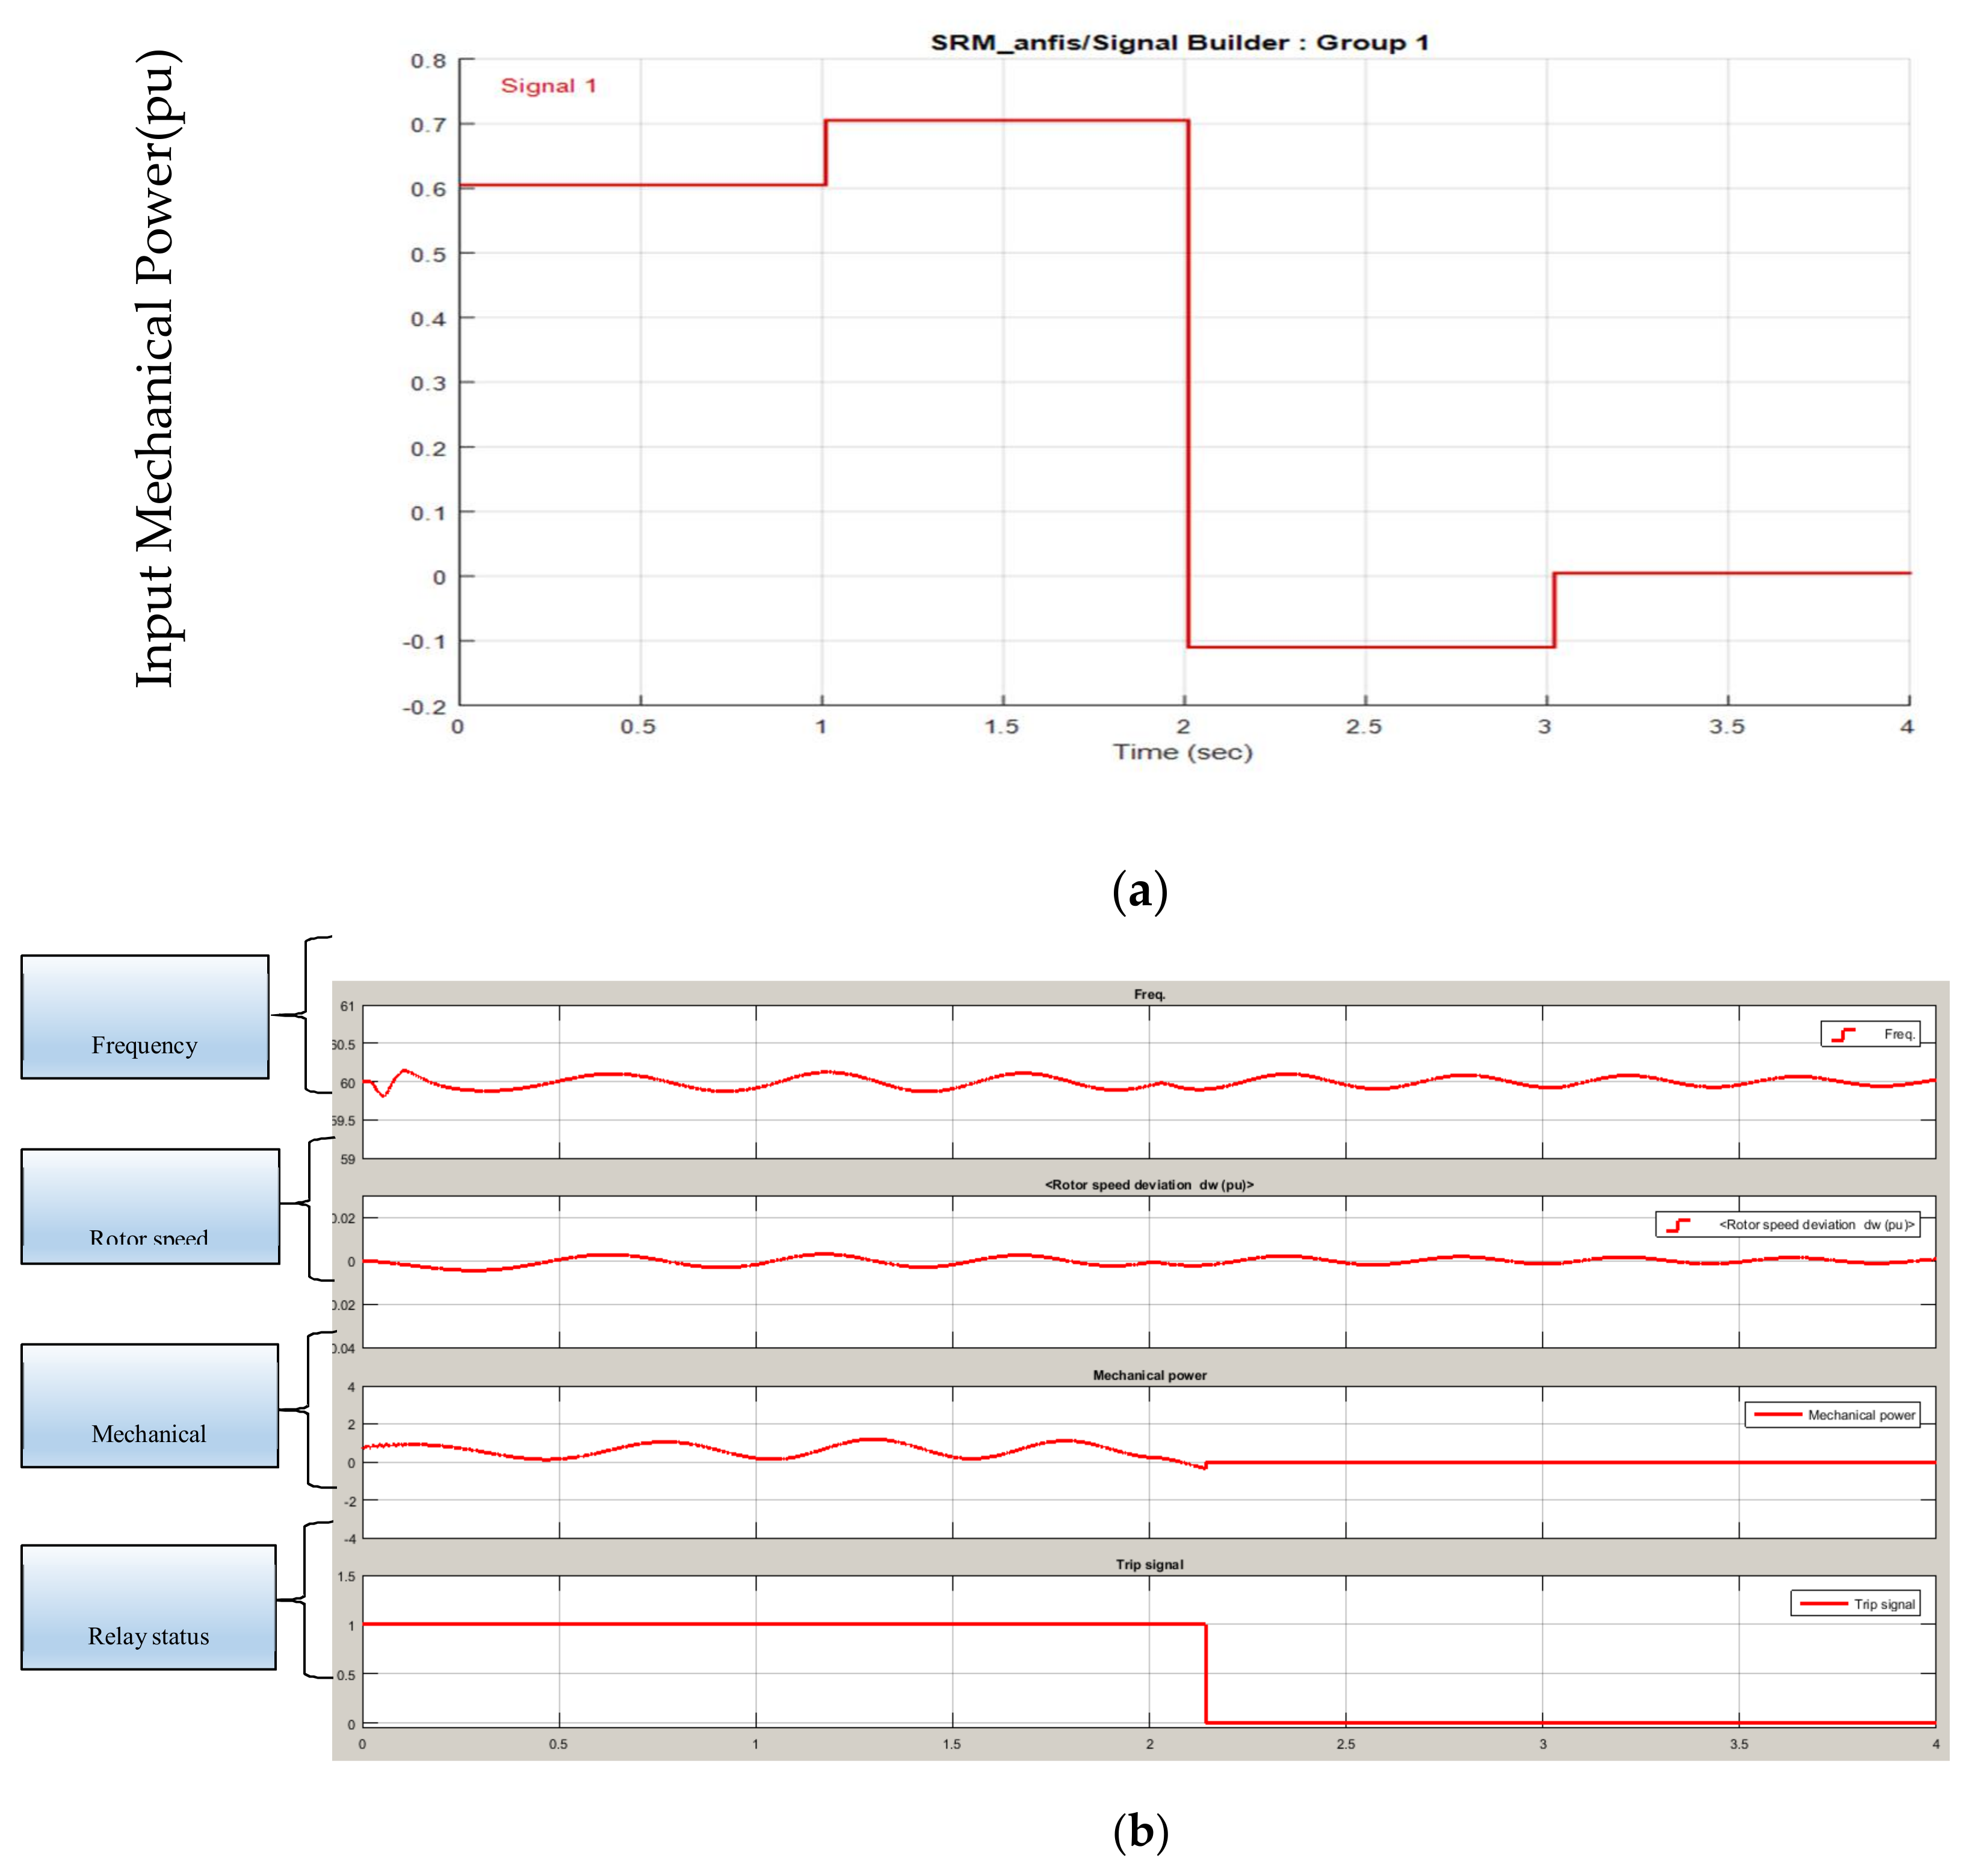
Figure 16.
Throughput case.

Figure 17.
Total number of data bits transmitted.

Figure 18.
Data traffic received.

Figure 19.
Rate of data arrival compared to delay.

Figure 20.
Simulation scenario against a MAC load.

Table 1.
Smart Grid Infrastructure.
| Current Grid | Smart Grid | |
|---|---|---|
| Topology | Radial | Network |
| Optimizes assets and operates efficiently | Minimal integration of limited operational data with Asset Management processes and technologies. | Grid technologies deeply integrated with asset management processes to most effectively manage assets and costs. |
| Communication | None or One-way | Two-way |
| Power Supply Support | Centralized generation | Distributed generation |
| Power flow control | limited | Spared throughout |
| O&M | Manual monitoring | Remote monitoring |
| Restoration | Manual restoration | Self-healing |
| Resists attack | Failures and blackouts | Flexible for attack and natural disasters |
| Control | Limited | Pervasive |
| Meter Type | Electromechanical | Digital |
| Customer Interaction | Limited | Major |
Table 2.
Matrix representation of the fuzzy rules.
| Δe(t) | e(t) | |||||||
| NL | NM | NS | ZR | PS | PM | PL | ||
| NL | PL | PL | PM | PM | PS | PS | ZR | |
| NM | PL | PM | PM | PS | PS | ZR | NS | |
| NS | PM | PM | PS | PS | ZR | NS | NS | |
| ZR | PM | PS | PS | ZR | NS | NS | NM | |
| PS | PS | PS | ZR | NS | NS | NM | NM | |
| PM | PS | ZR | NS | NS | NM | NM | NL | |
| PL | ZR | NS | NS | NM | NM | NL | NL | |
Table 3.
Summary of the simulation parameters.
| Definition | Value |
|---|---|
| Test Zone (Radius) | ~100 m |
| Number of end devices | 8 |
| Number of routers | 6 |
| Number of coordinators | 1 |
| Mobility model | Random |
| Simulation duration | 1200 s |
© 2018 by the authors. Licensee MDPI, Basel, Switzerland. This article is an open access article distributed under the terms and conditions of the Creative Commons Attribution (CC BY) license (http://creativecommons.org/licenses/by/4.0/).
Share and Cite
MDPI and ACS Style
Hadi Abdulwahid, A.; Wang, S. A Novel Method of Protection to Prevent Reverse Power Flow Based on Neuro-Fuzzy Networks for Smart Grid. Sustainability 2018, 10, 1059. https://doi.org/10.3390/su10041059
AMA Style
Hadi Abdulwahid A, Wang S. A Novel Method of Protection to Prevent Reverse Power Flow Based on Neuro-Fuzzy Networks for Smart Grid. Sustainability. 2018; 10(4):1059. https://doi.org/10.3390/su10041059
Chicago/Turabian StyleHadi Abdulwahid, Ali, and Shaorong Wang. 2018. "A Novel Method of Protection to Prevent Reverse Power Flow Based on Neuro-Fuzzy Networks for Smart Grid" Sustainability 10, no. 4: 1059. https://doi.org/10.3390/su10041059
Note that from the first issue of 2016, this journal uses article numbers instead of page numbers. See further details here.