Carbon Footprints of Urban Residential Buildings: A Household Survey-Based Approach


1
Key Lab of Urban Environment and Health, Institute of Urban Environment, Chinese Academy of Sciences, 1799, Jimei Road, Xiamen 361021, China
2
University of Chinese Academy of Sciences, Beijing 100049, China
3
Xiamen Key Lab of Urban Metabolism, Institute of Urban Environment, Chinese Academy of Sciences, Xiamen 361021, China
*
Author to whom correspondence should be addressed.
Sustainability 2018, 10(4), 1131; https://doi.org/10.3390/su10041131
Submission received: 28 February 2018
/
Revised: 29 March 2018
/
Accepted: 5 April 2018
/
Published: 10 April 2018
Abstract
:With China’s rapid urbanization process, massive and extensive construction materials are aggregated as stock in urban areas. Understanding the carbon footprints of residential buildings is crucial for achieving the goal of low-carbon cities. In this study, to reveal the emission characteristics of residential buildings regarding carbon footprint, stratified random sampling was developed, and a face-to-face questionnaire was conducted, to obtain critical information on residential buildings and the socio-economic status of 1092 families from 46 communities in Xiamen City, China. The community buildings’ structures were identified, and carbon emissions from the residential buildings were quantified based on analysis of the entire building life cycle. The building life cycle can be divided into six stages: extraction and production; transportation; construction; operation; demolition; and recycling. The household carbon footprints ranged from 0.37 tCO2/year to 22.45 tCO2/year; the per capita carbon footprints ranged from 0.19 tCO2/year to 11.23 tCO2/year. Overall, for the 46 surveyed communities, the average household and per capita carbon footprints were 4.11 tCO2/year and 1.4 tCO2/year, respectively. The total carbon footprints of urban residential buildings were 4.86 MtCO2/year. Analysis of the extraction and production stage revealed that steel recycling could avoid almost 0.05 MtCO2/year. No significant correlations were found between energy use awareness and energy use. The findings can be used by Chinese energy policymakers to understand the views of various energy users, and to re-attune the efforts against these opinions and interests. However, we consider this study a start and not an end to the importance of gauging opinions on energy security from the population of energy users. Nonetheless, awareness campaigns through print and electronic media could be another tool for life cycle emissions reduction in building sector.

1. Introduction
China is playing an increasingly critical role in combating global climate change, generating the largest share of carbon dioxide (CO2) emissions [1]. Furthermore, China proposed to achieve peak CO2 emissions by 2030, and to lower carbon emission intensity (CEI) by 60–65% by 2030, at the Paris Climate Conference [2], which will result in GHG emission levels of roughly 12.8–14.3 GtCO2e in 2030, a 64–70% reduction of emissions intensity below 2005 levels [3]. Chinese urban residents, who constitute 53% of the Chinese population, produced 75% of the national household carbon footprints (HCFs) in 2012 [4], and future population growth is projected to be concentrated in cities [5]. HCFs are the greenhouse gas emissions required to produce, distribute and dispose of all household consumption for one year, including emissions resulting from all major economic sectors and services [6]. Housing is one of the three most important contributors to the environmental impacts of household consumption, together with food and mobility [7,8,9]. Buildings consume approximately 40% of the world’s energy resources, accounting for approximately 36% of CO2 emissions within the European Union [10,11]. In China, construction is the second largest source of energy-related carbon emissions [9,12]. Building construction and operation consume considerable global resources and have been beset with well-documented problems, especially impacts on the environment [10,13,14,15]. Accordingly, it has become imperative to find effective means of further lowering carbon emissions throughout the life cycle of buildings [16]. With China’s rapid urbanization process, massive and extensive construction materials are aggregated as housing stock in urban areas. Cities have become hot spots for consuming global energy and generating global carbon emissions [17,18,19], and are therefore playing an increasingly important role in implementing greenhouse gas (GHG) mitigation policies and actions [17,20,21,22,23]. Xiamen is one of China’s low-carbon pilot cities, dedicated to exploring the way toward a low-carbon transition, and buildings comprise one of the most important sectors needing attention [24].
Early research by Christopher Jones and Daniel M. Kammen, using U.S. national household survey data, suggested a relationship between HCFs and population density. Some studies have looked at the environmental impacts related to building energy usage [9,12,25,26,27,28,29,30], while other researchers have focused on energy-saving awareness and behaviors of apartment residents [12,31,32]. Still other researchers have quantified the environmental impacts of a single office building or dwelling throughout its life cycle [14,33], and one study analyzed the life cycle energy for residential buildings [13]. Several life cycle assessment (LCA) studies have been conducted to evaluate the emissions attributable to buildings [28,34]. The LCA methodology provides an account of resource use as well as environmental impacts [8,14]. Information at the national, county, city or even household level collectively allows policymakers to pronounce various mitigation or adaptation action plans; bottom-up information is deemed necessary for analyzing carbon footprints. However, earlier studies have been limited to analyzing a relatively small sample size, or lack of the combination with building carbon footprints and household socio-economic attributes, as well as energy-saving awareness, using LCA methodology.
Therefore, the goals of this study were to (1) create an inventory of the carbon footprints of urban residential buildings; (2) define the characteristics of households as they relate to the carbon footprints of residential buildings; and (3) investigate the relationships among energy use, residents’ energy-use awareness, and household carbon footprints. To achieve these goals, we conducted a household survey and calculated the carbon footprints of residential buildings using LCA methodology. Furthermore, we illustrated six categories associated with different socio-economic factors, and used correlation analysis to identify the relationship between energy-use awareness and household energy use.
2. Materials and Methods
This study comprises four steps: (1) designing, distributing, and conducting a face-to-face questionnaire survey; (2) data processing and analysis of the survey data, including normalizing the values and taking secondary data for comparison and calculation; (3) defining the system boundary and accounting methodology for building life cycle; (4) analyzing the carbon footprints at different levels, and carbon footprints with household socio-economic attributes and energy-saving awareness, as shown in Figure 1. For analysis, we used ArcGIS 10.0 software to draw the simple sites and the distribution of household carbon footprints at community level (Figure 2); Microsoft Excel 2016 to plot the carbon emissions of buildings’ different stages; and e!Sankey 3.0 software to plot the carbon flows and material flows across the stages of building life cycle; and SPSS 22.0 to analyzing the Spearman’s rho correlations of energy-saving awareness. The carbon footprints excluding the operational stage were calculated by the emission factor, which was in per unit area of apartments. This increased the risk of the inaccuracy of embodied emissions of the buildings’ life cycle.
2.1. Study Area
Xiamen is a municipality and a major city situated on the southeast coast of China (118°04′04′′ E by 24°26′46′′ N), with an area of 1699.39 km2 [35]. In 2015, the urbanization level of Xiamen City was 89%, and the built-up area and household area of Xiamen were 317.10 km2 and 85.62 km2, respectively. The residential population expanded to 3.86 million in 2015, up from 2.23 million in 2005, with 2.73 people per household [36,37], and the per capita apartment area of Xiamen was 28.43 square meters (m2) in 2015, up from 21.36 m2 in 2005 [36,37]. Rapid economic growth and urbanization have resulted in rising energy consumption in Xiamen City, and its total energy consumption reached 10.7696 million tce (tons of coal equivalents) in 2010, with an energy consumption intensity of 0.569 tce/104 yuan [38]. In the past four years, almost 95,574 residential apartments have been built in Xiamen City.
2.2. Survey Design and Data Collection
A questionnaire was developed through the “alternatives, discussion modification, pre-survey, feedback adjustment” chain of processes. Given the heterogeneous spatial demographics of households and residential communities, we applied the stratified random sampling method to select 46 communities to obtain the necessary information on residential buildings and the socio-economic status of 1150 households. This method takes into account the spatial distribution characteristics of the object, and its principle is to balance the cost of sampling with the desired sampling precision, depending on study objectives and spatial variation [39,40]. The questionnaire consisted of three components: necessary information on buildings, household energy consumption and energy-saving awareness of residents. Additionally, face-to-face questionnaire surveys were conducted in October 2015. After screening 1150 face-to-face questionnaires, 1092 were identified to be valid for analysis.
We collected primary data from the surveys and secondary data from the literature. Data on the population and the per capita housing area of Xiamen City were taken from the Yearbook of the Xiamen Special Economic Zone (2016).
2.3. Calculation Methodology
A building life cycle can be divided into six stages: material extraction and production, transportation, construction, operation, demolition, and recycling [27,41]. The accounting methodology for residential buildings [24,41], and the Intergovernmental Panel on Climate Change (IPCC) guidelines were followed, in order to quantify the carbon footprints of urban residential buildings in Xiamen City. Only urban residential buildings were considered in this study. In the surveyed households, the percentages of buildings constructed of wood, wood-brick, masonry-concrete, and steel-concrete were 0.18%, 2.93%, 42.22%, and 54.67%, respectively (Figure S1), and the number of residential buildings for each of these types of structure were 2, 32, 461, and 597, respectively. We calculated only brick-concrete- and steel-concrete-structure buildings, including 1058 apartments, in Xiamen. In the study, housing was considered to be a durable consumable good with a lifespan of fifty years, as this is the maximum service life of residential housing regulated by the Ministry of Housing and Urban-Rural Development, People’s Republic of China [42].
2.3.1. Carbon Footprints from the Building Operational Stage
The carbon footprint from the building’s operational stage includes energy used (electricity and fuel) within the household for appliances and household activities, including cooking, lighting, heating, etc., and using various household appliances.
Because the electricity used in Xiamen City is not generated locally (the main source is electricity transferred from Fujian Province), this study used the average carbon emission factor of Fujian Province from 2010–2014; the specific data are shown in Table S2. The GHG emissions accounting of household electricity use can be determined by the following formula:
where EE is the GHG emissions from residential electricity per month; Ce is the amount of household electricity consumption per month; Ie is the emission factor of electricity, 0.6623 KgCO2/KWh; GHGn is the total carbon emissions from power generation in Fujian Province in year n, tCO2e; and Cn is the total grid generating capacity of Fujian Province in year n.
EE = Ce × Ie,
Ie = (∑ GHGn/Cn)/n,
The GHG emissions from fuel consumption were calculated using the following formula:
where EF is the GHG emissions from residential natural gas consumption per month; ACi is the amount of residential consumption in component i per month; NCVi is the average low calorific value for fuel I, MJ/t, km3; CCi is the carbon content of fuel i, tc/TJ; Oi is the oxidation rate of fuel i, (see Table S3); and 44/12 is the molecular weight ratio CO2/C.
EF = ∑ACi × NCVi × CCi × Oi × 44/12,
2.3.2. Carbon Footprints Excluding the Operational Stage
Carbon footprints of residential buildings from the stage of material extraction and production, transportation, construction, demolition, and recycling, excluding the operational stage, can be calculated as follows:
where CFi is the carbon footprint of the building structure i; Ai is the housing area of building structure i; EFi is the emissions factor of the building structure i (details in Table 1); and T is the lifespan of the buildings; we assumed the building life to be 50 years.
CFi = Ai × EFi × T−1,
3. Results
3.1. Household Distribution of Carbon Footprints
Figure 3 shows, on the left-hand side (a), the carbon footprint distribution of 1058 households in 46 communities of Xiamen City, and on the right-hand side (b), the per capita carbon footprints of the households and the household size. The carbon footprints of the surveyed 1058 households ranged from 0.37 tCO2/year to 22.45 tCO2/year, and 90% of the households ranged from 1.65 tCO2/year to 7.37 tCO2/year with per capita HCFs from 0.25 tCO2/year to 6.47 tCO2/year. The per capita carbon footprints ranged from 0.19 tCO2/year to 11.23 tCO2/year, and these show a different trend from the households’ carbon footprints because of the variations in household size (inset, Figure 3b). The mean value (4.11 tCO2/year) of HCFs was higher than the median value (3.74 tCO2/year), indicating that the number of households whose carbon footprint was below the average was greater than the number of households whose carbon footprint was above the average (Figure 3a). We broke down the HCFs to per capita emissions and per unit building area emissions. As shown in Figure 4, range of per capita HCFs of this study was within the world range, and the per unit buildings area emission was in the reasonable range. Compared with previous studies, we argue the range of HCFs is valid. Since the socio-economic attributes of 1058 household were entirely different among the surveyed households.
Among the ranked households, the household size (i.e., the number of household members) was distributed evenly and is shown above the graph, on the right-hand side of Figure 3b. We can see that three was the most common household size, followed by two and then four; there were 50 households of persons who lived alone, and 127 households consisted of more than four people. Overall, for the surveyed households, the largest CO2 emissions came from the operational stage, followed by the pre-operational stage, where extraction and production stages presented about 23.88% of HCFs, as shown in Figure S2. Meanwhile, the comparison of households ranked first five percent and last five percent shows that bigger household size and apartment area trigger larger carbon footprints, and the difference between households ranked first five percent and last five percent mainly sourced from the operational stage, details can be found in Figure S3. Obviously, the trends of the different stages, and the total emissions of all stages, varied, because of the socio-economic attributes varying among households, such as apartment structure, apartment area, and apartment type. We analyzed HCFs with different the socio-economic attributes in Section 3.3.
3.2. Urban Residential Building Carbon Footprints at the Community Level
At the community level, taking the average household and per capita carbon footprints of the surveyed households as the carbon footprints of the communities, the 46 surveyed communities were categorized into low-, medium-, and high-HCF communities (Figure 5). Among the high-HCFs communities, the per capita HCFs differed in obvious ways, while among the medium- and low-HCF communities, the per capita HCFs were almost uniform. Overall, for the 46 surveyed communities, the average carbon footprints of each household and the per capita footprints were 4.11 t/year and 1.4 t/year, respectively. Comparatively, the lowest-HCFs community was Xiayang, generating 1.8 t/year, and the highest-HCF community was Yecuo, generating 6.43 t/year. The average per capita carbon footprints of the communities ranged from 0.92 t/year (Ridong) to 2.24 t/year (Wuxing), further detail of communities can be found in Table S6. Overall, high-HCF communities were in the newer built-up areas, and low-HCF communities were in older built-up areas. The communities situated outside Xiamen Island occupy the higher end of the HCF spectrum, whereas the majority of the communities on Xiamen Island have a lower average HCF. Since older built-up areas, especially in Xiamen Island, were comprised mainly of old infrastructure, and style and size of residential buildings are comparatively older and smaller. We analyzed the relationship between HCFs and household socio-economic attributes, such as the age and area of apartments, in Section 3.3.
3.3. Carbon Footprints of Urban Residential Buildings with Different Socio-Economic Attributes
As shown in Figure 6, HCFs varied among households with different socio-economic attributes. The bigger the household size, the smaller its per capita carbon footprint. The equations in Figure 6b portray the trend of the relationship between per capita CF and household size, and equation y1 tends to show a higher per capita CF when the household members number more than five. Since there are very few data points on household size larger than six, we argue that the per capita carbon footprints have a negative relationship with household size. The HCFs of apartments lived in by two-, three- and a four-person are similar. Apartments lived in by two to four people usually have similar function/structure or area; the average area of two-, three- and a four-person apartment is 95 m2, 90 m2, 98 m2, respectively. HCFs have obvious positive relationships with household income level, while the per capita CFs show little difference among five income levels, because of larger household size higher income. Apartment area strongly affects both the household and the per capita carbon footprints: the larger apartments generate larger household carbon footprints, as shown in Figure 6a,c. The HCFs and per capita CFs differ regarding the apartments’ age, among the apartments built in the year of 1980–2010, the newer built apartments emitted more HCFs. Additionally, apartments built in the years 2001–2010 generating higher household and per capita CFs than either older or newer apartments.
Interestingly, the apartments built after 2010 emitted lower HCFs, which could be explained by the fact that because of the rapid increasing housing price, people are less likely to afford big apartment than before. In Xiamen City, more apartments are constructed of steel-concrete than of masonry-concrete. Apartments with steel-concrete structures generate larger carbon footprints than apartments with masonry-concrete structures. Since these two structure apartments required different materials, and the emissions from these different materials differed in their life cycles, especially in the operational and the extraction and production stages. Steel-concrete structure buildings need heavier materials, including steel, cement, and stone, which caused more CFs in the extraction and production stage and the transportation stage. The area of steel structure apartments is bigger overall, while per capita and per unit area of the operational CF of steel structure were lower comparatively (see Table S7). It is obvious that owner-built apartments generate larger carbon footprints than any of the other apartment types; this is because the area of apartments built by owner are largest among all types. These are followed by owner-occupied apartments, and there are many more of this type of apartment than of any other type; rented apartments generate the smallest carbon footprints.
3.4. Total Urban Residential Building Carbon Footprints in Xiamen City
We scaled up the average HCFs of the surveyed households to the city level based on the number of urban households and the per capita apartment area of urban residents. The total amount of building materials, the household energy use, and the carbon footprints of urban residential buildings were then calculated. Analysis revealed that the total carbon footprints of urban residential buildings were 4.86 MtCO2/year, mainly from the operational stage (75%) and the extraction and production stage (24%). The household energy use of buildings during the operational stage was 0.835 million tons of coal equivalent (Mtce/year), which included LPG (14%), natural gas (11%), coal (1%), and electricity (74%), as shown in Figure 7. Aggregate construction materials included cement, steel, sand, stones, wood, bricks, and glass, totaling about 214.5 Mt/year, and the materials generate more emissions in the pre-operational stage than in the post-operational stage. Furthermore, the transportation of materials in the pre-operational stage generates few emissions, because of the short distance that heavy materials are usually transported. Analysis revealed that steel recycling could reduce CO2 emissions from the extraction and production stage by almost 0.05Mt/year. In the post-operational stage, the total emissions were zero, because the amount of emissions reduced by recycling was equal to the amount of emissions produced by demolition, while the amount of the recycled materials was quite lower than materials sent to landfill. HCFs are mainly from the operational stage, and a lower amount of HCFs are from the post-operational stage. In fact, when it was considered at a city level, the amount of HCFs reduced by recycling of materials was significant.
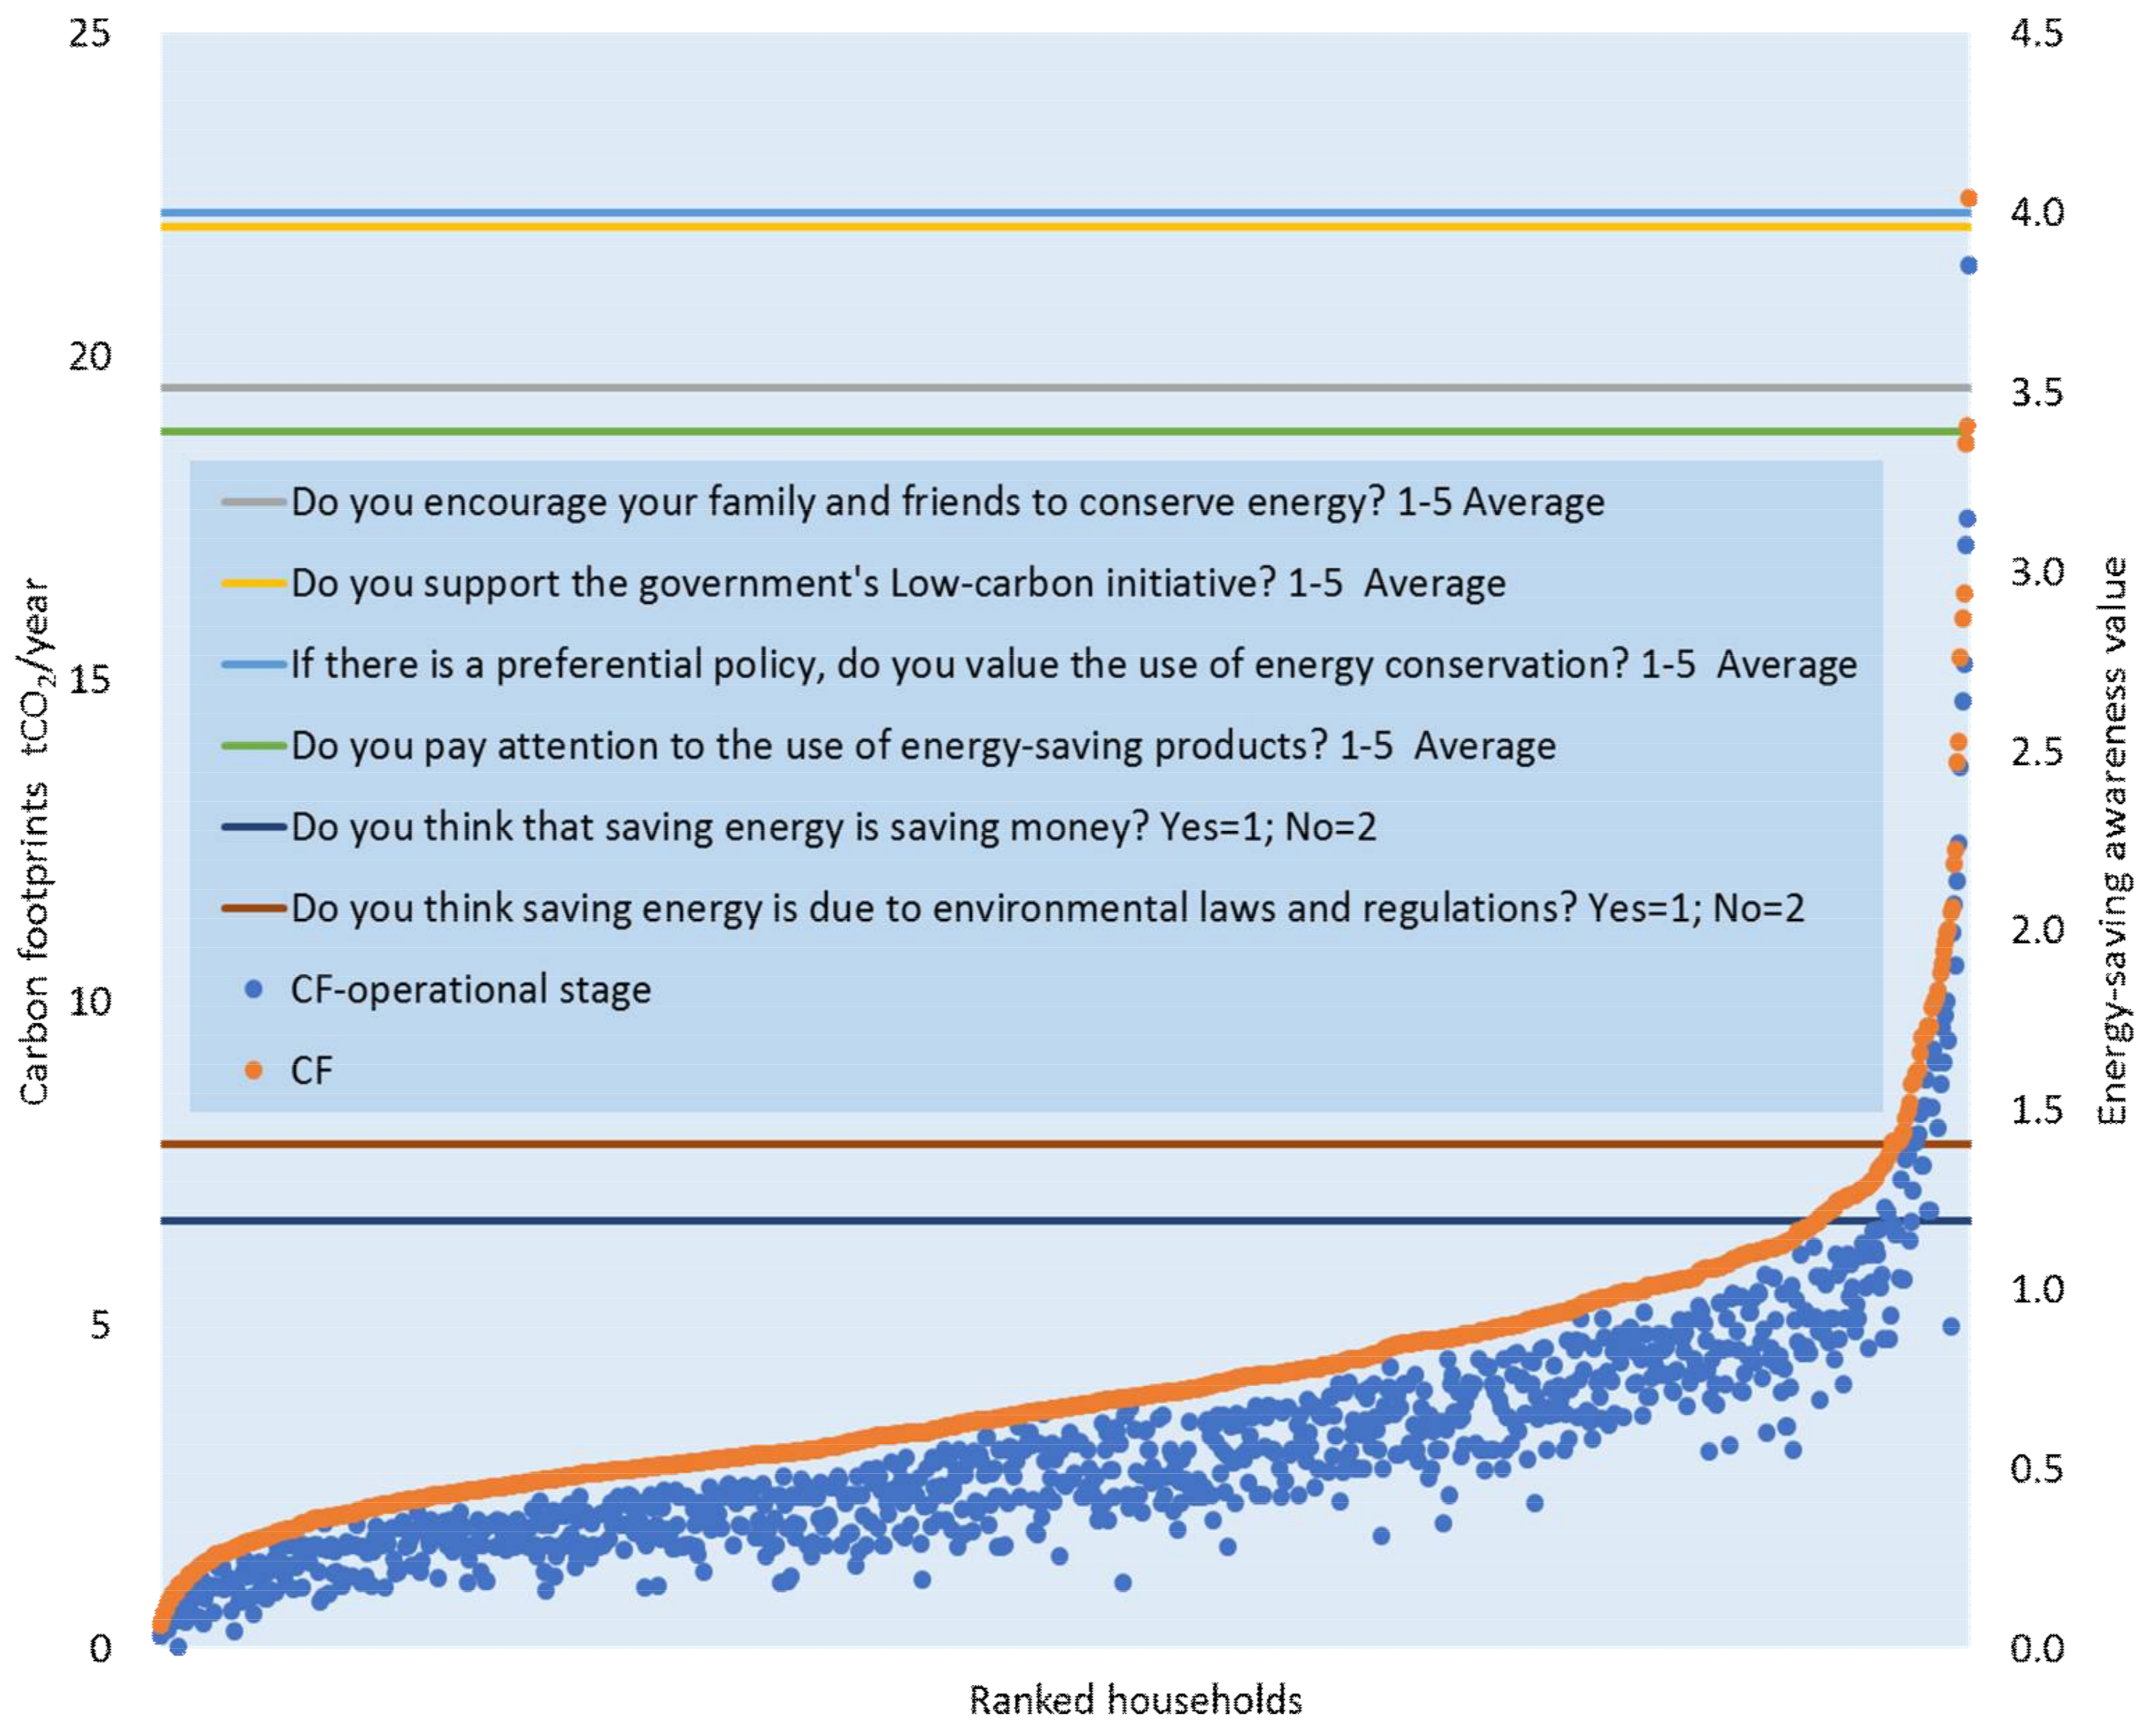
3.5. Energy Awareness
In this study, we analyzed energy-saving awareness, carbon footprints, and energy use, by using Spearman’s rho correlations. The detail of the energy-saving awareness can be found in Table S1. As shown in Figure 8, residents have high energy-saving awareness. Results revealed that residents have high willingness to support governmental initiatives, and they valued energy conservation when there were preferential policies rewarding it. Residents were also willing to encourage family and friends to save energy, but this willingness did not score as high as their support of governmental initiatives. Conclusively, energy-saving products were not noticed widely and valued highly when compared with other types of energy-saving awareness.
We found no significant correlation between energy-saving awareness and carbon footprints, or between energy use awareness and energy use, while carbon footprint and energy use showed a high correlation (Table 2). Significant correlations existed among the six types of energy-saving awareness. Residents valued energy-saving, and it had more correlations with others types of energy-saving awareness. The correlations between the willingness to support governments’ policy and the value of saving energy were comparatively high. This means that if the government introduces relevant energy conservation policies and preferential policies, residents will be very willing to save energy, which will be very effective in reducing HCFs.
Although residents demonstrated high energy-saving awareness and high willingness to support governmental initiatives, there was a gap between awareness and behavior. Previous studies have suggested that residents’ behavior is a critical factor contributing to energy consumption in buildings [43], and low-carbon behavior has the greatest impact on household carbon emissions [12], implying that the government could affect carbon footprints via environmental laws and regulations, and by encouraging people to save energy. Most importantly, energy-saving products represent the connection between residents’ energy-saving awareness and energy-saving policies. If the government increases the preferential rate of energy-saving products and promotes it, residents will be very willing to respond. If these measures are effectively conducted, they will shrink the gap between awareness and behavior. Since, for the most part, residents seemed to feel that energy conservation is due not only to laws and regulations but also to the consciousness and practice of residents.
4. Discussion
As observed in the above section, about 75% of the urban residential buildings’ carbon footprints were from the operational stage, where energy was consumed in lighting, cooking, heating, and so on. Previous studies have suggested that lowering energy consumption is the critical step in reducing carbon emissions from buildings, along with minimizing the dependence on fossil energy resources to supply the energy demand of the building stock [28,44,45]. An important finding of this study is that approximately 75% of the carbon footprints were from the operational stage, in which 0.835 Mtce energy was consumed annually. Therefore, this stage is the one with the most potential for emissions reduction. Interestingly, steel-concrete structure apartments emit more operational HCFs, while per capita and per unit area of the operational HCFs were lower compared to the masonry-concrete structure. In addition, building design and retrofitting, and the demolition and recycling stages of the building life cycle, should also be optimized for minimizing the energy use and carbon footprints in buildings [45], since the energy embodied in building materials is also significant [28,29].
The findings can be used by Chinese energy policymakers to understand the views of various energy users, and to re-attune the efforts against these opinions and interests. However, we consider this study a start and not an end to the importance of gauging opinions on energy security from the population of energy users, and we have pointed to the need to conduct a larger and more rigorous opinion survey to investigate some further questions. Further studies would be useful: for example, building a model that estimates the per capita demand and environmental impacts, considering the relevant household characteristics, to predict the future demand and environmental impacts of a new housing area, thereby building a benchmark for policymaker decisions, especially for carbon mitigation. Also, building sustainable energy systems for residential energy usage, including both rural and urban residences, and both single-family homes and apartments could provide a helpful pathway to realizing a transition to energy conservation. Such a project would need to include developing an inventory of China’s major cities and defining the energy-related characteristics for each. We found that the per capita floor area for apartment residents is one of the key elements influencing building carbon footprints, and for Xiamen City, this area is obviously relatively lower than for most the other major cities in China, except for Shanghai, as we illustrate in Figure S4.
5. Conclusions
In this study, life cycle assessment method was used to estimate the carbon footprints of urban residential buildings in Xiamen City. With a growing population and a rise in economic activities, Xiamen City is expanding as never before. It was found that the bigger the household size and apartment area, the higher the carbon footprints. Owner-built apartments, with the largest area among apartment types, generated more carbon footprints than any other apartment type. Apartments constructed with steel-concrete generated more carbon footprints than those constructed with masonry-concrete in overall lifespan while its per unit area of carbon footprints during the operational stage was lower than masonry-concrete structure. The operational stage was found to generate 75% of an urban residential building’s carbon footprint, and during this stage, electricity represented 74% of the mass-energy use. Household electricity consumption is usually for household appliances such as television, refrigerator and heater.
According to the results, most residents had high energy-saving awareness during the operational stage of a building’s life cycle, but a vast gap exists between energy use awareness and energy use, i.e., knowledge versus practice. People are well aware of energy-saving tactics and benefits; however, they have not adjusted their daily activities as per their awareness. Energy-saving products (e.g., household appliances) are gap bridges between governments’ encouragement strategies and residents’ low-carbon practice. Local policymakers should pay more attention to carbon reduction of owner-built buildings, which are common in the relatively newer communities. These areas are attracting people to reside in, and new buildings are being built there. Measures controlling the apartment area according to the household size are one way to reduce carbon emissions in residential buildings. Moreover, recycling of steel could reduce HCFs in the post-operational stage. Government stakeholders should pay more attention to the recycling of material, especially in the steel-concrete-structure buildings, and household energy consumption. Awareness campaigns through print and electronic media could be another tool for life cycle emissions reduction in building sector. For any desired future, reliable political targets and regulations will be important to permit optimal investment decisions when technologies are implemented and scaled up. The findings can be used by Chinese energy policymakers to understand the views of various energy users, and to re-attune the efforts against these opinions and interests. However, we consider this study a start and not an end to the importance of gauging opinions on energy security from the population of energy users, and we have pointed to the need to conduct a larger and more rigorous opinion survey to investigate some further questions.
Supplementary Materials
The following are available online at https://www.mdpi.com/2071-1050/10/4/1131/s1, Table S1: Standards for transforming qualitative variables into ordinal variables, Table S2: Average carbon emission factors of Fujian Province grid from 2010 to 2014, Table S3: Oxidation rates of fuel types, Table S4: Comparison by per capita CO2 emissions, Table S5: Comparison of carbon footprints of building life cycle with other case studies, Table S6: Community ID, Table S7: Operational CF of steel- and masonry-concrete structure, Figure S1: Urban residential building structure types in Xiamen City, Figure S2: Percentage carbon footprint distribution of six stages, Figure S3: (a) The socio-economic attributes of households ranked first 5% and last 5%; (b) Per household and per capita carbon footprints of households ranked first 5% and last 5%, Figure S4: Per capita apartment areas for major cities in China.
Acknowledgments
This study was supported by the National Natural Science Foundation of China (41371205 and 41661144032), the National Key Research and Development Program of China (2017YFC0506600), PIFI project of CAS (No. 2017PC0074), and the Bureau of International Co-operation, Chinese Academy of Sciences (132C35KYSB20150005).
Author Contributions
Xiaomei Yan conducted the life cycle assessment, created the research design, calculated the carbon footprints, analyzed the data, and wrote the paper. Shenghui Cui developed the questionnaire, conducted the survey and established the research frame; Lilai Xu participated in conducting the survey and calculated the carbon footprints of operation stage; Jianyi Lin contributed materials/analysis tools, and participated in analyzing the data and writing the paper; Ghaffar Ali participated in analyzing the data and writing the paper. All authors participated in all stages of preparing the manuscript.
Conflicts of Interest
The authors declare no conflict of interest.
References
- Lin, J.; Kang, J.; Khann, N.; Shi, L.; Zhao, X.; Liao, J. Scenario Analysis of Urban GHG Peak and Mitigation Co-benefits: A Case Study of Xiamen City, China. J. Clean. Prod. 2017, 171, 972–983. [Google Scholar] [CrossRef]
- Dong, F.; Long, R.; Yu, B.; Wang, Y.; Li, J.; Wang, Y.; Dai, Y.; Yang, Q.; Chen, H. How can China allocate CO2 reduction targets at the provincial level considering both equity and efficiency Evidence from its Copenhagen Accord pledge. Resour. Conserv. Recycl. 2018, 130, 31–43. [Google Scholar] [CrossRef]
- Climate Action Tracker. Available online: http://www.climateactiontracker.org/countries/china.html (accessed on 6 November 2017).
- Feng, K.; Hubacek, K. Carbon implications of China’s urbanization. Energy Ecol. Environ. 2016, 1, 39–44. [Google Scholar] [CrossRef]
- Wiedenhofer, D.; Guan, D.; Liu, Z.; Meng, J.; Zhang, N.; Wei, Y.M. Unequal household carbon footprints in China. Nat. Clim. Chang. 2017, 7, 75–80. [Google Scholar] [CrossRef]
- Jones, C.; Kammen, D.M. Spatial distribution of U.S. household carbon footprints reveals suburbanization undermines greenhouse gas benefits of urban population density. Environ. Sci. Technol. 2014, 48, 895–902. [Google Scholar] [CrossRef] [PubMed]
- Tukker, A.; Huppes, G.; Guinée, J.; Heijungs, R.; Koning, A.D.; Oers, L.V.; Suh, S.; Geerken, T.; Holderbeke, M.V.; Jansen, B.; et al. Report: Environmental Impact of Products; European Commission: Brussels, Belgium; Luxembourg, 2006. [Google Scholar]
- Saner, D.; Beretta, C.; Jäggi, B.; Juraske, R.; Stoessel, F.; Hellweg, S. FoodPrints of households. Int. J. Life Cycle Assess. 2015, 21, 654–663. [Google Scholar] [CrossRef]
- Ye, H.; Wang, K.; Zhao, X.; Chen, F.; Li, X.; Pan, L. Relationship between construction characteristics and carbon emissions from urban household operational energy usage. Energy Build. 2011, 43, 147–152. [Google Scholar] [CrossRef]
- Chau, C.K.; Hui, W.K.; Ng, W.Y.; Powell, G. Assessment of CO2 emissions reduction in high-rise concrete office buildings using different material use options. Resour. Conserv. Recycl. 2012, 61, 22–34. [Google Scholar] [CrossRef]
- Pal, S.K.; Takano, A.; Alanne, K.; Siren, K. A life cycle approach to optimizing carbon footprint and costs of a residential building. Build. Environ. 2017, 123, 146–162. [Google Scholar] [CrossRef]
- Ye, H.; Ren, Q.; Hu, X.; Lin, T.; Xu, L.; Li, X.; Zhang, G.; Shi, L.; Pan, B. Low-carbon behavior approaches for reducing direct carbon emissions: Household energy use in a coastal city. J. Clean. Prod. 2017, 141, 128–136. [Google Scholar] [CrossRef]
- Ding, G.; Forsythe, P.J. Sustainable construction: Life cycle energy analysis of construction on sloping sites for residential buildings. Constr. Manag. Econ. 2013, 31, 254–265. [Google Scholar] [CrossRef]
- Asif, M.; Muneer, T.; Kelley, R. Life cycle assessment: A case study of a dwelling home in Scotland. Build. Environ. 2007, 42, 1391–1394. [Google Scholar] [CrossRef]
- Ahn, C.; Lee, S.; Peña-Mora, F.; Abourizk, S. Toward Environmentally Sustainable Construction Processes: The U.S. and Canada’s Perspective on Energy Consumption and GHG/CAP Emissions. Sustainability 2010, 2, 354–370. [Google Scholar] [CrossRef]
- Zhang, X.; Wang, F. Life-cycle assessment and control measures for carbon emissions of typical buildings in China. Build. Environ. 2015, 86, 89–97. [Google Scholar] [CrossRef]
- Hu, Y.; Lin, J.; Cui, S.; Khanna, N.Z. Measuring Urban Carbon Footprint from Carbon Flows in the Global Supply Chain. Environ. Sci. Technol. 2016, 50, 6154–6163. [Google Scholar] [CrossRef] [PubMed]
- Creutzig, F.; Baiocchi, G.; Bierkandt, R.; Pichler, P.P.; Seto, K.C. Global typology of urban energy use and potentials for an urbanization mitigation wedge. Proc. Natl. Acad. Sci. USA 2015, 112, 6283–6288. [Google Scholar] [CrossRef] [PubMed]
- Lin, J.; Cao, B.; Cui, S.; Wang, W.; Bai, X. Evaluating the effectiveness of urban energy conservation and GHG mitigation measures: The case of Xiamen city, China. Energy Policy 2010, 38, 5123–5132. [Google Scholar] [CrossRef]
- Laine, J.; Ottelin, J.; Heinonen, J.; Junnila, S. Consequential Implications of Municipal Energy System on City Carbon Footprints. Sustainability 2017, 9, 1801. [Google Scholar] [CrossRef]
- Kennedy, C.; Ibrahim, N.; Hoornweg, D. Low-carbon infrastructure strategies for cities. Nat. Clim. Chang. 2014, 4, 343–346. [Google Scholar] [CrossRef]
- Duren, R.M.; Miller, C.E. Measuring the carbon emissions of megacities. Nat. Clim. Chang. 2012, 2, 560–562. [Google Scholar] [CrossRef]
- Grimm, N.B.; Faeth, S.H.; Golubiewski, N.E.; Redman, C.L.; Wu, J.B.X.; Briggs, J.M. Global change and the ecology of cities. Science 2008, 319, 756–760. [Google Scholar] [CrossRef] [PubMed]
- Huang, W.; Li, F.; Cui, S.; Li, F.; Huang, L.; Lin, J. Carbon Footprint and Carbon Emission Reduction of Urban Buildings: A Case in Xiamen City, China. Procedia Eng. 2017, 198, 1007–1017. [Google Scholar] [CrossRef]
- Li, B.; Yao, R. Urbanisation and its impact on building energy consumption and efficiency in China. Renew. Energy 2009, 34, 1994–1998. [Google Scholar] [CrossRef]
- Zhang, X.; Wang, F. Assessment of embodied carbon emissions for building construction in China: Comparative case studies using alternative methods. Energy Build. 2016, 130, 330–340. [Google Scholar] [CrossRef]
- Macias, J.; Iturburu, L.; Rodriguez, C.; Agdas, D.; Boero, A.; Soriano, G. Embodied and operational energy assessment of different construction methods employed on social interest dwellings in Ecuador. Energy Build. 2017, 151, 107–120. [Google Scholar] [CrossRef]
- Saner, D.; Vadenbo, C.; Steubing, B.; Hellweg, S. Regionalized LCA-based optimization of building energy supply: Method and case study for a Swiss municipality. Environ. Sci. Technol. 2014, 48, 7651–7659. [Google Scholar] [CrossRef] [PubMed]
- Ardente, F.; Beccali, M.; Cellura, M.; Mistretta, M. Energy and environmental benefits in public buildings as a result of retrofit actions. Renew. Sustain. Energy Rev. 2011, 15, 460–470. [Google Scholar] [CrossRef]
- Beccali, M.; Cellura, M.; Fontana, M.; Longo, S.; Mistretta, M. Energy retrofit of a single-family house: Life cycle net energy saving and environmental benefits. Renew. Sustain. Energy Rev. 2013, 27, 283–293. [Google Scholar] [CrossRef]
- Kang, N.N.; Cho, S.H.; Kim, J.T. The energy-saving effects of apartment residents’ awareness and behavior. Energy Build. 2012, 46, 112–122. [Google Scholar] [CrossRef]
- Guo, F.; Kurdgelashvili, L.; Bengtsson, M.; Akenji, L. Analysis of achievable residential energy-saving potential and its implications for effective policy interventions: A study of Xiamen city in southern China. Renew. Sustain. Energy Rev. 2016, 62, 507–520. [Google Scholar] [CrossRef]
- Junnila, S.; Horvath, A. Life-Cycle Environmental Effects of an Office Building. J. Infrastruct. Syst. 2003, 9, 157–166. [Google Scholar] [CrossRef]
- Iyer-Raniga, U.; Wong, J.P.C. Evaluation of whole life cycle assessment for heritage buildings in Australia. Build. Environ. 2012, 47, 138–149. [Google Scholar] [CrossRef]
- Kang, J.; Lin, J.; Zhao, X.; Zhao, S.; Kou, L. Decomposition of the Urban Water Footprint of Food Consumption: A Case Study of Xiamen City. Sustainability 2017, 9, 135. [Google Scholar] [CrossRef]
- Municipal Bureau of Statistics (XMBS). Yearbook of Xiamen Special Economic Zone; China Statistics Press: Beijing, China, 2006. Available online: http://www.stats-xm.gov.cn/2006/ (accessed on 31 January 2007).
- Municipal Bureau of Statistics (XMBS). Yearbook of Xiamen Special Economic Zone; China Statistics Press: Beijing, China, 2016. Available online: http://www.stats-xm.gov.cn/2016/ (accessed on 8 October 2016).
- Lin, J.; Hu, Y.; Cui, S.; Kang, J.; Ramaswami, A. Tracking urban carbon footprints from production and consumption perspectives. Environ. Res. Lett. 2015, 10, 054001. [Google Scholar] [CrossRef]
- Xiao, L.; Qiu, Q.; Gao, L. Chinese Housing Reform and Social Sustainability: Evidence from Post-Reform Home Ownership. Sustainability 2016, 8, 1053. [Google Scholar] [CrossRef]
- Gao, L.; Li, X.; Wang, G.; Qiu, Q.; Cui, S.; Zhao, Q. Survey Site Selection Based on the Spatial Sampling Theory—A Case Study in Xiamen Island. J. Geoinf. Sci. 2010, 2, 364–385. [Google Scholar] [CrossRef]
- Li, F.; Cui, S.; Gao, L.; Lin, J.; Yu, Y. Carbon Footprint Comparison of Residential Buildings between Brick and Concrete Structure and Shear Wall Structure in Xiamen City. Environ. Sci. Technol. 2012, 35, 18–22. (In Chinese) [Google Scholar]
- Ministry of Housing and Urban-Rural Development, P.C. Code for the Design of Civil Buildings; Ministry of Housing and Urban-Rural Development, P.C.: Beijing, China, 2005. [Google Scholar]
- Sun, K.; Hong, T. A framework for quantifying the impact of occupant behavior on energy savings of energy conservation measures. Energy Build. 2017, 146, 383–396. [Google Scholar] [CrossRef]
- Asdrubali, F.; Baldassarri, C.; Fthenakis, V. Life cycle analysis in the construction sector: Guiding the optimization of conventional Italian buildings. Energy Build. 2013, 64, 73–89. [Google Scholar] [CrossRef]
- Gustavsson, L.; Joelsson, A. Life cycle primary energy analysis of residential buildings. Energy Build. 2010, 42, 210–220. [Google Scholar] [CrossRef]
Figure 1.
Methodological framework to estimate carbon footprints of buildings’ life cycle stages. CF: carbon footprint.
Figure 1.
Methodological framework to estimate carbon footprints of buildings’ life cycle stages. CF: carbon footprint.
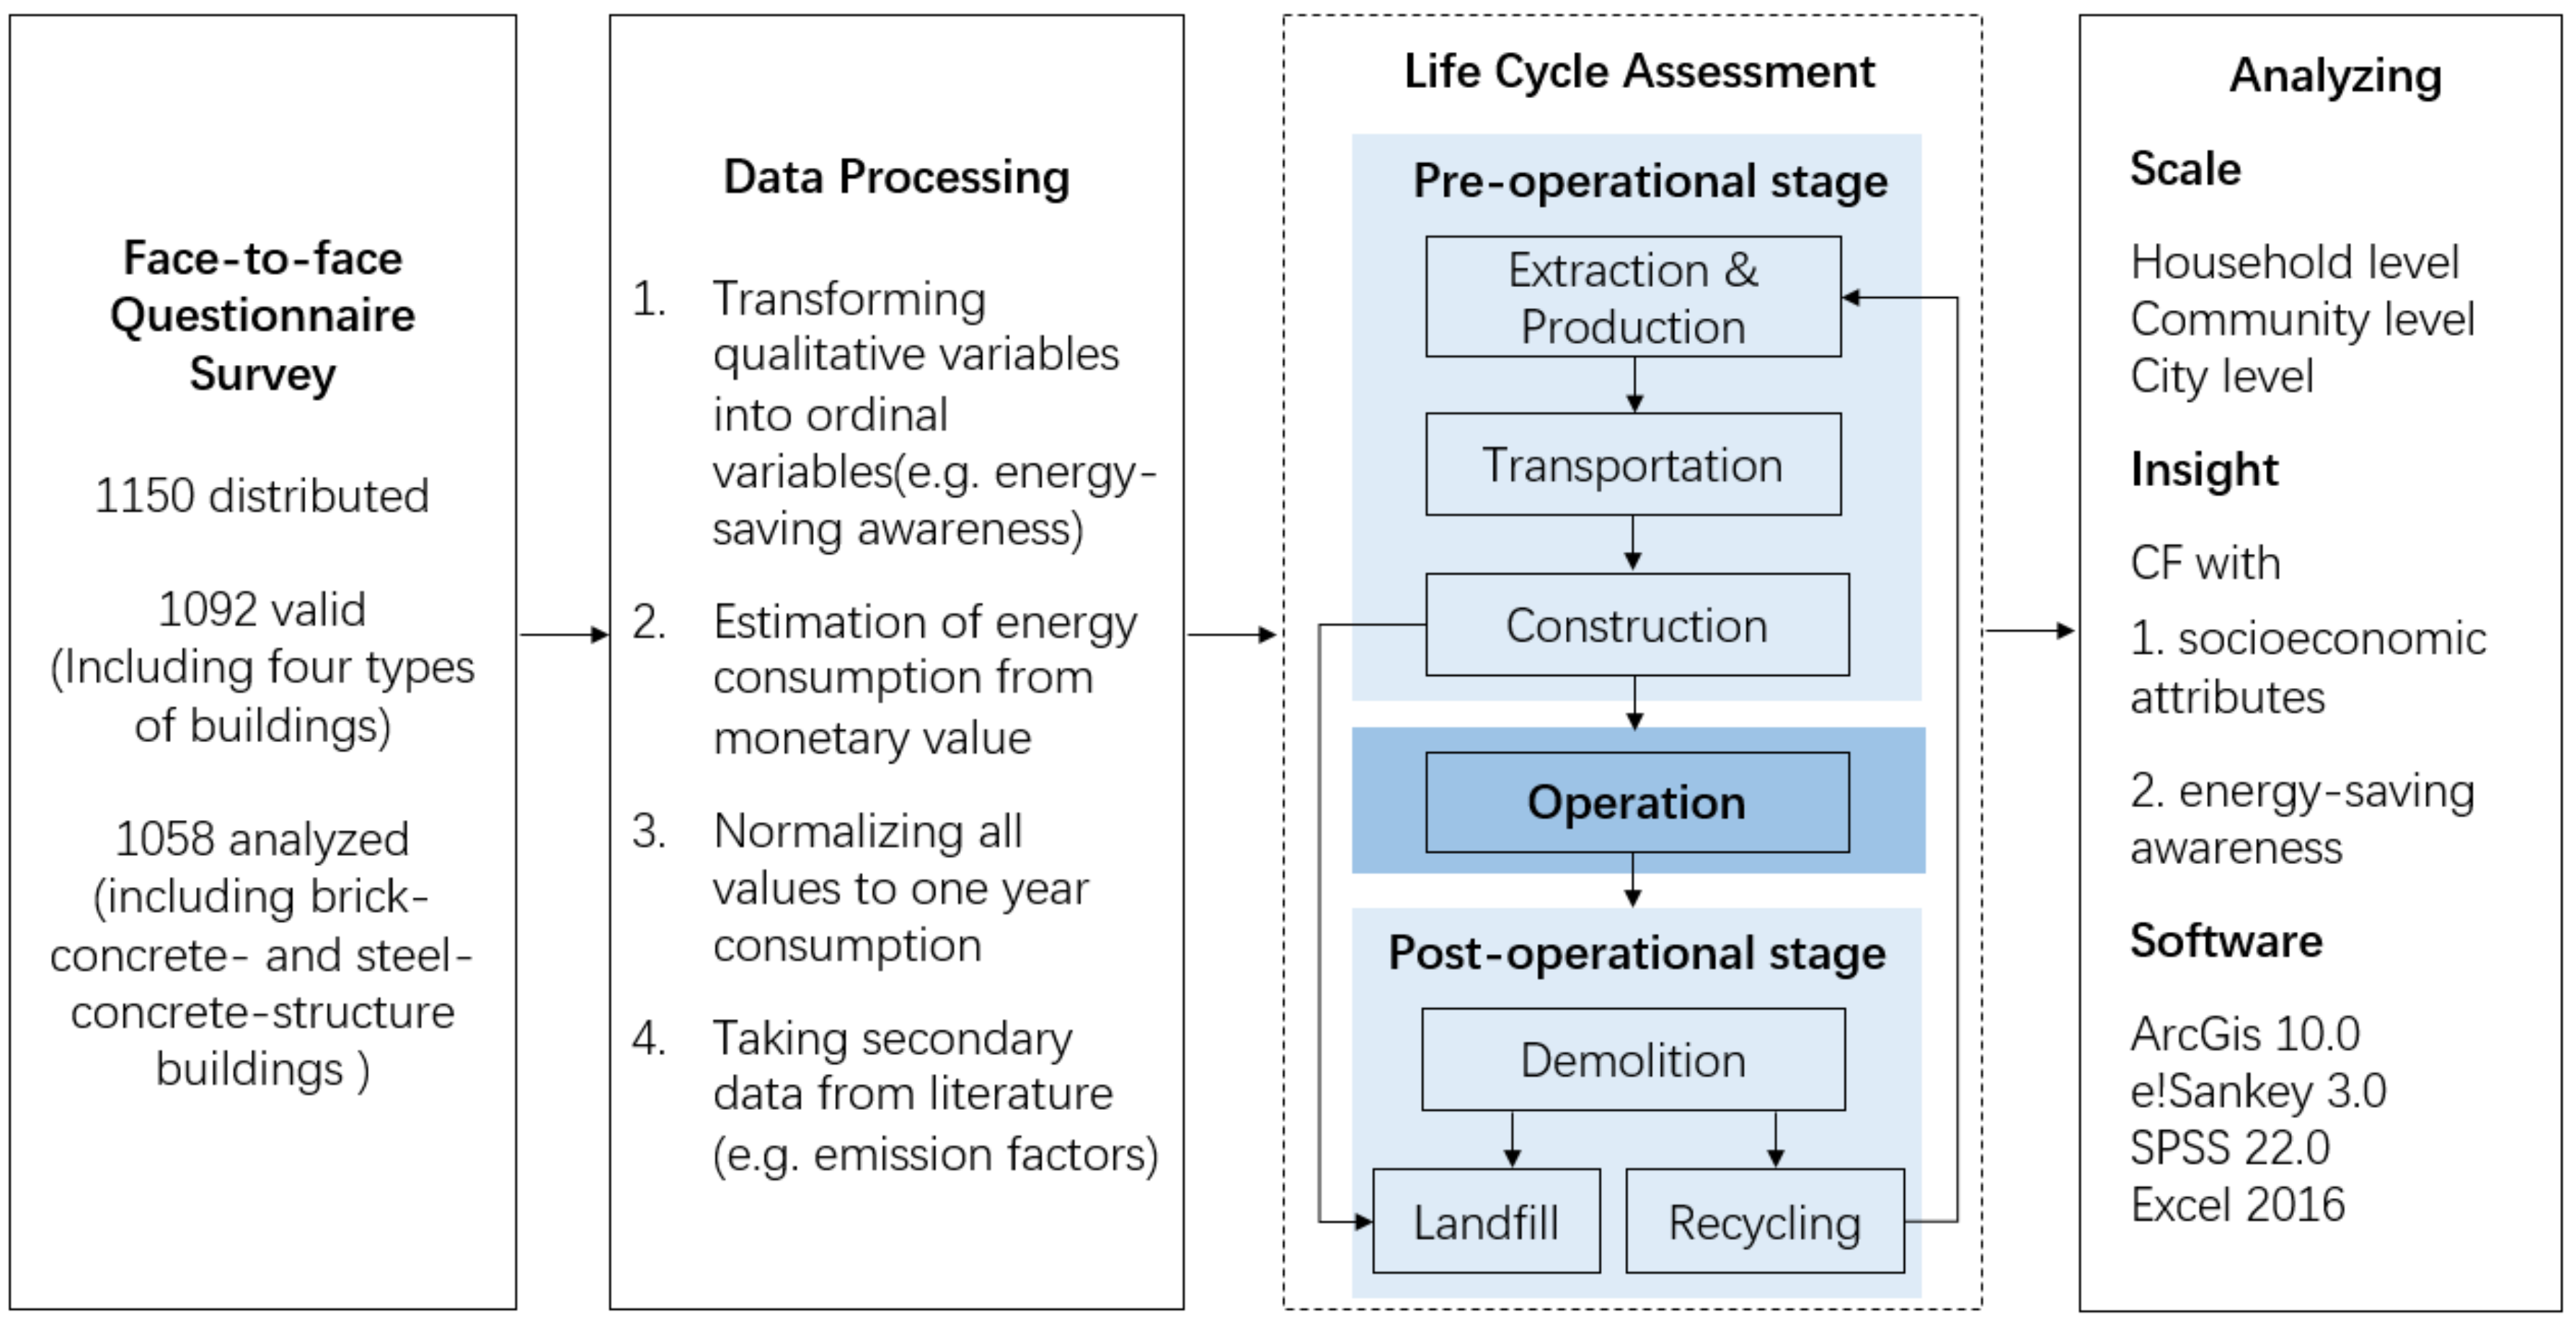
Figure 2.
Study area and sampling.
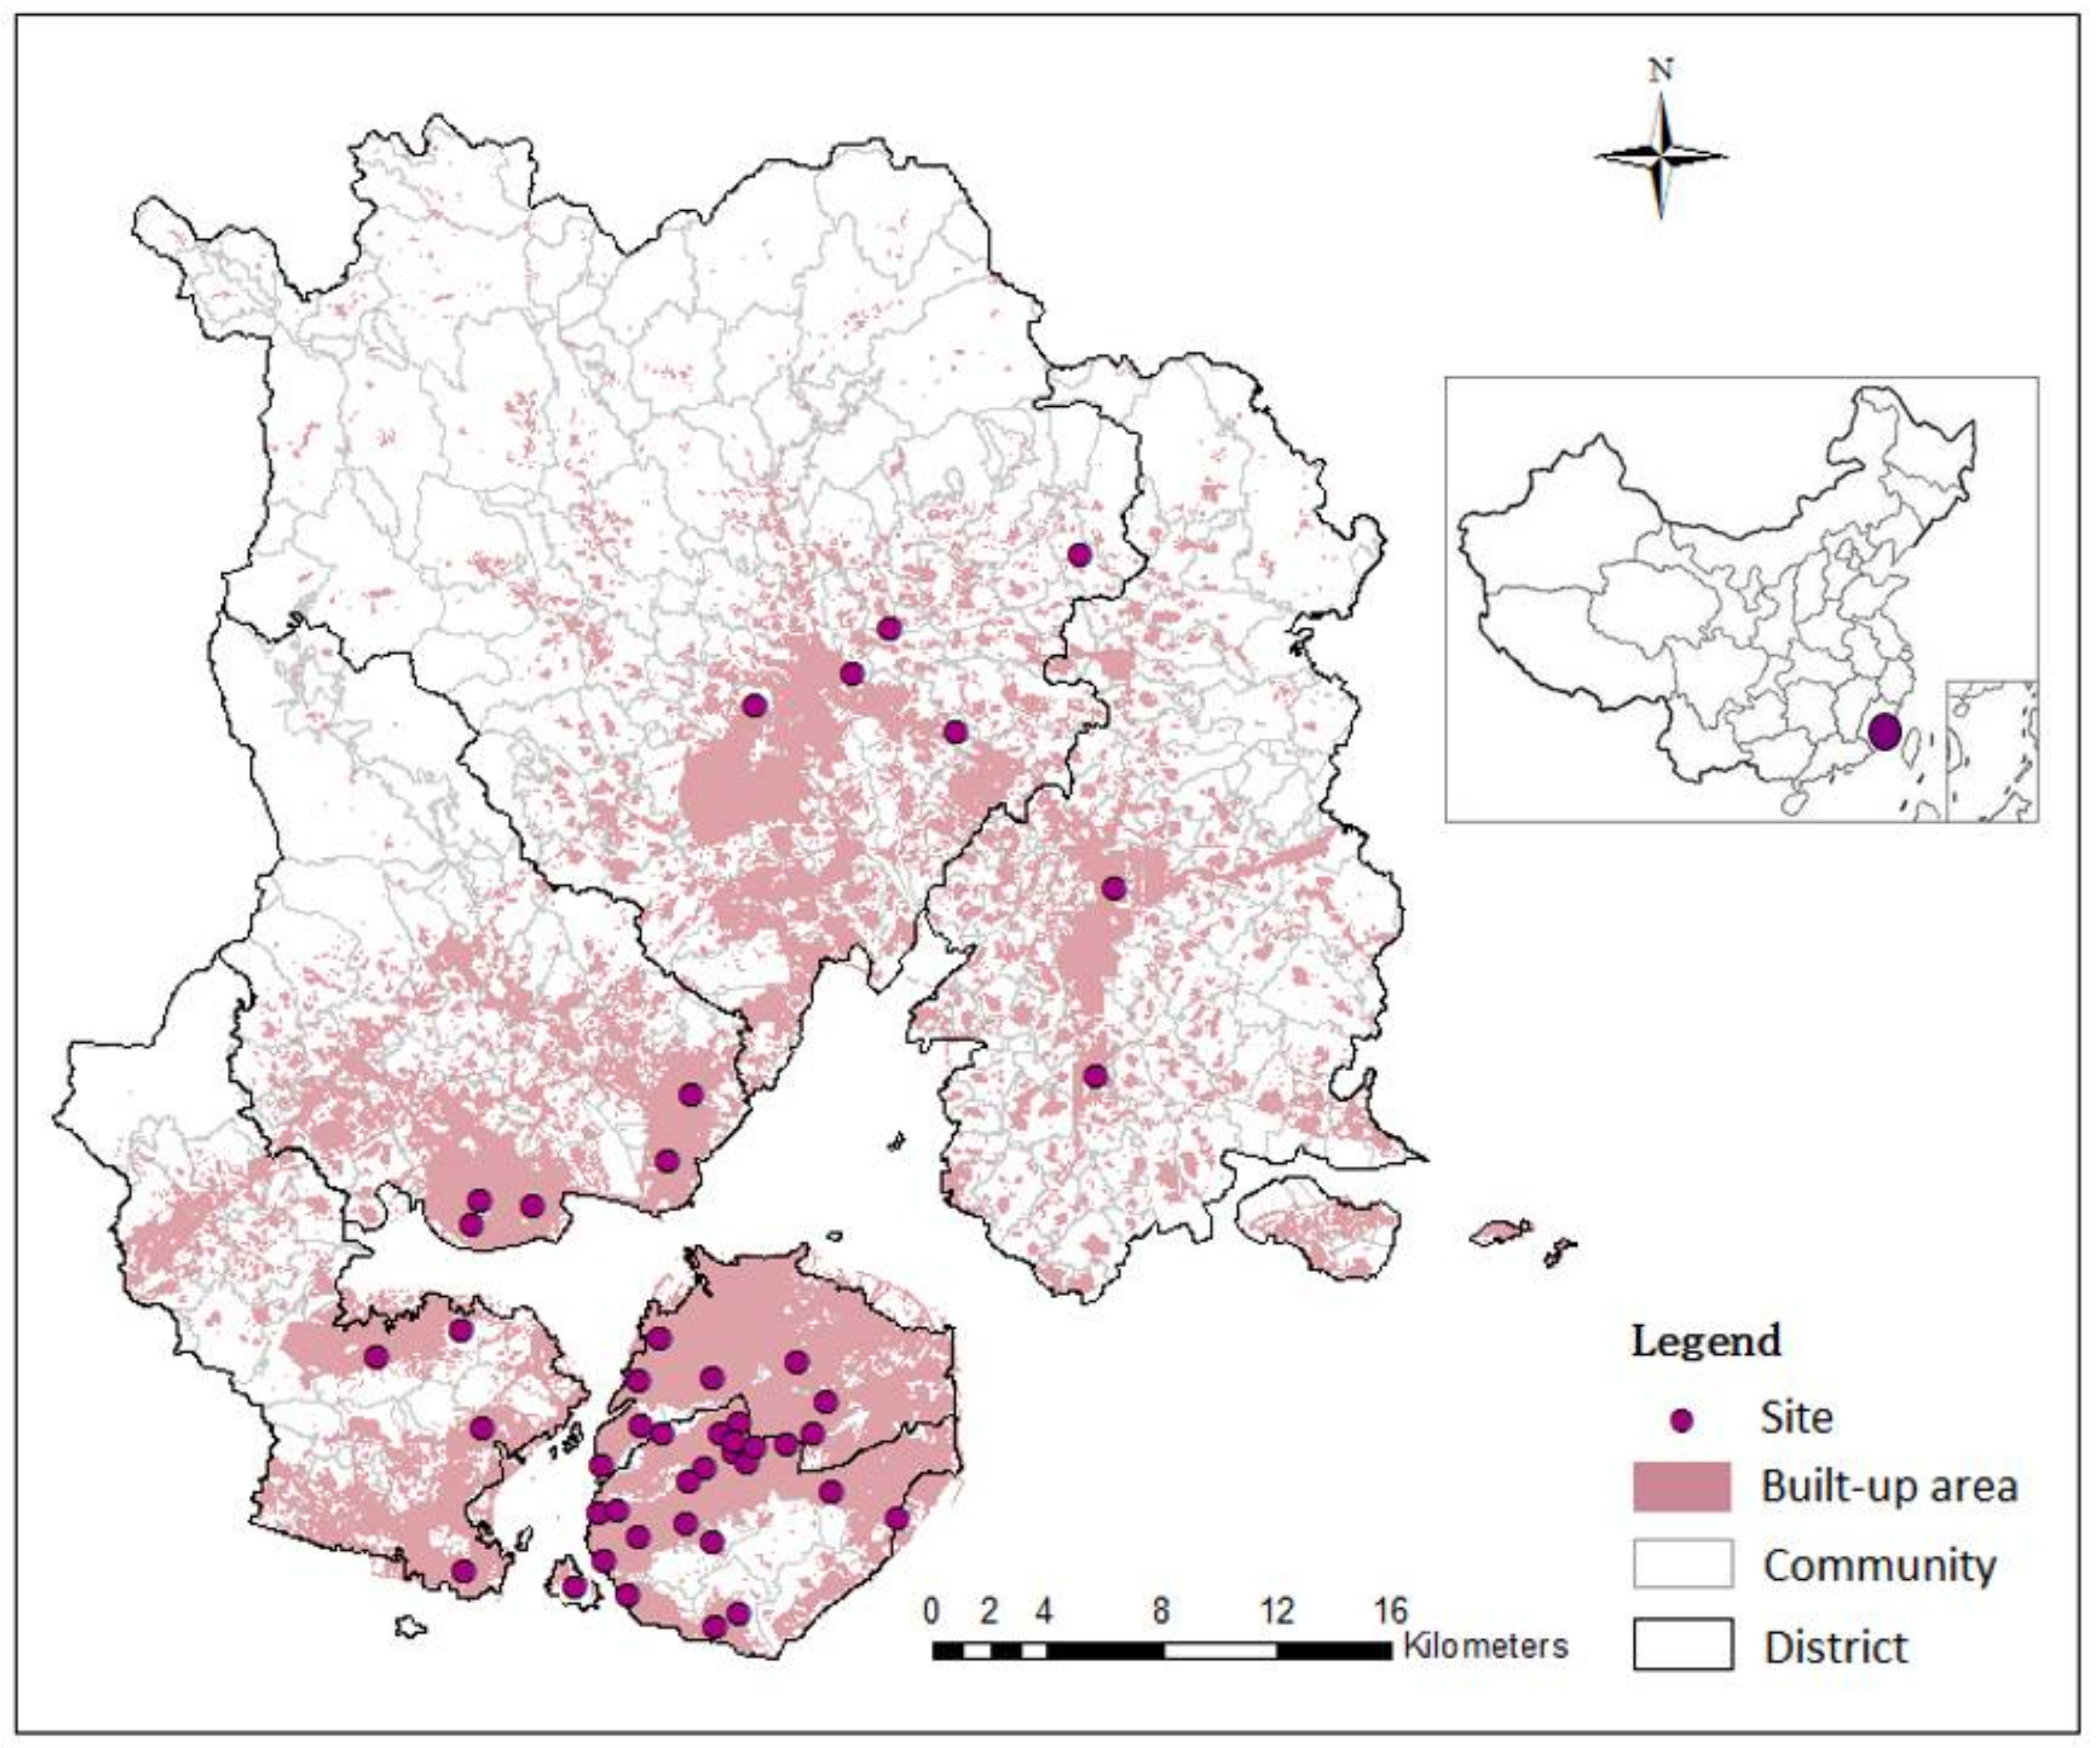
Figure 3.
(a) Household carbon footprints of urban residential buildings; (b) Per capita carbon footprints of urban residential buildings.
Figure 3.
(a) Household carbon footprints of urban residential buildings; (b) Per capita carbon footprints of urban residential buildings.
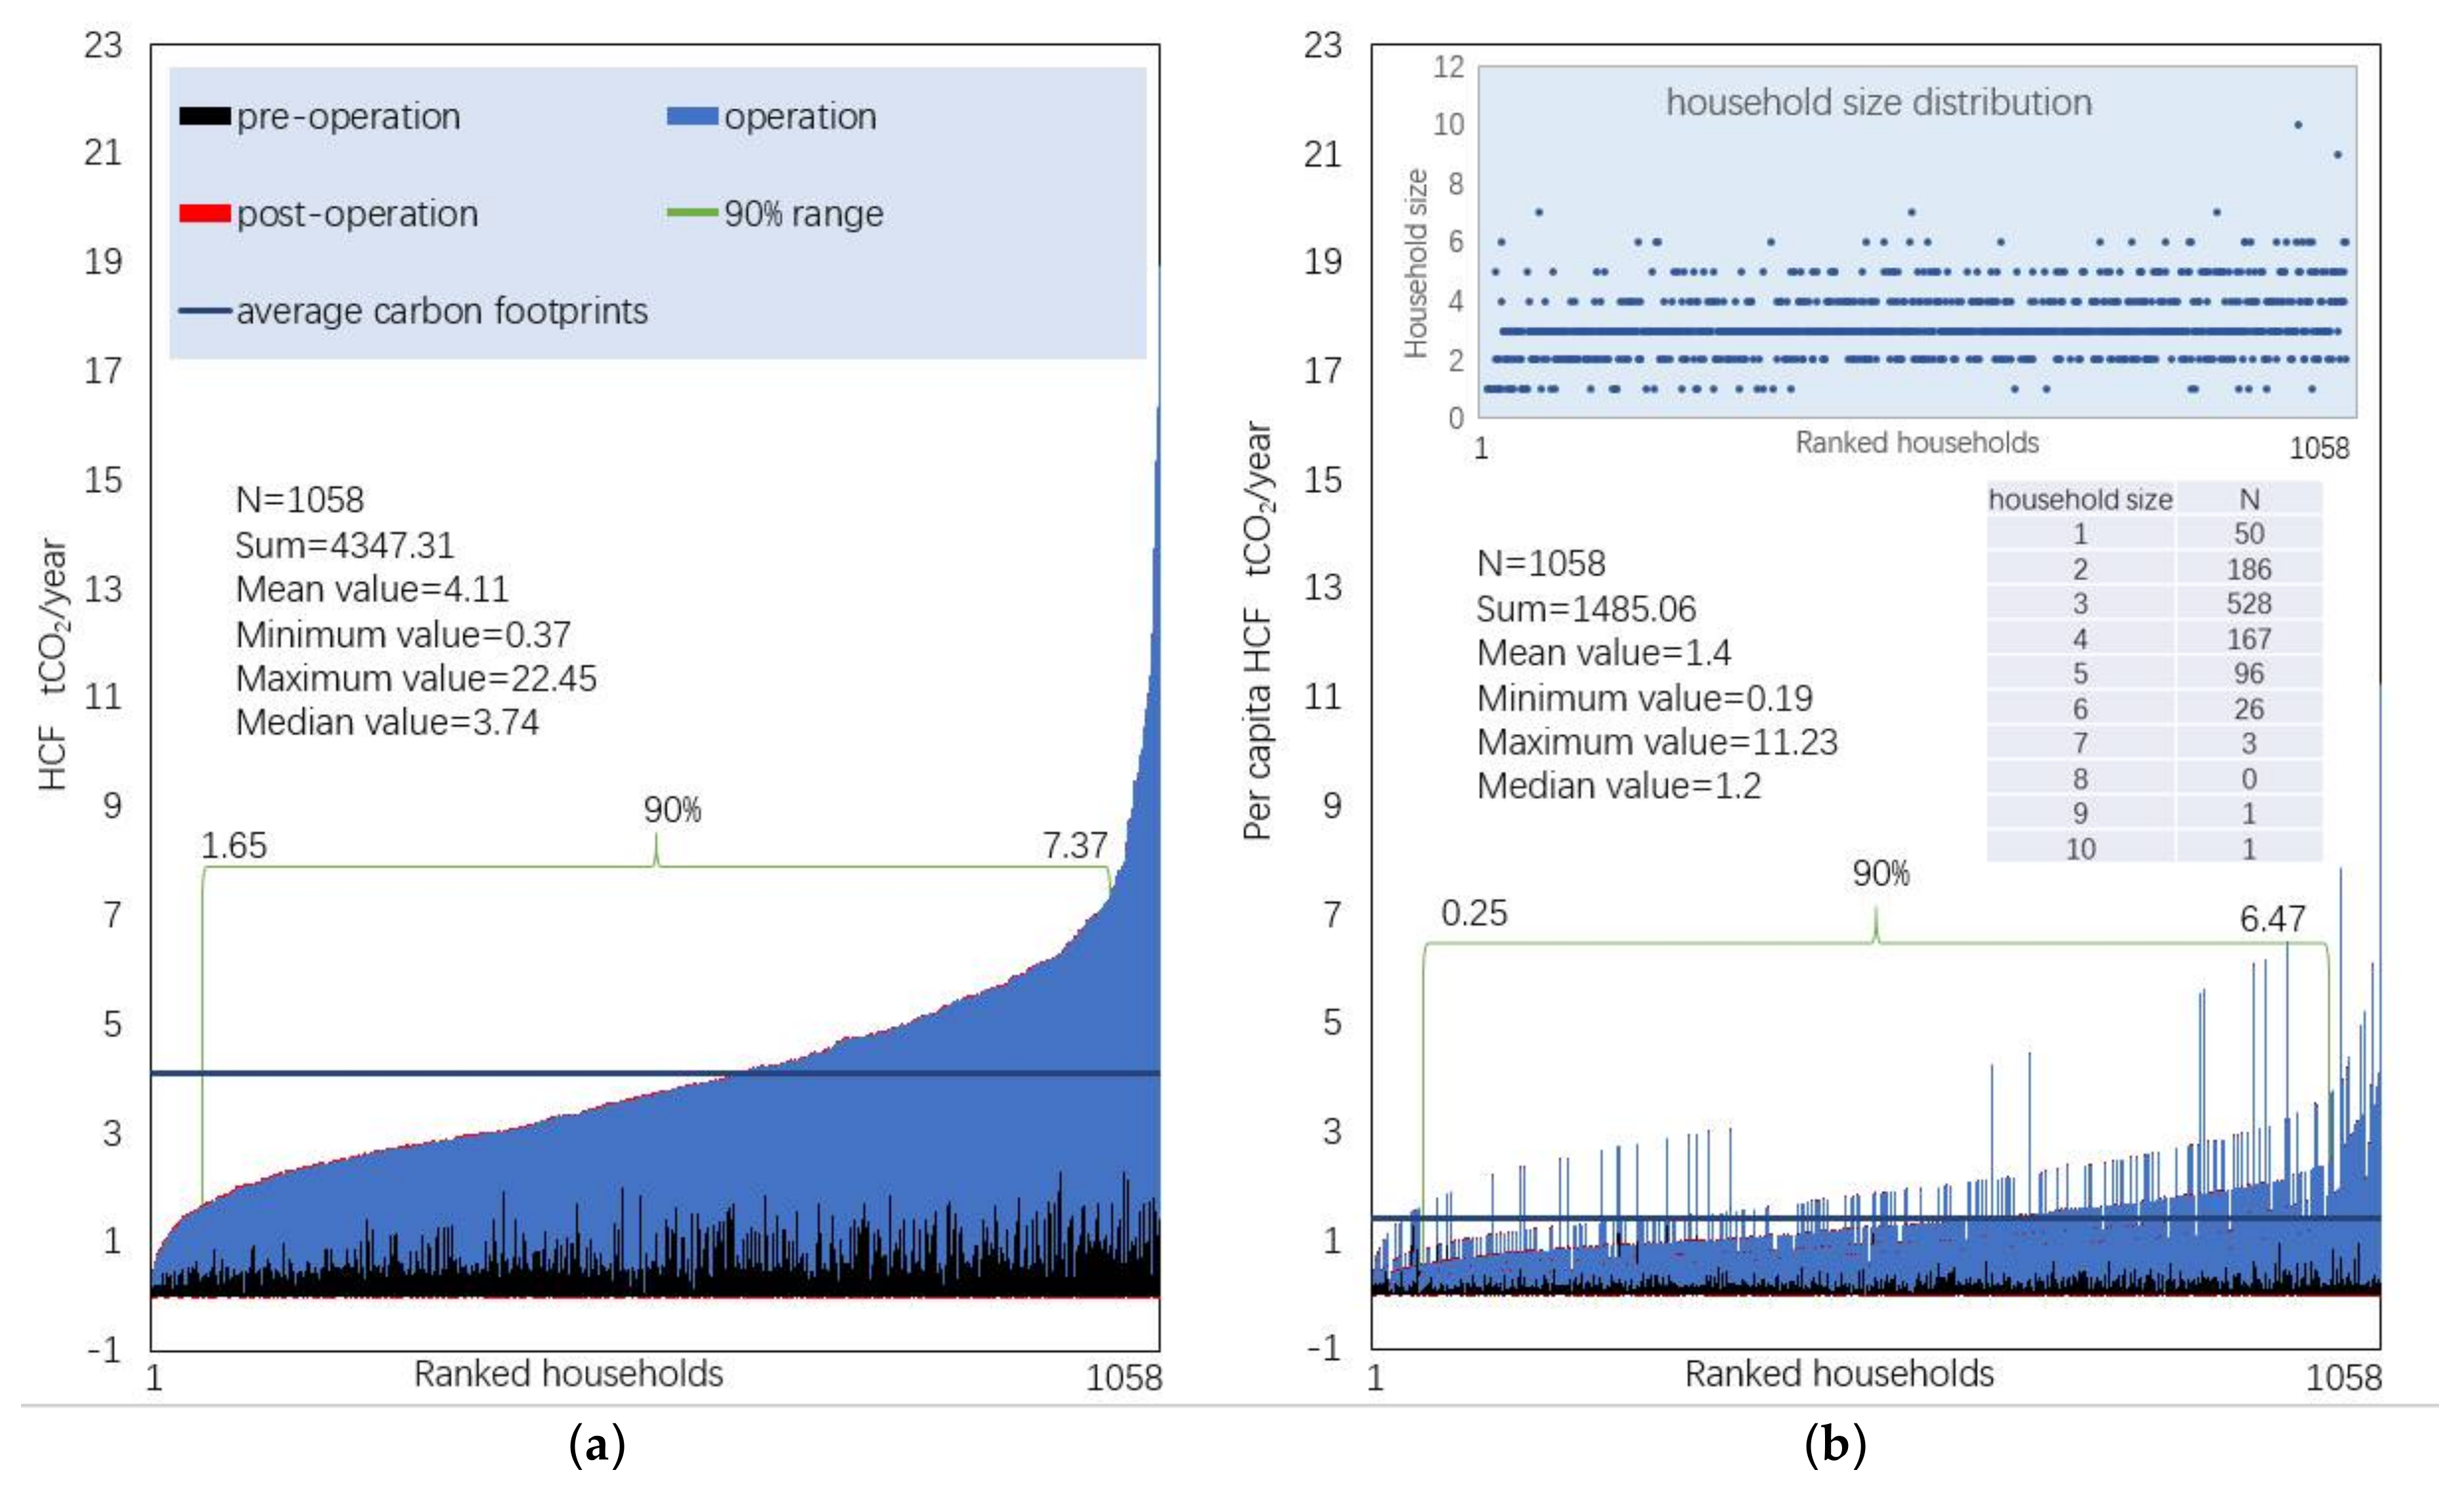
Figure 4.
(a) Comparison by per capita CO2 emissions; (b) Comparison by per unit building area CO2 emissions. Further detail can be found in Tables S4 and S5.
Figure 4.
(a) Comparison by per capita CO2 emissions; (b) Comparison by per unit building area CO2 emissions. Further detail can be found in Tables S4 and S5.

Figure 5.
(a) The distribution of household carbon footprints of urban residential buildings at the community level; (b) Household carbon footprints and per capita carbon footprints of urban residential buildings at the community level.
Figure 5.
(a) The distribution of household carbon footprints of urban residential buildings at the community level; (b) Household carbon footprints and per capita carbon footprints of urban residential buildings at the community level.
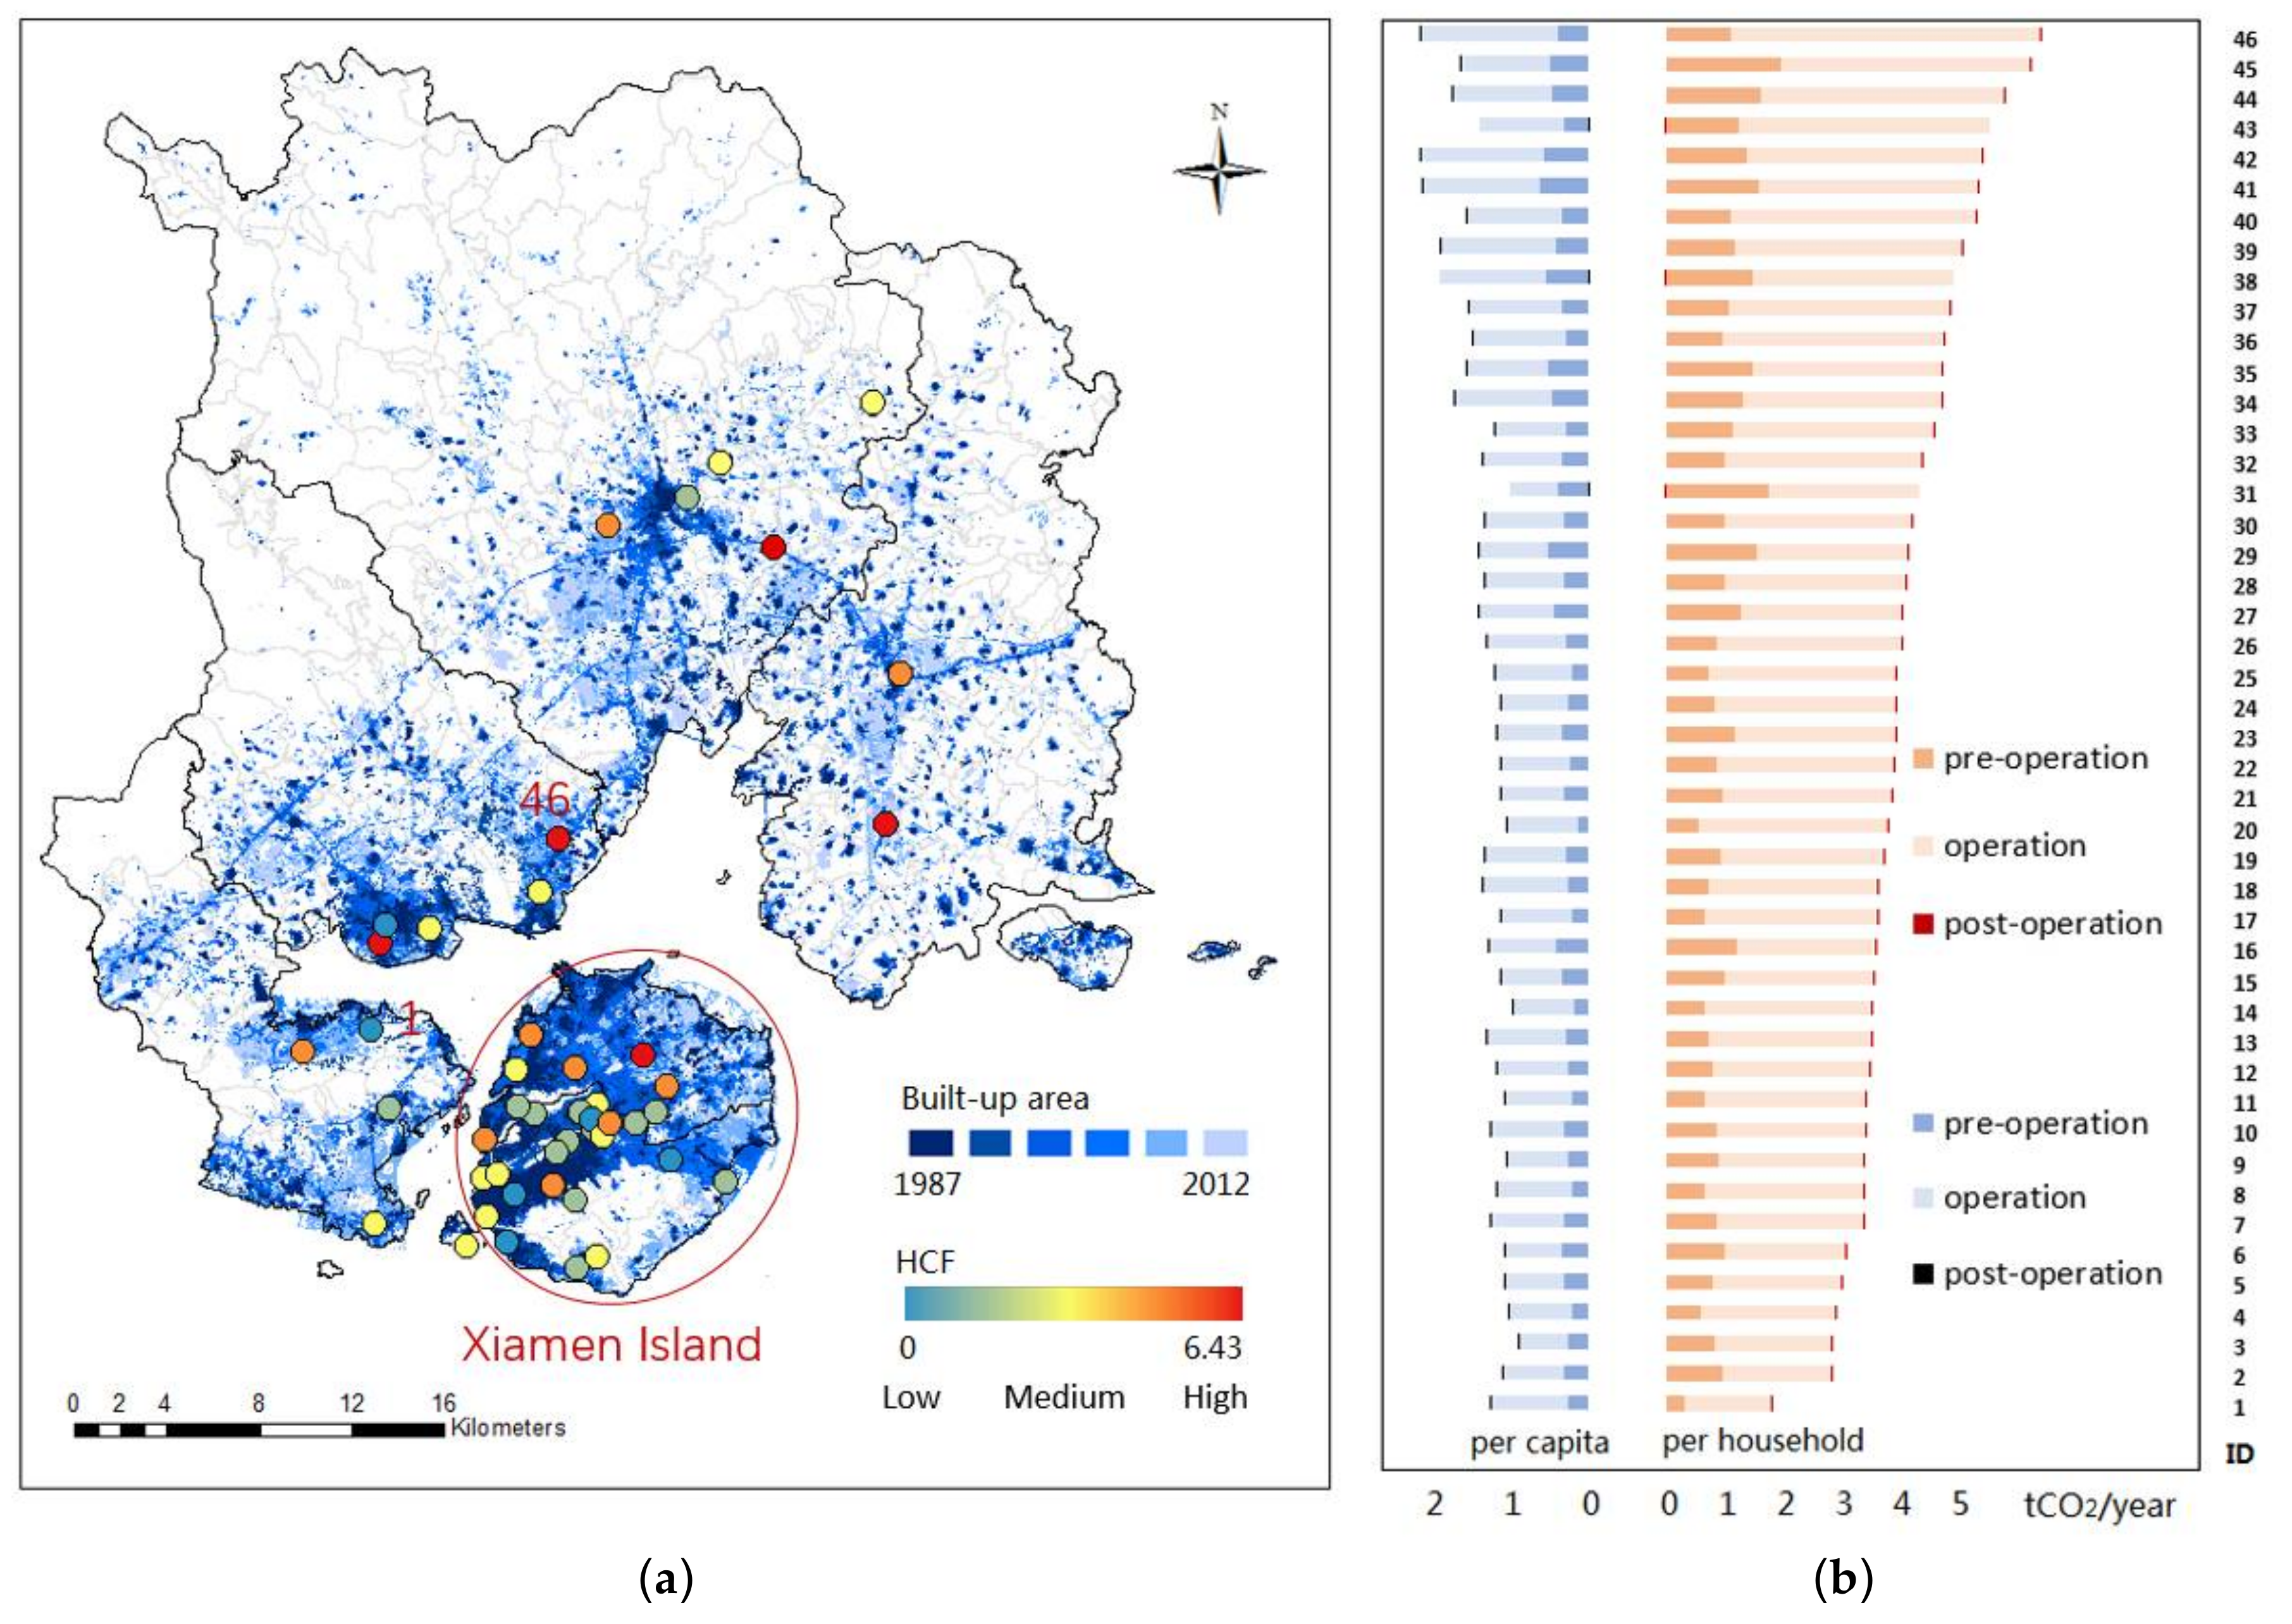
Figure 6.
(a) The carbon footprints of urban residential buildings with different socio-economic attributes; (b) The relationship of per capita carbon footprints and household size; (c) The relationship of household carbon footprints and the apartment area.
Figure 6.
(a) The carbon footprints of urban residential buildings with different socio-economic attributes; (b) The relationship of per capita carbon footprints and household size; (c) The relationship of household carbon footprints and the apartment area.
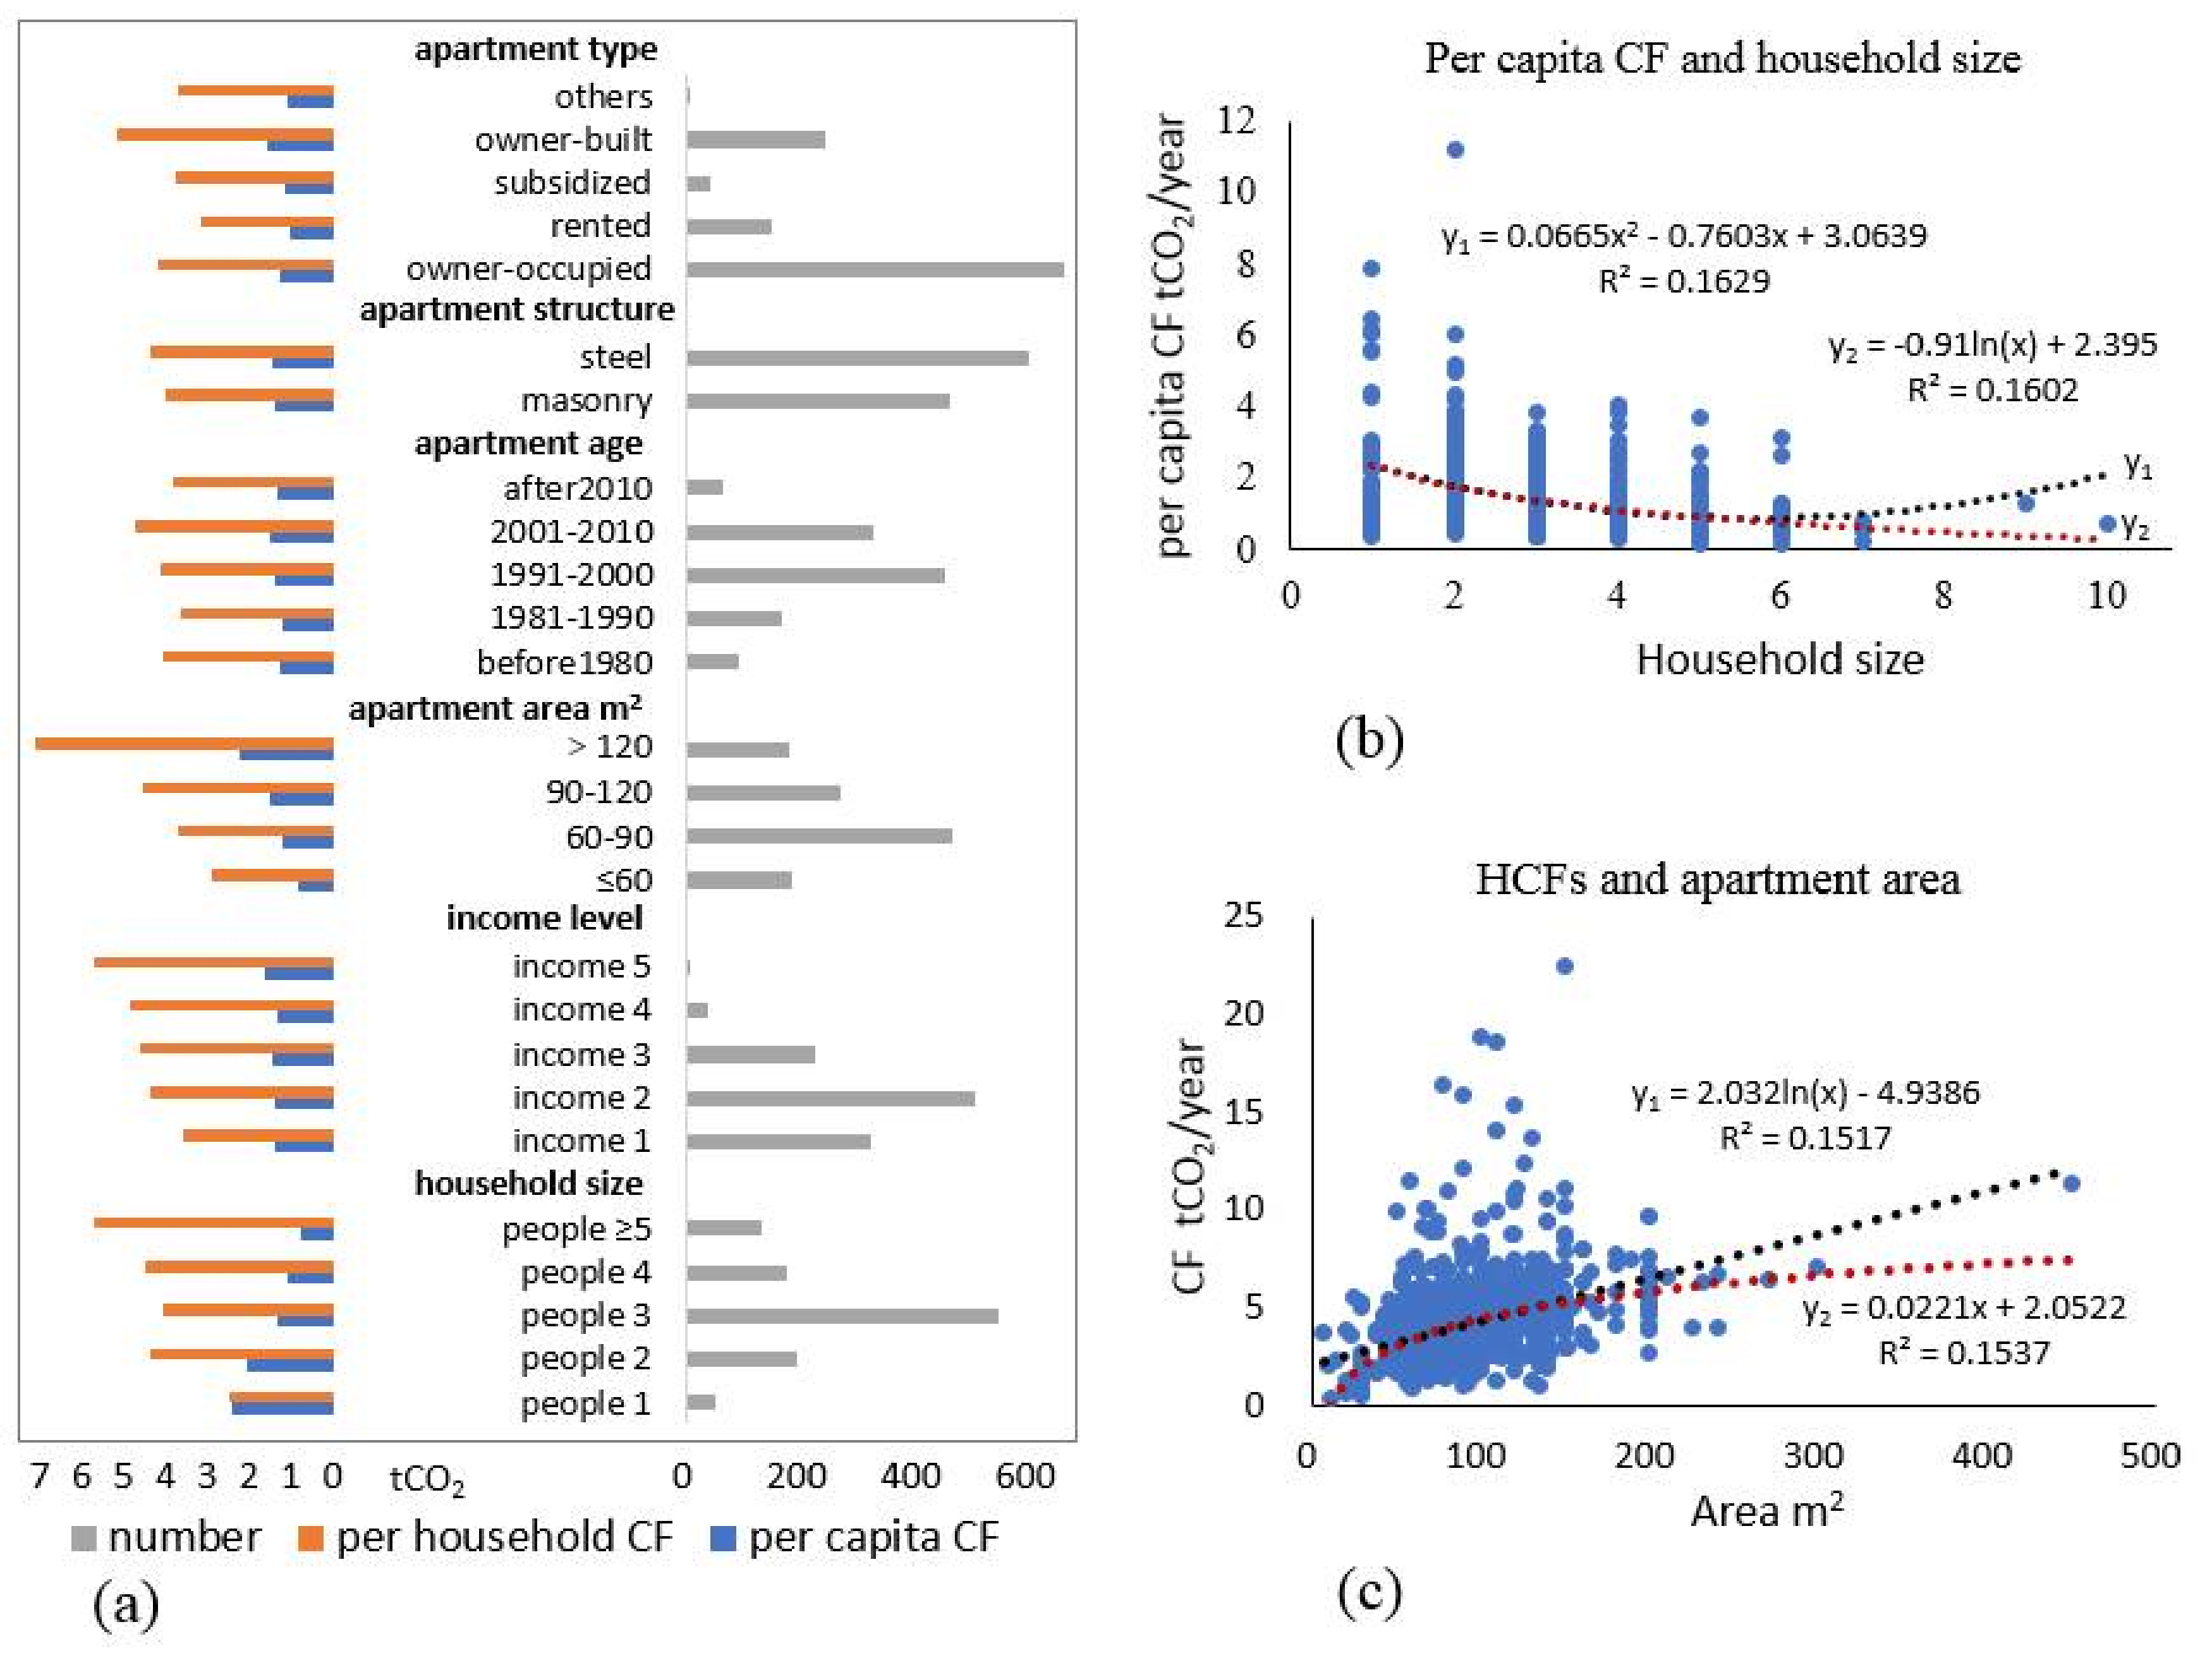
Figure 7.
Total urban residential building carbon footprints in Xiamen City.

Figure 8.
Household carbon footprints and energy-saving awareness.

Table 1.
Carbon emissions per unit area of apartments in life cycle stages.
| Steel-Concrete Structure | Masonry-Concrete Structure | |
|---|---|---|
| Extraction and production stage | 0.6734 | 0.3221 |
| Materials transportation stage | 0.0045 | 0.0033 |
| Construction stage | 0.0337 | 0.0161 |
| Demolition stage | 0.0303 | 0.0145 |
| Recycle stage | −0.0319 | −0.0068 |
Note: Factors refer to Li’s study [41]. Unit: tCO2/m2.
Table 2.
Spearman’s rho Correlations of energy-saving awareness.
| ESP | ECE | SGI | EUV | SESM | ELR | CF | EU | ||
|---|---|---|---|---|---|---|---|---|---|
| ESP | 1.000 | 0.497 ** | 0.397 ** | 0.457 ** | 0.032 | 0.051 | 0.020 | 0.038 | Energy-saving products |
| ECE | 0.497 ** | 1.000 | 0.476 ** | 0.442 ** | 0.015 | 0.015 | 0.028 | 0.042 | Energy conservation encouragement |
| SGI | 0.397 ** | 0.476 ** | 1.000 | 0.659 ** | 0.012 | 0.006 | −0.013 | 0.007 | Support to government’s initiative |
| EUV | 0.457 ** | 0.442 ** | 0.659 ** | 1.000 | −0.016 | −0.007 | −0.010 | 0.004 | Energy use value |
| SESM | 0.032 | 0.015 | 0.012 | −0.016 | 1.000 | 0.238 ** | −0.031 | −0.033 | Saving energy is saving money |
| ELR | 0.051 | 0.015 | 0.006 | −0.007 | 0.238 ** | 1.000 | −0.035 | −0.030 | Environmental laws & regulations |
| CF | 0.020 | 0.028 | −0.013 | −0.010 | −0.031 | −0.035 | 1.000 | 0.946 ** | Carbon footprints |
| EU | 0.038 | 0.042 | 0.007 | 0.004 | −0.033 | −0.030 | 0.946 ** | 1.000 | Energy use |
** Correlation is significant at the 0.01 level (2-tailed).
© 2018 by the authors. Licensee MDPI, Basel, Switzerland. This article is an open access article distributed under the terms and conditions of the Creative Commons Attribution (CC BY) license (http://creativecommons.org/licenses/by/4.0/).
Share and Cite
MDPI and ACS Style
Yan, X.; Cui, S.; Xu, L.; Lin, J.; Ali, G. Carbon Footprints of Urban Residential Buildings: A Household Survey-Based Approach. Sustainability 2018, 10, 1131. https://doi.org/10.3390/su10041131
AMA Style
Yan X, Cui S, Xu L, Lin J, Ali G. Carbon Footprints of Urban Residential Buildings: A Household Survey-Based Approach. Sustainability. 2018; 10(4):1131. https://doi.org/10.3390/su10041131
Chicago/Turabian StyleYan, Xiaomei, Shenghui Cui, Lilai Xu, Jianyi Lin, and Ghaffar Ali. 2018. "Carbon Footprints of Urban Residential Buildings: A Household Survey-Based Approach" Sustainability 10, no. 4: 1131. https://doi.org/10.3390/su10041131
Note that from the first issue of 2016, this journal uses article numbers instead of page numbers. See further details here.