Impacts of Changing Forest Management Areas on Forest Landscapes and Habitat Patterns in Northeastern China


1
Jangho Architecture College, Northeastern University, Shenyang 110819, China
2
Key Laboratory of Forest Ecology and Management, Institute of Applied Ecology, Chinese Academy of Sciences, Shenyang 110016, China
3
Center for Studies of Marine Economy and Sustainable Development, Liaoning Normal University, Dalian 116029, China
*
Author to whom correspondence should be addressed.
Sustainability 2018, 10(4), 1211; https://doi.org/10.3390/su10041211
Submission received: 21 January 2018
/
Revised: 22 March 2018
/
Accepted: 12 April 2018
/
Published: 17 April 2018
(This article belongs to the Section Environmental Sustainability and Applications)
Abstract
:The management of multi-use forests often drives forest fragmentation, which leads to decreased habitat areas and quality. We explored suitable habitat distributions of cervids to evaluate the conflict between small-scale human management and large-scale habitat conservation in human-disturbed forest landscapes. We estimated the potential habitat of roe deer (Capreolus pygargus) and determined the contribution of multiple environmental factors to habitat distribution using the presence of roe deer (N = 106) in a maximum entropy (MaxEnt) model. We simulated changes in the suitable habitat and characteristics of landscape patterns based on three forest management area scenarios. The results showed that the potential suitable habitat for roe deer was located mainly in the east. The variables affecting habitat suitability were similar in different scenarios, and included distance to farmland, settlements, rivers and management areas, and elevation. Distance to the management area was found to affect habitat suitability with a contribution probability from 4% to 6%. With an increase in the management area, the suitable habitat decreased. Landscape indexes showed that habitat quality decreased with management area expansion, but patch fragmentation was not aggravated. The expansion of the management area increased the range of human disturbance and had a negative impact on habitat area and quality, which adversely affected the environmental suitability for roe deer.
1. Introduction
Forest management activities often have a negative impact on the habitat and living conditions of wild animals [1]. For example, Leclerc et al. (2012) mentioned that in the context of the declining global population of caribou (Rangifer tarandus), reducing forestry activities will help protect caribou habitat and increase their population [2]. The pattern, intensity and scope of forestry activities can affect the habitat of wild animals. These forestry activities are largely determined by the forest ownership system, which means that changes to the system guide these forestry activities. In recent years, forest rights in many areas have become more dispersed. There are a variety of management measures for the understory layer, plus increased frequency and scope of management, which affect indicators such as the distribution, abundance and coverage of vegetation, and which also result in the spatial fragmentation of the forest landscape and habitat degradation for wild animals [3,4]. The trend towards decentralized management guides human activities, directly affecting the habitat of most wild animals [5,6,7]. Since 2012, commercial logging has been banned in the Lesser Xing’an Mountains. The main sources of human interference are forest management activities, which are represented by understory planting and intermediate cutting. Studies have shown that forest management activities could significantly influence the shrub and herb layers [8]. A variety of management measures and high intensity work in the understory will destroy the habitat essential for wild ungulates and is likely to have a negative impact on their population [9].
In the study of human interference into habitat patterns through forest activities, researchers usually focus on the impact of changes in forest management intensity and approaches. Generally, the impact is measured through biodiversity indexes or using landscape models to simulate the long-term changes to a forest [4,10], and less attention is paid to the change of area under management. This is mainly due to the limitation of the research methods for management area change. To solve the above problem, previous studies have often used a neutral model to simulate the effects of these changes. Neutral landscape models (NLMs) can serve as one of the important tools in landscape ecology to generate a series of patterns with similar statistical characteristics while neglecting specific ecological or physical geographical processes, providing a reference for the exploration of real landscape patterns. However, the neutral pattern randomly assigns the vegetation parameters, such as tree species and age, and topographic factors and human disturbance factors do not accord with the condition of random assignment. In a real world landscape, we need to consider the effect of a variety of environmental factors on the distribution of the target species. We set up a variety of resistance conditions, such as selecting expanding management areas, to obtain the environmental variable layers required by the species distribution model [10]. We combined these with the actual forest management demand, within a GIS platform. We selected terrain factors, landscape type factors, vegetation factors and human disturbance variables to analyze the relationship between different forest management area and habitat distribution. This approach overcomes the limitations of the neutral model, which only considers vegetation features, but not other habitat characteristics.
Deer are some of the typical ungulates in the Lesser Xing’an Mountains, and the distribution and population size of roe deer (Capreolus pygargus) have an important impact on the forest ecosystem [11,12,13]. According to the Report on the Investigation Results of Terrestrial Wild Animal Resources in the National Forests of Forest Industry in Heilongjiang Province, which was issued by the Forest Industry Bureau of Heilongjiang Province in September 2000 [14], the number of deer has decreased, their distribution range has shrunk, and their survival status is of concern. Therefore, this study selected the common species of roe deer as a representative target species. The Tieli Forestry Bureau (TFB) is located in the south of the Lesser Xing’an Mountains. It is a typical human-dominated agriculture–forestry cross-over zone and one of the 2006 national forest reform experimental areas. The contradiction between the need for small-scale human management and large-scale habitat conservation is unresolved. Studying the habitat distribution of roe deer under different forest management area scenarios may help resolve this issue. At the same time, the relationship between landscape patterns and habitat suitability can be determined and habitat can be protected by pre-regulating the forest management area.
2. Study Area and Methods
2.1. Overview of the Study Area
The Tieli Forestry Bureau (127°51′–128°41′ E, 47°02′–47°36′ N) is located on the southern slope of the Lesser Xing’an Mountains, with an area of 204,234 ha (Figure 1). Its elevation is 225–1148 m, mostly in mountainous areas. This region belongs to a temperate continental monsoon climate, with an annual maximum temperature of 35 °C and a minimum temperature of −41 °C. Its annual precipitation is about 600 mm and its river system forms part of the Songhua River. The vegetation of the area belongs to the flora of the Changbai Mountains and the zonal vegetation is coniferous and broad-leaved mixed forest, mainly composed of Pinus koraiensis. There are hundreds of different species of wild animals in this study area, including bear (Ursus thibetanus), wild boar (Sus scrofa) and mandarin duck (Aix galericulata).
The Yichun state-owned forest region was the first to be established in northeastern China. Large-scale logging has historically resulted in a dramatic decrease in both forest area and volume. In recent years, logging has decreased and was finally banned in 2003. After 2006, five forestry bureaus, including the Tieli Forestry Bureau surveyed in this work, initiated a state-run forest tenure reform program. This program involves the selection of commercial forests for management using 50-year contracts with individuals who are designated as land managers at specific sites with an area of approximately 800 km2. The reform pilot zone encompasses a 10,870 km2 forest landscape, including six adjacent forestry bureaus. With the planting of Schisandra chinensis, Panax ginseng and Auricularia auricula, an industry using products from the forest understory has gradually emerged in the local area. During the growing season of crops, diverse management techniques were usually implemented in the understory planting sites, such as weeding, fertilizing, pruning, and harvesting [8]. This policy improved the enthusiasm of local foresters and enriched the management pattern of understory planting, but increased the human disturbance. There are now mainly three treatments in the forest management system applied in the study area, which include tending cut shrubs, selective cutting and understory planting. In general, studies have showed that the intensity of understory planting is the highest [8].
2.2. Methods
2.2.1. MaxEnt
The maximum entropy (MaxEnt) model is one of the most commonly used species distribution models (SDMs, [15,16,17]). It considers a certain number of known species distribution points as the input data and regards environmental predictor variables as constraints in order to build a correlation between the two. The distribution conditions with the maximum entropy are calculated to forecast potential species distribution areas.
2.2.2. Investigation of Appearance Points
Based on field investigations from 2013 to 2015, a total of 32 “Z” line transects were set in the study area [18,19], each 1–2 km long [11,18,20]. We obtained 106 georeferenced coordinates indicating the presence of roe deer based on evidence such as feces, footprints and traces of lying down or browsing. The coordinates of these points were entered into Excel and imported to ArcGIS 9.3 (ESRI INC., Redlands, CA, USA, 2008). They were then converted into the required format for the MaxEnt software.
2.2.3. Selection of Environmental Variables
- (1)
- The terrain factors consisted of elevation, slope, aspect, irradiation aspect, surface roughness, and the standard deviation of elevation [21]. Data on the terrain variables were derived from digital line graphic (DLG) data at a scale of 1:50,000 with contour lines, water systems, roads and other physiognomy information. A digital elevation model was created using ArcGIS with a resolution of 30 m × 30 m.
- (2)
- The landscape factors comprised seven environmental variables. Land cover classes from 2014 Google satellite imagery (resolution 3 m × 3 m) and visual interpretations of the landscape type recorded in field investigations were combined using ArcGIS to obtain a landscape type map. A total of eight landscape types were determined, namely broad-leaved forest, mixed forest, coniferous forest, farmland, shrub/grassland, water bodies (including rivers and swamps), settlements and roads. The land type classification was verified with investigations in the field, showing an interpretation accuracy of 86%. This was acceptable for use as a data source in our model. Then, the distance to six kinds of landscape types (excluding settlements and roads) and land cover factors were analyzed to obtain the grid layers.
- (3)
- The vegetation factors included the forest stand type, forest age, tree height and coverage of shrub/grassland and were all taken from a forest map with a scale of 1:100,000 and used to reflect the characteristics of the plant community structure in the roe deer habitat.
- (4)
- The human disturbance variables covered the distances to settlements (500 m buffer zone), roads (500 m buffer zone for roads and 200 m buffer zone for paths) and management areas [21]. The two former variables were obtained from a landscape type map and the latter was sourced from data on the forest reform experimentation areas from the Resource Department of the Forestry Bureau.
Data on the environmental variables were tested for correlations in R 3.0.1 (http://www.r-project.org/) to reduce the effect of multicollinearity, and factors with a high correlation (r > 0.80) were removed [22,23]. The test results suggested that three of the above 20 environmental variables—irradiation aspect, surface roughness and tree height—did not meet the requirements. Finally, the layers of all the factors were standardized as model inputs with a WGS 84 coordinate system in ArcGIS 9.3, with a grid size of 30 m × 30 m.
2.2.4. Model Construction and Verification
Data on species distribution points and environmental variables were put into the MaxEnt software, and 75% of distribution point data were randomly selected to build the model, while the remaining 25% of the points were used for model verification. The other parameters were set as default values of the model [14] to build a distribution model for roe deer in the study area. After that, the mean of ten simulated results was taken as the final simulated result [24] to obtain a probability distribution map.
Jackknifing was used to analyze the importance of environmental factors and the area under the curve (AUC, the area under a receiver operating characteristic (ROC) curve) was applied to evaluate model accuracy [25,26]. A larger AUC value (0–1) meant a better prediction effect. The assessment standard for the ROC was 0.9–1.0 for very good performance [27].
2.2.5. Habitat Grade Classification
The Youden index was used to judge the threshold values of the ROC curve, where a larger index showed a better experimental effect [28,29]. The output results of the model were imported into ArcGIS. The best breakpoint served as a threshold value to reclassify the probability distribution map, according to the maximum Youden index of the MaxEnt model. The habitat of roe deer was divided into two classes: suitable (≥threshold value) and unsuitable (<threshold value) habitats.
2.3. Simulation of Different Forest Management Area Scenarios
According to the local forest tenure reform program and natural environmental conditions, we estimated the potential habitat of roe deer based on four forest management area scenarios, including no management, the current management regime, a twofold management area (twice the size of the current management area) and a threefold management area. Based on field investigations, the forest management area was usually flat, convenient woodland with poor conditions. Combined with the real management characteristics, we mapped the following resistance layer in ArcGIS to select site expansion conditions:
- (1)
- Setting 20 m wide rectangular buffers on both sides of the river;
- (2)
- Setting circular buffers with a 20 m radius around existing residential areas and water bodies;
- (3)
- Extracting farmland type;
- (4)
- Using reclassification to extract areas with a slope greater than 25°.
Based on these variables, the vector layer of the forest management area was increased to twofold and threefold according to a circular buffer to model the environmental layers under different management area conditions. In addition, we set a no forest management area scenario, which did not include the environmental variable of distance to forest management area. Based on the distance analysis function in GIS, the distance factor layer was calculated for the different forest management area scenarios. Then, we recomputed the classification results of the landscape types under each scenario to get the environment variable layers. Finally, we put the environment variables dataset under each scenario into the MaxEnt models, in the same way as outlined in Section 2.2.3 and Section 2.2.4.
2.4. Spatial Analysis of the Landscape Pattern
This study used a MaxEnt model to obtain the results for different habitat grades in different forest management area scenarios. Using GIS, the area of each habitat level from different scenarios was analyzed to get the suitable habitat distribution maps for roe deer. After that, FRAGSTATS 4.1 was used to calculate landscape indexes at both landscape and patch level [30,31], with a resolution of 30 m. According to the significance of each landscape index and its ecological application, we chose PLAND (percent of landscape), AREA_MN (mean patch area), PD (patch density), ED (edge density), LSI (landscape shape index), SHAPE_MN (mean patch shape), ENN_MN (mean Euclidean nearest neighbor distance) and AI (aggregation index). We used these eight landscape indexes—including area index, density index, shape index, distance index and aggregation index—to analyze the characteristics of changes in landscape patterns.
3. Results
3.1. Examination of the Model Prediction Results
The evaluation of the ROC curve indicated that the average AUC values of the roe deer model for the training set and validation set were all greater than 0.9 under each scenario, suggesting that the MaxEnt models yielded good accuracy and could be used to predict potential deer habitat in our study area (Table 1).
3.2. Distribution of Suitable Habitat for Roe Deer under Different Scenarios
The distribution of suitable habitat of roe deer changed clearly under the different scenarios. Under the no management scenario, the suitable habitat area was widely distributed, mainly in the eastern mountainous region and central forest area, accounting for 21% of the total study area. With the increase of the management area, the suitable habitat area clearly decreased and was reduced by 22% under current conditions and 19% in the twofold management area scenario (Table 2). When the management area expanded to the threefold scenario, the roe deer habitat shrank greatly (Figure 2).
3.3. Relationship between Habitat Suitability for Roe Deer and Environmental Factors
The model results indicated that the environmental factors and their contributions to the roe deer model were similar under different scenarios. Among the variables, distance to farmland, distance to settlements, distance to river, distance to forest management area and elevation had the strongest influence on habitat suitability. Among these, the model contribution of the distance to the forest management area factor was stable, at 4.8% (current), 6.0% (twofold scenario) and 5.1% (threefold scenario). The stability of the contribution rate of this factor indicated that the distance to the management area had a clear effect on habitat suitability for roe deer.
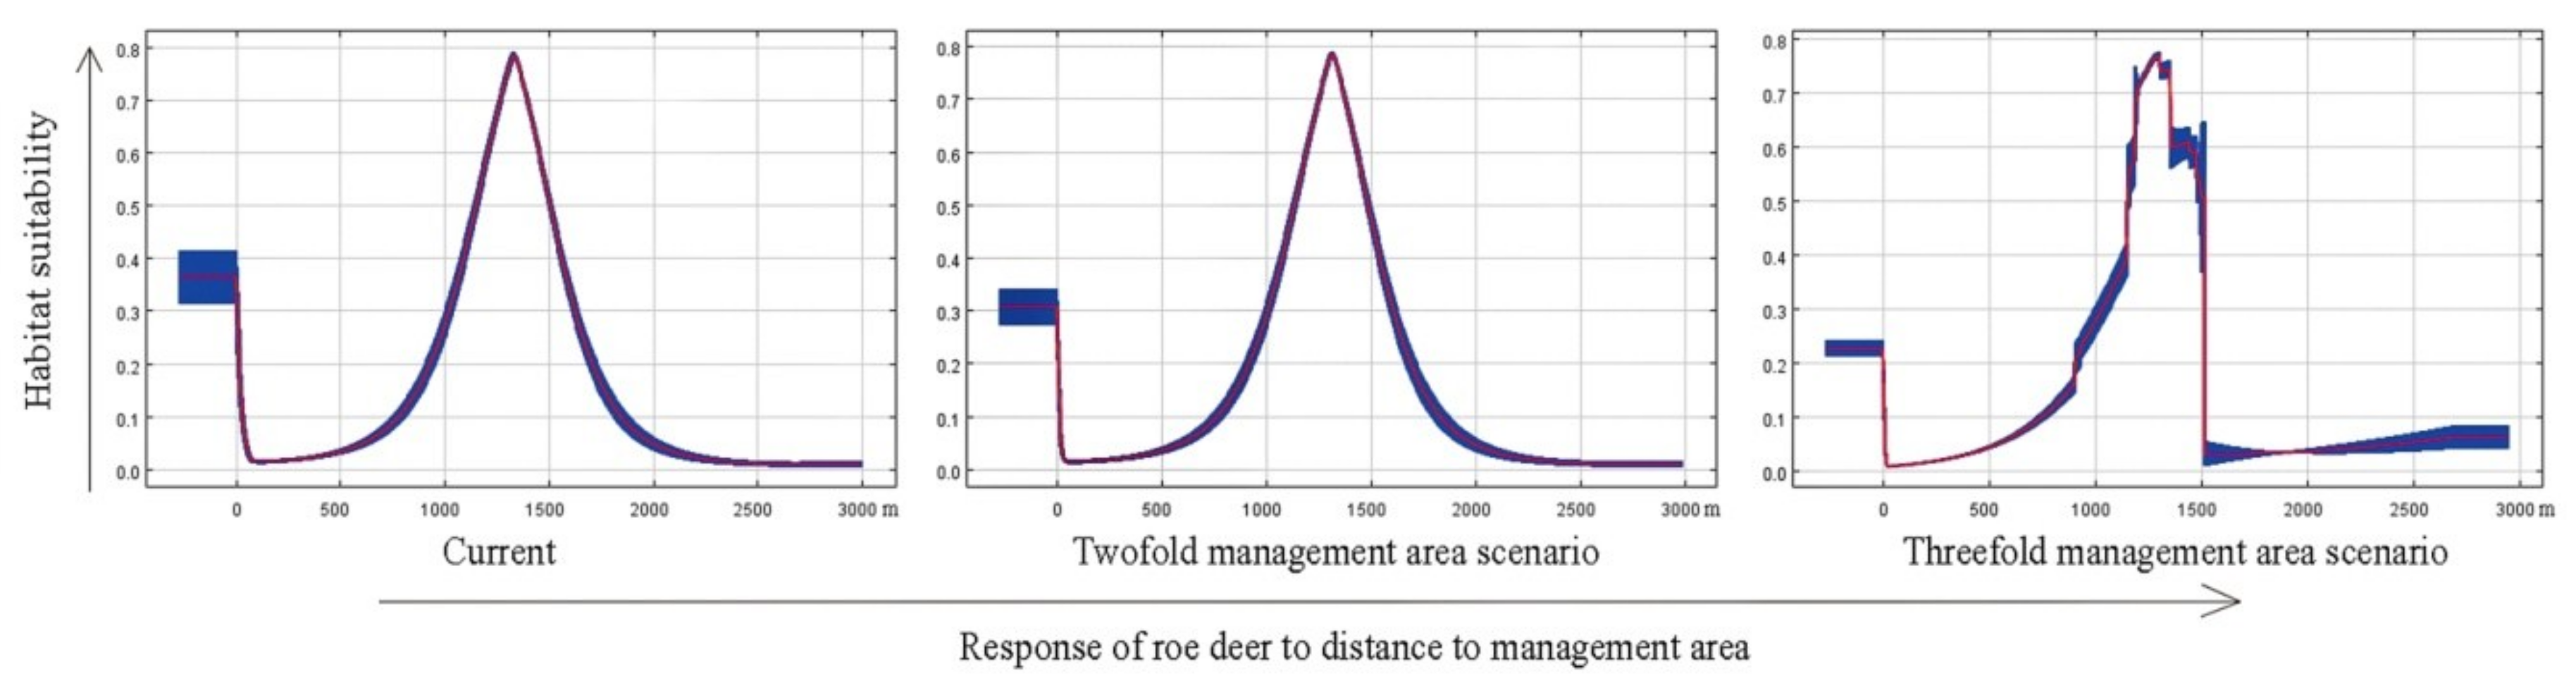
The response curve of the contribution of the distance to the forest management area factor on the predicted results showed that with increasing distance from the forest management area, at first the roe deer habitat suitability rose and then decreased (Figure 3). At a distance of about 1300 m from the forest management area, habitat suitability reached its peak, suggesting that the distance from management activities was relatively close for the different scenarios for roe deer.
3.4. The Landscape Pattern Changes for Suitable Habitat under Different Scenarios
Results showed (Table 3) that with the increase in the forest management area, the PLAND (percent of landscape) of suitable habitat decreased, while the area of unsuitable habitat increased. The AREA_MN (mean patch area) of suitable and unsuitable habitat both rose, while the PD (patch density) index and ED (edge density) index decreased. The LSI (landscape shape index) fluctuated, indicating that the shape of the patch was neither complicated nor simplified. The ENN_MN value (mean Euclidean nearest neighbor distance) and AI (aggregation index) increased.
At the landscape level (Table 4), with the expansion of the management area, the PD, ED and LSI were all reduced. The ENN_MN increased, and patches tend to converge. These indexes reflect that the habitat quality for roe deer decreased with the expansion of the management area, but patch fragmentation was not aggravated.
The following abbreviations have been used: PLAND, percent of landscape; AREA_MN, mean patch area; PD, patch density; ED, edge density; LSI, landscape shape index; SHAPE_MN, mean patch shape; ENN_MN, mean Euclidean nearest neighbor distance; AI, aggregation index.
4. Discussion
4.1. Effect of the Change of Forest Management Area on Habitat Distribution
The results indicated that with the increase in the management area, the suitable habitat decreased. The expansion of the management area increases the disturbance range of human activities, which adversely affects the living conditions for roe deer, resulting in a decrease in habitat area and quality. Studies have shown that large areas of forest management can result in the fragmentation of core habitat or a loss of area, and thus threaten species survival, which makes it more difficult to protect large-scale biodiversity [32]. Nevertheless, the expansion of the management area in the understory can also provide a variety of habitats that are beneficial to the survival of some species. For example, the coexistence of different forest habitats in woodland can provide different food sources and shelter for wild animals, especially for some reptiles. Research has shown that private woodlands in the southwestern United States play a positive role in protecting the habitat of Gopherus polyphemus [33]. More remarkable, the suitable habitat area differs greatly between the management scenarios and no management scenario, except for a standard area in the southeast, which remained as suitable habitat under all four scenarios (Figure 2). The reason for this may be the large proportion of farmland distribution in the southeastern mountain region, which is a favorite habitat distribution of roe deer [14].
There are a number of studies on the impact of forest management areas on habitat distribution, but few studies that focus on China’s state-run forests. Related studies have mostly focused on the influence of forest ownership and the change of activity intensity [34]. For instance, Piekielek and Hansen (2012) studied four typical American national parks and their surrounding land with different ownership. The results showed that changes of habitat quality fluctuate with time, but the habitat quality of private land is lower than that of public land for a longer time. Jin (2008) assessed Sciurus vulgaris habitat quality in the Lesser Xing’an Mountain using LANDIS and a landscape-level habitat suitability index (HSI) model in a GIS environment. The results showed that the increase of suitable habitat areas and the decrease of marginally suitable areas were the fastest under no cutting scenarios and the slowest under clear cutting scenarios. The optimal management alternatives for S. vulgaris habitat were in the sequence of no cutting, selective cutting and clear cutting.
4.2. Habitat Distribution Response to Environmental Factors
The results showed that the main environmental factors that influenced the distribution of roe deer habitat were stable with expanding management areas, and the variables with a larger contribution rate were the landscape type factors and human disturbance factors. Among these, the distance to the management area factor was found to consistently rank in the top five, indicating that it has a strong influence on the habitat distribution of roe deer. When the distance to the forest management area is very close, the human disturbance intensity is high; as roe deer characteristically avoid human disturbance the habitat suitability for roe deer is thus low. At a distance of about 1300 m, the habitat suitability reached its peak under the different scenarios for roe deer. With the increasing distance the influence of the forest management area factor was reduced, and maybe other environmental factors became dominant interference factors, decreasing the suitability for roe deer.
It is possible that roe deer habitat distribution is mainly influenced by distance to farmland, because farmland can provide high nutrition food. We found that the distance to roads had little influence on the predicted results in this study. Our findings are similar to some previous research. For instance, Piekielek and Hansen (2012) pointed out that some roads could become natural wildlife corridors and do not pose an obvious disturbance. Regarding terrain factors, Li (2005) found that altitude and aspect are both the main contributors to the habitat selection of deer in Heilongjiang Province, China [35]. Our study indicated that slope had little impact on roe deer distribution, which can be explained by the gentle topography in our study area.
Studies indicate that human interference has a great influence on large mammals, which have been shown to move their home range and avoid areas within 100–200 m of roads and 500–1000 m [6,7,36] of settlements [5]. Within this range they have low habitat suitability and are at greater risk of being killed. In our study, human disturbance was very important when determining suitable habitat distribution, but in the model simulation we were only able to consider some human activities, such as the distance from roads, residential areas and forest management areas. It is difficult to fully consider the influence of artificial factors. There are seasonal forest management activities in our study area, so the interference intensity and interference methods will vary from season to season. Field research has found that in autumn, forest farmers often walk far into the mountains to harvest pinecones. In summer people engage in higher intensity and more extensive activities. These seasonal human activities affect the distribution and behavior of roe deer [14]. However, this study only simulated the average disturbance range of one year, and the uncertainty and subjectivity of the growth of forest management areas were difficult to control quantitatively.
4.3. Limitations of Modeling
The prediction results of the SDMs depend largely on the input data of the model, which mainly includes the acquisition of species occurrence data and the selection of environmental factors. In this study, the data on species distribution points from field investigations over the past 3 years were used as the input data for the MaxEnt model. The model accuracy was high and the results were more convincing than historical data modeling. Owing to the limitations of mountainous terrain and other conditions, it is difficult to form uniform spatial sample lines, which affects research on larger scales. In terms of environmental variables, we needed to consider as much as possible the potential environmental factors, especially human interference in northeastern China, but reduce the predictive variables when building the SDMs. In addition, the accuracy and correlation of the environmental variables should be tested to select suitable environment variable data sets for different targets. The input data of the model is the fundamental and key aspect of simulation studies. It will increase the reliability and applicability of the model if input data can be improved in terms of the scientific reliability of the selection of the environment variables.
At present, the research methods on the relationship between the forest management area and species habitat are limited. Real change in forest management patterns can seldom be simulated in the real landscape, because different land ownership, the degree of forest decentralization and working intensity together affect the research results. Previous studies have mostly used the neutral model to simulate the pattern change, which has disadvantages. The neutral pattern can only be assigned to vegetation parameters such as the composition and age of the tree species. The terrain factors and human disturbance factors do not meet the conditions of random assignment [10].
In our study, the expansion of the forest management area was circular around the current management area. Combined with management circumstances, we set a variety of resistance conditions using the SDMs [37] to simulate the changes to the potential distribution of roe deer habitat under different scenarios, and analyzed the effect of the distance to the forest management area on the prediction of roe deer distribution. Despite all this, it was still difficult to model the actual situation of real growth. Generally, neutral model simulation can only focus on vegetation characteristics and cannot comprehensively consider the limitations of other important habitat features such as terrain and human disturbance. However, these factors were considered by MaxEnt. At the same time, the MaxEnt method avoids the subjectivity of mechanistic models and the lack of input data of regression models, which are suitable for studying the habitat distribution of wildlife when species-occurrence data are lacking [38,39]. These provide favorable conditions for biodiversity conservation and management at the landscape scale.
4.4. Conservation and Management Advice
The results from our study suggest that forest managers need to be aware of the management of the understory, control human disturbance and give protection priority to the potential areas of suitable deer habitat, to better conserve the wildlife habitat in the forest landscape of state-owned forest areas. Furthermore, we should consider the area of disturbance and influence range of human activities before forest management measures are implemented, and minimize the transfer, fragmentation or loss of high-quality habitat [40]. In this study, roe deer avoided the forest management areas. At a distance of about 1300 m, the habitat suitability of roe deer was highest. Based on this, we should enhance the landscape connectivity of management areas and surrounding habitat to provide better natural conditions for wildlife, particularly focused on areas 1 km around a site that roe deer will avoid. Last, continuing long-term research can provide important scientific support for the protection and restoration of deer populations.
5. Conclusions
Using MaxEnt to study the occurrence of roe deer allowed us to elucidate habitat suitability within the study area and assess the relative influence of environmental factors on their distribution patterns. The results showed that the potential suitable habitat for roe deer was located mainly in the eastern mountainous region of the TFB. The variables affecting habitat suitability were similar under different scenarios, and included distance to farmland, settlements, rivers and management areas, and elevation. The distance to management areas was found to affect habitat suitability with a stable probability of contribution. The expansion of the management area increased the range of human disturbance, which adversely affected the environment for roe deer, resulting in a decreasing habitat area and quality. It is clear that local people have been building roads, cultivating farmland and expanding settlements, which have broken up natural habitats. Furthermore, the development of the under-forestry economy (such as understory planting in this study) has led to increasingly isolated large patches, which should be focused on and protected. Deer are still very vulnerable to negative human activities. In our view, the population decline of deer in northeastern China is also driven by poaching, which was hard to consider in the model.
Acknowledgments
We thank all the members of the landscape ecology group of the Institute of Applied Ecology, Chinese Academy of Sciences, for assistance with the fieldwork. This study was supported by the Liaoning Planning Fund Project of Philosophy and Social Science (No. L17CGL003), the Doctoral Scientific Research Foundation of Liaoning Province (No. 20170520280), the Fundamental Research Funds for the Central Universities of China (No. 171104003) and the National Natural Science Foundation of China (No. 41271201, 41471141).
Author Contributions
Wen Wu conceived and designed the experiments, performed the experiments, analyzed the data, contributed reagents/materials/analysis tools, wrote the paper, and prepared figures and tables. Yuehui Li conceived and designed the experiments, performed the experiments, contributed reagents/materials/analysis tools, and reviewed drafts of the paper. Yuanman Hu and Chunliang Xiu conceived and designed the experiments. Xiaolu Yan was responsible for the data analysis.
Conflicts of Interest
The authors declare that they have no conflict of interest.
References
- Laurance, W.F.; Useche, D.C.; Rendeiro, J.; Kalka, M.; Bradshaw, C.J.A.; Sloan, S.P.; Laurance, S.G.; Campbell, M.; Abernethy, K.; Alvarez, P.; et al. Averting biodiversity collapse in tropical forest protected areas. Nature 2012, 489, 290–294. [Google Scholar] [CrossRef] [PubMed]
- Leclerc, M.; Dussault, C.; St-Laurent, M.H. Multiscale assessment of the impacts of roads and cutovers on calving site selection in woodland caribou. For. Ecol. Manag. 2012, 286, 59–65. [Google Scholar] [CrossRef]
- Li, N.N.; Li, Y.H. Management models of different ownership forests and their ecological effects: A review. Chin. J. Appl. Ecol. 2011, 22, 1623–1631. (In Chinese) [Google Scholar]
- Li, Y.H.; Wu, W.; Li, N.N.; Bu, R.C.; Hu, Y.M. Effects of forest ownership regime on landscape pattern and animal habitat: A review. J. Appl. Ecol. 2013, 24, 2056–2062. (In Chinese) [Google Scholar]
- Forman, R.T.T.; Alexander, L.E. Roads and their major ecological effects. Annu. Rev. Ecol. Syst. 1998, 29, 207–231. [Google Scholar] [CrossRef]
- Trombulak, S.C.; Frissell, C.A. Review of ecological effects of roads on terrestrial and aquatic communities. Conserv. Biol. 2000, 14, 18–30. [Google Scholar] [CrossRef]
- Zeng, Q.; Zhang, Y.M.; Sun, G.Q.; Duo, H.R.; Wen, L.; Lei, G.C. Using species distribution model to estimate the wintering population size of the endangered scaly-sided Merganser in China. PLoS ONE 2015, 10, e0117307. [Google Scholar] [CrossRef] [PubMed]
- Wu, W.; Hu, Y.M.; Li, Y.H.; Gong, J.P.; Chen, L.; Chang, Y.; Xiong, Z.P. Plant Diversity and Vegetation Structures in the Understory of Mixed Boreal Forests under Different Management Regimes. Pol. J. Environ. Stud. 2016, 25, 1749–1757. [Google Scholar] [CrossRef]
- Li, Y.H.; Chang, Y.; Hu, Y.M.; Li, X.Z.; Xiao, D.N. Research advance in effects of anthropogenic activity on forest landscape. Sci. Silvae Sin. 2006, 42, 119–126. (In Chinese) [Google Scholar]
- Gustafson, E.J.; Lytle, D.E.; Swaty, R.; Loehle, C. Simulating the cumulative effects of multiple forest management strategies on landscape measures of forest sustainability. Landsc. Ecol. 2007, 22, 141–156. [Google Scholar] [CrossRef]
- Tian, Y.; Wu, J.G.; Smith, A.T.; Wang, T.M.; Kou, X.J.; Ge, J.P. Population viability of the Siberian tiger in a changing landscape: Going, going and gone? Ecol. Model. 2011, 222, 3166–3180. [Google Scholar] [CrossRef]
- Tian, Y.; Wu, J.G.; Wang, T.M.; Ge, J.P. Climate change and landscape fragmentation jeopardize the population viability of the Siberian tiger (Panthera tigris altaica). Landsc. Ecol. 2014, 29, 621–637. [Google Scholar] [CrossRef]
- Wang, T.; Feng, L.M.; Mou, P.; Wu, J.G.; Smith, J.L.D.; Xiao, W.H.; Yang, H.T.; Dou, H.L.; Zhao, X.D.; Cheng, Y.C.; et al. Amur tigers and leopards returning to China: Direct evidence and a landscape conservation plan. Landsc. Ecol. 2016, 31, 491–503. [Google Scholar] [CrossRef]
- Wu, W.; Li, Y.H.; Hu, Y.M.; Chen, L.; Li, Y.; Li, Z.M.; Nie, Z.W.; Chen, T. Suitable winter habitat for Cervus elaphus on the southern slope of the Lesser Xingan Mountains. Biodivers. Sci. 2016, 24, 20–29. (In Chinese) [Google Scholar] [CrossRef]
- Elith, J.; Leathwick, J.R. Species Distribution Models: Ecological explanation and prediction across space and time. Annu. Rev. Ecol. Evol. Syst. 2009, 40, 677–697. [Google Scholar] [CrossRef]
- Phillips, S.J.; Anderson, R.P.; Schapire, R.E. Maximum entropy modeling of species geographic distributions. Ecol. Model. 2006, 190, 231–259. [Google Scholar] [CrossRef]
- Phillips, S.J.; Dudik, M. Modeling of species distributions with Maxent: New extensions and a comprehensive evaluation. Ecography 2008, 31, 161–175. [Google Scholar] [CrossRef]
- Thomas, L.; Buckland, S.T.; Rexstad, E.A.; Laake, J.L.; Strindberg, S.; Hedley, S.L.; Bishop, J.R.B.; Marques, T.A.; Burnham, K.P. Distance software: Design and analysis of distance sampling surveys for estimating population size. J. Appl. Ecol. 2010, 47, 5–14. [Google Scholar] [CrossRef] [PubMed] [Green Version]
- Waltert, M.; Meyer, B.; Shanyangi, M.W.; Balozi, J.J.; Kitwara, O.; Qolli, S.; Krischke, H.; Muehlenberg, M. Foot surveys of large mammals in woodlands of western Tanzania. J. Wildl. Manag. 2008, 72, 603–610. [Google Scholar] [CrossRef]
- Leathwick, J.R.; Elith, J.; Francis, M.P.; Hastie, T.; Taylor, P. Variation in demersal fish species richness in the oceans surrounding New Zealand: An analysis using boosted regression trees. Mar. Ecol. Prog. Ser. 2006, 321, 267–281. [Google Scholar] [CrossRef]
- Wu, W.; Li, Y.H.; Hu, Y.M. Simulation of potential habitat overlap between red deer (Cervus elaphus) and roe deer (Capreolus capreolus) in northeastern China. PeerJ 2016, 4. [Google Scholar] [CrossRef] [PubMed]
- Dormann, C.F.; Elith, J.; Bacher, S.; Buchmann, C.; Carl, G.; Carre, G.; Marquez, J.R.G.; Gruber, B.; Lafourcade, B.; Leitao, P.J.; et al. Collinearity: A review of methods to deal with it and a simulation study evaluating their performance. Ecography 2013, 36, 27–46. [Google Scholar] [CrossRef]
- Gallardo, B.; Aldridge, D.C. Evaluating the combined threat of climate change and biological invasions on endangered species. Biol. Conserv. 2013, 160, 225–233. [Google Scholar] [CrossRef]
- Behdarvand, N.; Kaboli, M.; Ahmadi, M.; Nourani, E.; Mahini, A.S.; Aghbolaghi, M.A. Spatial risk model and mitigation implications for wolf-human conflict in a highly modified agroecosystem in western Iran. Biol. Conserv. 2014, 177, 156–164. [Google Scholar] [CrossRef]
- Luo, C.; Xu, W.H.; Zhou, Z.X.; Ouyang, Z.Y.; Zhang, L. Habitat prediction for forest musk deer (Moschus berezovskii) in Qinling mountain range based on niche model. Acta Ecol. Sin. 2011, 31, 1221–1229. (In Chinese) [Google Scholar]
- Qi, Z.X.; Xu, W.H.; Xiong, X.Y.; Ouyang, Z.Y.; Zheng, H.; Gan, D.X. Assessment of potential habitat for Ursus thibetanus in the Qinling Mountains. Biodivers. Sci. 2011, 19, 343–352. (In Chinese) [Google Scholar]
- Araujo, M.B.; Alagador, D.; Cabeza, M.; Nogues-Bravo, D.; Thuiller, W. Climate change threatens European conservation areas. Ecol. Lett. 2011, 14, 484–492. [Google Scholar] [CrossRef] [PubMed]
- Catry, F.X.; Rego, F.C.; Bacao, F.; Moreira, F. Modeling and mapping wildfire ignition risk in Portugal. Int. J. Wildland Fire 2009, 18, 921–931. [Google Scholar] [CrossRef]
- Vega Garcia, C.; Woodard, P.M.; Titus, S.J.; Adamowicz, W.L.; Lee, B.S. A logit model for predicting the daily occurrence of human caused forest-fires. Int. J. Wildland Fire 1995, 5, 101–111. [Google Scholar] [CrossRef]
- Ko, D.W.; He, H.S.; Larsen, D.R. Simulating private land ownership fragmentation in the Missouri Ozarks, USA. Landsc. Ecol. 2006, 21, 671–686. [Google Scholar] [CrossRef]
- McGarigal, K.; Cushman, S.A. Comparative evaluation of experimental approaches to the study of habitat fragmentation effects. Ecol. Appl. 2002, 12, 335–345. [Google Scholar] [CrossRef]
- Piekielek, N.B.; Hansen, A.J. Extent of fragmentation of coarse-scale habitats in and around US National Parks. Biol. Conserv. 2012, 155, 13–22. [Google Scholar] [CrossRef]
- Underwood, V.J.; Ober, H.K.; Miller, D.L.; Munn, I.A. Contributions of Private Landowners to the Conservation of the Gopher Tortoise (Gopherus polyphemus). Environ. Manag. 2012, 49, 846–854. [Google Scholar] [CrossRef] [PubMed]
- Jin, L.R.; He, H.S.; Zong, C.; Zhou, Y.F.; Bu, R.C. Effects of different forest management alternatives on Sciurus vulgaris habitat. Chin. J. Appl. Ecol. 2008, 19, 949–955. (In Chinese) [Google Scholar]
- Li, Y.K. The Impact of Timber Harvest on Wapiti Winter Habitat Selection. Master’s Dissertation, Northeast Forestry University, Harbin, China, 2005. (In Chinese). [Google Scholar]
- Li, Y.H.; Wu, W.; Xiong, Z.P.; Hu, Y.M.; Chang, Y.; Xiao, D.N. Effects of forest roads on habitat pattern for sables in Da Hinggan Mountains, northeasten China. Chin. Geogr. Sci. 2014, 24, 587–598. [Google Scholar] [CrossRef]
- Pena, J.C.D.; Kamino, L.H.Y.; Rodrigues, M.; Mariano-Neto, E.; de Siqueira, M.F. Assessing the conservation status of species with limited available data and disjunct distribution. Biol. Conserv. 2014, 170, 130–136. [Google Scholar] [CrossRef]
- Silva, V.D.E.; Pressey, R.L.; Machado, R.B.; VanDerWal, J.; Wiederhecker, H.C.; Werneck, F.P.; Colli, G.R. Formulating conservation targets for a gap analysis of endemic lizards in a biodiversity hotspot. Biol. Conserv. 2014, 180, 1–10. [Google Scholar] [CrossRef]
- Wilson, J.W.; Sexton, J.O.; Jobe, R.T.; Haddad, N.M. The relative contribution of terrain, land cover, and vegetation structure indices to species distribution models. Biol. Conserv. 2013, 164, 170–176. [Google Scholar] [CrossRef]
- Michael, M.; Per, A. Defining benchmarks for restoration of green infrastructure: A case study combining the historical range of variability of habitat and species’ requirements. Sustainability 2018, 10, 326. [Google Scholar] [CrossRef]
Figure 1.
Tieli Forestry Bureau study area.

Figure 2.
Suitable habitat distribution map for roe deer in the Tieli Forestry Bureau, northeastern China.
Figure 2.
Suitable habitat distribution map for roe deer in the Tieli Forestry Bureau, northeastern China.
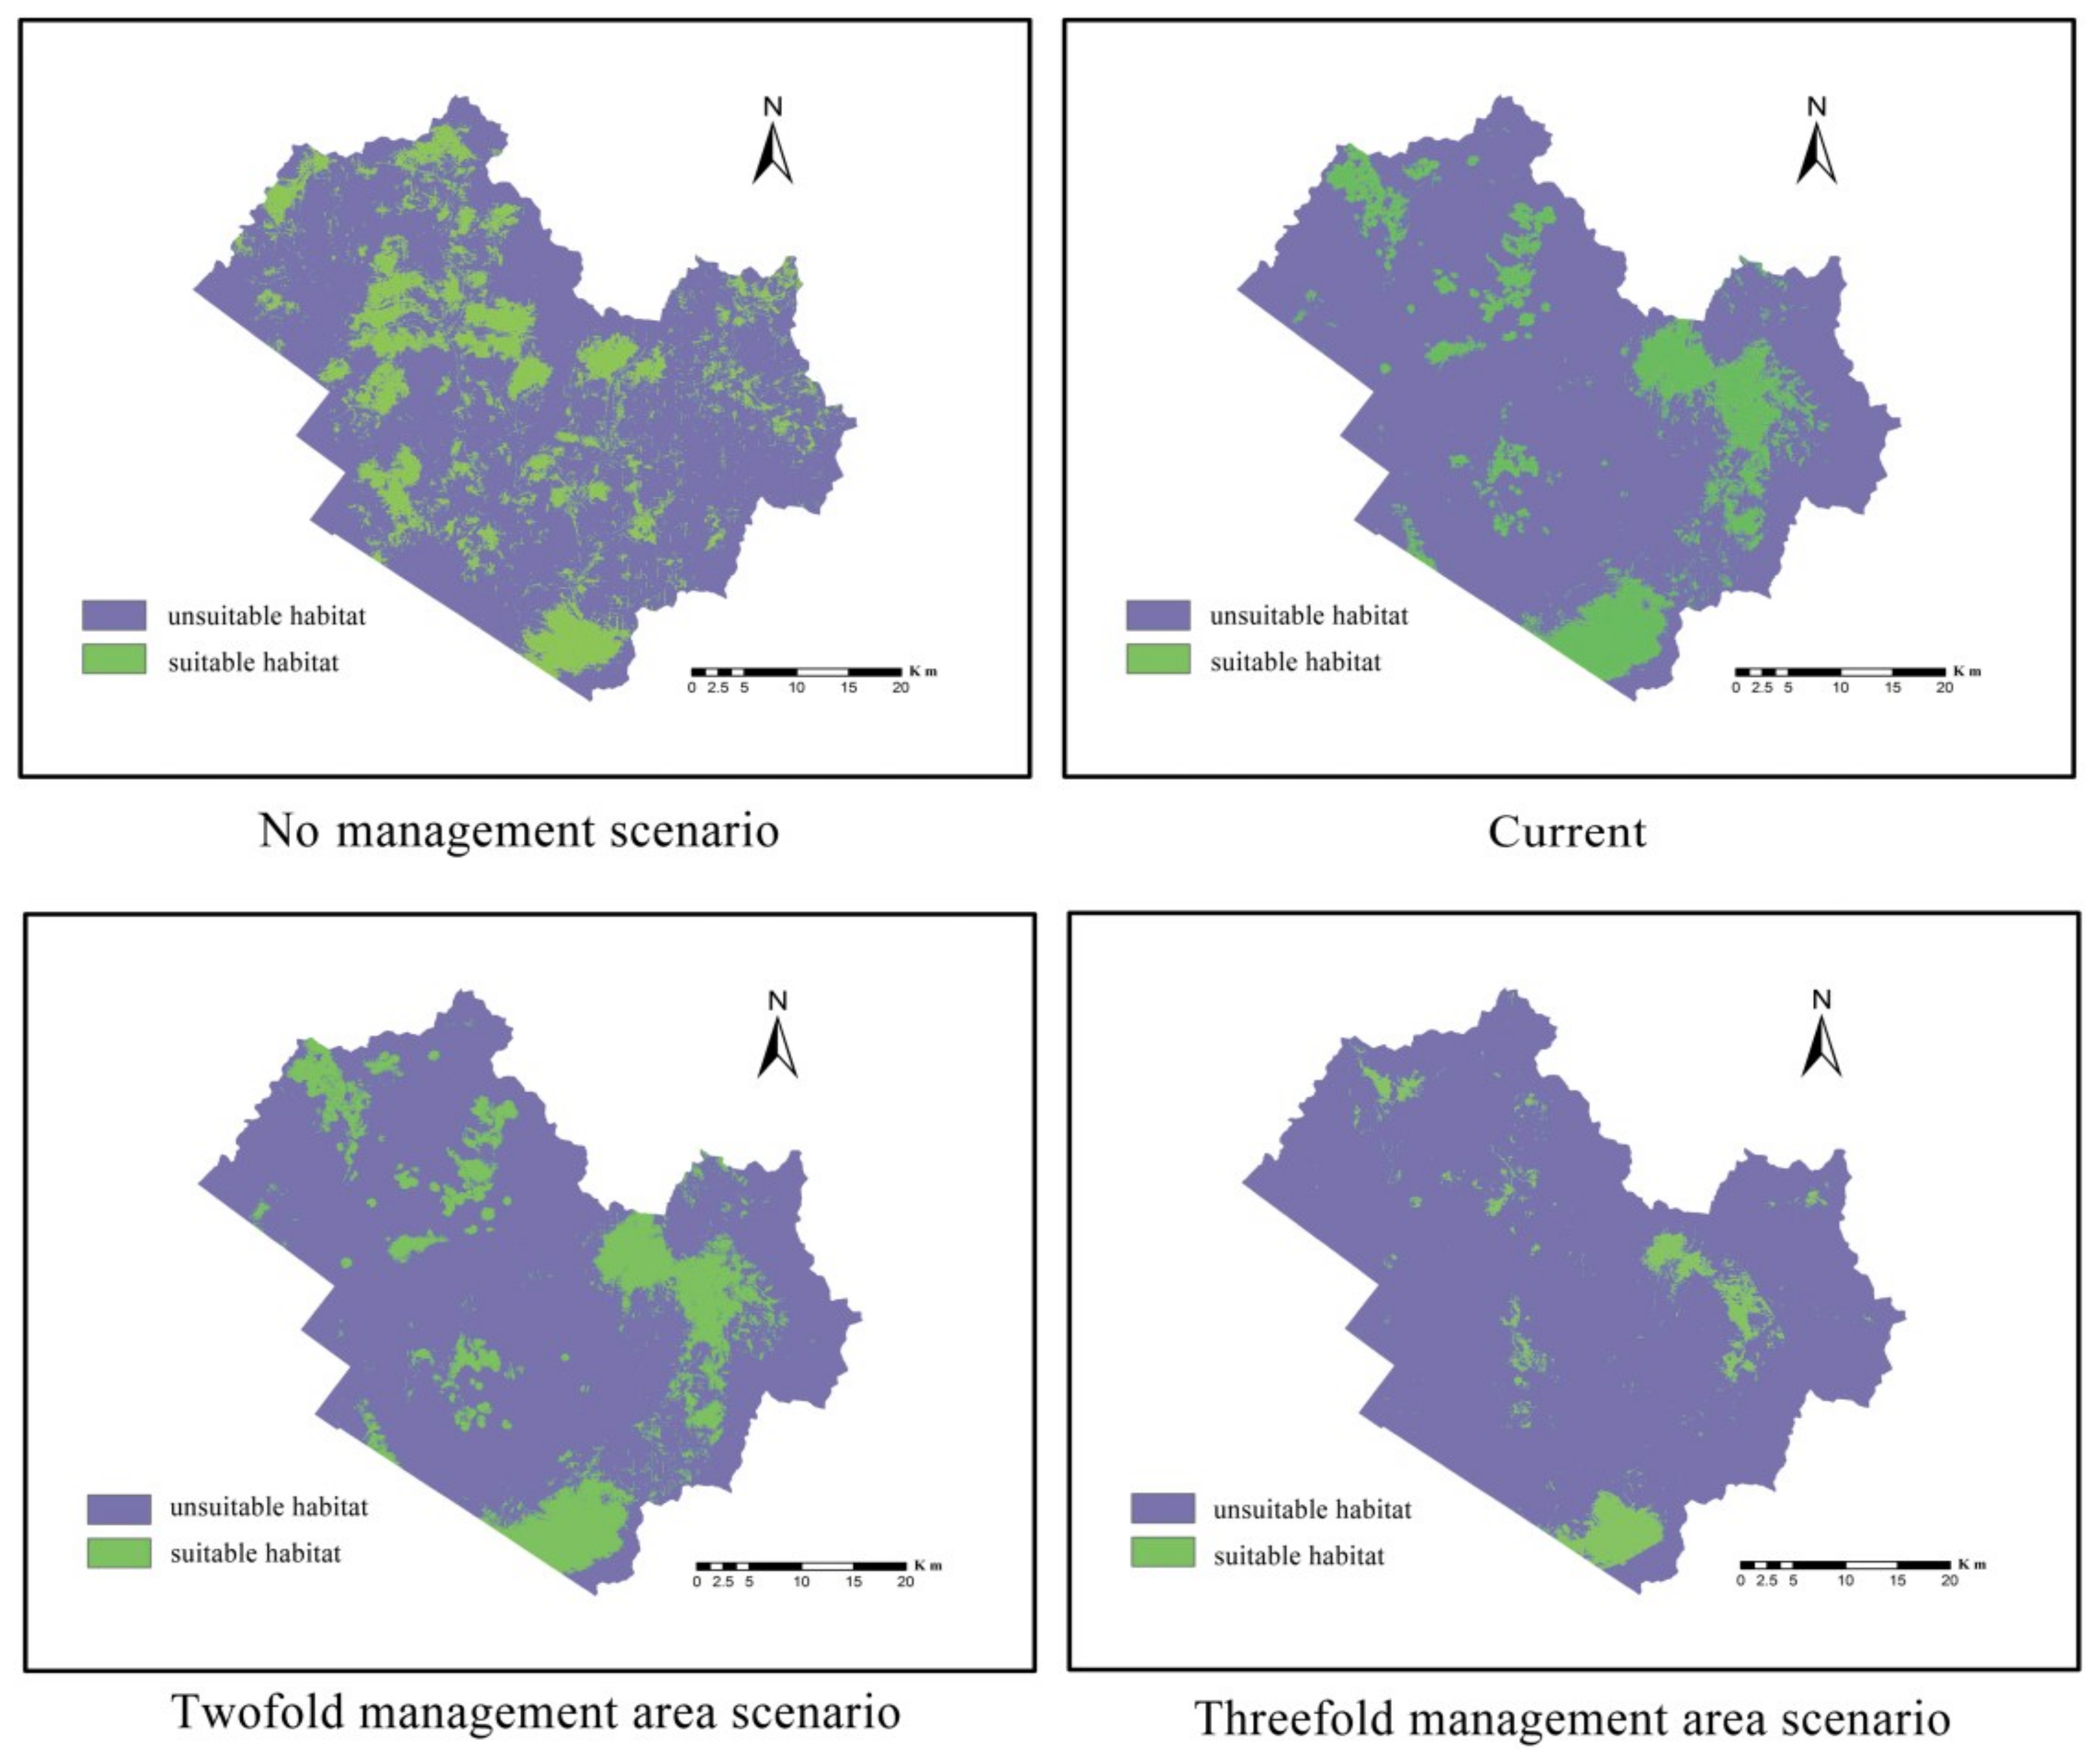
Figure 3.
Response curves of distance to management area factor in modeling (mean of 10 replicate runs (red) ± SD (blue)).
Figure 3.
Response curves of distance to management area factor in modeling (mean of 10 replicate runs (red) ± SD (blue)).

Table 1.
Average model prediction accuracy and Youden index.
| Scenario | Accuracy | Variance | Youden Index |
|---|---|---|---|
| No management | 0.933 | 0.057 | 0.393 |
| Current | 0.924 | 0.018 | 0.170 |
| Twofold management area | 0.951 | 0.028 | 0.146 |
| Threefold management area | 0.952 | 0.041 | 0.178 |
Table 2.
Area of each habitat grade under different scenarios (km2).
| Scenario | Suitable Habitat | Area (%) | Unsuitable Habitat | Area (%) |
|---|---|---|---|---|
| No management | 422.92 | 20.71 | 1619.42 | 79.29 |
| Current | 329.87 | 16.15 | 1712.47 | 83.85 |
| Twofold management area | 341.85 | 16.74 | 1700.49 | 83.26 |
| Threefold management area | 245.08 | 12.00 | 1797.26 | 88.00 |
Table 3.
Metrics of the habitat pattern at the class level.
| Scenario | Habitat Grade | PLAND (%) | AREA_MN (ha) | PD (Patches /km2) | ED (m/ha) | LSI | SHAPE_MN | ENN_MN (m) | AI |
|---|---|---|---|---|---|---|---|---|---|
| No management | Unsuitable | 77.73 | 26.38 | 2.95 | 40.40 | 53.56 | 1.08 | 69.16 | 96.03 |
| Suitable | 14.39 | 2.21 | 6.52 | 49.42 | 147.19 | 1.31 | 83.70 | 74.31 | |
| Current | Unsuitable | 83.57 | 41.08 | 2.03 | 19.58 | 25.99 | 1.07 | 68.4 | 98.18 |
| Suitable | 12.03 | 5.51 | 2.18 | 23.83 | 77.73 | 1.24 | 86.86 | 85.25 | |
| Twofold management area | Unsuitable | 83.23 | 64.74 | 1.29 | 17.99 | 24.05 | 1.11 | 72.61 | 98.32 |
| Suitable | 14.13 | 6.54 | 2.16 | 21.1 | 63.61 | 1.21 | 87.89 | 88.89 | |
| Threefold management area | Unsuitable | 92.46 | 136.93 | 0.68 | 10.94 | 14.69 | 1.11 | 72.26 | 99.05 |
| Suitable | 4.67 | 2.78 | 1.68 | 13.59 | 70.99 | 1.27 | 89.77 | 78.40 |
Table 4.
Landscape metrics for habitat pattern.
| Scenario | PD (Patches /km2) | ED (m/ha) | LSI | SHAPE_MN | ENN_MN (m) | AI |
|---|---|---|---|---|---|---|
| No management | 11.57 | 53.14 | 61.74 | 1.24 | 82.06 | 92.00 |
| Current | 4.96 | 24.27 | 29.20 | 1.16 | 81.95 | 96.33 |
| Twofold management area | 3.84 | 21.34 | 25.89 | 1.18 | 84.72 | 96.77 |
| Threefold management area | 2.74 | 13.94 | 17.56 | 1.22 | 89.64 | 97.87 |
© 2018 by the authors. Licensee MDPI, Basel, Switzerland. This article is an open access article distributed under the terms and conditions of the Creative Commons Attribution (CC BY) license (http://creativecommons.org/licenses/by/4.0/).
Share and Cite
MDPI and ACS Style
Wu, W.; Li, Y.; Hu, Y.; Xiu, C.; Yan, X. Impacts of Changing Forest Management Areas on Forest Landscapes and Habitat Patterns in Northeastern China. Sustainability 2018, 10, 1211. https://doi.org/10.3390/su10041211
AMA Style
Wu W, Li Y, Hu Y, Xiu C, Yan X. Impacts of Changing Forest Management Areas on Forest Landscapes and Habitat Patterns in Northeastern China. Sustainability. 2018; 10(4):1211. https://doi.org/10.3390/su10041211
Chicago/Turabian StyleWu, Wen, Yuehui Li, Yuanman Hu, Chunliang Xiu, and Xiaolu Yan. 2018. "Impacts of Changing Forest Management Areas on Forest Landscapes and Habitat Patterns in Northeastern China" Sustainability 10, no. 4: 1211. https://doi.org/10.3390/su10041211
Note that from the first issue of 2016, this journal uses article numbers instead of page numbers. See further details here.