Inward Greenfield FDI and Patterns of Job Polarization

European Commission, Joint Research Centre, 41092 Seville, Spain
*
Author to whom correspondence should be addressed.
Sustainability 2018, 10(4), 1219; https://doi.org/10.3390/su10041219
Submission received: 27 February 2018
/
Revised: 5 April 2018
/
Accepted: 8 April 2018
/
Published: 17 April 2018
(This article belongs to the Special Issue The Impact of Technological Change on Employment, Skills and Earnings)
Abstract
:The unprecedented growth in foreign direct investment in the last few decades has caused drastic changes in the labor markets of the host countries. The major part of FDI takes place in low-tech industries, where the wages and skills are low, or in high-tech, where they offer a wage premium for the highly skilled workers. This mechanism may increase the polarization of employment into high-wage and low-wage jobs, at the expense of middle-skill jobs. This paper looks at the effects of two types of FDI inflows, namely foreign investment in high-skill and low-skill activities, on job polarization. We match data on greenfield FDI aggregated by country and sector with data on employment by occupational skill to investigate the extent to which different types of greenfield FDI are responsible for skill polarization. Our results show that low-skill foreign investment shifts employment from high- to medium- and low-skill jobs, while skill-intensive FDI generally leads to skill upgrading. Only FDI in information and communication technology (ICT) is associated with job polarization, but only when accounting for the plurality of job polarization patterns across European sectors.
Keywords:
Foreign Direct Investment; Skills; European labor markets; Technological change; Globalization; Multinational enterprisesJEL Classification:
J21; J24; F16; F661. Introduction
The unprecedented growth in foreign direct investments (FDI) in the last few decades has caused drastic changes in the labor markets. The increased globalization has transformed the ways firms organize their operations, as many firms transfer some stages of production abroad. If, on one hand, FDI are considered to contribute to economic growth through the creation of employment and the transfer of technology and skills [1], on the other hand, they have resulted in growth of inequality and increased environmental degradation [2]. The attention has therefore gradually shifted from economic growth to sustainable development [3], and, while most of the work was initially focused on environmental aspects of globalization, it is now steering towards social sustainability, where policymakers face several challenges related to the labor markets. Indeed, the increased openness can exacerbate inequality and the vulnerability of domestic labor markets to external shocks [4].
Several studies have reported evidence on how globalization and multinational enterprises (MNEs) activities have increased both the volatility of employment, and the demand for skilled workers, widening the wage inequality between low- and high-skill wages, especially among advanced economies characterized by flexible labor markets [5,6,7]. A vast amount of literature has focused on how the increase in relative demand for domestic skilled labor is linked to the offshoring activities of MNEs [5,8,9]. There are many different views on the possible determinants of such increase. The most influential view dates back to the theoretical motivation of Skill-Biased Technical Change (SBTC) proposed by [10]. Their model predicts that, given the rapid adoption of computer technologies, industries that are initially intensive in routine task labor will reduce labor input of routine tasks, as they invest in computer capital. At the same time, they increase the demand for non-routine task labor input. The study of [11] revisits the theoretical framework proposed by [10] to explain the evidence of emerging skill polarization patterns and argue that the computer revolution has increased the relative labor demand for non-routine manual tasks, as these are not directly affected by technology. Their empirical predictions have been later confirmed by a number of studies that reported empirical evidence of polarizing patterns in Europe and the U.S. [8,9,12].
Another channel through which internationalization can influence job polarization is inward FDI. Inward FDI can stimulate the demand for more skilled workers, through the transfer of technology to the affiliates, technology spillovers to other domestic firms, and increased investment in technological capital [13,14,15].
While there are several studies that have examined the impact of inward FDI on skill upgrading and job polarization patterns [13,15,16,17], only the work of [18] has analyzed the relationship between inward greenfield FDI and host countries’ labor markets. As we know from the international trade theory [19,20], not all FDI are equal. Among other reasons, multinationals (MNEs) decide to invest abroad to access new markets, new knowledge and competencies [21], or to acquire specific resources (such as natural resources, raw materials or human capital) that are more abundant and cheaper in the host country. Different FDI activities may therefore have a diversified impact on the labor market. Indeed, MNEs might have a positive influence on host country relative demand for skilled labor, if inward FDI has an impact on technological change and if it is skill-biased [22]. Therefore, treating all FDI as skill upgrading only because MNEs have superior technology may oversimplify the link between inward FDI and the relative demand for skilled labor.
In this paper, unlike previous studies, we bring forward the hypothesis that while knowledge intensive/high-skill inward FDI increase the employment share of skilled labor, low-skill FDI activities may increase the share of unskilled labor. To test our hypothesis, we use data on inward greenfield FDI activities (a greenfield investment is the creation of a subsidiary from scratch by non-resident investors [23]) at the industry-country level for a set of European countries.
There are two clear advantages in the use of these data. The first one is that they are greenfield FDI and not cross-border mergers and acquisitions (M&A). FDI inflows have different impacts on the host countries depending on whether they are greenfield (new foreign firm) or cross-border M&A (foreign acquisition of an existing domestic firm). The traditional view on the impacts of FDI suggests that greenfield FDI is expected to have a direct impact on productivity, capital formation, and—most importantly—employment of host countries, while cross-border M&A only involves a change from local to foreign ownership of existing assets and production capacity [24,25]. Indeed, evidence shows that the acquisitions of local firms by foreign MNEs result in less employment of skilled labor because, when the headquarters move abroad, activities such as R&D and other functions using qualified employees are also relocated to the headquarter location [22]. The second advantage of these data is that the greenfield FDI projects are classified by their primary investment activities, such as manufacturing, construction, business services, R&D, etc. This distinction among activities gives us the possibility to assess if skill intensive activities, such as headquarters services and R&D, are associated with skill upgrading of labor, while low-skill activities such as manufacturing correspond to an increased share of medium- and low-skilled employment.
The second contribution of this paper consists in confirming the empirical finding of [26], who finds a plurality of patterns of structural employment changes in Europe, rather than the prevalent process of U-shaped polarization that is often found in the United States. However, differently from his study, we examine both country and sectoral patterns of employment structuring. In addition to skill upgrading and polarization patterns, at the sectoral level, we identify two additional trends, which we call skill ‘midgrading’ and ‘downgrading’. Skill midgrading is defined as a situation where the share of middle skill employment increases, while the shares of high- and low-skill jobs decrease or remain unchanged. (During the changes and transitions in the digital era, the term “middle-skill” has come to mean “digital skills”, and the marketplace for these new skill sets creates opportunities for individuals without a degree to demonstrate specific proficiencies, providing workers the ability to advance through their careers [27].) Skill downgrading is defined as a circumstance where the share of high-skill employment share decreases, while the share of low-skill employment increases. (The study of [28] explains how those sectors that were specialized in routine activities reallocated low-skill non-service labor into low-skill service occupations, whose demand “rose consistently and with growing velocity”.)
In the next section, we provide a brief conceptual background. Section 3 describes the data sources and the variable selection. Section 4 presents the descriptive and regression analyses of changes in employment shares by skill group in Europe and the link to high- and low-skill intensive greenfield inward FDI. Section 5 provides conclusions.
2. Background Studies on Job Polarization and FDI
Job polarization and the decreasing demand for middling occupations (such as operators of machinery/electronic equipment) are raising many concerns among policymakers. Changes in the composition of labor markets imply the adaptation of institutions, and labor market policies; at the same time, they present challenges on how to maintain flexible work arrangements to exploit the opportunities deriving from advances in technology and new ways of working. As a consequence, in the last decade, an increasing number of studies has examined the underlying causes of the hollowing-out of middle-skill occupations, pointing at a wide range of causes. Among them, the prevailing views on the determinant of such polarization are related to technological progress (the replacement of routine jobs due to the automatization of production processes; [10]) and/or to globalization (the decreased demand of jobs that are related to production segments and services offshored to other countries; [9,29]).
While [30,31,32] point to technological progress, rather than globalization, as the culprit for income inequality and skill bias, Refs. [33,34] argue that the outsourcing of intermediate inputs by domestic companies and exports are strong predictors of skill biases. The effect of international trade on wage inequality/skill bias has been examined in a number of studies. MNEs’ international activities may have a positive effects on domestic economies, as they spill-over some of their technology on domestic firms, which in turn raise their demand for skilled workers [35]. However, the impact largely depends on the absorptive capacity of domestic firms [36,37]. In addition, MNEs often pay higher wages [38,39,40] and this further contributes to the aggregate wage dispersion. Ref. [41], using U.S. manufacturing data from 1977 to 1994, test the impact of different types of FDI (greenfield or M&A) on skill upgrading. Despite the evidence from previous firm-level studies, they find that inward FDI did not contribute to the U.S. within-industry skill upgrading, with the exception of greenfield FDI from Japanese firms. While most of the studies have mainly considered the experiences of advanced economies, ref. [42] show that rising wage inequality and the demand for skilled workers in Mexico are linked to FDI inflows. Given the mixed results regarding the effect of FDI on wage dispersion, scholars have looked into differences between developed and less developed countries [43,44] or between OECD and non-OECD countries [45,46]. Overall, these studies find that, while inward FDI increases wage inequality in developing countries (even if this effect diminishes with further increases in FDI), the effects of FDI among developed countries are mixed.
Differences can be also found within the group of developed countries [47], by investment origin [48], and by industry characteristics [18,49]. In particular, positive effects of FDI on the reduction of wage dispersion are found in capital intensive industries that use highly skilled labor with comparatively higher bargaining power (e.g., car industry) [39,42]. However, the study of [50], p.18, finds that “while the characteristics of the industry seem to be more important than the attributes of multinationals relative to industry average, for large domestic firms the technology of the MNEs seem to be more important than the industry average. This role of capital intensity has often been hypothesised in the literature, but to the best of our knowledge no direct evidence has been provided to sustain this claim.”
Some studies have investigated the different impact of inward FDI on the demand for skilled jobs and wages by FDI characteristics. Indeed, different FDI activities may have a diversified impact on the labor market. For example, Refs. [21,22] show that MNEs might have a positive influence on the domestic demand for skilled labor if FDI inflows have an impact on technological change and if they are skill-biased. Therefore, treating all FDI as skill upgrading only because MNEs have superior technology may oversimplify the link between inward FDI and the relative demand for skilled labor. Although a vast amount of literature addresses the effects of FDI on the labor market (skill upgrading/wage inequality), to our knowledge, there is no study that investigates how different types of FDI (i.e., high-skill or low-skill intensive) affect high-, medium-, and low-skill employment shares of host countries.
3. Data
We match data from three different data sources. Data on cross-border greenfield investment projects announced and validated during the period from January 2003 till December 2014 comes from the fDi Markets database. (fDi Markets is an online database maintained by fDi Intelligence, a division of the Financial Times Ltd.) fDi Intelligence collects available information on investments since 2003 and monitors cross-border investments covering all sectors and countries worldwide, relying on company data and media sources. The database is used as the data source in UNCTAD’s (United Nations Conference on Trade and Development) World Investment Report , in publications by the Economist Intelligence Unit and in recent academic research [51,52]. The database is an ongoing collection of information on the announcements of corporate investment projects from 2003. The data are at a project level; however, to match the information with other data sources, we aggregate the total number and value of the projects per sector, country and year. fDi Markets contains information on the capital invested and the number of jobs created by the specific project from source to destination countries, states, regions, and cities. The projects are classified by the investment activities (e.g., R&D, design, development and testing, sales and marketing, etc.).
Among the 18 different activities, we selected six types of greenfield FDI. More specifically, as a low-skill intensive activity, we chose greenfield FDI in manufacturing. Among other low-skill intensive investment types (i.e., extraction, construction), manufacturing is the largest one. The other five selected investment activities are the most high-skill intensive greenfield activities. Table 1 reports the name of the activity and the corresponding definition. Given the definitions of R&D and DD&T activities, we group them together as R&D.
Data on employment by occupational skills are extracted from the ILOstat (International Labour Organization) annual indicator on employment by economic activity and occupation. The International Standard Classification of Occupations 2008 (ISCO-08) provides a system for classifying and aggregating occupational information, and grouping occupations into skill levels. (A skill level is defined as a function of the complexity of tasks to be performed in the corresponding occupation. Given the international character of the classification, the ten major occupational groups are categorized in four broad skill levels. Therefore, occupations range from skill level 1, which corresponds to simple and routine physical or manual tasks, to skill level 4 which matches occupations that require extensive knowledge and involve complex problem-solving, creativity and decision-making.) The annual data on employment by skills is collected for each country and organized by main aggregate economic activity. (ISIC Rev.4 at 1 digit, e.g., A—Agriculture, forestry and fishing, B—Mining and quarrying, C—Manufacturing, and so on.)
Finally, information on wages, capital, production, and R&D—to proxy the knowledge base or technological level of local industries—come from two OECD databases. The first is the OECD Main Science and Technology Indicators database (OECD-MSTI), which provides information on the activities of the OECD countries in the field of science and technology such as R&D expenditures. The second is the database for Structural Analysis (STAN), which includes measures of output and inputs at the industry level. From this database, we extract the value added, the gross capital stock, wages, and the production volume.
4. Analysis of European Economic Area’s Job Structure and Greenfield FDI Inflows
4.1. Patterns of Jobs Reallocation
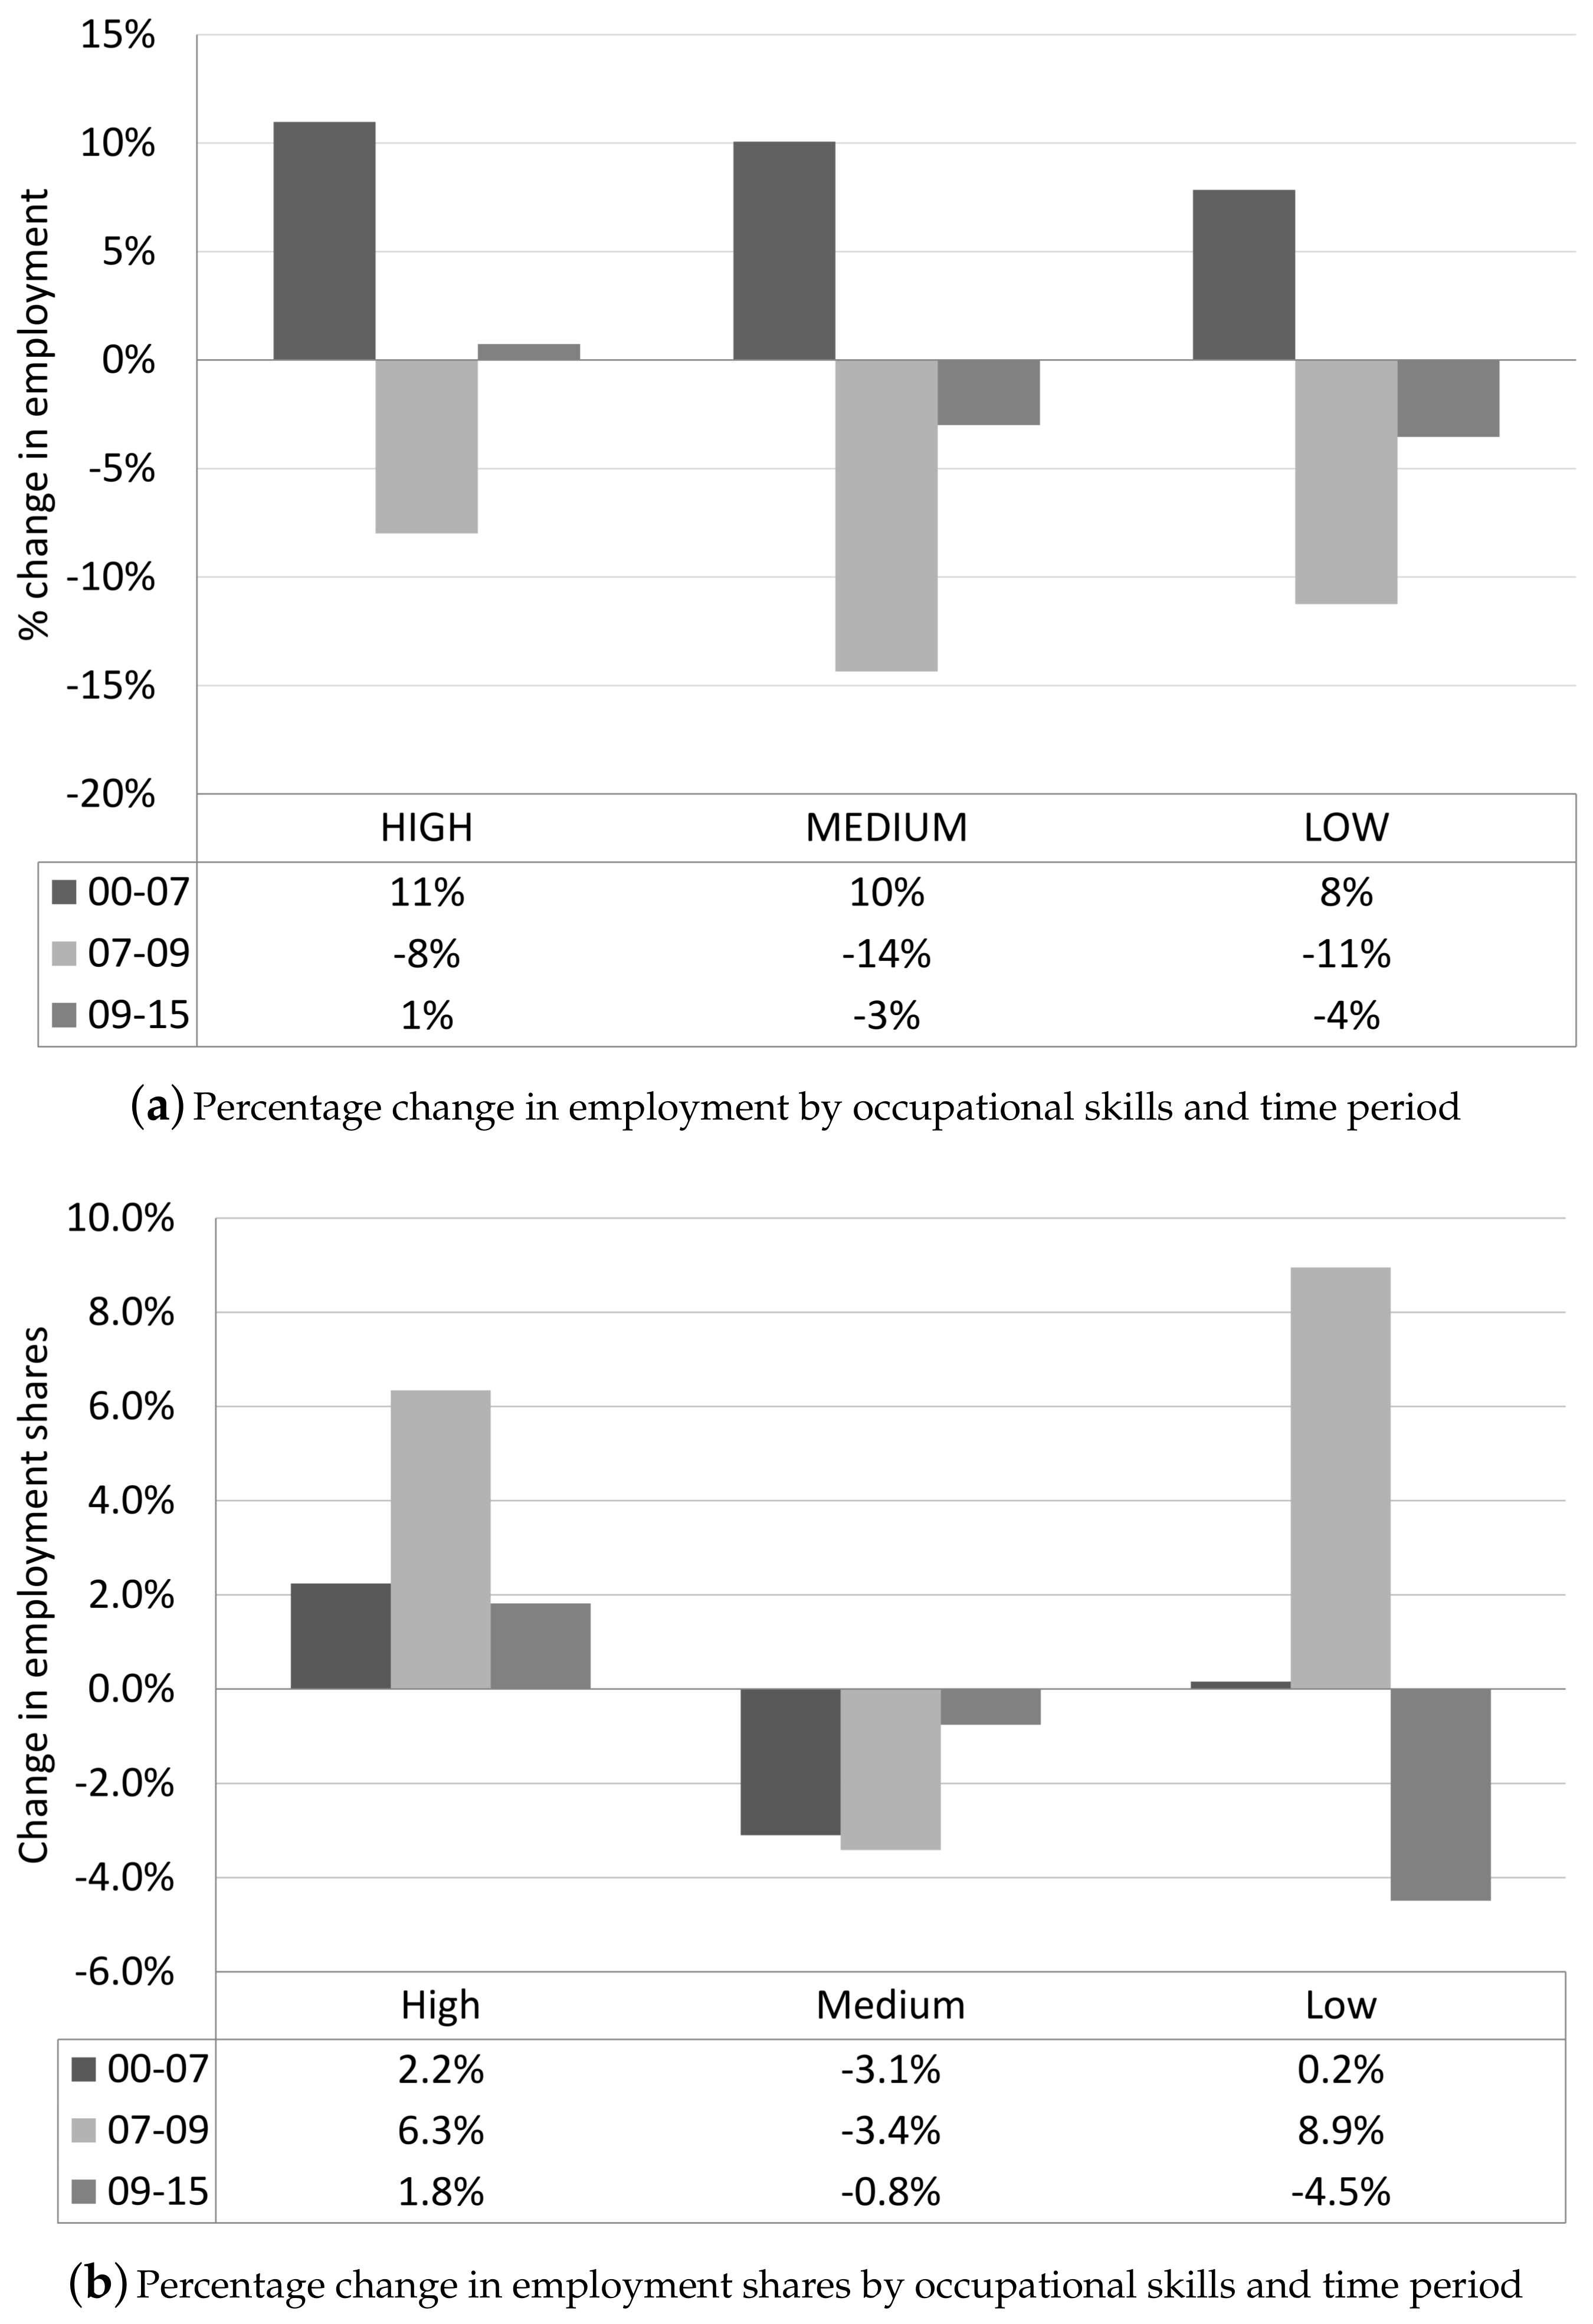
During the observed period 2000–2015, there have been some important changes in the labor market in Europe. Figure 1a shows the percentage growth in total employment by occupational skills before, during and after the crisis.
Overall, in all three categories of occupational skill, the employment has suffered the consequences of the crisis and is currently under recovery. However, employment in high-skill jobs grew by 1 percent during the period 2009–2015, outpacing the employment change in medium- and low-skill jobs, which are still picking up. Figure 1b confirms that, in the last period (2009–2015), employment expanded mainly at the top of the occupational hierarchy, among managers and professionals.
The evidence of job polarization in Europe and U.S.—jobs concentrated in relatively high-skill jobs and low-skill jobs—reported by previous studies [7,9] seems to match only the period 2000–2009 of our sample, where the U-shaped employment shares growth is evident. However, the more recent data presented in this paper shows that, in the last period (2009–2015), Europe has increased its employment of skilled workers at the expense of job opportunities for middle and low skilled workers, pointing to skill upgrading rather than polarization.
Hence, the rigid technological argument of polarization, where machines are a substitute for labor in the middle of the employment structure, does not fit with the evidence based on the most recent data presented here. Moreover, Table 2 and Table 3 show that there is more than one pattern across countries and sectors, suggesting that technology may not be the sole driving force of structural employment change. The work of [26] emphasizes the structuring effect of institutional frameworks, which is largely neglected in the polarization arguments. Indeed, institutions like unions and employment protection legislation can make labor markets less responsive to technological changes. State regulation also has a direct effect on labor market composition, as it may create or reallocate jobs within certain occupations, whose function depends on politically defined social needs.
Examining the changes in employment shares by country (Table 2), we find the emergence of two main patterns of employment reallocation, namely skill upgrading and polarization. Skill upgrading occurs when employment shares in medium- and low-skill jobs decrease over the period 2000–2015, while that of high-skill employment increase. Skill polarization is the situation where the relative share of middling jobs falls, while high- and low-skill employment shares increase. Table 2 reports the initial averages (in 2000) and the percentage point changes between 2000 and 2015 of the employment shares in high-, medium- and low-skill occupations by country and by patterns of job reallocation. Overall, the changes in employment structure, via polarization or skill upgrading, vary considerably across countries in the European Economic Area. For example, while the Netherlands, Ireland and Slovakia had little to no change in their labor market composition, countries like Norway, Luxembourg, Portugal, Iceland and Slovenia experienced drastic changes.
Table 3 shows the within and between industry differences in employment shares. Differently from other studies, we investigate the changes in the shares of skilled, unskilled and middling employment within sectors, and categorize them into patterns of restructuring. Skill upgrading sectors are information and communication, financial and insurance services, construction, and public administration. The sector of information and communication, in particular, has undergone a radical face-lift, going from being a sector with predominantly middle-skill workers, to becoming a high-skill sector with a high-skill employment share of 82% in 2015. Polarizing sectors such as the manufacturing one are undergoing an important transformation. On the one hand, the computerization of manufacturing, the inclusion of new advanced materials and technologies, and the current trend of automation and data exchange in manufacturing technologies increased the demand for high skilled workers. On the other hand, the international fragmentation of the production processes within vertically integrated manufacturing industries generally involves the relocation of unskilled labor-intensive production to countries where labor costs are relatively low. At the same time, it retains the production activities that require domestic high skills. Mining and quarrying, and electricity and gas are also skill polarizing sectors, as they have lost between 4.1 and 31.6 percentage points of the share of middling occupations.
In addition to skill upgrading and polarization patterns, we identify two additional trends, which we called skill ‘midgrading’ and ‘downgrading’. Skill midgrading is defined as a situation where the share of middle skill employment increases, while both the shares of high and low skill jobs decrease or remain unchanged. Real estate, education, technical, professional, and other services belong to this group of sectors. These sectors are characterized by large shares of high-skill occupations (apart from other service). Possibly as a consequence of national investment in high-quality education and training, there has been a redistribution from low-skill to middle-skill jobs, as the share of high-skill employment dropped less than the shares of low-skill workers. Moreover, the middle skill jobs in these sectors may be less susceptible to machine replacement, given the relevant non-routinized human component of jobs such as teachers and instructors, legal advisors and representatives, or real estate advisors.
Sectors with a trend of increasing low-skill employment share are business support services, wholesale and retail, accommodation and food services, agriculture, transport and storage, and water supply and waste management. These sectors are characterized by a relatively large initial average share of medium-skill employment, but they are also some of the sectors that have the highest proportion of jobs facing potential high risks of automation, especially accommodation and food services. In addition, the sector of water and waste management has suffered the negative effect of environmental reforms and climate change, which reduced water availability and intensified competition for water among users, leading to a reduction of job opportunities [54].
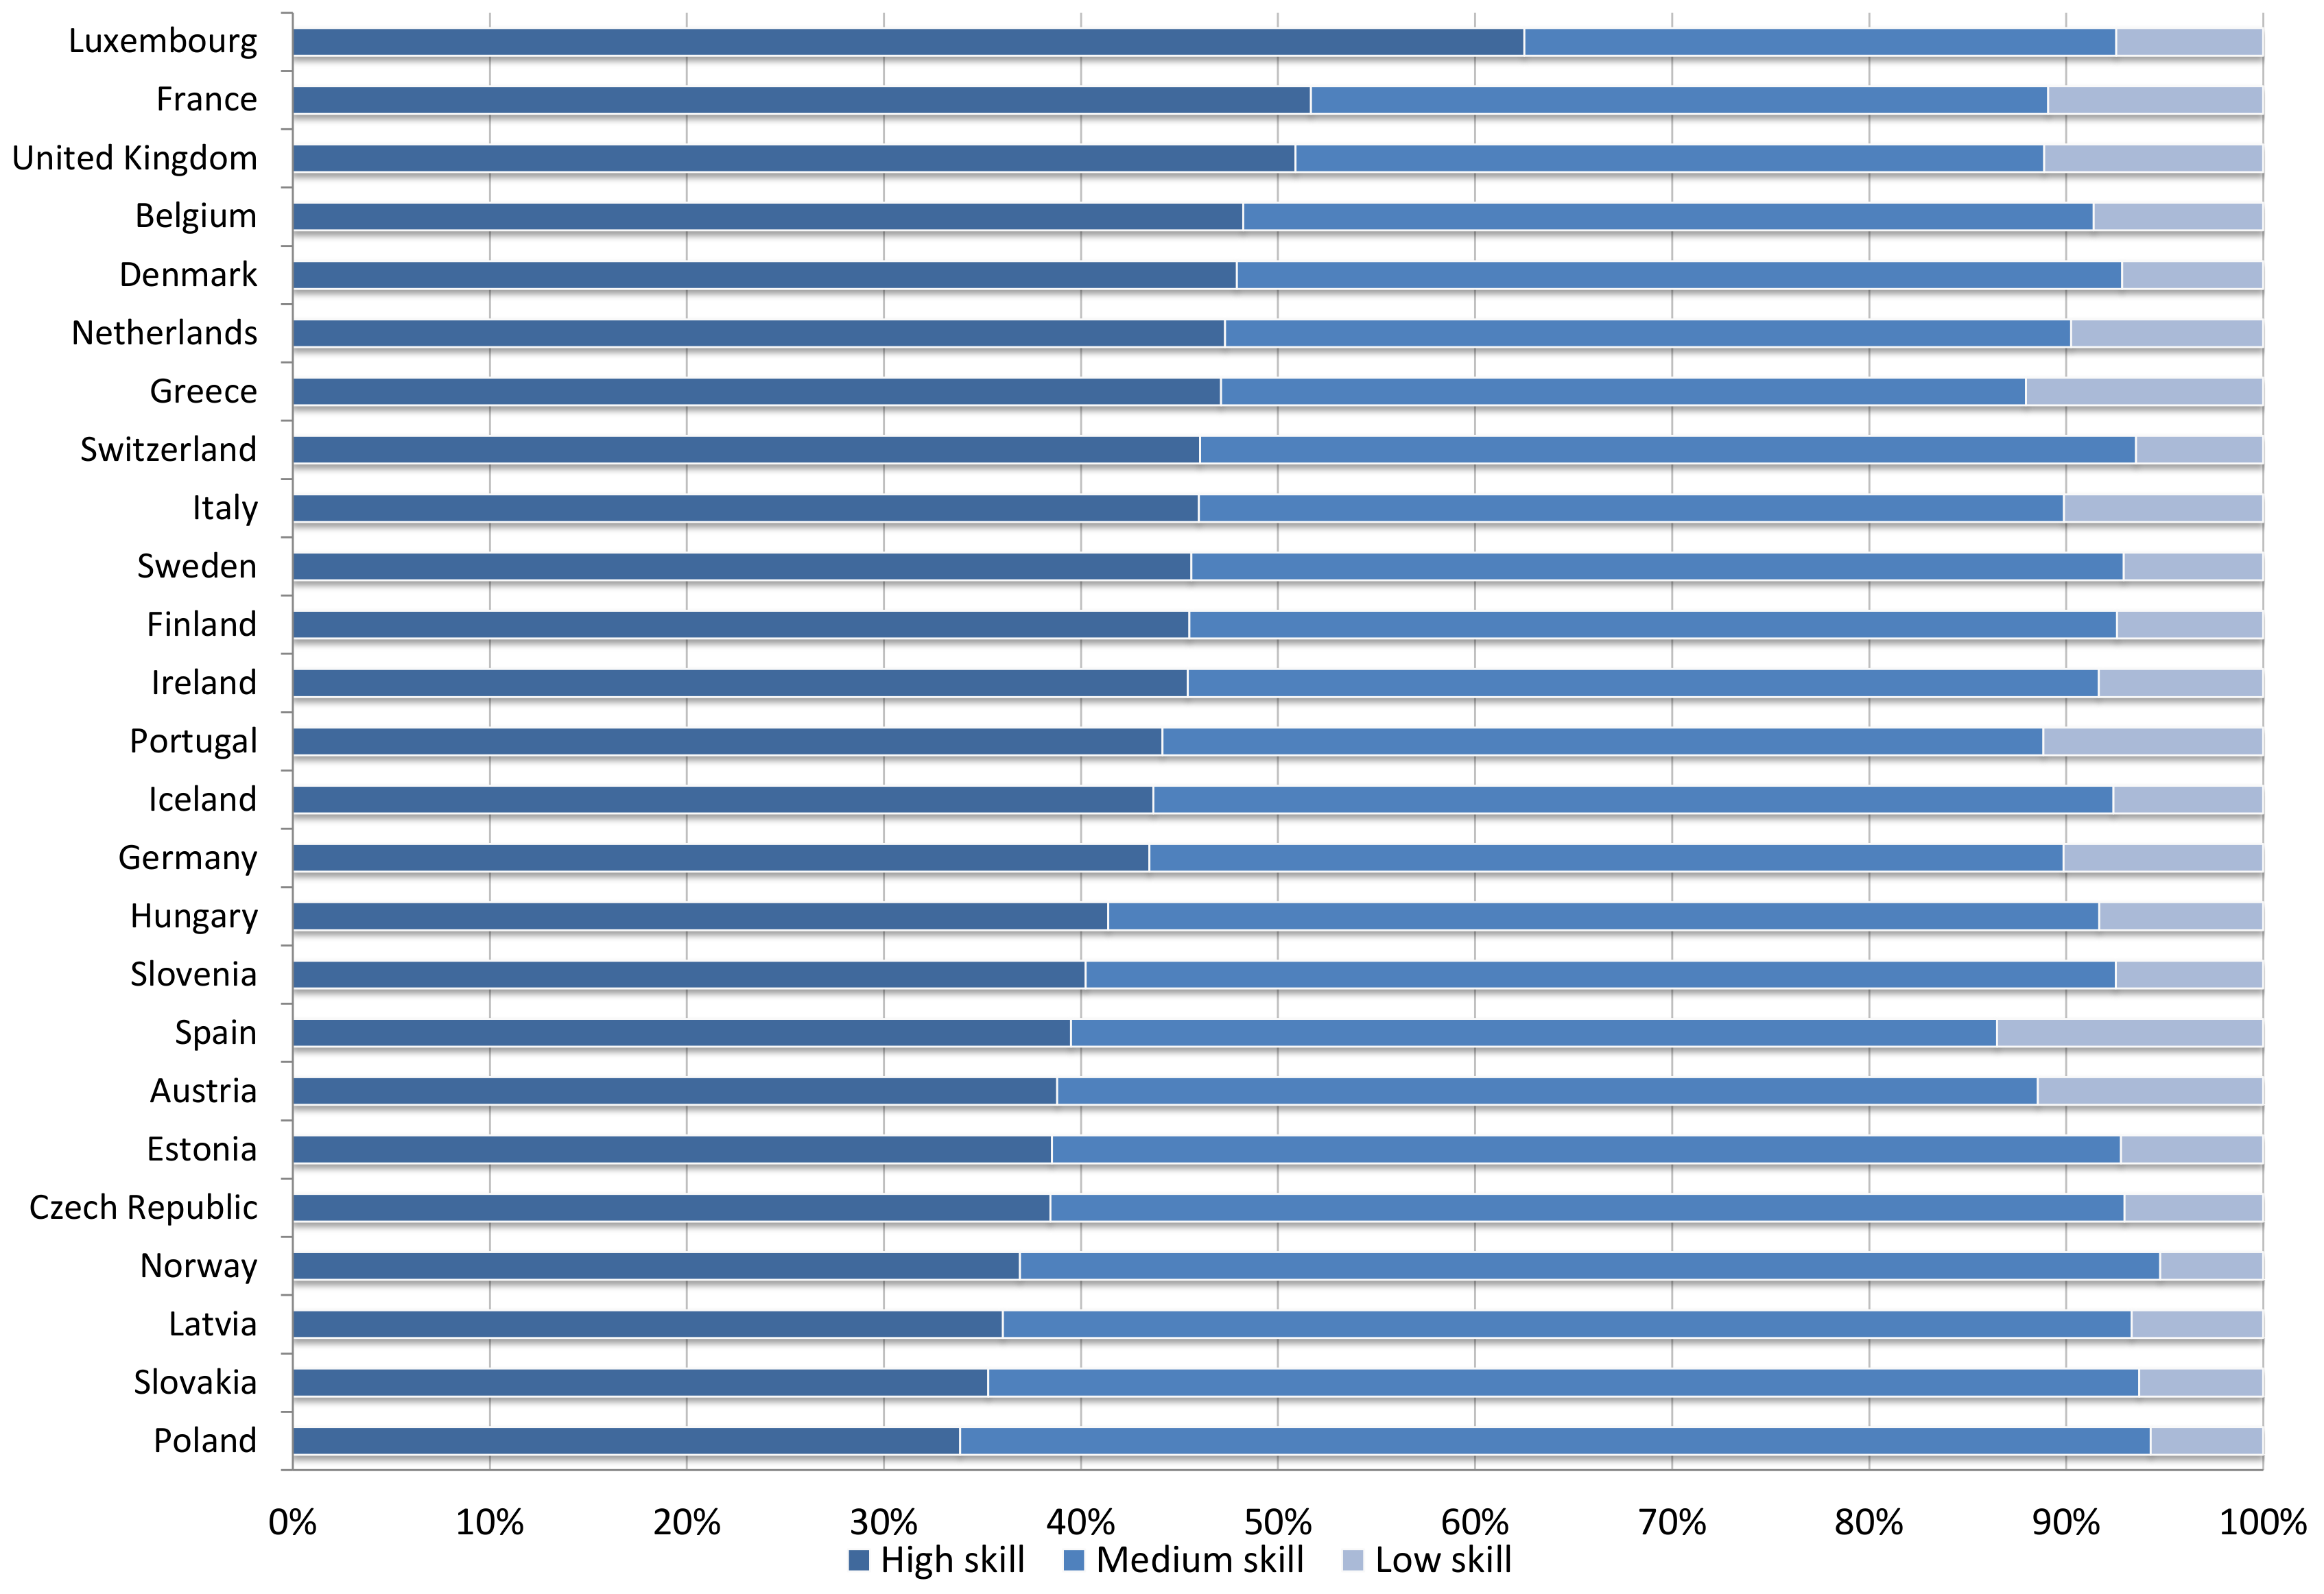
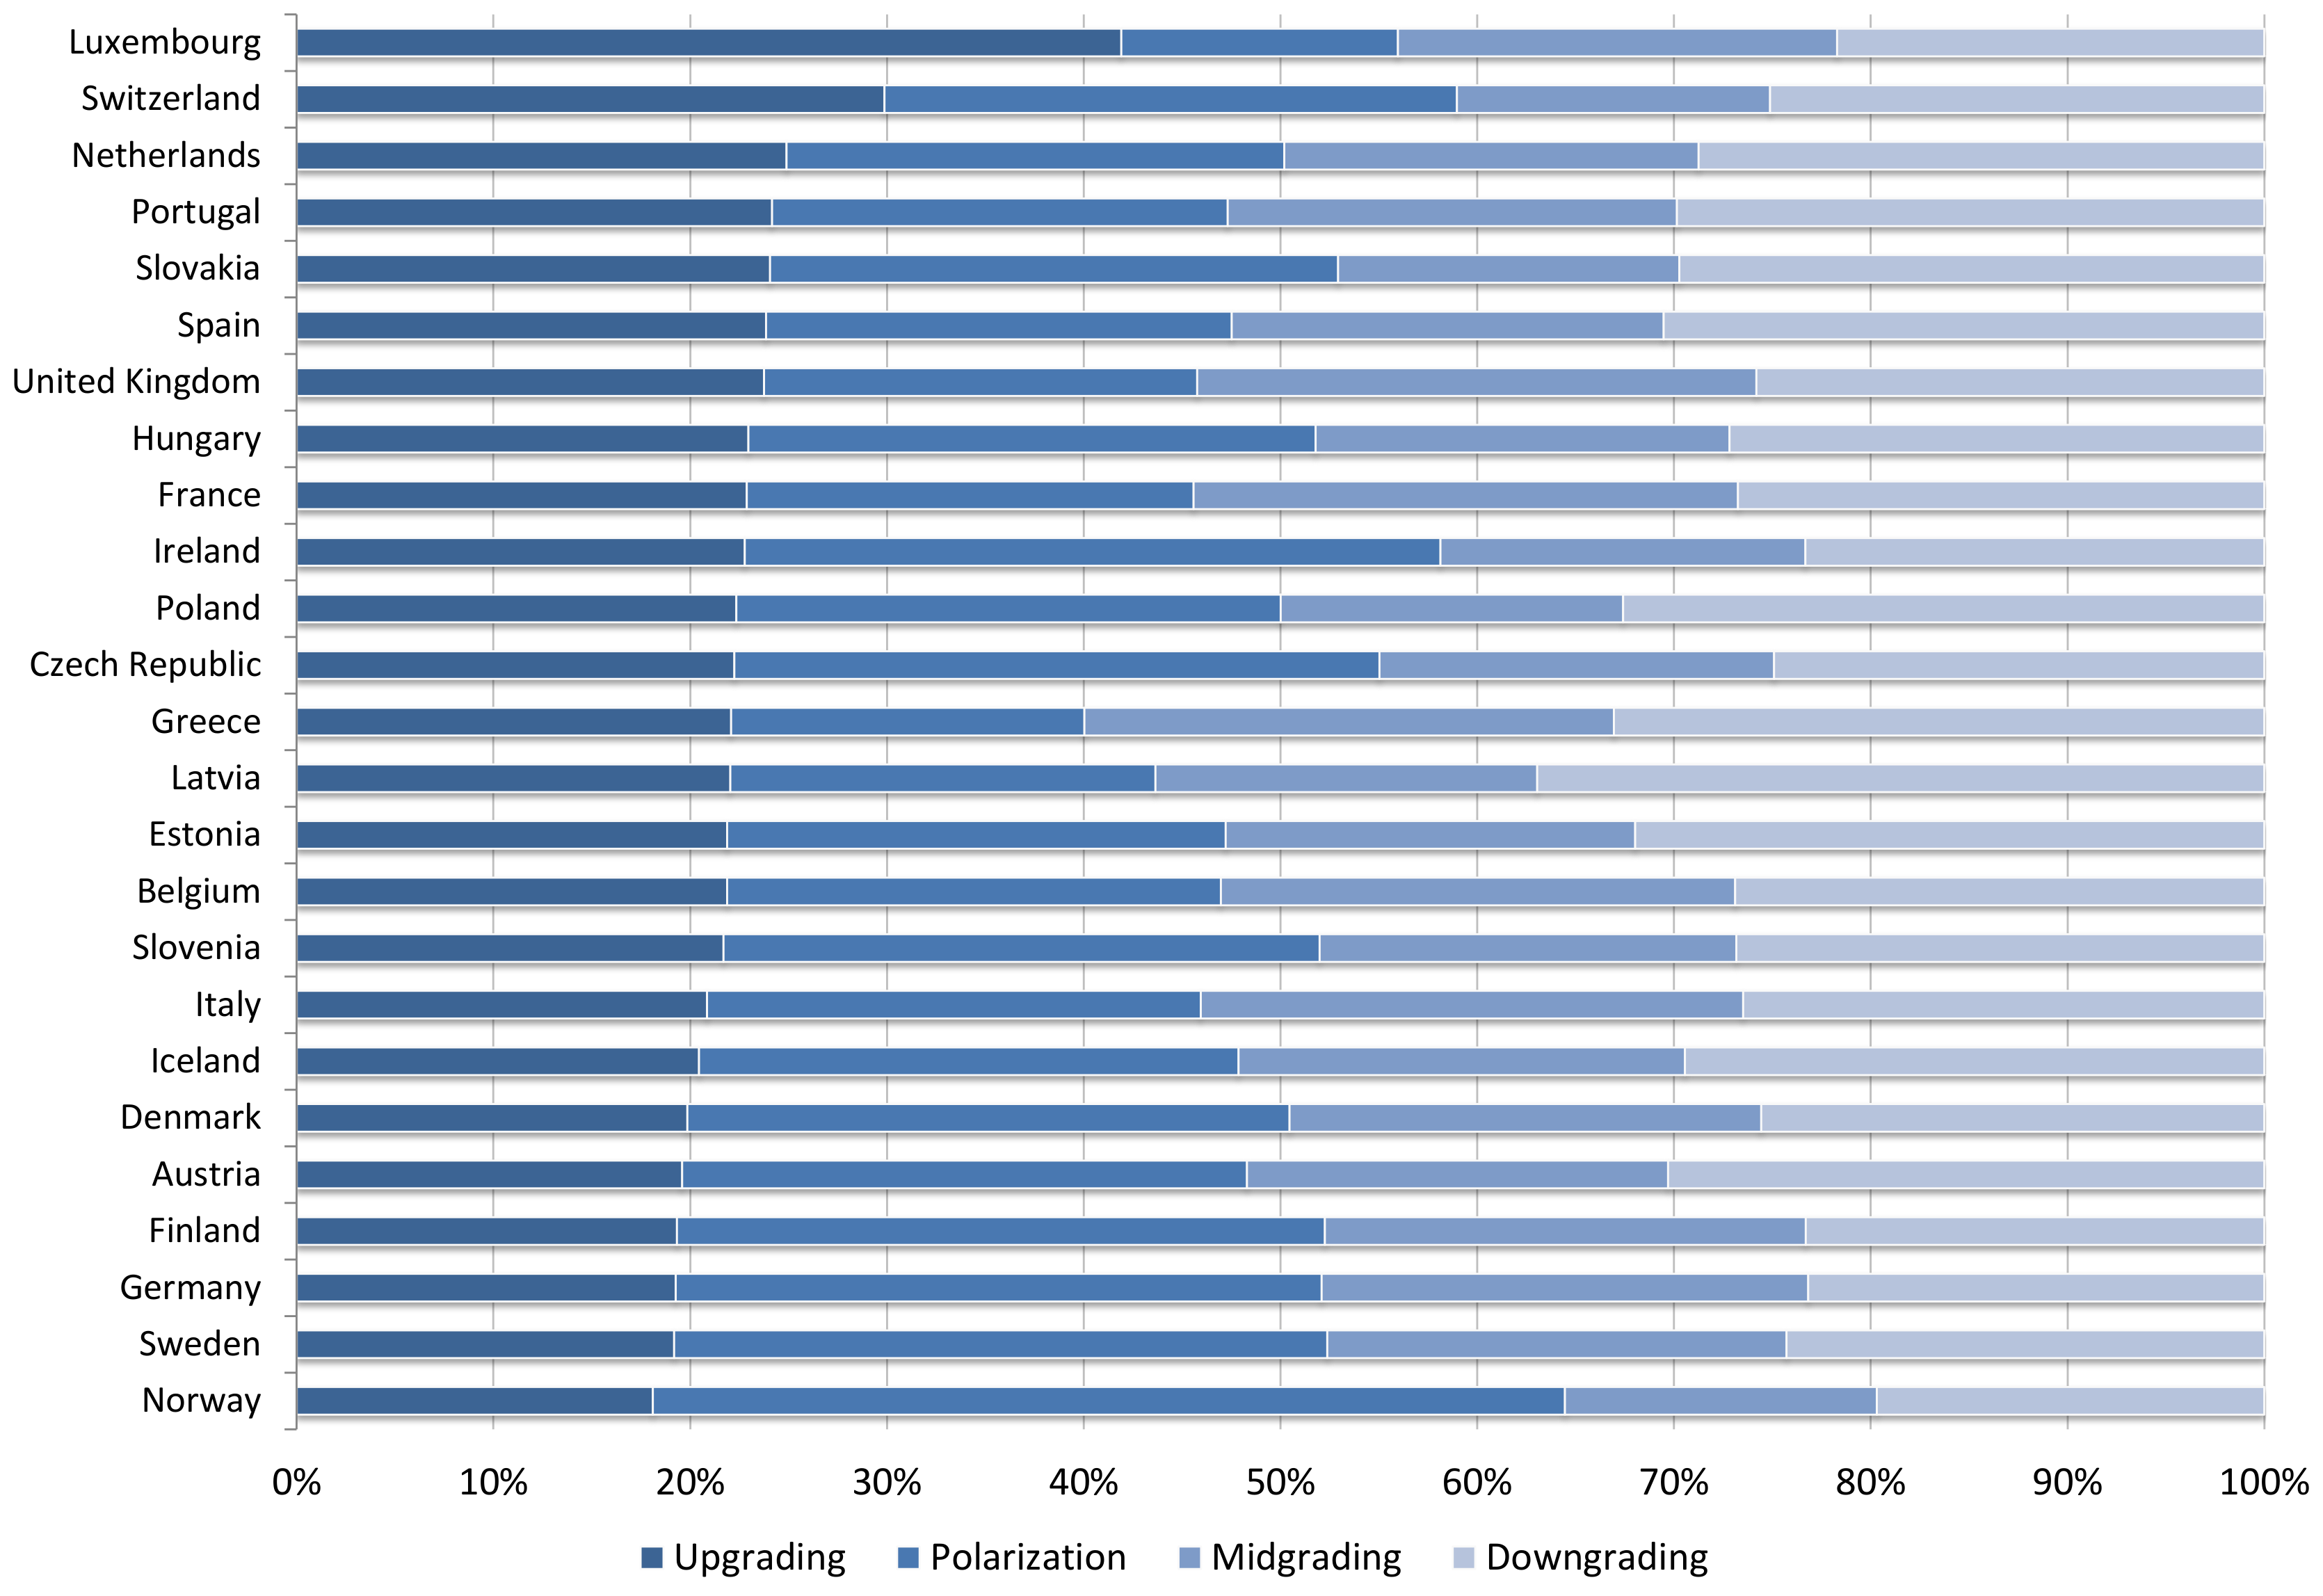
To connect the evidence on country and sectoral pattern of jobs reallocation, Figure 2 and Figure 3 show the shares of value added by group of sectors and country. Figure 2 lists the countries in order of value added in sectors with the largest shares of high skill employment. (Sectors are defined “high skill” if they have at least an average of 50 percent employment in high skill occupations, “medium skill” if they have at least 50 percent employment in medium skill jobs and less than 10 percent in low skill occupations, “low skill” if they have at least 10 percent of low skill employment share.) Figure 3 lists the countries by value added in skill upgrading sectors defined in Table 3. Overall, the two sector classifications give divergent pictures. For example, while the United Kingdom has the third largest value added in sectors with high skill employment share (Figure 2), it also has a low value added in sectors that have experienced skill upgrading and one of the largest added values in midgrading sectors.
In conclusion, we find that, rather than a unique polarizing pattern, there are several trends in the labor markets within countries and sectors. There are two patterns (skill upgrading and polarization) within countries, and four patterns within sectors. Examining the sectoral structure of each country, we were not able to detect any regularity among the job reallocation patterns, pointing to the striking evidence that, contrary to previous studies, there is no uniform trend of European employment structures.
4.2. Inward Greenfield FDI in High and Low Skill Intensive Activities
Most of the literature explains the skill upgrading and polarization phenomena with the skill-biased technological change, offshoring and/or routinization of medium skill intensive activities. Another channel through which the increased internationalization may affect the relative demand for skills is inward FDI. This is attributed to the assumption that MNEs use higher levels of technology and require relatively more skilled labor than domestic firms. However, not all FDI should be treated as equal. Labor-intensive, low-cost, low-skill manufacturing FDI may increase the demand for unskilled labor, while capital-, knowledge- and skill-intensive FDI may lead to more demand for high-skill workers.
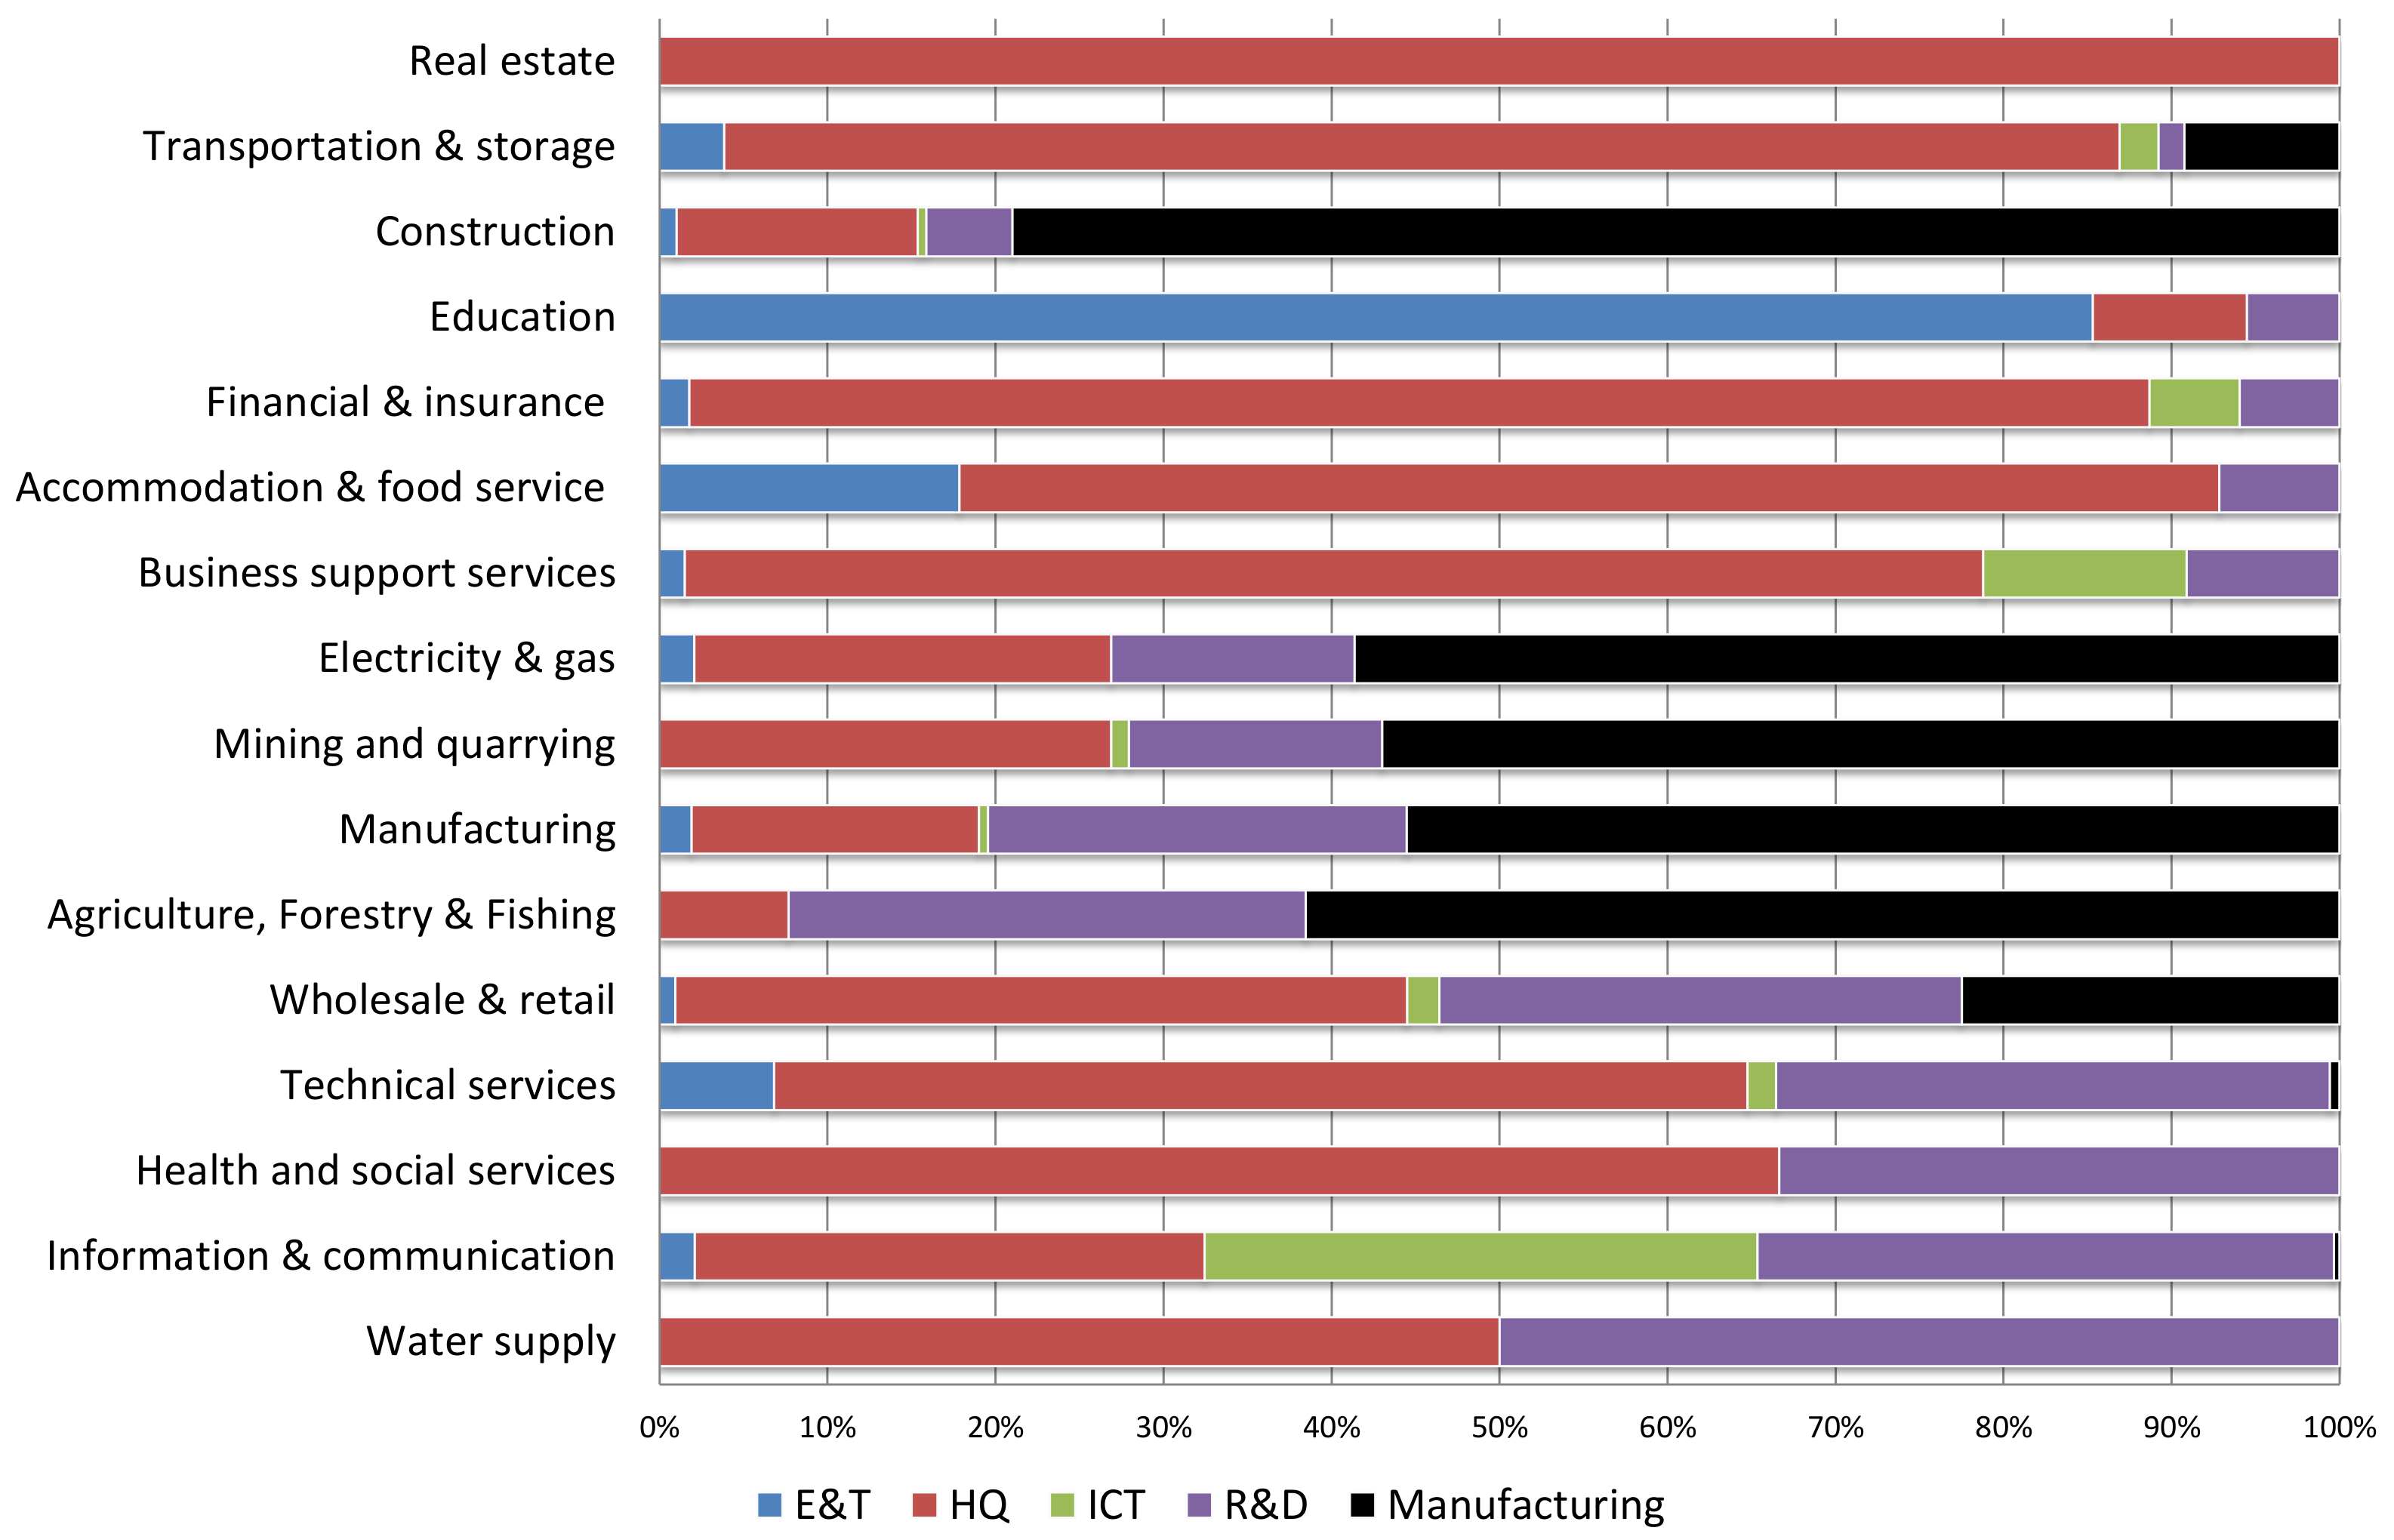
During the period 2003–2014, countries in the Europe received nearly 10,000 greenfield investment projects—of which more than 40% in manufacturing activities—corresponding to approximately Euro 370 billion and more than 1 million jobs. Table 4 reports the total number of greenfield FDI projects, jobs and total amount of capital expenditure, by investment activity. (Table A1 in the Appendix reports the number of projects by investment activity and country. Figure A1 reports the shares of FDI projects by investment activity and destination sector.) We grouped the investment activities into high-skill and low-skill intensive. High-skill intensive activities are Education & Training (E&T), Headquarters (HQ), information and communication technology (ICT) and R&D activities. Low-skill activities are related to production and manufacturing processes. Despite the similar number of HQ and R&D greenfield projects, HQ activities have created a larger number of jobs with less capital invested compared to R&D activities.
Greenfield projects in ICT have the largest amount of capital per project (92 Euro millions per project), while FDI in manufacturing activities creates the highest average number of jobs per project. The last two columns compare the average number of created jobs per project and capital investment per job across FDI activities. FDI in ICT have the highest capital per job, while FDI in manufacturing creates the largest number of jobs per project.
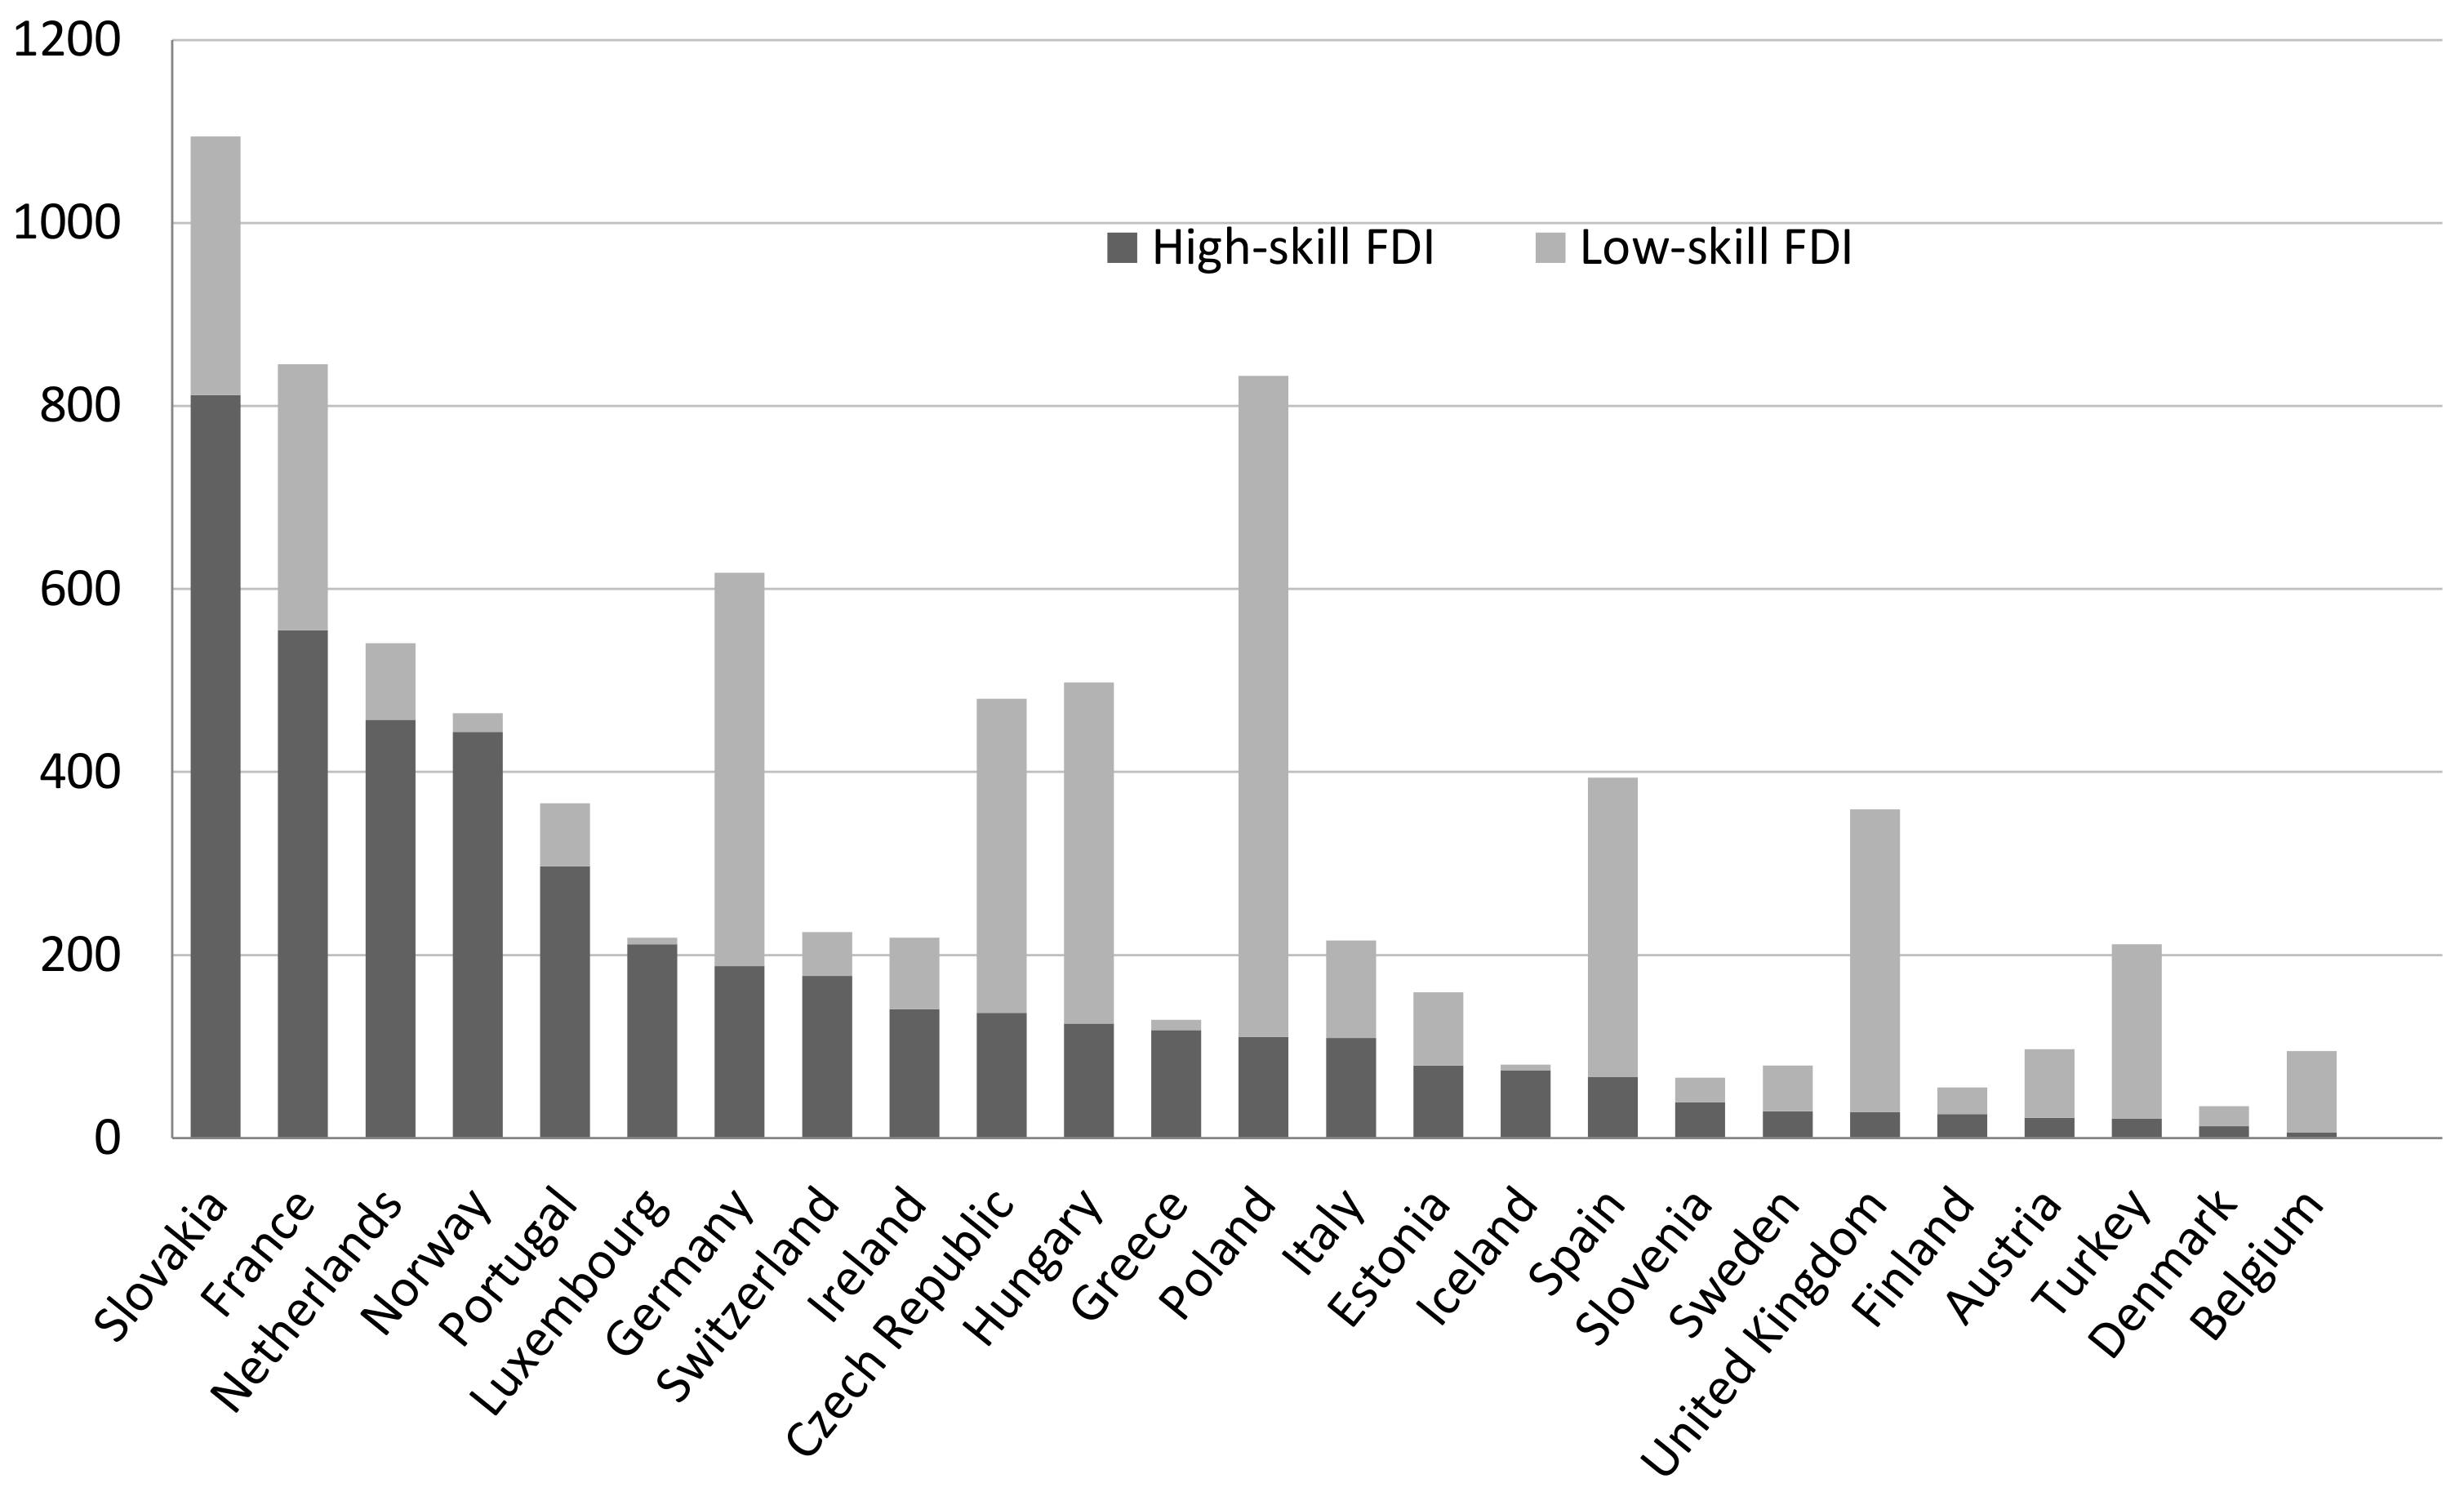
Figure 4 shows the number of inward greenfield FDI in high-skill and low-skill activities during the period 2003–2014 by destination country. The countries are ordered, from left to right, by the total number of high-skill intensive greenfield projects received. Slovakia is the country that received both the most projects overall and the most high-skill intensive greenfield projects, while Poland has received mainly FDI in low-skill activities. In the next subsection, we analyze the link between different types of inward greenfield FDI and the patterns of job polarization of the European labor markets.
4.3. The Link between High- and Low-Skill Intensive Greenfield FDI and Employment Shares
Our empirical analysis borrows the methodological framework of previous studies on SBTC. Differently from previous empirical analyses, we assume, for the purpose of this study, that inward greenfield FDI activities rather than offshoring are the factors that shift the demand for skilled or unskilled labor. For each time period t, the representative firm operates in sector j of country c and produces a certain output using capital, skilled, medium skilled and unskilled labor, and a specific level of technology. Under the assumptions of short-run translog cost function, linear price homogeneity and symmetry, the employment share of skill type (high, medium, low) takes the following functional form:
where w is the log of national-accounts-based total wage bill, k and r are respectively the logs of gross capital stock and R&D intensity (R&D expenditure over value added), which proxy the level of technology, q is the log of value added (all variables are deflated), and is the log number of inward greenfield FDI projects of type . (We also use different measures of FDI inflows such as log of capital investment or log of number of jobs created by the MNEs FDI projects. These additional results are used mainly to check the robustness of the analysis and are available upon request.) The error term includes country, sector and year fixed effects. In addition, we use lagged independent variables, not to solve the endogeneity issues, but because we believe that it may take at least a year before the local labor markets react to MNEs’ investment. Indeed, lagging independent variables would yield causal identification only if there were serial correlation in the potentially endogenous explanatory variables and no serial correlation among the unobserved sources of endogeneity. Therefore, all our results are best interpreted as associations rather than causal relationships. Table 5 displays the results of a generalized least squares estimation of Equation (1), which allows for heteroskedasticity among the residuals. The left part of the table reports the results of a simpler specification where greenfield FDI are regressed on the share of high-, medium- and low-skill employment. The right part displays the results from the full specification, which controls for wage, capital, value added, and technology (R&D intensity). The control variables have the expected signs. (The interpretation of the coefficients is the following: for a 1% increase in the number of FDI (wages, capital, value added, or R&D intensity), the employment share increases/decreases by percentage points.) As in [55], we find a positive and statistically significant relationship of R&D intensity and capital to the demand for high-skill labor. Contrary to his results for Japanese manufacturing industries, we find that the industry scale of production (q) is positively related to demand for skilled workers, indicating that European sectors would require more skilled workers should the market expand. Differently from previous studies [17,18], we cannot disaggregate wages into low-, medium- and high-skill wages. In general, we find that wages are negatively related to the demand of skilled employment and positively related to the demands of medium- and low-skill employment.
Concerning the effect of FDI on the employment shares by skill group, we find that FDI in R&D increases the share of high-skill workers, while it decreases the share of medium-skill employment. Manufacturing investment corresponds to a lower share of high-skill employment, and to higher shares of medium- and low-skill employment. FDI in ICT activities seems to correspond to a larger (smaller) share of medium-skill (high-skill) employment. Finally, investment in E&T reduces the share of low-skill occupations. When including the wage, capital, value added and R&D intensity, the sample reduces to around 2200 observations (3000 observations lost) because of missing data in the OECD databases. However, the inclusion of this set of regressors does not change the statistical significance nor the sign of the effect of greenfield FDI on shares of employment.
The results from Table 5 seem to point to a shifting effect of FDI activities. In particular, FDI in ICT decreases the share of high-skill employment and increases that of medium-skill employment (a 1% increase in the number of ICT projects corresponds to a decrease of 1.4 percentage points in the share of high-skill employment and to an increase of 1.1 percentage points in the share of medium-skill occupations). This finding is in contrast to previous empirical studies claiming that ICT investments are associated with an increase in labor demand of high-skill employees and polarization [9,56,57,58]. On the other hand, FDI in R&D have the expected upgrading effect, as they are positively related to the demand for high-skill workers, while they decrease the share of medium-skill jobs by 1.7 points.
To test polarization patterns, in Table 6, we report the results of regressing FDI inflows on the ratio between high- and medium-skill , between low- and medium-skill , and between high- and low-skill employment .
If all FDI had a polarizing effect, we would find a positive coefficients for both and . (The interpretation of the coefficients differs from that of Table 5, as , , and are ratios and not shares. Their mean values are 1.8, 0.27 and 12, and range from 0 to 62, 5.6 and 464, respectively. In this case, a 100% increase in the number of FDI (wages, capital, value added, or R&D intensity) generates a change in the ratios , , and .) However, we find evidence of skill upgrading due to FDI in Education & Training (E&T), which reduces low-skill employment share compared to the medium-skill one, while it increases the share of high-skill over low-skill workers. We also find that FDI in manufacturing and headquarter activities does not have a polarizing effect, rather a downgrading one (an 100% increase in the number of manufacturing or HQ projects generates a decrease in the ratio of almost 0.9 or 0.6, respectively). The role of FDI in ICT and R&D is, on the other hand, more difficult to interpret, as these investments seem to have a midgrading and downgrading effect, respectively. However, up to now, we have considered the employment shares to be independent from each other, and we have also omitted the relevance of sectoral structural changes [59] that we observed in Section 4.1.
To take into account the correlation among shares of employment across the three skill groups, we estimate Equation (1) using a simultaneous system of seemingly unrelated regression (SUR) equations. Results are reported in Table 7 and Table 8. Moreover, to account for differences in effects among the four sectoral job polarization patterns, we group the sectoral dummies into four dummy variables, upgrading, polarization, midgrading (downgrading is chosen as base dummy variable). For example, polarization equals 1 if the sectors are mining & quarrying, electricity & gas, manufacturing, or health services; 0, otherwise (see Table 3).
As before, Table 7 reports the results for the individual shares of employment. Results remain fairly unchanged: foreign R&D investments increase the demand for high-skill jobs, while reducing that of middling occupations; manufacturing activities increase the shares of medium- and low-skill employment shares; E&T reduces the demand for low-skill jobs; and FDI in ICT has a negative effect on high-skill employment share and a positive effect on the medium-skill one.
However, when considering the sectoral patterns of labor market structuring, we find that E&T activities are not only decreasing the share of low-skill workers, but, at the same time, they increase the share of high-skill employment. FDI in ICT has now the same effect of R&D, which is positive on high-skill employment and negative on middling occupations. These results are more in line with the findings in the literature. In addition, FDI inflows in HQ reduce the share of low-skill occupations.
Table 8 confirms that E&T activities are skill upgrading (increase the ratio and decrease , shifting resources from low- to medium- to high-skill employment). Foreign investment in manufacturing continues to have a downgrading effect on labor composition. The relationship between job polarization trends and FDI in ICT depends on the inclusion of the dummies of sectoral structural changes. When omitting the employment structure characteristics, FDI in ICT shifts the employment from high- to medium- and from high- to low-skill jobs. When we include the sectoral structural change dummies, ICT activities have a polarizing effect, in line with the routinization hypothesis.
5. Conclusions
Empirical studies have reported evidence of job polarization in U.S. and Europe. The evidence has been matched by a theoretical framework that explains the underlying dynamics. The main views are, on the one hand, that technological change sparked a long-term shift from routine to non-routine tasks, whereby workers are becoming more concentrated in either high-paid/high-skill jobs or low-paid/low-skill non-routine jobs. On the other hand, the increasing internationalization of commercial activities has changed the job structure in the richest countries because they relocate low-skill occupations to developing countries, where labor costs are lower. The relocation of middle- and low-skill activities caused an upward shift in the demand for high-skill jobs.
Another channel through which the increased internationalization may influence the job restructuring is inward FDI. While there are several studies that have examined the impact of inward FDI on skill upgrading and job polarization patterns [13,15,16,17], only the work of [18] has analyzed the relationship between inward greenfield FDI and host countries’ labor markets. The advantage of using greenfield FDI is that, differently from cross-border mergers and acquisitions, the decision to open a new facility abroad (i.e., greenfield) is mainly dependent on the relative factor prices, rather than competition or technology acquisition. However, not all greenfield FDI should be treated as equal. Labor-intensive, low-cost, low-skill manufacturing FDI may increase the demand for unskilled labor, while capital-, knowledge- and skill-intensive FDI may lead to more demand for high-skill workers. In this paper, we test this assumption, by studying the relationship between inward greenfield FDI in five distinct activities (one low-skill and four high-skill intensive activities) and the share of employment by occupational skill of European countries.
Overall, this paper contributes to the literature on internationalization and job polarization in Europe, by providing new evidence on the role of greenfield FDI for the relative demands of skills. Our empirical analysis provides two main relevant results. First, we find that European countries have experienced a polarization of their labor markets up to the period right after the crisis. In the last few years (2009–2015), however, a skill upgrading pattern emerges. Moreover, we find that, rather than a unique polarizing pattern, there are several trends in the labor markets within countries and sectors.
Second, we find evidence that FDI in R&D and education and training activities contribute to skill upgrading, while manufacturing activities lead to skill downgrading, by increasing the relative demand of low-skill workers. We also find that, when considering the different sectoral labor market structural changes, foreign investment in ICT is the only activity that is associated with skill polarization.
Our interpretation is that, besides the technological upgrade brought about by high-skill FDI activities or the increased demand for low-skill employment due to manufacturing FDI, there are additional country- and sector-specific dynamics that contribute to or withhold from the polarization of jobs. Indeed, technology and the skill intensity of international activities may not be enough to explain structural employment change and other factors, such as institutional frameworks, may play a role in the employment composition by making labor markets more or less responsive to technological change.
Finally, our empirical investigation is not without limits. First, data on employment by occupational skills are only at country- and sector-levels, leaving the regional heterogeneity unexplored—second, despite the empirical evidence on the plurality of job polarization trends across countries and sectors calling for an investigation of the role of institutional framework, which is not accounted for in this paper and is left for future exploration.
Acknowledgments
We are grateful to the guest editor Marco Vivarelli, the three anonymous reviewers and Nicola Grassano for their helpful suggestions. Any remaining errors are ours alone. The views expressed are purely those of the authors and may not in any circumstances be regarded as stating an official position of the European Commission.
Author Contributions
Sara Amoroso with the help of Pietro Moncada-Paternò-Castello conceived and directed the presented research project; Sara Amoroso analyzed the data and wrote the paper. Pietro Moncada-Paternò-Castello reviewed the background literature; all authors provided critical feedback and helped shape the research, analysis and manuscript.
Conflicts of Interest
The authors declare no conflict of interest.
Appendix A. Additional Tables

Table A1.
Greenfield FDI inflow in Europe (2003–2014, total number of projects) by country.
| FDI Activity | Manuf | HQ | R&D | ICT | E&T |
|---|---|---|---|---|---|
| Austria | 75 | 43 | 55 | 8 | 4 |
| Belgium | 89 | 72 | 82 | 22 | 12 |
| Czech Republic | 343 | 22 | 62 | 27 | 14 |
| Denmark | 22 | 81 | 50 | 5 | 1 |
| Estonia | 80 | 6 | 18 | 4 | - |
| Finland | 29 | 13 | 42 | 11 | 1 |
| France | 291 | 217 | 248 | 50 | 40 |
| Germany | 430 | 352 | 331 | 91 | 38 |
| Greece | 11 | 7 | 7 | 5 | 2 |
| Hungary | 373 | 17 | 64 | 15 | 13 |
| Iceland | 6 | - | - | 6 | - |
| Ireland | 78 | 195 | 214 | 38 | 10 |
| Israel | 6 | 1 | 73 | 3 | 2 |
| Italy | 107 | 26 | 80 | 17 | 18 |
| Luxembourg | 7 | 13 | 7 | 1 | 1 |
| Netherlands | 84 | 161 | 66 | 63 | 7 |
| Norway | 20 | 6 | 14 | 3 | 6 |
| Poland | 723 | 27 | 122 | 19 | 9 |
| Portugal | 69 | 3 | 16 | 3 | 4 |
| Slovakia | 283 | 9 | 18 | 9 | 3 |
| Slovenia | 27 | 4 | 6 | 3 | - |
| Spain | 327 | 178 | 199 | 43 | 24 |
| Sweden | 50 | 37 | 60 | 19 | 2 |
| Switzerland | 48 | 150 | 45 | 13 | 4 |
| Turkey | 191 | 21 | 37 | 10 | 6 |
| United Kingdom | 331 | 676 | 561 | 155 | 71 |
Figure A1.
Greenfield FDI by destination sector (2003–2014), share of projects.

References
- Wood, A. North-South Trade, Employment, and Inequality: Changing Fortunes in a Skill-Driven World; Oxford University Press on Demand: New York, NY, USA, 1995. [Google Scholar]
- Narula, K. ‘Sustainable Investing’ via the FDI Route for Sustainable Development. Procedia Soc. Behav. Sci. 2012, 37, 15–30. [Google Scholar] [CrossRef]
- Kardos, M. The Relevance of Foreign Direct Investment for Sustainable Development. Empirical Evidence from European Union. Procedia Econ. Finance 2014, 15, 1349–1354. [Google Scholar] [CrossRef]
- Bacchetta, M.; Jansen, M. Making Globalization Socially Sustainable; International Labour Organization (ILO) and World Trade Organization (WTO): Geneva, Switzerland, 2011. [Google Scholar]
- Autor, D.H.; Katz, L.F.; Kearney, M.S. The Polarization of the U.S. Labor Market. Am. Econ. Rev. 2006, 96, 189–194. [Google Scholar] [CrossRef]
- Crinò, R. Offshoring, multinationals and labour market: A review of empirical literature. J. Econ. Surv. 2009, 23, 197–249. [Google Scholar] [CrossRef] [Green Version]
- Acemoglu, D.; Autor, D. Skills, tasks and technologies: Implications for employment and earnings. In Handbook of Labor Economics; Elsevier: Amsterdam, The Netherlands, 2011; Volume 4, pp. 1043–1171. [Google Scholar]
- Goos, M.; Manning, A.; Salomons, A. Job Polarization in Europe. Am. Econ. Rev. 2009, 99, 58–63. [Google Scholar] [CrossRef]
- Goos, M.; Manning, A.; Salomons, A. Explaining job polarization: Routine-biased technological change and offshoring. Am. Econ. Rev. 2014, 104, 2509–2526. [Google Scholar] [CrossRef] [Green Version]
- Autor, D.H.; Levy, F.; Murnane, R.J. The skill content of recent technological change: An empirical exploration. Q. J. Econ. 2003, 118, 1279–1333. [Google Scholar] [CrossRef]
- Goos, M.; Manning, A. Lousy and Lovely Jobs: The Rising Polarization of Work in Britain. Rev. Econ. Stat. 2007, 89, 118–133. [Google Scholar] [CrossRef]
- Piva, M.; Santarelli, E.; Vivarelli, M. The skill bias effect of technological and organisational change: Evidence and policy implications. Res. Policy 2005, 34, 141–157. [Google Scholar] [CrossRef]
- Slaughter, M.J. Skill Upgrading in Developing Countries: Has Inward Foreign Direct Investment Played a Role? In Labor and the Globalization of Production: Causes and Consequences of Industrial Upgrading; Milberg, W., Ed.; Palgrave Macmillan UK: London, UK, 2004. [Google Scholar]
- Arnold, J.M.; Javorcik, B.S. Gifted kids or pushy parents? Foreign direct investment and plant productivity in Indonesia. J. Int. Econ. 2009, 79, 42–53. [Google Scholar] [CrossRef]
- Javorcik, B.S. Does FDI Bring Good Jobs to Host Countries? World Bank Res. Obs. 2015, 30, 74–94. [Google Scholar] [CrossRef]
- Blomström, M.; Kokko, A.; Mucchielli, J.L. The Economics of Foreign Direct Investment Incentives. In Foreign Direct Investment in the Real and Financial Sector of Industrial Countries; Herrmann, H., Lipsey, R., Eds.; Springer: Berlin/Heidelberg, Germany, 2003; pp. 37–60. [Google Scholar]
- Hakkala, K.N.; Heyman, F.; Sjöholm, F. Multinationals, skills, and wage elasticities. Rev. World Econ. 2010, 146, 263–280. [Google Scholar] [CrossRef]
- Davies, R.B.; Desbordes, R. Greenfield FDI and skill upgrading: A polarized issue. Can. J. Econ. 2015, 48, 207–244. [Google Scholar] [CrossRef] [Green Version]
- Dunning, J.H. Trade, Location of Economic Activity and the MNE: A Search for an Eclectic Approach. In The International Allocation of Economic Activity: Proceedings of a Nobel Symposium Held at Stockholm; Ohlin, B., Hesselborn, P.O., Wijkman, P.M., Eds.; Palgrave Macmillan UK: London, UK, 1977; pp. 395–418. [Google Scholar]
- Slaughter, M.J.; Ekholm, K. Host-Country Determinants of U.S. Foreign Direct Investment into Europe. In Foreign Direct Investment in the Real and Financial Sector of Industrial Countries; Herrmann, H., Lipsey, R., Eds.; Springer: Berlin/Heidelberg, Germany, 2003; pp. 7–35. [Google Scholar]
- Franco, C.; Rentocchini, F.; Marzetti, G.V. Why do Firms Invest Abroad? An Analysis of the Motives Underlying Foreign Direct Investments. IUP J. Int. Bus. Law 2010, 9, 42–65. [Google Scholar] [CrossRef]
- Bandick, R.; Hansson, P. Inward FDI and demand for skills in manufacturing firms in Sweden. Rev. World Econ. 2009, 145, 111–131. [Google Scholar] [CrossRef]
- IMF. Available online: www.imf.com (accessed on 16 April 2018).
- Norbäck, P.J.; Persson, L. Privatization policy in an international oligopoly. Economica 2005, 72, 635–653. [Google Scholar] [CrossRef]
- Ashraf, A.; Herzer, D.; Nunnenkamp, P. The effects of Greenfield FDI and cross-border M&As on total factor productivity. World Econ. 2016, 39, 1728–1755. [Google Scholar]
- Fernandez-Macias, E. Job polarization in Europe? Changes in the employment structure and job quality, 1995-2007. Work Occup. 2012, 39, 157–182. [Google Scholar] [CrossRef]
- Van Dijk, J.A.G.M.; van Deursen, A.J.A.M. Impact: Why Digital Skills Are the Key to the Information Society. In Digital Skills: Unlocking the Information Society; Palgrave Macmillan U.S.: New York, NY, USA, 2014; pp. 43–62. [Google Scholar]
- Autor, D.H.; Dorn, D. The Growth of Low-Skill Service Jobs and the Polarization of the U.S. Labor Market. Am. Econ. Rev. 2013, 103, 1553–1597. [Google Scholar] [CrossRef] [Green Version]
- Haile, G.; Srour, I.; Vivarelli, M. Imported technology and manufacturing employment in Ethiopia. Eurasian Bus. Rev. 2017, 7, 1–23. [Google Scholar] [CrossRef]
- Berman, E.; Bound, J.; Griliches, Z. Changes in the Demand for Skilled Labor within U.S. Manufacturing: Evidence from the Annual Survey of Manufacturers. Q. J. Econ. 1994, 109, 367–397. [Google Scholar] [CrossRef]
- Autor, D.H.; Katz, L.F.; Krueger, A.B. Computing Inequality: Have Computers Changed the Labor Market? Q. J. Econ. 1998, 113, 1169–1213. [Google Scholar] [CrossRef]
- Piva, M.; Vivarelli, M. The Skill Bias: Comparative evidence and an econometric test. Int. Rev. Appl. Econ. 2002, 16, 347–357. [Google Scholar] [CrossRef]
- Feenstra, R.C.; Hanson, G.H. Globalization, Outsourcing, and Wage Inequality. Am. Econ. Rev. 1996, 86, 240–245. [Google Scholar]
- Bernard, A.B.; Jensen, J. Exporters, skill upgrading, and the wage gap. J. Int. Econ. 1997, 42, 3–31. [Google Scholar] [CrossRef]
- Driffield, N.; Taylor, K. FDI and the labour market: a review of the evidence and policy implications. Oxf. Rev. Econ. Policy 2000, 16, 90–103. [Google Scholar] [CrossRef]
- Cohen, W.M.; Levinthal, D.A. Innovation and Learning: The Two Faces of R&D. Econ. J. 1989, 99, 569–596. [Google Scholar]
- Alcacer, J.; Chung, W. Location strategies and knowledge spillovers. Manag. Sci. 2007, 53, 760–776. [Google Scholar] [CrossRef]
- Girma, S.; Greenaway, D.; Wakelin, K. Who benefits from foreign direct investment in the UK? Scott. J. Political Econ. 2001, 48, 119–133. [Google Scholar] [CrossRef]
- Lipsey, R.E.; Sjoholm, F. Foreign Direct Investment and Wages in Indonesian Manufacturing; Technical Report; National Bureau of Economic Research: Cambridge, MA, USA, 2001. [Google Scholar]
- Görg, H.; Greenaway, D. Much ado about nothing? Do domestic firms really benefit from foreign direct investment? World Bank Res. Obs. 2004, 19, 171–197. [Google Scholar] [CrossRef]
- Blonigen, B.; Slaughter, M.J. Foreign-Affiliate Activity And U.S. Skill Upgrading. Rev. Econ. Stat. 2001, 83, 362–376. [Google Scholar] [CrossRef]
- Feenstra, R.C.; Hanson, G.H. Foreign direct investment and relative wages: Evidence from Mexico’s maquiladoras. J. Int. Econ. 1997, 42, 371–393. [Google Scholar] [CrossRef]
- Lee, E.; Vivarelli, M. The social impact of globalization in the developing countries. Int. Labour Rev. 2006, 145, 167–184. [Google Scholar] [CrossRef]
- Hale, G.; Xu, M. FDI Effects on the Labor Market of Host Countries; Federal Reserve Bank: St. Louis, MO, USA, 2016. [Google Scholar]
- Dreher, A.; Gaston, N. Has Globalization Increased Inequality? Rev. Int. Econ. 2008, 16, 516–536. [Google Scholar] [CrossRef]
- Figini, P.; Gorg, H. Does foreign direct investment affect wage inequality? An empirical investigation. World Econ. 2011, 34, 1455–1475. [Google Scholar] [CrossRef]
- Driffield, N.; Love, J.H.; Taylor, K. Productivity and labour demand effects of inward and outward foreign direct investment on uk industry. Manch. Sch. 2009, 77, 171–203. [Google Scholar] [CrossRef]
- Tomohara, A.; Yokota, K. Foreign direct investment and wage inequality: Is skill upgrading the culprit? Appl. Econ. Lett. 2011, 18, 773–781. [Google Scholar] [CrossRef]
- Onaran, Ö.; Stockhammer, E. Do profits affect investment and employment? An empirical test based on the Bhaduri-Marglin model. In Wages, Employment, Distribution and Growth; Springer: Berlin/Heidelberg, Germany, 2006; pp. 206–222. [Google Scholar]
- Görg, H.; Hijzen, A.; Muraközy, B. The Role of Production Technology for Productivity Spillovers from Multinationals: Firm-Level Evidence for Hungary; Technical Report; Kiel Working Paper: Kiel, Germany, 2009. [Google Scholar]
- Castellani, D.; Jimenez, A.; Zanfei, A. How remote are R&D labs? Distance factors and international innovative activities. J. Int. Bus. Stud. 2013, 44, 649–675. [Google Scholar]
- Amoroso, S.; Müller, B. The short-run effects of knowledge intensive greenfield FDI on new domestic entry. J. Technol. Transf. 2017. [Google Scholar] [CrossRef]
- Bandick, R.; Görg, H.; Karpaty, P. Foreign acquisitions, domestic multinationals, and R&D. Scand. J. Econ. 2014, 116, 1091–1115. [Google Scholar]
- United Nations World Water Development Report 2016. Available online: http://unesdoc.unesco.org/images/0024/002439/243938e.pdf (accessed on 16 April 2018).
- Yamashita, N. The impact of production fragmentation on skill upgrading: New evidence from Japanese manufacturing. J. Jpn. Int. Econ. 2008, 22, 545–565. [Google Scholar] [CrossRef]
- Michaels, G.; Natraj, A.; Van Reenen, J. Has ICT polarized skill demand? Evidence from eleven countries over twenty-five years. Rev. Econ. Stat. 2014, 96, 60–77. [Google Scholar] [CrossRef]
- Spiezia, V.; Presidente, G.; Polder, M. ICTs and Jobs: Complements or Substitutes? Technical Report; OECD: Paris, France, 2016. [Google Scholar]
- Cirillo, V.; Pianta, M.; Nascia, L. Technology and occupations in Business Cycles. Sustainability 2018, 10, 463. [Google Scholar] [CrossRef]
- Bárány, Z.L.; Siegel, C. Job polarization and structural change. Am. Econ. J. Macroecon. 2018, 10, 57–89. [Google Scholar] [CrossRef]
Figure 1.
Changes in employment by occupational skill (2000–2015).

Figure 2.
Sectoral composition in value added, by skill employment share and countries.

Note: High skill sectors include: information and communications, financial and insurance activities, scientific and technical services, public administration and defense, education, real estate, and health services. Medium skill sectors include: agriculture, forestry and fishing, mining and quarrying, manufacturing, electricity and gas, construction, wholesale and retail, transportation and storage. Low skill sectors are: water supply and waste management, accommodation and food services, business support services and other services.
Figure 3.
Sectoral composition in value added, by sectoral dynamics and countries.

Figure 4.
Greenfield FDI by destination country (2003–2014), total number of projects)—Manufacturing vs. high-skill intensive activities.
Figure 4.
Greenfield FDI by destination country (2003–2014), total number of projects)—Manufacturing vs. high-skill intensive activities.

Table 1.
Greenfield FDI activity definitions.
| FDI Activity | Definition |
|---|---|
| Research & Development (R&D) | Discovery, design, or development of a product—technical design centers |
| Design, Development & Testing (DD&T) | Project that is involved in designing, developing or testing a product. Software companies opening development centers normally under this as are involved in testing |
| Education & Training (E&T) | A facility providing training services or education courses. Includes internal training services for company and outsourced staff |
| Headquarters (HQ) † | A divisional, national or regional HQ for the company |
| ICT & Infrastructure (ICT) | Providing the infrastructure for the ICT sector—broadband infrastructure, Internet data centres, data recovery centres, etc. |
| Manufacturing | Production or processing of any good—manufacturing plant, processing plant, smelter etc. It also includes operations where produce is grown (i.e., fish farm, winery forestry etc) |
† Headquarter activities are high-skill activities such as R&D, marketing and management [53]. Although the decision to open a headquarter abroad is mainly driven by low corporate taxes, HQs are located in areas with similar industry specialization and with high levels of business services, which are typically knowledge intensive.
Table 2.
Employment shares (%, 2000) and percentage point changes (2000–2015) by occupational skills and country.
Table 2.
Employment shares (%, 2000) and percentage point changes (2000–2015) by occupational skills and country.
| Country | High | Medium | Low | |||
|---|---|---|---|---|---|---|
| Share in 2000 | Change | Share in 2000 | Change | Share in 2000 | Change | |
| Skill upgrading | ||||||
| Netherlands | 47.3 | 0.5 | 43.9 | 0.1 | 8.8 | −0.5 |
| Switzerland | 42.7 | 8.3 | 52.4 | −7.3 | 4.9 | −1.0 |
| Finland | 41.5 | 4.7 | 50.6 | −3.0 | 7.9 | −1.7 |
| Germany | 39.5 | 4.9 | 52.0 | −4.6 | 8.4 | −0.3 |
| Ireland | 38.3 | 2.7 | 52.8 | −2.7 | 8.8 | 0.0 |
| Luxembourg | 37.9 | 20.5 | 51.7 | −18.8 | 10.3 | −1.7 |
| Norway | 37.5 | 14.7 | 56.5 | −12.7 | 5.9 | −2.0 |
| Denmark | 37.0 | 8.3 | 49.7 | −6.0 | 13.3 | −2.3 |
| Estonia | 36.3 | 8.1 | 52.7 | −5.3 | 11.0 | −2.8 |
| Latvia | 33.9 | 7.4 | 52.4 | −6.0 | 13.7 | −1.4 |
| Czech Republic | 33.7 | 3.9 | 58.1 | −1.4 | 8.2 | −2.5 |
| Poland | 28.7 | 9.3 | 63.0 | −7.7 | 8.3 | −1.6 |
| Spain | 26.7 | 6.3 | 58.2 | −4.0 | 15.1 | −2.3 |
| Portugal | 19.9 | 16.0 | 65.9 | −12.8 | 14.2 | −3.2 |
| Skill polarization | ||||||
| Sweden | 42.7 | 8.1 | 53.0 | −8.5 | 4.3 | 0.5 |
| United Kingdom | 39.8 | 8.2 | 52.1 | −8.9 | 8.1 | 0.7 |
| Belgium | 39.0 | 6.8 | 50.5 | −7.0 | 10.5 | 0.1 |
| France | 34.2 | 10.9 | 58.8 | −14.2 | 7.0 | 3.3 |
| Iceland | 32.8 | 15.8 | 63.4 | −19.1 | 3.8 | 3.3 |
| Slovakia | 32.8 | −0.7 | 57.4 | 2.0 | 9.8 | −1.2 |
| Hungary | 32.0 | 3.1 | 60.4 | −5.9 | 7.7 | 2.9 |
| Austria | 30.9 | 9.8 | 61.5 | −10.2 | 7.6 | 0.4 |
| Italy | 30.3 | 5.7 | 60.6 | −8.0 | 9.0 | 2.2 |
| Slovenia | 30.3 | 12.4 | 64.6 | −15.1 | 5.1 | 2.7 |
| Greece | 26.6 | 3.8 | 67.8 | −5.3 | 5.7 | 1.6 |
Note: Long difference 2000–2015. Occupational employment pooled within each country. Occupations are grouped according to the ISCO-08 skill level definition.
Table 3.
Employment shares (%, 2000) and percentage point changes (2000–2015) by occupational skills and sector.
Table 3.
Employment shares (%, 2000) and percentage point changes (2000–2015) by occupational skills and sector.
| Sector | High | Medium | Low | |||
|---|---|---|---|---|---|---|
| Share in 2000 | Change | Share in 2000 | Change | Share in 2000 | Change | |
| Upgrading | ||||||
| Construction | 16.1 | 6.4 | 75.4 | −6.2 | 8.5 | −0.2 |
| Information & communication | 21.1 | 60.9 | 67.1 | −51.1 | 11.8 | −9.7 |
| Financial & insurance | 45.0 | 19.0 | 54.1 | −19.0 | 0.9 | 0.0 |
| Public administration & defence | 47.9 | 6.8 | 44.0 | −6.4 | 8.1 | −0.5 |
| Polarization | ||||||
| Mining & quarrying | 23.5 | 10.9 | 70.7 | −11.9 | 5.7 | 1.1 |
| Manufacturing | 25.0 | 5.2 | 67.6 | −5.6 | 7.5 | 0.4 |
| Electricity & gas | 24.6 | 30.9 | 73.3 | −31.6 | 2.0 | 0.7 |
| Health & social services | 56.6 | 3.0 | 36.9 | −4.1 | 6.4 | 1.1 |
| Midgrading | ||||||
| Real estate | 68.2 | −9.5 | 14.5 | 20.5 | 17.3 | −11.0 |
| Technical services | 86.8 | −7.5 | 3.0 | 16.1 | 10.2 | −8.6 |
| Education | 77.4 | 0.4 | 13.6 | 2.3 | 9.0 | −2.7 |
| Other services | 35.0 | −12.3 | 43.4 | 11.4 | 21.5 | 0.9 |
| Downgrading | ||||||
| Agriculture, forestry & fishing | 7.0 | −3.5 | 82.3 | −3.9 | 10.7 | 7.4 |
| Water supply | 45.9 | −17.4 | 47.3 | −5.3 | 6.9 | 22.6 |
| Wholesale & retail | 29.9 | −5.7 | 64.2 | 4.4 | 5.9 | 1.3 |
| Transportation & storage | 23.3 | −5.6 | 70.2 | 3.5 | 6.4 | 2.1 |
| Accommodation & food services | 77.5 | −58.6 | 18.8 | 44.2 | 3.7 | 14.4 |
| Business support services | 25.6 | −5.1 | 49.6 | −1.8 | 24.8 | 7.0 |
Note: Long difference 2000–2015. Occupational employment pooled within each sector. Occupations are grouped according to the ISCO-08 skill level definition.
Table 4.
Greenfield FDI inflow in Europe (2003–2014, total).
| Investment Activity | N. Projects | Capex | Jobs | Capex/N | Jobs/N | Capex/Jobs | |
|---|---|---|---|---|---|---|---|
| High-skill | Education & Training | 292 | 3924.1 | 12,209 | 13.4 | 41.8 | 0.3 |
| Headquarters | 2337 | 30,649 | 152,634 | 13.1 | 65.3 | 0.2 | |
| ICT | 643 | 59,330.3 | 44,260 | 92.3 | 68.8 | 1.3 | |
| R&D | 2477 | 51,349.9 | 181,599 | 20.7 | 73.3 | 0.3 | |
| Low-skill | Manufacturing | 4100 | 227,994.5 | 740,374 | 55.6 | 180.6 | 0.3 |
Note: Capex figures are in Euro millions. Number of jobs and capital expenditure are partly based on estimated figures provided by the Financial Times.
Table 5.
Feasible Generalized Least Squares (FGLS) estimation results (2004–2014).
| Dep. var.s | ||||||
|---|---|---|---|---|---|---|
| E& | −0.001 | 0.004 | −0.007 *** | 0.001 | −0.001 | −0.008 *** |
| (0.003) | (0.003) | (0.002) | (0.004) | (0.004) | (0.003) | |
| 0.002 | −0.006 *** | 0.000 | −0.000 | −0.003 | −0.001 | |
| (0.002) | (0.002) | (0.001) | (0.002) | (0.002) | (0.001) | |
| −0.014 *** | 0.011 *** | 0.000 | −0.014 *** | 0.013 *** | 0.001 | |
| (0.003) | (0.003) | (0.001) | (0.003) | (0.003) | (0.002) | |
| R& | 0.021 *** | −0.017 *** | 0.001 | 0.015 *** | −0.011 *** | 0.002 |
| (0.002) | (0.002) | (0.001) | (0.002) | (0.002) | (0.001) | |
| −0.009 *** | 0.004 ** | 0.000 | −0.011 *** | 0.008 *** | 0.003 *** | |
| (0.002) | (0.002) | (0.001) | (0.002) | (0.002) | (0.001) | |
| −0.049 *** | 0.028 *** | 0.029 *** | ||||
| (0.004) | (0.005) | (0.002) | ||||
| 0.009 *** | −0.015 *** | −0.003 ** | ||||
| (0.002) | (0.003) | (0.002) | ||||
| 0.044 *** | −0.016 *** | −0.019 *** | ||||
| (0.004) | (0.005) | (0.002) | ||||
| 0.854 *** | −0.005 *** | −0.002 *** | ||||
| (0.070) | (0.001) | (0.000) | ||||
| constant | 0.094 *** | 0.768 *** | 0.126 *** | −0.016 | 0.838 *** | 0.103 *** |
| (0.004) | (0.006) | (0.003) | (0.024) | (0.028) | (0.013) | |
| Y/C/S dummies | ✓ | ✓ | ✓ | ✓ | ✓ | ✓ |
| N. obs | 5289 | 5336 | 5144 | 2513 | 2316 | 2248 |
| 249,112 *** | 249,112 *** | 27,985 *** | 151,906 *** | 89,761 *** | 13,528 *** |
Standard errors in parentheses. *** p < 0.01, ** p < 0.05.
Table 6.
FGLS estimation results—Skill shifting (2004–2014).
| Dep. var.s | ||||||
|---|---|---|---|---|---|---|
| E& | 0.100 | −0.020 *** | 0.803 * | 0.076 | −0.021 ** | 1.961 *** |
| (0.069) | (0.008) | (0.426) | (0.066) | (0.009) | (0.681) | |
| 0.003 | 0.002 | −0.447 ** | 0.015 | −0.000 | −0.578 ** | |
| (0.027) | (0.003) | (0.201) | (0.024) | (0.004) | (0.291) | |
| −0.078 | 0.019 *** | 0.077 | −0.132 * | 0.007 | −0.238 | |
| (0.068) | (0.006) | (0.669) | (0.073) | (0.008) | (0.929) | |
| R& | 0.053 | 0.007 * | 0.254 | 0.015 | 0.010 ** | 0.089 |
| (0.032) | (0.004) | (0.237) | (0.031) | (0.004) | (0.336) | |
| −0.035 | −0.006 * | −0.011 | −0.028 | 0.005 | −0.932 *** | |
| (0.023) | (0.003) | (0.163) | (0.024) | (0.004) | (0.252) | |
| −0.293 *** | 0.056 *** | −1.545 *** | ||||
| (0.035) | (0.006) | (0.389) | ||||
| 0.038 * | 0.006 | 0.159 | ||||
| (0.021) | (0.005) | (0.239) | ||||
| 0.130 *** | −0.047 *** | 2.044 *** | ||||
| (0.038) | (0.007) | (0.465) | ||||
| 0.030 *** | −0.000 | 0.092 | ||||
| (0.007) | (0.001) | (0.079) | ||||
| constant | −0.013 | 0.190 *** | 0.743 * | 0.498 ** | 0.119 *** | −8.916 *** |
| (0.050) | (0.007) | (0.429) | (0.199) | (0.030) | (2.288) | |
| Y/C/S dummies | ✓ | ✓ | ✓ | ✓ | ✓ | ✓ |
| N. obs | 5235 | 5111 | 4729 | 2303 | 2247 | 2128 |
| 17,960 *** | 8988 *** | 10,056 *** | 10,007 *** | 4495 *** | 4930 *** |
Standard errors in parentheses. *** p < 0.01, ** p < 0.05, * p < 0.1.
Table 7.
Seemingly Unrelated Regression (SUR) estimation results (2004–2014).
| Dep. var.s | ||||||
|---|---|---|---|---|---|---|
| E& | 0.009 | 0.009 | −0.020 *** | 0.044 *** | −0.015 | −0.030 *** |
| (0.009) | (0.010) | (0.007) | (0.019) | (0.019) | (0.010) | |
| 0.004 | −0.005 | 0.000 | 0.003 | 0.006 | −0.009 ** | |
| (0.005) | (0.005) | (0.004) | (0.008) | (0.008) | (0.005) | |
| −0.023 *** | 0.019 ** | 0.005 | 0.078 *** | −0.088 *** | 0.010 | |
| (0.007) | (0.008) | (0.006) | (0.013) | (0.013) | (0.006) | |
| R& | 0.014 *** | −0.015 *** | 0.001 | 0.023 ** | −0.030 *** | 0.008 |
| (0.005) | (0.006) | (0.004) | (0.010) | (0.010) | (0.005) | |
| −0.019 *** | 0.010 ** | 0.007 ** | −0.153 *** | 0.117 *** | 0.037 *** | |
| (0.005) | (0.005) | (0.004) | (0.008) | (0.008) | (0.004) | |
| −0.058 *** | 0.021 *** | 0.040 *** | 0.028 *** | −0.050 *** | 0.024 *** | |
| (0.006) | (0.007) | (0.005) | (0.007) | (0.007) | (0.004) | |
| 0.020 *** | −0.015 *** | −0.003 | 0.065 *** | −0.059 *** | −0.006 * | |
| (0.004) | (0.005) | (0.003) | (0.007) | (0.007) | (0.003) | |
| 0.039 *** | −0.013 * | −0.027 *** | −0.056 *** | 0.089 *** | −0.034 *** | |
| (0.007) | (0.008) | (0.005) | (0.011) | (0.011) | (0.006) | |
| 0.010 *** | −0.008 *** | −0.002 | 0.018 *** | −0.008 *** | −0.010 *** | |
| (0.001) | (0.002) | (0.001) | (0.002) | (0.002) | (0.001) | |
| constant | −0.018 | 0.881 *** | 0.121 *** | −0.060 | 0.699 *** | 0.354 *** |
| (0.032) | (0.036) | (0.025) | (0.041) | (0.041) | (0.021) | |
| Y/C/S dummies | ✓ | ✓ | ✓ | ✓ | ✓ | ✓ |
| Upgrading | 0.280 *** | −0.184 *** | −0.100 *** | |||
| (0.009) | (0.009) | (0.005) | ||||
| Polarization | 0.242 *** | −0.152 *** | −0.100 *** | |||
| (0.010) | (0.010) | (0.005) | ||||
| Midgrading | 0.381 *** | −0.339 *** | −0.047 *** | |||
| (0.011) | (0.011) | (0.006) | ||||
| N. obs | 2288 | 2288 | 2288 | 2288 | 2288 | 2288 |
| R-squared | 0.904 | 0.851 | 0.671 | 0.654 | 0.575 | 0.375 |
| 21,579.44 *** | 13,111.06 *** | 668.54 *** | 3077.74 *** | 2058.20 *** | 1371.59 *** |
Standard errors in parentheses. *** p < 0.01, ** p < 0.05, *p < 0.1.
Table 8.
SUR estimation results—Skill shifting (2004–2014).
| Dep. var.s | ||||||
|---|---|---|---|---|---|---|
| E& | −0.033 | −0.080 *** | 3.034 | 0.523 *** | −0.051 * | 2.510 |
| (0.116) | (0.024) | (2.170) | (0.174) | (0.030) | (2.772) | |
| 0.100 * | 0.016 | −1.644 | 0.060 | −0.012 | 1.409 | |
| (0.058) | (0.012) | (1.079) | (0.087) | (0.015) | (1.379) | |
| −0.233 ** | 0.027 | −6.413 *** | 1.153 *** | 0.067 *** | 6.930 *** | |
| (0.097) | (0.020) | (1.810) | (0.118) | (0.020) | (1.878) | |
| R& | −0.104 | 0.011 | 1.654 | 0.106 | 0.025 | 2.221 |
| (0.065) | (0.014) | (1.221) | (0.096) | (0.016) | (1.524) | |
| 0.043 | 0.016 | −1.091 | −0.958 *** | 0.048 *** | −12.279 *** | |
| (0.059) | (0.012) | (1.096) | (0.072) | (0.012) | (1.147) | |
| −0.269 *** | 0.095 *** | −4.431 *** | 0.513 *** | 0.089 *** | −3.369 *** | |
| (0.084) | (0.018) | (1.575) | (0.070) | (0.012) | (1.119) | |
| −0.026 | 0.003 | −1.759 | 0.486 *** | 0.026 ** | −0.260 | |
| (0.058) | (0.012) | (1.093) | (0.063) | (0.011) | (0.996) | |
| 0.114 | −0.088 *** | 6.503 *** | −0.923 *** | −0.147 *** | 2.270 | |
| (0.098) | (0.021) | (1.834) | (0.110) | (0.019) | (1.754) | |
| 0.035 * | −0.001 | 0.108 | 0.166 *** | −0.032 *** | 4.758 *** | |
| (0.019) | (0.004) | (0.355) | (0.018) | (0.003) | (0.280) | |
| constant | 0.795 * | 0.246 ** | −13.835 | 0.510 | 0.837 *** | −2.407 |
| (0.458) | (0.096) | (8.565) | (0.392) | (0.069) | (6.400) | |
| Y/C/S dummies | ✓ | ✓ | ✓ | ✓ | ✓ | ✓ |
| Upgrading | 1.576 *** | −0.159 *** | 25.614 *** | |||
| (0.090) | (0.016) | (1.468) | ||||
| Polarizing | 0.948 *** | −0.136 *** | 5.831 *** | |||
| (0.099) | (0.017) | (1.579) | ||||
| Midgrading | 3.201 *** | 0.094 *** | 19.008 *** | |||
| (0.100) | (0.018) | (1.637) | ||||
| N. obs | 2168 | 2168 | 2168 | 2168 | 2168 | 2168 |
| R-squared | 0.785 | 0.525 | 0.644 | 0.520 | 0.250 | 0.397 |
| 7893.16 *** | 2396.68 *** | 3920.58 *** | 2091.19 *** | 706.99 *** | 1398.82 *** |
Standard errors in parentheses. *** p < 0.01, ** p < 0.05, * p < 0.1.
© 2018 by the authors. Licensee MDPI, Basel, Switzerland. This article is an open access article distributed under the terms and conditions of the Creative Commons Attribution (CC BY) license (http://creativecommons.org/licenses/by/4.0/).
Share and Cite
MDPI and ACS Style
Amoroso, S.; Moncada-Paternò-Castello, P. Inward Greenfield FDI and Patterns of Job Polarization. Sustainability 2018, 10, 1219. https://doi.org/10.3390/su10041219
AMA Style
Amoroso S, Moncada-Paternò-Castello P. Inward Greenfield FDI and Patterns of Job Polarization. Sustainability. 2018; 10(4):1219. https://doi.org/10.3390/su10041219
Chicago/Turabian StyleAmoroso, Sara, and Pietro Moncada-Paternò-Castello. 2018. "Inward Greenfield FDI and Patterns of Job Polarization" Sustainability 10, no. 4: 1219. https://doi.org/10.3390/su10041219
Note that from the first issue of 2016, this journal uses article numbers instead of page numbers. See further details here.