Empirical Examination of Users’ Adoption of the Sharing Economy in China Using an Expanded Technology Acceptance Model


School of Economics and Management, Harbin Institute of Technology, Weihai 264209, China
*
Author to whom correspondence should be addressed.
Sustainability 2018, 10(4), 1262; https://doi.org/10.3390/su10041262
Submission received: 8 February 2018
/
Revised: 10 April 2018
/
Accepted: 13 April 2018
/
Published: 19 April 2018
(This article belongs to the Special Issue Sharing Economy and Its Role in Fostering Sustainability: How Trust and Regulation Shape Relations of Providers and Consumers)
Abstract
:With the popularity of sharing-based applications such as bicycle and car sharing, the sharing economy has attracted considerable global attention. The factors that affect users’ adoption of the sharing economy must be identified to facilitate the promotion of low-carbon lifestyles and help enterprises attract more active users. By employing the technology acceptance model (TAM) and herd behavior, this study implemented an expanded TAM and identified several factors affecting behavioral intention (BI) toward the sharing economy. A questionnaire was used to obtain the data, which were analyzed through structural equation modeling. The results revealed that perceived usefulness (PU) and perceived ease of use (PEOU) are the main factors affecting BI. Moreover, trust (TRU) was identified as a mediator of subjective norm (SN) and PEOU. Imitating others (IMI) affects BI, and SN affects TRU, PU, and PEOU. Gender moderates SN and IMI. This paper indicates that to improve users’ BI, enterprises should enhance PU, PEOU, and TRU; cooperate with organizations to enhance SN; and guide potential users to imitate others.
1. Introduction
As a prominent business ecosystem, the sharing economy and its applications encompass substantial market potential. The market size of the sharing economy in China was estimated at USD 62.5 billion in October 2016, and it is expected to reach USD 280 billion by 2018 [1]. In 2016, the Chinese government announced support for the development of the sharing economy [2]; therefore, many traditional industries have begun to explore this emerging field. House sharing (e.g., Airbnb), car sharing (e.g., DiDi Kuaidi), knowledge sharing (e.g., Wikipedia), and bicycle sharing (e.g., Mobike) are some examples of this trend. Among these applications, bicycle sharing is one of the most representative of the sharing economy in China [3]; therefore, we explored the factors affecting users’ adoption of the sharing economy by studying their adoption of bicycle-sharing applications. Moreover, because bicycle sharing is a typical application of low-carbon transportation modes, bicycle-sharing applications have attracted considerable global attention as they have emerged [4,5,6]. According to a report published by iResearch (2017), the number of monthly active users of bicycle-sharing applications at the beginning of 2017 was approximately 10 million, which is less than half the global users (more than 20 million) and less than 10% of the users of transportation-sharing applications (more than 100 million) [7]. Evidently, despite their initial popularity, bicycle sharing and the sharing economy are yet to receive wide adoption among users. Therefore, the factors affecting users’ behavioral intention (BI) toward the sharing economy requires exploration.
Because of declining natural resources, sustainable development has become a crucial issue in the current economic environment. The sharing economy is one route through which people have begun to adopt low-carbon and sustainable lifestyles; therefore, studying the main factors affecting the consumer adoption of the sharing economy is necessary. While reducing carbon emissions and saving energy, sharing mobility services may promote sustainable mobility [8] which is defined as a paradigm which strengthens the links between land use and transport [9]. In their examination of car sharing in London, Akyelken et al. (2018) noted that the sharing economy enhances sustainable mobility [10]. Bicycle-sharing systems, a common policy for promoting sustainable mobility [11], allow customers temporary access to vehicles, thereby removing the necessity of buying their own bicycles. Moreover, bicycles can take the place of polluting vehicles, hence, the more bicycle trips that are taken, the less high-emission vehicles that are on roads [12]. Consequently, bicycle-sharing systems foster sustainability due to the efficient use of resources and reductions in harmful emissions.
Bicycle-sharing applications, which were established during 2015 in China, have formed a comparatively mature operation pattern. Such applications provide cheap bicycle use in communities at any time to facilitate travel and completion of the final part of a journey. These types of derivative applications were developed against the background of the rapid development of the sharing economy. They quickly increased in popularity, and various bicycle-sharing enterprises have subsequently emerged. Users must initially pay for their accounts through online payment. Then, they can locate nearby bicycles through an application on their mobile device. To use a bicycle, they must scan the Quick Response (QR) code of the bicycle to unlock a physical lock and then they can use it. Through big data methodologies and the Global Positioning System (GPS) devices installed in the bicycle, enterprises can track bicycle trajectories and dispatch bicycles. Compared with traditional lifestyles, the sharing economy can reduce costs and financial risks such as loss and damage. In addition, the sharing economy evokes environmental protection and sustainable development, which are popular among modern consumers. The aforementioned advantages can promote user adoption of the sharing economy; however, it also has some disadvantages. First, it is difficult for different users to obtain a personal experience. According to Porter’s (1980) competitive strategy theory [13], enterprises must reduce costs through mass production when products enter the mature period; thus, users cannot choose the suitable size of the product or select their preferred style and color. Given the current ubiquity of personalized products, such shortcomings will undoubtedly reduce user satisfaction. Second, the quantity and distribution of products are susceptible to tidal effects. For example, many bicycles tend to assemble in the central business district areas during work hours and accumulate in residential areas after work hours. These disadvantages negatively affect users’ adoption of the sharing economy. To attract consumers, the factors affecting users’ adoption must be explored. The aim of the current study was to fulfil this objective.
The remainder of the paper is organized as follows: the following section contains a review of the relevant literature. Then we present hypotheses, describe the variables, and establish a research model in Section 3. Section 4 explains the research methods, and results are presented in Section 5. Section 6 and Section 7 provide a discussion and the theoretical and practical implications of the paper. Finally, on the basis of the results, we present conclusions in Section 8.
2. Literature Review
2.1. Sharing Economy
The sharing economy is generally considered to have originated from collaborative consumption [14]. Felson and Spaeth (1978) emphasized that collaborative consumption should indicate the separation of ownership and use rights in communities, which exactly reflects the core meaning of “sharing” [4]. However, the concept was not widely accepted because more attention was paid to the ownership of goods than to use rights in the economic society of that time. After approximately 30 years, this idea was proposed as the term the sharing economy.
Recently, an increasing number of studies have been conducted on this concept. Botsman and Rodgers (2010) claimed that the sharing economy is an emerging internet-based business model [5]. Without the internet, the sharing model cannot aggregate into a huge scale and thus cannot be considered a type of economy. Subsequently, Chase (2015) noted that the participants in sharing should be all the members of society and defined a common basis for its existence: overcapacity, platforms, and mass participation [6]. However, this approach omitted the role of sharing at the social–psychological level. Hence, Eckhardt and Bardhi (2015) argued that the sharing economy is inaccurately named, and should rather be termed the access economy because “access” focuses on cost and value, whereas “sharing” reflects social relations [15]. Matofska (2016) expanded on the implications of the sharing economy and claimed that it represents a socioeconomic ecosystem established through the sharing of human, physical and intellectual resources [16].
The largest contribution of the sharing economy to sustainable development is in its innovative use of applications to productize services that can reduce resource waste and improve resource-utilization efficiency. Thus, we believe that one of the most interesting aspects of the sharing economy is how its applications are accepted by consumers. User experience is crucial, and consumer demand is a huge impetus for industry development. This demand has driven the market throughout its various orientations from traditional production and selling to the current holistic marketing concepts [17]. Moreover, in the sharing economy, consumers who lack sufficient funds to own specified resources can pay a relatively small price to satisfy their needs.
Studies that provided the theoretical foundations for the current study have not presented a common definition of the sharing economy because scholars have different opinions. Moreover, they have rarely explored the factors influencing users’ adoption of the sharing applications on the basis of empirical evidence. However, enterprises that aim to succeed in the sharing economy can sell products more effectively and specifically only by identifying such factors. The goal of this study was to provide this identification.
2.2. Technology Acceptance Model (TAM)
The technology acceptance model (TAM), based on the theory of reasoned action (TRA) and the theory of planned behavior (TPB), is an authoritative model for the adoption of information technology products [18].
The TRA, which was introduced by Ajzen and Fishbein (1975, 1980), has been widely employed to predict consumers’ BI and behaviors. However, the TRA’s major issues are that BI affects not only the behavior but also that attitudes and social norms influence BI [19,20]. Thus, TRA has been used to predict how individuals will behave based on their pre-existing BIs [21]. The TPB, an extension of the TRA proposed by Ajzen (1985), emphasized the factor of perceived behavioral control [22]. However, the TPB focuses on the goals of behaviors and ignores resources other than motivation.
On the basis of the TRA and TPB, Davis (1989) conducted two empirical studies involving 152 users and four applications to demonstrate that perceived usefulness (PU) and perceived ease of use (PEOU) have significant mediating effects on external variables and BI [23]. He also revealed that PEOU is a mediator of PU and BI, and he indicated that external variables should be identified as observed variables of PU and PEOU because they are difficult to measure directly [24]. The purpose of the TAM was to provide a more effective measurement tool for predicting and interpreting users’ adoption [23].
In previous studies on the TAM, researchers employed different observed variables to reflect the mediating variables according to different study subjects to discover the factors that impact users’ adoption. Numerous studies have demonstrated that the TAM is particularly applicable to consumers’ acceptance of information technology products [25,26,27,28,29,30,31,32,33,34,35,36,37]. Therefore, the TAM provided the foundation for our research model in the current study. The most evident drawback of the TAM is that the external variables are insufficiently clear; therefore, researchers must select the appropriate observed variables to analyze their effects on users’ BI. Moreover, although the TAM includes only two mediators, studies have indicated that PU and PEOU only partially explain the effects on BI. These deficiencies represent opportunities for future research and reflect the feasibility of the current study.
2.3. Herd Behavior
Scholars have observed apparent herding behaviors in various fields (e.g., financial investment, organizational decision-making, and consumer behavior) [38], and such behaviors are very common in daily life. Some scholars consider herding as a behavior in which individuals make decisions in imitation of other people’s actions; thus, people are both the objects that exert influence and those that are affected. Banerjee (1992) noted that herd behavior indicates “everyone doing what everyone else is doing” (p. 798) [39], whereas Çelen and Kariv (2004) defined herd behavior as “individuals choose the same actions” (p. 485) [40]. However, some scholars argue that in addition to people, organizations or groups can exhibit herd behavior. Abrahamson and Rosenkopf (1993) defined herd behavior at the organizational level as “diffusion processes whereby organizations adopt an innovation, not because of their individual assessments of the innovation’s efficiency or returns, but because of a bandwagon pressure caused by the sheer number of organizations that have already adopted this innovation” (p. 488) [41]. Therefore, herding is generally considered an expression of a specific type of stress during the process of this behavior; herding pressure is placed on consumers not only by people but also organizations.
In the field of general decision-making, Bernheim (1994) considered herding to indicate that “people conform to a single, homogeneous standard of behavior which is like a type of social norm” (p. 844) [42] whereas Anderson and Holt (1997) defined herd behavior as information cascades that occur when people follow an established pattern [43]. Consumers who hesitate to make a decision when faced with adopting a new technology product that other users have adopted are under the pressure of organizations and other users; thus, they may take the same actions. In this study, we noted that the variable affecting consumers’ herd behavior has organizational- and personal-level aspects in the field of consumer acceptance. Herd behavior at an organizational level indicates that consumers make decisions subjectively due to pressure from those around them. In other words, decision-making processes are largely influenced by norms. Norms can lead to behaviors, but are not in themselves behaviors. Herd behavior at the personal level means that consumers make decisions directly by imitating others, and imitation is itself a type of herd behavior. Organizational-level herd behavior is termed subjective norm (SN) and is defined as “the person’s perception that most people who are important to him think he should or should not perform the behavior in question” (p. 302) [44]. Personal-level herd behavior is termed as imitating others (IMI) and is defined as “the degree to which one follows previous adopters to adopt a particular form of technology” (p. 1015) [45].
3. Hypotheses and Research Model
3.1. Hypotheses
3.1.1. Perceived Usefulness (PU) and Perceived Ease of Use (PEOU)
Studies have demonstrated that PU—the degree to which people believe that using a particular system will enhance their job performance—and PEOU—the degree to which consumers perceive that using a system or product will require reasonable efforts—significantly positively affected BI—the subjective probability that an individual will perform a specified behavior; the former relationship was more evident than the latter [45,46,47]. If potential users are more likely to use the sharing economy, they are more likely to adopt it. Therefore, decision makers must identify the factors that influence BI. Subramanian (1994) believed that the TAM can also be used to predict the users’ future use of a system and claimed that PEOU can affect BI only through PU [48]. Keil (1995) noted that researchers should observe users’ adoption from the levels of organizational and individual adoption [49]. His results, which were in agreement with those of Davis (1989), demonstrated that PU is more important than PEOU for individual adoption [23]. However, consideration of new product classification yields alternative results. Chau (1996) argued that PEOU is more important than PU in pure software projects [27]. The effect of the TAM’s core variables (PU and PEOU) on BI can change with the study subject or over time. Therefore, no universally applicable conclusion has been derived for all products or research environments in the field of technology acceptance; with the emergence of new sharing applications such as bicycle sharing, we must obtain new results through new studies. Thus, we propose the following hypotheses:
Hypotheses 1 (H1).
Consumers’ PU is positively related to their BI.
Hypotheses 2a (H2a).
Consumers’ PEOU is positively related to their BI.
Hypotheses 2b (H2b).
Consumers’ PEOU is positively related to their PU.
3.1.2. Trust
In addition to facilitating interpersonal relationships, trust (TRU) is one of the most basic factors for relationships between consumers and enterprises [50]. Rousseau et al. (1998) defined TRU as perceptions about others’ attributes and a related willingness to become vulnerable to others [28]. Thus, if consumers do not have trust, they may refuse to adopt the product when they believe that the sharing application is difficult to use or lacks user value, which requires applications to be safe and enterprises to protect consumers’ privacy and consider the interests of consumers.
In the field of marketing, customers’ trust in products and enterprises has become a prominent topic with the growing popularity of customer-centric marketing guidelines. In recent years, studies on mobile commerce, information exchange systems, and mobile payments have revealed that TRU has a significant positive effect on BI [29,30,31]. In their research on business-to-consumer (B2C) e-commerce, Qiu and Li (2008) proposed integrating TRU into the TAM to enhance its persuasiveness for internet applications [30]. However, no empirical evidence was provided. Alsajjan and Dennis (2010) subsequently demonstrated that TRU, which was positively related to PU and BI, was affected by SN [32]. However, all these studies have investigated consumers’ adoption of new products in online or virtual settings, whereas most sharing applications (e.g., bicycle sharing, car sharing, and house sharing) are used in real settings. In this study, we integrated TRU into our model to observe its mediating effect between the external variables and BI. Thus, we propose the following hypotheses:
Hypotheses 3a (H3a).
Consumers’ TRU is positively related to their BI.
Hypotheses 3b (H3b).
Consumers’ TRU is positively related to their PU.
Hypotheses 3c (H3c).
Consumers’ TRU is positively related to their PEOU.
3.1.3. Imitating Others
Having decided upon herd behavior as a possible influencing factor, we conducted a pre-study to determine the thoughts of consumers. We interviewed 20 consumers with experience of the sharing economy and asked them to (1) write down key factors affecting their adoption of the sharing economy; and (2) write down key factors that they believe influence other consumers to adopt the sharing economy. Among them, there are 11 males and 9 females. Combining mean value (27.1) and standard deviation (6.64), we consider the average age of these interviewees is 27 ± 6. The result also revealed that imitating the behaviors of heroic figures motivates their desire to adopt these behaviors. Imitating other (IMI) even provides strong psychological cues when consumers are hesitant and their willingness to act is unclear. In a longitudinal study on technology acceptance, Sun (2013) demonstrated that IMI, which has a significant positive effect on BI, is one of the most important factors in herd behavior [45]. Thus, we propose the following hypothesis:
Hypotheses 4 (H4).
Consumers’ IMI is positively related to their BI.
3.1.4. Subjective Norm
Employing SN as an observed variable of behavioral intention was first proposed by Fishbein and Ajzen (1977) in the TRA [44]. It was subsequently integrated into the TAM by Venkatesh and Davis (2000) [25].
In an empirical study of computer resource-center systems, Taylor and Todd (1995) demonstrated that SN (from peers and influential individuals), which is a mediator in the TAM, had a significant positive effect on BI [51]. Moreover, in a study on e-learning, Cheung and Vogel (2013) investigated whether SN from peers, the media, and influential individuals affects BI [33]; only SN from peers exhibited significant influence. Lucas and Spitler (2010) believed that SN is generally more important than PU and PEOU for enterprises to predict users’ behavior by using the TAM [52]. Hsu and Lin (2008) found no significant impact of SN on usage intention among blog users [34]. However, Lu et al. (2009) considered the “sinicization” of the TAM through a study of users’ acceptance of instant messaging services and found that although the degree of influence was small, SN was positively related to BI [35]. Wu et al. (2011) studied the users’ adoption of Web 2.0 and found that SN affected both PU and BI [36], which was in agreement with the findings of Venkatesh et al. (2003) [26]. Because most enterprises in the sharing economy launch their products in the form of a “platform”, the industry barriers are relatively low, and users’ transfer costs are also low. Therefore, users pay attention to products’ ease of use when considering the products’ usefulness. To determine whether SN affects PU, PEOU, and BI, we propose the following hypotheses:
Hypotheses 5a (H5a).
SN is positively related to customers’ PU.
Hypotheses 5b (H5b).
SN is positively related to customers’ PEOU.
Hypotheses 5c (H5c).
SN is positively related to customers’ TRU.
3.1.5. Gender
In social sciences, a moderator is defined as a variable that interferes in the relationship between an independent variable and its corresponding dependent variable [53]. Moderating variables are generally divided into categorical and continuous variables; gender is one of the most typical categorical variables [54,55].
An important categorical moderator, gender, has been used repeatedly in studies of the TAM. Although the TAM has been determined as structurally invariant by gender [56], most researchers still consider gender to be an important moderator. Tarhini et al. (2014) determined that gender moderates the effect of PEOU and SN on BI in a study on the acceptance and use of e-learning interventions [57]. Liu (2016) studied the acceptance of mobile computing devices, and the results revealed that male college students favored status and value orientations, whereas female students preferred social and utilitarian orientations [58].
Gefen and Straub (1997) noted that sociolinguistic research has indicated that men tend to focus their discourse on hierarchy and independence, whereas women focus on intimacy and solidarity. They integrated gender as a moderator into the TAM to study if gender difference affected consumers’ adoption of e-mail, and their findings suggested that researchers should include gender in IT diffusion models, which are based on the TAM along with other cultural effects [59]. The effects of gender differences on the use and perceptions of many forms of human discourse are well established [59], and herd behavior is known to be formed through human discourse such as sounds and body language. In addition, we previously determined that interviewees of different genders demonstrate different preferences when under observation of Chinese sharing practices. Based on the aforementioned work, we hypothesized that gender is a crucial factor in the use of sharing applications. Thus, we proposed the following hypotheses:
Hypotheses 6a (H6a).
Gender significantly affects the influence of SN on TRU.
Hypotheses 6b (H6b).
Gender significantly affects the influence of SN on PU.
Hypotheses 6c (H6c).
Gender significantly affects the influence of SN on PEOU.
Hypotheses 6d (H6d).
Gender significantly affects the influence of IMI on BI.
3.2. Research Model
4. Method
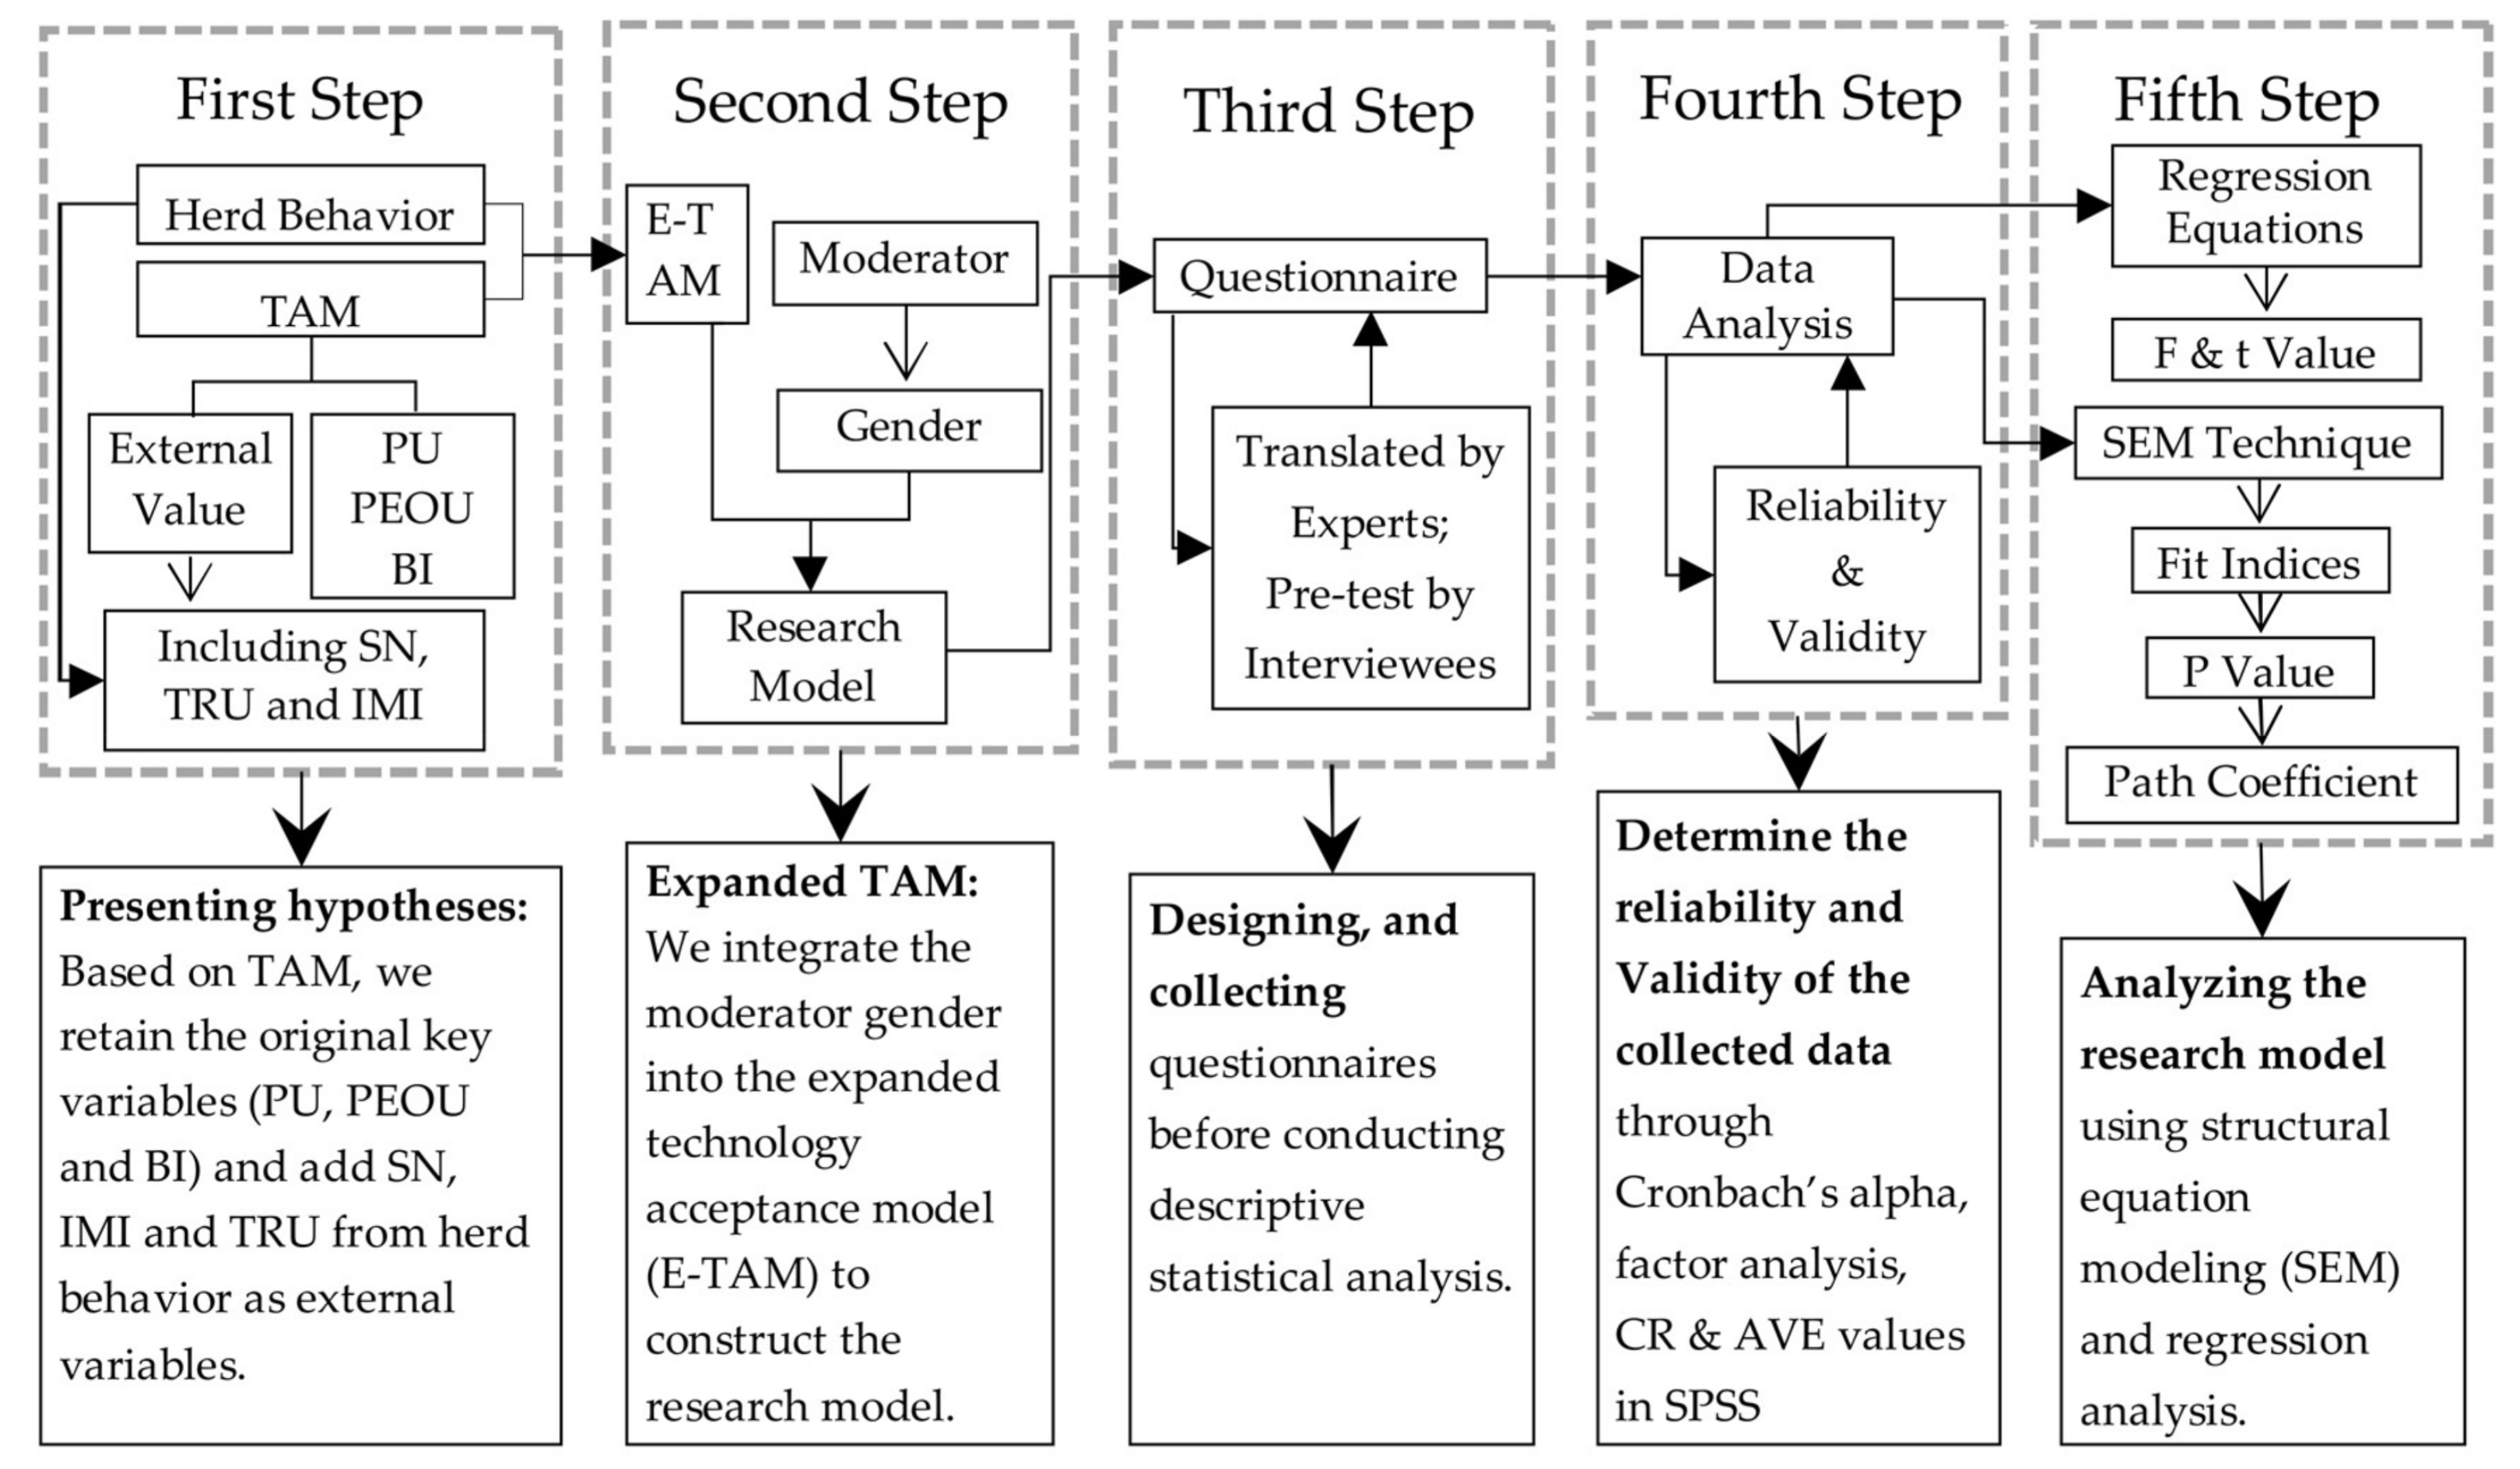
The TAM was adopted for use in this study because this model considers several factors and external variables as well as interactions between and among them, simultaneously [23]. Our in-depth review can contribute to the decision-making of enterprises and government departments when looking to promote consumers’ adoption of sharing applications to save resources and help guide consumers toward embracing sustainable development. In this research, many latent variables, such as PU/PEOU/TRU, could not be measured directly. Therefore, observed variables were used to measure latent variables indirectly, and these variables were confirmed using some specific items. The measured values consisted of real values and measurement errors. However, using the structural equation can considerably improve the accuracy of the overall measurement because it eliminates random measurement errors that occur when analyzing the structural relationship between latent variables. The structural equation model (SEM) can calculate relationships between multiple dependent variables concurrently, which means that it provides the most comprehensive and appropriate analysis for studying the mediating effect [60]. Therefore, we adopted the SEM to analyze our research model. Several groups of regression equations were designed to determine whether interviewees of different genders demonstrated significant differences in influencing relationships. The overall framework of this study is presented in Figure 1.
Our research model includes six factors, each of which is measured with 2–4 items. All the items were derived from previous research to improve the content validity [53]. To ensure that the meaning of these English-language scales remained unchanged after translation, we consulted professors of English and management at the Harbin Institute of Technology. Before conducting the investigation, we confirmed that the questionnaire could be clearly understood, and we completed a pre-test with 20 interviewees. Participants were made aware that all data provided were confidential and for academic use only. Appendix A lists the items and their sources.
In this study, we employed a five-point Likert scale with 18 questions for data collection. Items for PU, PEOU and BI were adapted from those of Davis (1989) [23] and Venkatesh and Davis (2000) [25]; Davis (1989) [23]; and Davis and Venkatesh (1996) [24], respectively. Items for TRU, IMI, and SN were adapted from those of Lee (2005) [29]; Sun (2013) [45]; and Venkatesh and Davis (2000) [25], respectively.
To ensure that the survey was widely distributed, we adopted an online questionnaire. However, because we were using gender as a moderator, we ensured that the number of male and female respondents was relatively balanced. Therefore, we also distributed an offline questionnaire to avoid any possible gender imbalance caused by only adopting online questionnaires. In total, we distributed 500 questionnaires, among which 250 were online. Of these, 150 were distributed through Wenjuanxing, which is one of the most widely used online questionnaire-collection platforms in China, and respondents were from various professions across China. Another 100 copies were randomly distributed through mailing lists. The other 250 copies were distributed offline (in cities including Chengdu, Qingdao, Shanghai, Wuhan, Xi’an, and other representative cities in the popularization of bicycle sharing in China).
Questionnaires were completed by users who had experience of using bicycle-sharing applications, which is a typical application in the sharing economy; the data were collected online or at locations with many shared bicycles. We examined all responses (426) and excluded 32 responses that had duplicate IPs (internet protocols) or too many missing values. Because of the randomness of a questionnaire survey, the ratio between men (44.92%) and women (55.08%) should have almost been 1:1; therefore, the data of this study are acceptable. The data for use frequency revealed that respondents used bicycle-sharing applications an average of three times or less per month (56.09%), 1–3 times per week (28.68%), 4–6 times per week (9.90%), and one or more times per day (5.33%), respectively. Therefore, bicycle sharing has not been widely adopted by users.
To measure the relationships between latent variables, which were measured and operationalized using specified manifest indicators [61], we adopted SEM, which is based on covariance structure models, to establish our empirical study. The results indicated that our expanded TAM, which was based on herd behavior, can explain the majority of the variance (0.761). Therefore, this method was appropriate for our study.
5. Results
Anderson and Gerbing (1988) noted that a two-step approach should be adopted if a good model fitness is obtained [62]. Therefore, we first measured the reliability and validity of the data and subsequently examined the structural equation model to test research hypotheses.
To determine the reliability of the data, we first calculated the Cronbach’s alpha. The next step was to measure the validity of the data. Our data had a high content validity because the questionnaires were translated from international authoritative studies and experts were consulted before the formal investigation; moreover, our expanded TAM was based on a literature review, practical analysis, and theoretical integration. Because each concept in this study was measured using multiple indices, we measured the degree to which each indicator reflected the measured concepts to determine whether the items actually reflected the concepts that were assigned for measurement. The main function of factor analysis, which extracts common factors according to the internal logic of the data, is to convert the measured variable into comprehensive indices. Therefore, we adopted factor analysis to measure the validity of the data. To determine whether our data were suitable for factor analysis, we conducted the Kaiser–Meyer–Olkin (KMO) and Bartlett’s sphericity tests. The results indicated that the KMO was 0.915 (>0.800), suggesting that the data were suitable for factor analysis. Then, we conducted an exploratory factor analysis and determined the standardized item loadings and measurement error by using the direct oblimin procedure, which is based on principal component extraction. A higher item loading indicated that the item can explain more variance. Next, we calculated the average variance extracted (AVE) to assess the convergent validity. Table 1 lists the standardized item loadings, measurement errors, Cronbach’s alphas, AVE values, and composite reliability (CR) scores. As shown in the table, most of the loadings were higher than 0.6, and all loadings were significant at the 0.05 level; moreover, all AVE values and CR scores were higher than 0.5 and 0.7, respectively [63,64]. Hence, the scale has a good convergent validity. In addition, the Cronbach’s alpha of the whole questionnaire was 0.906 (>0.8), suggesting a good reliability [65]. The calculation formulas of CR and AVE are as follows:
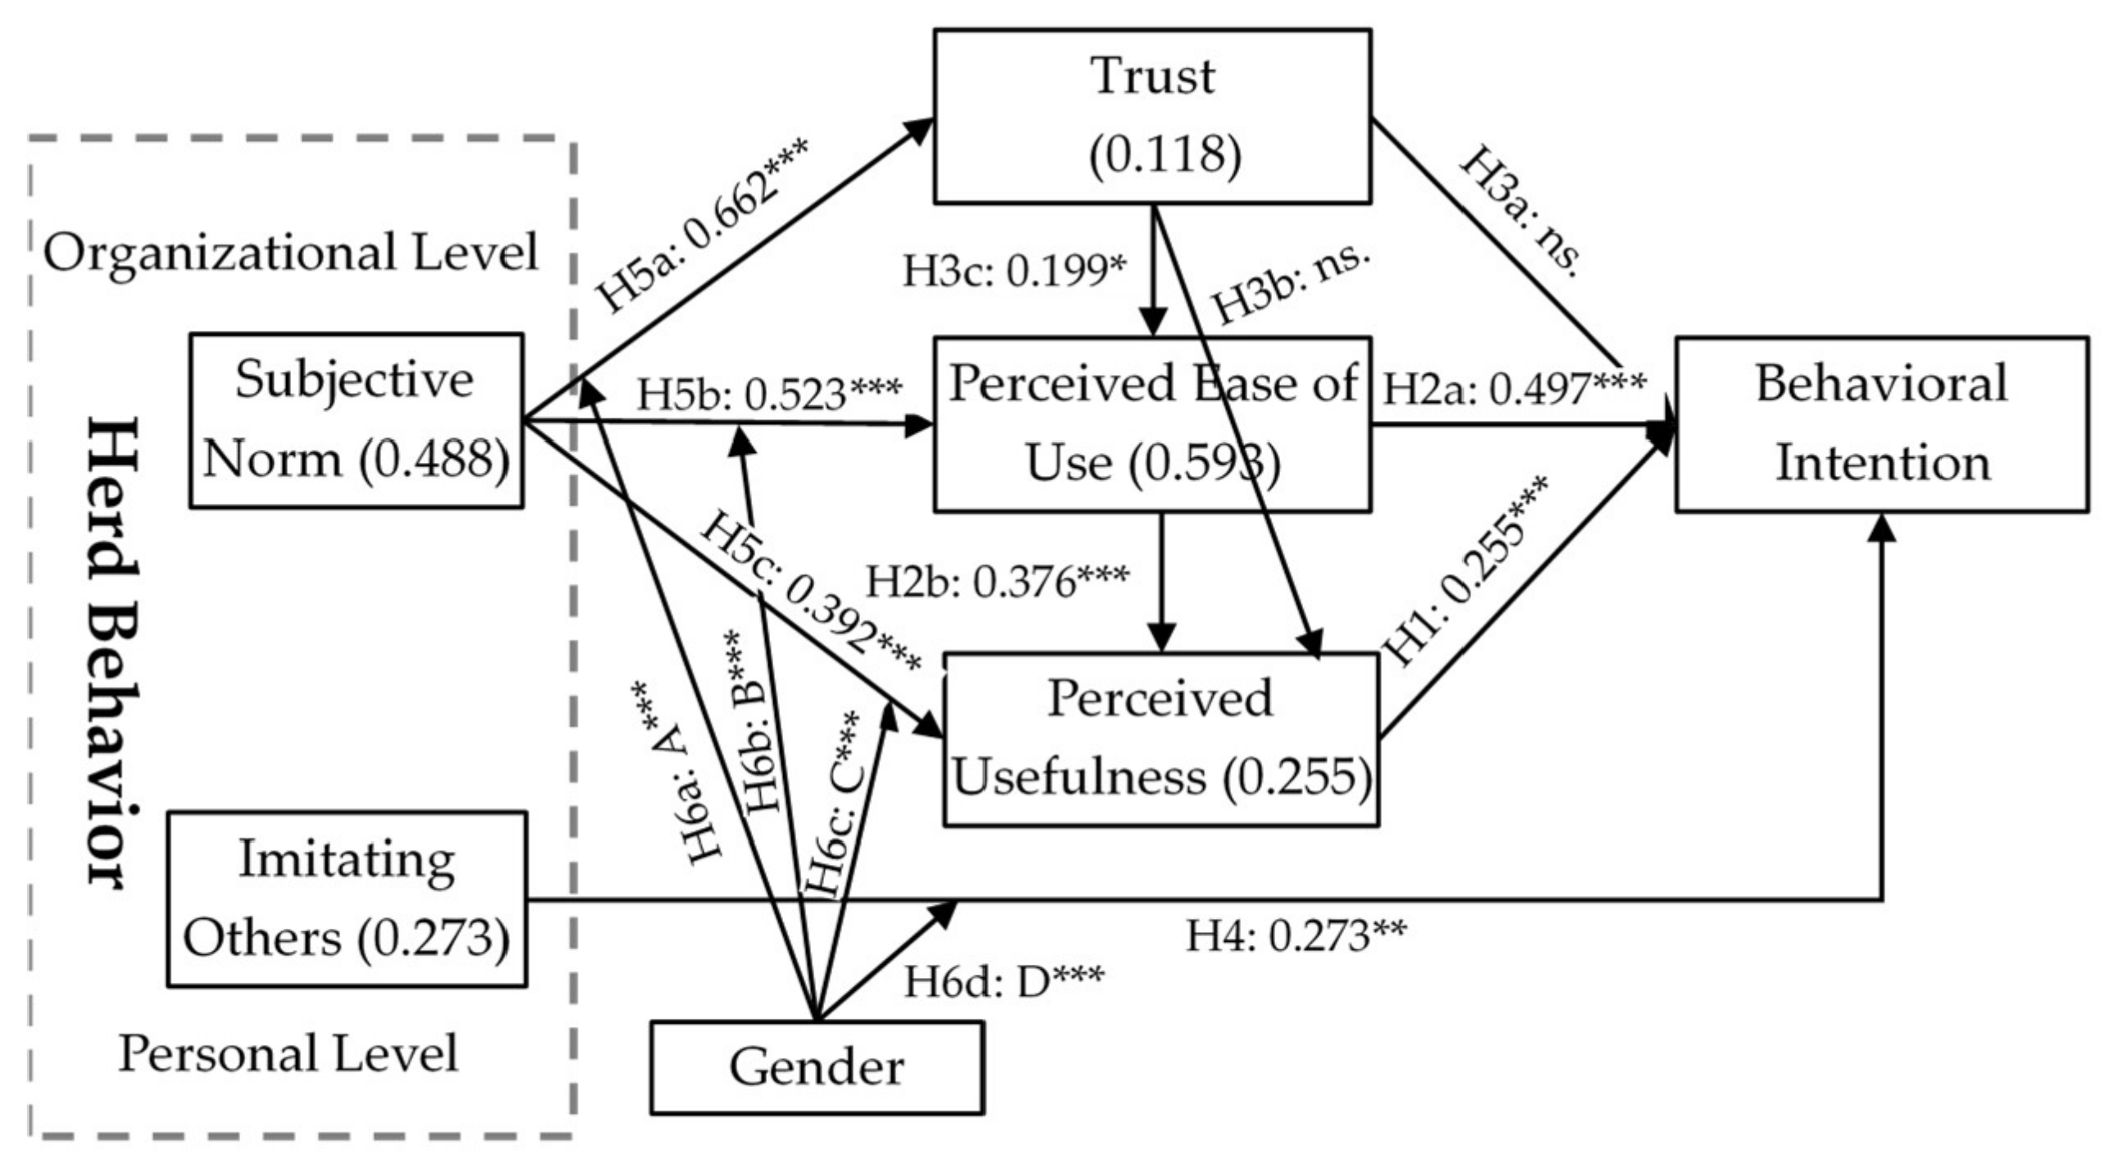
Second, we estimated our model through SEM. The results are shown in Figure 2. We determined that the collected data exhibited good fitness with the constructed model because fit indices other than the normed fit index (NFI) had more favorable values than those recommend (Table 2) [64]. TRU (0.118), PEOU (0.583), PU (0.255), SN (0.488), and IMI (0.273) are important explanatory factors of BI. Gender, the only moderator in this study, is a typical categorical variable, whereas the other five variables are continuous. According to Kemp (2014), the moderating effect can be examined using a group-based regression analysis if the independent and dependent variables are continuous and the moderator is categorical [65]. Therefore, we employed regression equations to determine the moderating effect. The F and t values in Table 3 (the regression results of H6a, H6b, H6c and H6d were coded with A, B, C and D, respectively) and Table 4 indicate that gender moderated the influences of SN on PU, SN on PEOU, SN on TRU, and IMI on BI.
6. Discussion
Figure 2 shows that all hypotheses other than H3a and H3b were supported. PU, which was affected by PEOU, had significant effects on BI and PEOU. This result indicated that the TAM [23] is applicable to the sharing economy. However, in contrast to the findings of Davis (1989) and in agreement with those of Chau (1996) [23,27], PEOU had a stronger effect than PU on BI. Notably, Chau (1996) argued that the effect of PEOU on BI is more important than that of PU when the product is a pure software project; we obtained a similar result for the sharing economy, which involves applications that are mostly not pure software projects [27]. Therefore, this conclusion is also applicable to services based on the internet and software such as applications in the sharing economy.
The results revealed that TRU had no significant direct effect on PU or BI but could affect them indirectly through PEOU; TRU explained only a small part of the variance of BI (0.118). Therefore, even if consumers’ trust in products and enterprises is low, their BI is not substantially affected. Furthermore, the sample mean of TRU was 3.901 (total score 5), meaning that consumers partly trusted sharing applications and enterprises. However, TRU had no significant influence on BI in the path analysis, demonstrating that it is not the measure which produced only low values, and TRU was not the key factor affecting consumers’ adoption. This may be because consumers know that their use and transfer costs are negligible compared with the convenience of the sharing economy. Generally, although consumers do not think that bicycle-sharing providers are trustworthy—or they do not believe that providers will keep their promises and commitments and have customers’ best interests in mind—they are still willing to use their services. Afterwards, they will continue to use these products as long as they believe the usage experience matches their expectations. If an enterprise fails to offer competitive services, consumers will not hesitate to switch to one that does. However, enterprises cannot ignore the cultivation of consumer trust because it may be the key to success as the industry develops.
The result indicated that herd behavior involving SN and IMI explained the majority of consumers’ BI (γ = 0.761, γSN = 0.488, γIMI = 0.273). Moreover, SN affected BI through TRU, PEOU, and PU, whereas IMI affected BI directly. When an organization (or influential individual) applies a certain amount of pressure to members (or followers) to adopt or not adopt a new product, this subjective norm-based pressure strongly influences the BI of potential consumers and directs their decision to use or not use the product. Therefore, enterprises must establish cooperative relationships with organizations that have many members and influential individuals who have numerous followers. In other situations, potential consumers make decisions based on the behaviors of other users when they are hesitant to use a product. Enterprises should actively provide consumers with objects to imitate to simplify their decision-making process. For example, enterprises can recruit product experiencers who can guide consumers to use bicycle-sharing applications in university campuses, large communities, or roads outside the subway stations during rush hours; thus, potential consumers will imitate the guiders and their BI will be enhanced.
We categorized the 394 respondents into two groups according to gender (177 men and 217 women). Then, we established four sets of regression equations that used gender as the moderating variable for the different independent and dependent variables. The results indicated that the herd effect (including SN and IMI) on BI was significantly stronger in the group of men than in the group of women. Therefore, men were more likely to change their decisions on whether to use a sharing application based on other users’ behaviors. To benefit from consumers’ herd behavior and enhance consumers’ BI, enterprises should be aware of this result. For instance, enterprises can cooperate with organizations in which the majority of members are men or influential individuals whose fans are mostly men.
Although low-carbon mobility has received support from governments, and electric vehicle technology is increasingly mature, many consumers (e.g., European car buyers) are still reluctant to use them [66]. Therefore, technology alone cannot solve the desire to use high-carbon transport options; it is more of a social problem than a technological one [67]. Philp and Taylor (2017) indicated that public awareness and perception are two major barriers for the transition to low-carbon transport [68]. However, sharing applications, such as bicycle sharing, may be one solution to this problem. According to our results, herd behavior, perceived usefulness, and perceived ease of use can affect consumers’ adoption of such services. In the Chinese context, it is easier for herd behavior to promote loose individual behaviors to uniform norms. A public awareness towards sustainability will form when these uniform norms are good for low carbon. Additionally, perceived usefulness and perceived ease of use can also promote consumers to have positive perceptions of bicycle sharing. Aditjandra et al. (2013) suggested that residents must be well informed of the available opportunities for them if they are to pursue sustainable travel choices [69]; thus, bicycle sharing should be promoted as a convenient and low-carbon choice for residents’ short trips. Enhancing consumers’ adoption of the sharing economy can contribute to the transition from a high-carbon to a low-carbon society, which will help ensure sustainable development.
Policy interventions can undoubtedly play a role in creating a low-carbon future [68]. Apart from market forces, policy packaging can contribute to low-carbon lifestyles where there is a lack of public acceptance [70]. Governments should encourage the use of low-carbon mobility options. Public sectors should advocate for the adoption of a low-carbon lifestyle to promote the concept as a subjective norm, and government leaders should also use sharing applications so that citizens’ “herd behavior” is directed appropriately; these measures can help promote the widespread adoption of low-carbon lifestyles. Eventually, such policy interventions will lead to increased use of low-carbon applications; in turn, this will eliminate the market for high-carbon vehicles, thereby contributing to sustainable development.
7. Theoretical and Practical Implications
From a theoretical perspective, this study indicated that herd behavior (including SN and IMI) can affect consumers’ BI directly or indirectly through TRU, PU and PEOU and that gender is a significant moderator in these relationships. This study, which demonstrated that the TAM remains effective and useful in the current research environment, was the first to integrate IMI into TAM, thus introducing a practical external variable to the field of technology acceptance. We considered the herd behavior at the organizational and personal levels as two important external variables and studied the direct and indirect effects through mediating variables of SN and IMI on consumers’ BI. In addition, we proposed the expanded TAM to facilitate understanding the psychological states of the users’ adoption of the sharing economy. As noted, this study revealed that men are more likely than women to change their decisions due to other users’ behaviors, providing empirical evidence to contradict the conventional wisdom that the herd effect influences women more strongly than men.
From a practical perspective, this study indicated that several factors affect users’ adoption of the sharing economy. As a representative commercial application of environmental protection, energy conservation, and sustainable development, the sharing economy not only provides convenience for people’s life but also contributes to the reduction of carbon emissions. In addition, this study was the first to explore willingness and BI toward bicycle-sharing applications, which are representative of low-carbon travel and commuting. The results are valuable for promoting sustainability and helping enterprises to attract consumers.
8. Conclusions
Enterprises in the sharing economy such as ofo and Mobike must identify the factors affecting users’ BI in order to attract more active users. This study integrated SN and IMI into the TAM to establish an expended TAM for sharing-economy applications such as bicycle sharing. The results indicated that PU, PEOU and IMI affected BI directly and SN and TRU affected BI indirectly. In addition, empirical evidence demonstrated that men are more likely to be affected by organizations and other users when hesitating to use a product. These findings will help government and enterprise decision-makers to design policies and strategies to increase consumers’ adoption of low-carbon applications to help promote sustainable development. In addition, this study of the sharing economy in China can serve as a reference for the development of the sharing economy around the world as Europeans prefer high-carbon mobility [66].
This study had several limitations. First, we considered only two variables of herd behavior as external variables. To identify more factors that affect users’ BI, more observed variables should be added. In this study, we accounted for the reality of sharing practices in China. To date, sharing economy applications remain novel to customers, which means that the effects of perceived risk and other external variables are temporarily less important than those of herd behavior. However, future research should consider measures such as “perceived risk” as an external variable. Second, in addition to gender, other variables, such as experience and voluntariness, may moderate the effects of the observed variables on the latent variables [25]. However, it is currently difficult to conduct longitudinal research on these subjects. The effect of moderating variables such as experience and voluntariness on external variables cannot be satisfactorily measured at current adoption rates for applications; once sharing-economy applications have been more widely adopted, these variables can be integrated into the research framework. Future studies should attempt to identify more observable and moderating variables and examine the factors affecting user retention and facilitating their continued usage [37].
Acknowledgments
Special thanks are extended to all tutors for reviewing this paper and providing direct or indirect assistance. This manuscript was edited by Wallace Academic Editing and was sponsored by the National Natural Science Foundation of China (grant number 71402040).
Author Contributions
All two authors took part in the investigation on Chinese sharing practices that this paper draws on. Yupeng Liu led the research design and gave guidance throughout the whole research process. Yutao Yang led model-building, data collection and data analysis, and wrote the majority of the paper.
Conflicts of Interest
We declare that we have no conflict of interest in this work.
Appendix A. Measurement Scales and Items
In terms of ethical considerations, it should be emphasized that the information collected is kept confidential and only used for academic research.
Perceived usefulness (PU; adapted from Venkatesh and Davis (2000))
- PU1: Using bicycle sharing improves my performance in my work and life.
- PU2: Using bicycle sharing for my work increases my productivity.
- PU3: Using the system enhances my effectiveness in my work and life.
- PU4: I find the system to be useful for my work and life.
Perceived ease of use (PEOU; adapted from Venkatesh and Davis (2000))
- PEOU1: My interactions with bicycle-sharing applications are clear and understandable.
- PEOU2: Interacting with bicycle-sharing applications does not require substantial mental effort.
- PEOU3: I find bicycle sharing easy to use.
- PEOU4: I can easily complete my desired tasks through bicycle-sharing applications.
Behavioral intention (BI; adapted from Davis (1996))
- BI1: Assuming I have access to bicycle sharing, I intend to use it.
- BI2: If I have access to bicycle sharing, I predict that I would use it.
Trust (TRU; adapted from Lee (2004))
- TRU1: Bicycle-sharing providers are trustworthy.
- TRU2: Bicycle-sharing providers keep their promises and commitments.
- TRU3: Bicycle-sharing providers have customers’ best interest in mind.
Imitating others (IMI; adapted from Sun (2013))
- IMI1: Bicycle sharing appears to be the dominant sharing application; therefore, I would like to use it as well.
- IMI2: I follow others in accepting bicycle sharing.
- IMI3: I would choose to accept bicycle sharing because many other people are already using it.
Subjective norm (SN; adapted from Venkatesh and Davis (2000))
- SN1: People who influence my behavior think that I should use the system.
- SN2: People who are important to me think that I should use the system.
References
- Roland Berger Strategy Consultants. China’s Car-Sharing Mobility Market 2018. 2016. Available online: https://www.rolandberger.com/nl/Publications/pub_china_s_car_sharing_mobility_market_2018.html (accessed on 6 May 2017).
- Li, K. Report on the work of the government 2016 (extract). Hum. Rights 2016, 2, 170–182. [Google Scholar]
- Meng, J. Economic Watch: China’s Sharing Economy Facing More Market Competition, Government Support. 2017. Available online: http://www.xinhuanet.com/english/2017-06/22/c_136386503.htm (accessed on 14 March 2018).
- Felson, M.; Spaeth, J.L. Community Structure and Collaborative Consumption. Am. Behav. Sci. 1978, 21, 614–624. [Google Scholar] [CrossRef]
- Botsman, R.; Rogers, R. What’s Mine Is Yours: The Rise of Collaborative Consumption; HarperCollins Publishers: New York, NY, USA, 2010. [Google Scholar]
- Chase, R. How People and Platforms are Inventing the Collaborative Economy and Reinventing Capitalism; Peers, Inc.: New York, NY, USA, 2015. [Google Scholar]
- iResearch Inc. 2017 China’s Sharing-Bicycle Industry Research Report. 2017. Available online: http://www.iresearch.com.cn/Detail/report?id=2961&isfree=0 (accessed on 8 May 2017). (In Chinese).
- Frenken, K. Sustainability perspectives on the sharing economy. Environ. Innov. Soc. Transit. 2017, 23, 1–2. [Google Scholar] [CrossRef]
- Banister, D. The Sustainable mobility paradigm. Transp. Policy 2008, 15, 73–80. [Google Scholar] [CrossRef]
- Akyelken, N.; Banister, D.; Givoni, M. The Sustainability of Shared Mobility in London: The Dilemma for Governance. Sustainability 2018, 10, 420. [Google Scholar] [CrossRef]
- Richard, O.; Jouannot, T. Bike sharing systems: Part of public policies on sustainable mobility. In Proceedings of the Transport Research Arena (TRA) 5th Conference: Transport Solutions from Research to Deployment, Paris, France, 14–17 April 2014. [Google Scholar]
- Kabra, A.; Belavina, E.; Girotra, K. Bike-Share Systems: Accessibility and Availability. Chicago Booth Research Paper 2015. (No. 15-04). Available online: http://www-2.rotman.utoronto.ca/MSOM-2015/Documents/D2Velib-ssrn.pdf (accessed on 8 May 2017).
- Porter, M.E. COMPETITIVE STRATEGY. In Competitive Strategy; Free Press: New York, NY, USA, 1980. [Google Scholar]
- Laurell, C.; Sandström, C. The sharing economy in social media: Analyzing tensions between market and non-market logics. Technol. Forecast. Soc. Chang. 2017, 125, 58–65. [Google Scholar] [CrossRef]
- Eckhardt, G.M.; Bardhi, F. The Sharing Economy Isn’t About Sharing at All—HBR. Harvard Business Review. 28 January 2015. Available online: https://hbr.org/2015/01/the-sharing-economy-isnt-about-sharing-at-all (accessed on 8 May 2017).
- Matofska, B. What is the Sharing Economy? The People Who Share. 1 September 2016. Available online: http://www.thepeoplewhoshare.com/blog/what-is-the-sharing-economy/ (accessed on 8 May 2017).
- Kotler, P.; Keller, K.L. Marketing Management, 14th ed.; Prentice Hall: Upper Saddle River, NJ, USA, 2012. [Google Scholar]
- Marangunić, N.; Granić, A. Technology acceptance model: A literature review from 1986 to 2013. Univers. Access Inf. Soc. 2015, 14, 81–95. [Google Scholar]
- Ajzen, I.; Fishbein, M. A bayesian analysis of attribution processes. Psychol. Bull. 1975, 82, 261–277. [Google Scholar] [CrossRef]
- Ajzen, I.; Fishbein, M. Understanding Attitudes and Predicting Social Behavior; Prentice-Hall: Upper Saddle River, NJ, USA, 1980. [Google Scholar]
- Gillmore, M.R.; Archibald, M.E.; Morrison, D.M.; Wilsdon, A.; Wells, E.A.; Hoppe, M.J.; Nahom, D.; Murowchick, E. Teen Sexual Behavior: Applicability of the Theory of Reasoned Action. J. Marriage Fam. 2002, 64, 885–897. [Google Scholar] [CrossRef]
- Ajzen, I. From Intentions to Actions: A Theory of Planned Behavior. In Action Control; Springer: Berlin/Heidelberg, Germany, 1985. [Google Scholar]
- Davis, F.D. Perceived usefulness, perceived ease of use, and user acceptance of information technology. MIS Q. 1989, 13, 319–340. [Google Scholar] [CrossRef]
- Davis, F.D.; Venkatesh, V. A critical assessment of potential measurement biases in the technology acceptance model: Three experiments. Int. J. Hum.-Comput. Stud. 1996, 45, 19–45. [Google Scholar] [CrossRef]
- Venkatesh, V.; Davis, F.D. A theoretical extension of the technology acceptance model: Four longitudinal field studies. Manag. Sci. 2000, 46, 186–204. [Google Scholar] [CrossRef]
- Venkatesh, V.; Morris, M.G.; Davis, G.B.; Davis, F.D. User acceptance of information technology: Toward a unified view. MIS Q. 2003, 27, 425–478. [Google Scholar] [CrossRef]
- Chau, P.Y.K. An empirical assessment of a modified technology acceptance model. J. Manag. Inf. Syst. 1996, 13, 185–204. [Google Scholar] [CrossRef]
- Rousseau, D.M.; Sitkin, S.B.; Burt, R.S.; Camerer, C. Introduction to special topic forum: Not so different after all: A cross-discipline view of trust. Acad. Manag. Rev. 1998, 23, 393–404. [Google Scholar] [CrossRef]
- Lee, T. The impact of perceptions of interactivity on customer trust and transaction intentions in mobile commerce. J. Electron. Commer. Res. 2005, 6, 165–180. Available online: http://pdfs.semanticscholar.org/2b7e/5c7e7b4cbcbaf2d834fcac664d17f6449ca0.pdf (accessed on 15 June 2017).
- Qiu, L.; Li, D. Applying TAM in B2C E-Commerce Research: An Extended Model. Tsinghua Sci. Technol. 2008, 13, 265–272. [Google Scholar] [CrossRef]
- Sang, Y.; Blecha, F. Dynamics between the trust transfer process and intention to use mobile payment services: A cross-environment perspective. Inf. Manag. 2011, 48, 393–403. [Google Scholar]
- Alsajjan, B.; Dennis, C. Internet banking acceptance model: Cross-market examination. J. Bus. Res. 2010, 63, 957–963. [Google Scholar] [CrossRef]
- Cheung, R.; Vogel, D. Predicting user acceptance of collaborative technologies: An extension of the technology acceptance model for e-learning. Comput. Educ. 2013, 63, 160–175. [Google Scholar] [CrossRef]
- Hsu, C.-L.; Lin, C.-C.J. Acceptance of blog usage: The roles of technology acceptance, social influence and knowledge sharing motivation. Inf. Manag. 2008, 45, 65–74. [Google Scholar] [CrossRef]
- Lu, Y.; Zhou, T.; Wang, B. Exploring Chinese users’ acceptance of instant messaging using the theory of planned behavior, the technology acceptance model, and the flow theory. Comput. Hum. Behav. 2009, 25, 29–39. [Google Scholar] [CrossRef]
- Wu, M.Y.; Chou, H.P.; Weng, Y.C.; Huang, Y.H. TAM2-Based Study of Website User Behavior—Using Web 2.0 Websites as an Example. WSEAS Trans. Bus. Econ. 2011, 8, 133–151. Available online: http://www.wseas.us/e-library/transactions/economics/2011/53-665.pdf (accessed on 15 June 2017).
- Zhou, T. An empirical examination of continuance intention of mobile payment services. Decis. Support Syst. 2013, 54, 1085–1091. [Google Scholar] [CrossRef]
- Burke, C.J.; Tobler, P.N.; Schultz, W.; Baddeley, M. Striatal BOLD Response Reflects the Impact of Herd Information on Financial Decisions. Front. Hum. Neurosci. 2010, 4, 48. [Google Scholar] [CrossRef] [PubMed] [Green Version]
- Banerjee, A.V. A simple model of herd behaviour. Q. J. Econ. 1992, 107, 797–817. Available online: http://www.jstor.org/stable/2118364 (accessed on 15 June 2017). [CrossRef]
- Çelen, B.; Kariv, S. Distinguishing informational cascades from herd behavior in the laboratory. Am. Econ. Rev. 2004, 94, 484–498. [Google Scholar] [CrossRef]
- Abrahamson, E.; Rosenkopf, L. Institutional and competitive bandwagons: Using mathematical modeling as a tool to explore innovation diffusion. Acad. Manag. Rev. 1993, 18, 487–517. [Google Scholar]
- Bernheim, B.D. A theory of conformity. J. Political Econ. 1994, 102, 841–877. Available online: https://www.journals.uchicago.edu/doi/pdfplus/10.1086/261957 (accessed on 15 June 2017). [CrossRef]
- Anderson, L.R.; Holt, C.A. Information Cascades in the Laboratory. Am. Econ. Rev. 1997, 87, 847–862. Available online: http://www.jstor.org/stable/2951328 (accessed on 15 June 2017).
- Fishbein, M.; Ajzen, I. Belief, Attitude, Intention and Behavior: An Introduction to Theory and Research; Addison-Wesley: Reading, MA, USA, 1975; Available online: http://people.umass.edu/aizen/f&a1975.html (accessed on 15 June 2017).
- Sun, H. A longitudinal study of herd behavior in the adoption and continued use of technology. MIS Q. 2013, 37, 1013–1041. [Google Scholar] [CrossRef]
- Davis, F.D.; Bagozzi, R.P.; Warshaw, P.R. User acceptance of computer technology: A comparison of two theoretical models. Manag. Sci. 1989, 35, 982–1003. [Google Scholar] [CrossRef]
- Davis, F.D. User acceptance of information technology: System characteristics, user perceptions and behavioral impacts. Int. J. Man-Mach. Stud. 1993, 38, 475–487. [Google Scholar] [CrossRef]
- Subramanian, G.H. A replication of perceived usefulness and perceived ease of use measurement. Decis. Sci. 1994, 25, 863–874. [Google Scholar] [CrossRef]
- Keil, M.; Beranek, P.M.; Konsynski, B.R. Usefulness and Ease of Use: Field Study Evidence Regarding Task Considerations; Elsevier Science Publishers B. V.: Amsterdam, The Netherlands, 1995. [Google Scholar]
- Gefen, D.; Karahanna, E.; Straub, D.W. Trust and TAM in Online Shopping: An Integrated Model. MIS Q. 2003, 27, 51–90. [Google Scholar] [CrossRef]
- Taylor, S.; Todd, P.A. Understanding information technology usage: A test of competing models. Inf. Syst. Res. 1995, 6, 144–176. [Google Scholar] [CrossRef]
- Lucas, H.C., Jr.; Spitler, V.K. Technology use and performance: A field study of broker workstations. Decis. Sci. 2010, 30, 291–311. [Google Scholar] [CrossRef]
- James, L.R.; Brett, J.M. Mediators, moderators, and tests for mediation. J. Appl. Psychol. 1984, 69, 307–321. [Google Scholar] [CrossRef]
- Awang, Z. Analyzing the Effect of a Moderator in a Model: The Multi-Group CFA Procedure in SEM. In Proceedings of the Academic Colloquium for Academicians & Postgraduates, Kuala Terengganu, Malaysia, 15 November 2014; pp. 128–154. Available online: https://www.researchgate.net/publication/268508427_Analyzing_the_Effect_of_a_Moderator_in_a_Model_The_Multi-Group_CFA_Procedure_in_SEM_Zainudin_Awang_2014_Universiti_Sultan_Zainal_Abidin_Terengganu_Malaysia (accessed on 14 March 2018).
- Baron, R.M.; Kenny, D.A. The moderator-mediator variable distinction in social psychological research: Conceptual, strategic, and statistical considerations. J. Personal. Soc. Psychol. 1986, 51, 1173–1182. [Google Scholar] [CrossRef]
- Teo, T. Establishing gender structural invariance of Technology Acceptance Model (TAM). Asia-Pac. Educ. Res. 2010, 19, 311–320. [Google Scholar] [CrossRef]
- Tarhini, A.; Hone, K.; Liu, X. Measuring the Moderating Effect of Gender and Age on E-Learning Acceptance in England: A Structural Equation Modeling Approach for an Extended Technology Acceptance Model. J. Educ. Comput. Res. 2014, 51, 163–184. [Google Scholar] [CrossRef]
- Liu, D.; Guo, X. Exploring gender differences in acceptance of mobile computing devices among college students. Inf. Syst. e-Bus. Manag. 2016, 15, 197–223. [Google Scholar] [CrossRef]
- Gefen, D.; Straub, D.W. Gender differences in the perception and use of E-mail: An extension to the technology acceptance model. MIS Q. 1997, 21, 389–400. [Google Scholar] [CrossRef]
- Chen, X.; Xu, S.; Fan, J. Empirical Methods in Organization and Management Research, 2nd ed.; Peking University Press: Beijing, China, 2012. (In Chinese) [Google Scholar]
- Straub, D.; Boudreau, M.C.; Gefen, D. Validation guidelines for IS positivist research. Commun. Assoc. Inf. Syst. 2004, 3. Available online: http://www.ic.unicamp.br/~wainer/cursos/2s2006/epistemico/Straub%20et%20al.%202004%20working%20paper%20version.pdf (accessed on 15 June 2017).
- Anderson, J.C.; Gerbing, D.W. Structural equation modeling in practice: A review and recommended two-step approach. Psychol. Bull. 1988, 103, 411–423. [Google Scholar] [CrossRef]
- Bagozzi, R.P.; Yi, Y. On the evaluation of structure equation models. J. Acad. Mark. Sci. 1998, 16, 74–94. Available online: https://www.researchgate.net/publication/225359099_On_the_Evaluation_of_Structure_Equation_Models (accessed on 15 June 2017). [CrossRef]
- Gefen, D.; Straub, D.W.; Boudreau, M.C. Structural Equation Modeling and Regression: Guidelines for Research Practice. Commun. Assoc. Inf. Syst. 1978, 4, 1–70. Available online: http://pdfs.semanticscholar.org/3787/715114e286042aac4fd9b612114c226c6fe9.pdf (accessed on 15 June 2017).
- Kemp, I.C. Fundamentals of energy analysis of dryers. Mod. Dry. Technol. Energy Sav. 2012, 11, 266–287. Available online: https://application.wiley-vch.de/books/sample/3527315594_c01.pdf (accessed on 15 June 2017).
- Hackbarth, A.; Madlener, R. Consumer preferences for alternative fuel vehicles: A discrete choice analysis. Transp. Res. Part D 2013, 25, 5–17. [Google Scholar] [CrossRef]
- Givoni, M. Alternative pathways to low carbon mobility. In Moving towards Low Carbon Mobility; Edward Elgar Publishing: Cheltenham, UK, 2013; pp. 209–230. [Google Scholar]
- Philp, M.; Taylor, M.A.P. Research agenda for low-carbon mobility: Issues for New World cities. Int. J. Sustain. Transp. 2017, 11, 49–58. [Google Scholar] [CrossRef]
- Aditjandra, P.T.; Mulley, C.; Nelson, J.D. The influence of neighbourhood design on travel behaviour: Empirical evidence from North East England. Transp. Policy 2013, 26, 54–65. [Google Scholar] [CrossRef]
- Justen, A.; Fearnley, N.; Givoni, M.; Macmillen, J. A process for designing policy packaging: Ideals and realities. Transp. Res. Part A 2014, 60, 9–18. [Google Scholar] [CrossRef]
Figure 1.
Study framework.

Figure 2.
Research model and results estimated using the software AMOS 23. (Note: * p < 0.05; ** p < 0.01; *** p < 0.001; ns: not significant).
Figure 2.
Research model and results estimated using the software AMOS 23. (Note: * p < 0.05; ** p < 0.01; *** p < 0.001; ns: not significant).


Table 1.
Standardized item loadings, measurement errors, Cronbach’s alphas, average variance extracted (AVE) values, and composite reliability (CR) scores.
Table 1.
Standardized item loadings, measurement errors, Cronbach’s alphas, average variance extracted (AVE) values, and composite reliability (CR) scores.
| Factor | Item | Standardized Item Loading | Measuring Error | Cronbach’s Alpha | AVE | CR |
|---|---|---|---|---|---|---|
| Perceived usefulness (PU) | PU1 | 0.663 | 0.263 | 0.742 | 0.568 | 0.838 |
| PU2 | 0.68 | 0.291 | ||||
| PU3 | 0.51 | 0.473 | ||||
| PU4 | 0.722 | 0.252 | ||||
| Perceived ease of use (PEOU) | PEOU1 | 0.747 | 0.27 | 0.805 | 0.655 | 0.883 |
| PEOU2 | 0.715 | 0.311 | ||||
| PEOU3 | 0.69 | 0.241 | ||||
| PEOU4 | 0.707 | 0.261 | ||||
| Behavioral intention (BI) | BI1 | 0.817 | 0.162 | 0.829 | 0.833 | 0.909 |
| BI2 | 0.867 | 0.123 | ||||
| Trust (TRU) | TRU1 | 0.745 | 0.27 | 0.784 | 0.682 | 0.865 |
| TRU2 | 0.818 | 0.184 | ||||
| TRU3 | 0.669 | 0.324 | ||||
| Imitating others (IMI) | IMI1 | 0.693 | 0.26 | 0.708 | 0.569 | 0.798 |
| IMI2 | 0.677 | 0.378 | ||||
| IMI3 | 0.662 | 0.404 | ||||
| Subjective norm (SN) | SN1 | 0.666 | 0.373 | 0.71 | 0.554 | 0.713 |
| SN2 | 0.68 | 0.357 | ||||
| The whole questionnaire | 0.906 |
Table 2.
Recommended and actual values of fit indices.
| Fit Indices | CMIN/df | GFI | AGFI | CFI | NFI | TLI (NNFI) | RMSEA |
|---|---|---|---|---|---|---|---|
| Recommended value | <3 | >0.90 | >0.80 | >0.90 | >0.90 | >0.90 | <0.08 |
| Actual value | 2.767 | 0.91 | 0.877 | 0.924 | 0.887 | 0.908 | 0.067 |
Note: CMIN/df: ratio between chi-squared and degrees of freedom, GFI: goodness of fit index, AGFI: adjusted goodness of fit index, CFI: comparative fit index, NFI: normed fit index, NNFI: non-normed fit index, RMSEA: root mean square error of approximation.
Table 3.
Key parameters of the models.
| Code | Gender | Sample Size | R | Adjusted R² | Changed Statistic | Predictor Variable | Dependent Variable | ||||
|---|---|---|---|---|---|---|---|---|---|---|---|
| Changed R² | Changed F | df1 | df2 | Sig. F | |||||||
| A | Female | 217 | 0.268 | 0.068 | 0.072 | 16.684 | 1 | 215 | 0 | SN | TRU |
| Male | 177 | 0.443 | 0.192 | 0.197 | 42.847 | 1 | 175 | 0 | SN | TRU | |
| B | Female | 217 | 0.285 | 0.077 | 0.081 | 19.002 | 1 | 215 | 0 | SN | PEOU |
| Male | 177 | 0.520 | 0.266 | 0.27 | 64.774 | 1 | 175 | 0 | SN | PEOU | |
| C | Female | 217 | 0.377 | 0.138 | 0.142 | 35.578 | 1 | 215 | 0 | SN | PU |
| Male | 177 | 0.498 | 0.243 | 0.248 | 57.589 | 1 | 175 | 0 | SN | PU | |
| D | Female | 217 | 0.522 | 0.269 | 0.272 | 80.504 | 1 | 215 | 0 | IMI | BI |
| Male | 177 | 0.596 | 0.351 | 0.355 | 96.377 | 1 | 175 | 0 | IMI | BI | |
Table 4.
Coefficient of regression and significance test.
| Gender | Model | Unstandardized Coefficients | Standardized Coefficients | T-Statistic | Sig. | Dependent Variable | ||
|---|---|---|---|---|---|---|---|---|
| B | Standard Error | Beta | ||||||
| Female | 1a | (Constant) | 2.924 | 0.199 | 14.727 | 0 | PU | |
| SN | 0.281 | 0.047 | 0.377 | 5.965 | 0 | PU | ||
| Male | 1b | (Constant) | 2.385 | 0.21 | 11.376 | 0 | PU | |
| SN | 0.394 | 0.052 | 0.498 | 7.589 | 0 | PU | ||
| Female | 2a | (Constant) | 3.273 | 0.24 | 13.64 | 0 | PEOU | |
| SN | 0.248 | 0.057 | 0.285 | 4.359 | 0 | PEOU | ||
| Male | 2b | (Constant) | 2.514 | 0.206 | 12.232 | 0 | PEOU | |
| SN | 0.409 | 0.051 | 0.52 | 8.048 | 0 | PEOU | ||
| Female | 3a | (Constant) | 2.992 | 0.24 | 12.444 | 0 | TRU | |
| SN | 0.233 | 0.057 | 0.268 | 4.085 | 0 | TRU | ||
| Male | 3b | (Constant) | 2.238 | 0.248 | 9.039 | 0 | TRU | |
| SN | 0.401 | 0.061 | 0.443 | 6.546 | 0 | TRU | ||
| Female | 4a | (Constant) | 2.304 | 0.242 | 9.531 | 0 | BI | |
| SN | 0.513 | 0.057 | 0.522 | 8.972 | 0 | BI | ||
| Male | 4b | (Constant) | 1.762 | 0.254 | 6.945 | 0 | BI | |
| SN | 0.618 | 0.063 | 0.596 | 9.817 | 0 | BI | ||
© 2018 by the authors. Licensee MDPI, Basel, Switzerland. This article is an open access article distributed under the terms and conditions of the Creative Commons Attribution (CC BY) license (http://creativecommons.org/licenses/by/4.0/).
Share and Cite
MDPI and ACS Style
Liu, Y.; Yang, Y. Empirical Examination of Users’ Adoption of the Sharing Economy in China Using an Expanded Technology Acceptance Model. Sustainability 2018, 10, 1262. https://doi.org/10.3390/su10041262
AMA Style
Liu Y, Yang Y. Empirical Examination of Users’ Adoption of the Sharing Economy in China Using an Expanded Technology Acceptance Model. Sustainability. 2018; 10(4):1262. https://doi.org/10.3390/su10041262
Chicago/Turabian StyleLiu, Yupeng, and Yutao Yang. 2018. "Empirical Examination of Users’ Adoption of the Sharing Economy in China Using an Expanded Technology Acceptance Model" Sustainability 10, no. 4: 1262. https://doi.org/10.3390/su10041262
Note that from the first issue of 2016, this journal uses article numbers instead of page numbers. See further details here.