1. Background
Recently, the sustainable management of water resources has become an important policy issue in Europe. The access to clean and good-quality drinking water and adequate sanitation service is of primary importance to ensure human well-being, protection of public health and ecosystems, energy production, industry and agriculture development, and economic growth. Hence, any disruption in the supply of water and wastewater services and scarcity of water resources have negative impacts on the quality of human life and economic activity [
1].
The provision of water and wastewater services requires considerable investment to comply with the European Union Urban Waste Water Treatment and Drinking Water directives and the various national laws. Thus, in the near future, the main water management challenges in Europe will be the operations, maintenance, upgrading, and renovation of the infrastructure. This implies that water and wastewater services should be managed in an economically and environmentally sustainable fashion.
The water industry plays an important role by establishing and operating sustainable and resource-efficient water supply and wastewater treatment systems. Because of its nature, the water and wastewater service industry often has the characteristic of a monopolistic market in a certain territory. Hence, to ensure that the service is provided to consumers meeting quality, equity and cost requirements, the industry is subject to regulation. Water and wastewater services are generally supplied to both citizens and businesses by water utilities. In some cases, these utilities are run by private companies that operate the infrastructure assets under a concession trusted by the government or a public authority. In other cases, they are run by public–private partnership (PPP) [
2] companies or by companies owned only by the public sector. Finally, some utilities are run by public authorities or local municipalities, or water and wastewater services are provided directly as a municipal service. In all situations, the infrastructure assets can be publicly or privately owned.
In Europe, water utilities must carry out continuous and considerable investment to replace, renovate and upgrade the drinking water and wastewater infrastructure and increase the efficiency of resource utilization to meet the EU directives and national legislation requirements and secure water delivery for future generations. According to recent estimates, about 640 billion euros per year until 2030 are necessary to develop or keep in operation the global water infrastructure, with about 20% of this needed in Europe alone [
3,
4]. Investments in the industry generally have long payback times and low ROI rates [
5]. Furthermore, dealing with conflicting business, economic and social goals often makes investment decision-making and planning a difficult task for utility managers and policy makers. Water infrastructure investment requires huge flows of financial resources to repay capital expenditure, maintenance and operational costs. However, keeping water tariffs low to account for affordability without discriminating among consumer segments undermines the financial sustainability of the service over time. Indeed, the lack of sufficient funds necessary to invest has as a consequence the deterioration of the existing infrastructure and the impossibility of extending and improving the water and wastewater network, and a general decrease of the water and service quality. The low quality of the service has a negative impact on the willingness to pay of the consumers, and forces people unable to benefit from the service to pay more to use alternative sources for water services. Finally, the water utilities will get reduced revenue flows to cover the capital and operational costs of infrastructure investment. Water losses in the aqueduct network and a large difference between inflowing and outflowing water are a visible effect of the age of the infrastructure and bad maintenance. Even increasing water abstraction from existing or new sources to meet demand that exceeds supply may not be a viable solution to improve service quality and deal with water shortage. Increasing the amount of water abstracted and introduced into the aqueduct network implies increasing the consumption of further resources, particularly energy.
Thus, increasing the efficiency of water services is a primary goal to achieve for water utilities to ensure the sustainability of water supply. For this reason, benchmarking and efficiency analyses have become an important business practice in the water service industry, useful both to the utility operating companies and policy makers. This paper presents an efficiency study of the water and wastewater industry in Italy, adopting a hybrid three-stage modeling approach to measure the efficiency of the water service operators at different stages of the value chain of their production process, within a multiple-goal/multiple-efficiency perspective. Specifically, this approach shifts the efficiency analysis to a two-dimensional performance space, i.e., resource and market-efficiency, and considers the different efficiency components of the production process, offering a more comprehensive view of the water service industry efficiency. Additionally, it allows accounting for different business goals of the water operator at the same time and an investigation of industry trade-offs. The approach combines network and conventional data envelopment analysis (DEA) to model the production process of the water utility operator. The proposed approach is implemented to calculate the efficiency of 53 Italian water and wastewater service operators. This approach is particularly tailored to conduct efficiency studies in sectors such as the Italian water services industry. In Italy, there has for a long time been an intense discussion about the actual possibility of reconciling the financial sustainability, affordability, reliability and quality of provision of the water and wastewater services, currently conceived as a universal service, on the one side, and the present structure of the industry and the tariff scheme imposed to the market by the regulating authority on the other side.
The paper unfolds as follows.
Section 2 presents a literature review on benchmarking and performance analysis in the water and wastewater services that adopts DEA as a nonparametric technique to model and measure efficiency.
Section 3 illustrates the three-stage water utility operator production model.
Section 4 introduces the DEA method, while
Section 5 presents the network and conventional DEA models utilized in the paper.
Section 6 provides information relative to sample, data and variables used to specify DEA models in the Italian water services industry. Finally, results of the study are reported in
Section 7 and conclusions, limitations and further extensions of the study are discussed in
Section 8.
2. Literature Review
In recent years, several scholars have undertaken studies on the water supply and wastewater industry efficiency adopting DEA [
6]. Studies differ with respect to DEA model specification, aims, country of focus, and the scope of the analysis. Notwithstanding this large variety, literature contributions can be grouped into three main categories: (a) measurement of industry efficiency in specific countries and/or international comparison; (b) investigation of the factors that influence the efficiency measurements; (c) joint measurement of operational and environmental efficiencies. Recent contributions are presented as follows.
2.1. Measurement of Industry Efficiency in Specific Countries or International Efficiency Comparison
Alsharif et al. [
7] measure the efficiency of water usage in a sample of municipalities located in the Palestinian Territories (West Bank and the Gaza Strip) using data relative to the period 1999–2002. They find that water use efficiency was lower in the Gaza Strip than in the West Bank. In addition, the examination of the size of slacks in the DEA model indicates that water loss is the major source of inefficiency. Finally, they find that the efficiency scores are scarcely influenced by the municipality size. Corton and Berg [
8] analyze the relative efficiency of water utilities in six countries in the Central America region by implementing DEA and a stochastic cost frontier analysis covering the period 2002–2005. Cunha and De Witte [
9] adopt non-parametric free-disposal hull (FDH) analysis to analyze the Portuguese water market structure, utilizing data relative to the year 2005. Specifically, scholars focus their attention on scale and scope economies. Results from their study support the idea of a monopolistic industry, in which scale economies determine the achievement of acceptable efficiency rates, while scope economies are absent. They also identify the optimal scale of the utilities—between 160,000 and 180,000 inhabitants. Romano and Guerrini [
10] adopt DEA to evaluate the cost-efficiency of 43 water utilities in Italy. By grouping utilities into homogeneous clusters and using non-parametric statistical analysis, they find that the ownership structure, size and geographical location have an influence on the efficiency of water utilities. Singh et al. [
11] employ an input-oriented variable returns to scale DEA model to obtain an index of the sustainability–efficiency of 35 North Indian urban water utilities located in two union territories (Chandigarh and Delhi) and three states (Haryana, Punjab and Uttar Pradesh). Criteria considered for assessing sustainability of water services are service sufficiency, service reliability, resource conservation, staff rationalization, and business viability. Findings indicate that most of the utilities are low-performing and that there is room for significant improvement with respect to operation and maintenance costs, human resource, and water losses. Abbot et al. [
12] apply the Malmquist DEA to determine the different levels of productivity and efficiency improvement of the water and wastewater sectors of Australia’s major urban centers since the mid of 1990s. They find that the structural reform determined modest but positive productivity gains. However, scholars underline the necessity to take into account important exogenous factors that may influence the productivity rates. Da Cruz et al. [
13] carried out an international benchmarking study comparing the efficiency measurements of 33 Italian utilities and 55 Portuguese utilities that provide drinking water and wastewater services. Scholars adopt two DEA model specifications and assume both constant and variable returns to scale. Additionally, they also explore the impact of the governance structure on efficiency. Results do not show any statistical evidence of a significant difference between the efficiencies of Portuguese and Italian utilities, while public utilities are more efficient than private utilities. Da Cruz et al. [
14] develop a shared-input DEA model to obtain joint and separate measurements of the cost-efficiencies of the drinking water and wastewater services provided by water utilities. The results indicate that a single efficiency measure may be unable to provide enough information necessary to effectively monitor multi-utilities. Molinos-Senante et al. [
15] apply the directional distance function and the Luenberger productivity indicator to evaluate the productivity growth of 22 water companies in England and Wales between 2001 and 2008. The proposed nonparametric model allows accounting for both input contractions and output expansions. Results show that the primary determinant of the productivity of the water companies was the negative shift of the production frontier. Deng et al. [
16] measure water use and sewage service efficiency in 31 provinces in China between 2004 and 2013 by adopting a slack-based measure (SBM)-DEA model specification. Panel data analysis is adopted to investigate what factors influence water use efficiency. Specifically, scholars find that efficiency of water usage is higher in more developed provinces, while inefficiencies of labor and water inputs are larger than that of capital input. Additionally, water consumption per capita and added value in agriculture have a negative impact on water resource use efficiency.
2.2. Investigation of the Factors That Influence the Efficiency Measurements
Abbot and Cohen [
17] conduct a literature review considering the empirical studies that measured the level of efficiency and productivity in the water industry. In particular, they focus on the key structural findings which emerged from the empirical studies, paying greater attention to the economies of scale and scope, public vs. private ownership, and the effect of industry regulation. Byrnes et al. [
18] implement DEA to evaluate the relative technical efficiency and productivity of 52 water utilities in regional New South Wales (NSW) and Victoria over a four-year period, 2000–2004. Further, they measure the effect of some exogenous variables, i.e., governance arrangements, network characteristics and the consequence of urban water policy instruments on efficiency and productivity. Results show that the size of the utilities influences their efficiency, whereas the universal policy of water restrictions has a negative impact on efficiency. Carvalho and Marques [
19] evaluate the impact of exogenous variables on the efficiency of 66 Portuguese water utilities operating between 2002 and 2008 by applying the robust conditional order-m nonparametric analysis. Research findings suggest that some utilities are largely inefficient, and there are several exogenous variables that may substantially influence efficiency. Such variables include regulation, ownership, customer density, water source, peak factor and number of residential customers. Mbuvi et al. [
20] use a step-wise DEA approach based on a double bootstrap procedure to obtain robust estimates of efficiencies of a sample of African drinking water utilities. In the first step, scholars compute the utilities’ technical efficiencies. In the second step, they assess the utilities’ effectiveness in meeting customer demand for water services. In the final step, the difference between inefficiency and ineffectiveness measurements is decomposed. They also investigate different types of determinants of inefficiencies and ineffectiveness. Lo Storto [
21] measures the efficiency of the Italian water service industry. The scholar employs a two-stage DEA procedure to evaluate the influence that the typologies of concessionaires and contracts to provide water services have on efficiency. In the first stage of the procedure, the operational efficiency of the water service utilities is computed by applying DEA under the assumption of variable returns to scale including both physical and financial inputs and outputs. In the second stage, bootstrapped DEA efficiencies are estimated and Tobit regression is performed to evaluate the effect that some context factors have on the efficiency of water utility operators. Results indicate that the Italian water service industry presents operational inefficiencies, and the low efficiency may be determined by scale and agglomeration economies. Moreover, the concessionaire typology and its geographical location influence efficiency. Lo Storto [
22] performs a benchmarking analysis of the Italian water industry, considering the ATO (a geographical area circumscribed by law, where water service is provided by one or more utilities) as the research unit. Particularly, he employs DEA to compute the efficiency of 38 ATOs and carries out stepwise regression to evaluate the effect of the contract typology on the ATOs’ operational efficiencies. The scholar finds that operational efficiency increases in the ATOs in which the water service supply concession contract is consistent with the new legislative framework or in the ATOs in which service is provided by a private equity owned or by PPP operators. Chen et al. [
23] use DEA to measure the performance of domestic water management in China. Scholars compare the efficiencies of 22 counties in Taiwan during 2009–2011, distinguishing between urban and rural regions. They also implement Tobit regression to find factors that affect efficiency. Results from DEA indicate that urban and rural regions differ with respect to water efficiency. The output of the regression analysis suggests that the extent rate of sewerage systems, the volunteer participation rate and the education level influence management performance. Marques et al. [
24] conduct an extensive benchmarking study of the drinking water industry in Japan applying data envelopment analysis to measure efficiency of 1144 utilities considering 5538 observations relative to the period 2004–2007. Scholars adopt both constant and variable returns to scale assumptions. Findings show that the average level of inefficiency is 57% under the assumption of constant return to scale model, but the average inefficiency decreases to 24% assuming variable return to scale. The study also explores factors that influence efficiency: region, prefecture, ownership/governance, water source, vertical integration (purchased or produced alone), water or integrated system, production, treatment, transport and distribution of water), peak factor, per capita consumption, customer density, water losses, monthly water charge, outsourcing, subsidies, gross prefecture product, and time.
2.3. Joint Measurement of Operational and Environmental Efficiencies
Bian et al. [
25] develop a DEA-based approach applying network DEA and environmental DEA to measure the efficiencies of 26 regional urban water use and wastewater decontamination systems in mainland China. Data relative to 2009 are utilized in the study. In the proposed approach, the urban water system is decomposed into two sub-systems, one related to the use of drinking water and the other to wastewater decontamination. Two efficiencies for the two sub-systems are calculated, while the overall efficiency is measured as the average of the two sub-system efficiencies. This approach allows the identification of inefficiencies determined by the interaction between the two sub-systems. Wang et al. [
26] employ a slacks-based measure DEA model to evaluate the efficiency of water usage, the potential for water saving, reduction potentials of pollutants and related abatement costs in the interval 2009–2010 in China regional industrial systems. Findings indicate that potential for water consumption and pollutant discharge reduction is high, although there are geographical disparities. Moreover, while efficiency in water usage increased from 2009 to 2010, costs necessary to abate pollutants decreased. Ananda and Hampf [
27] employ the global Malmquist–Luenberger productivity index to compute the productivity trend in the Australian urban water sector accounting for undesirable outputs. Scholars use a panel data set covering the time window from 2006 to 2011. Their study suggests that the productivity scores are significantly affected by the inclusion in the analysis of greenhouse gas emissions. Particularly, not including undesirable outputs provides unrealistic measurements that overstate the productivity growth.
This review shows that the “black-box” modeling approach is often used by scholars to model the water utility production process and rarely (only one paper in this review, i.e., [
25]) is it decomposed into sub-processes. Opening the black-box of the production process has two major strengths as it allows calculating more robust efficiency measurements, one for each sub-process and for the global process, and for dealing with different and conflicting goals. The study presented in this paper contributes to literature consistently with this view.
3. The Water Service Utility Operator Production Model
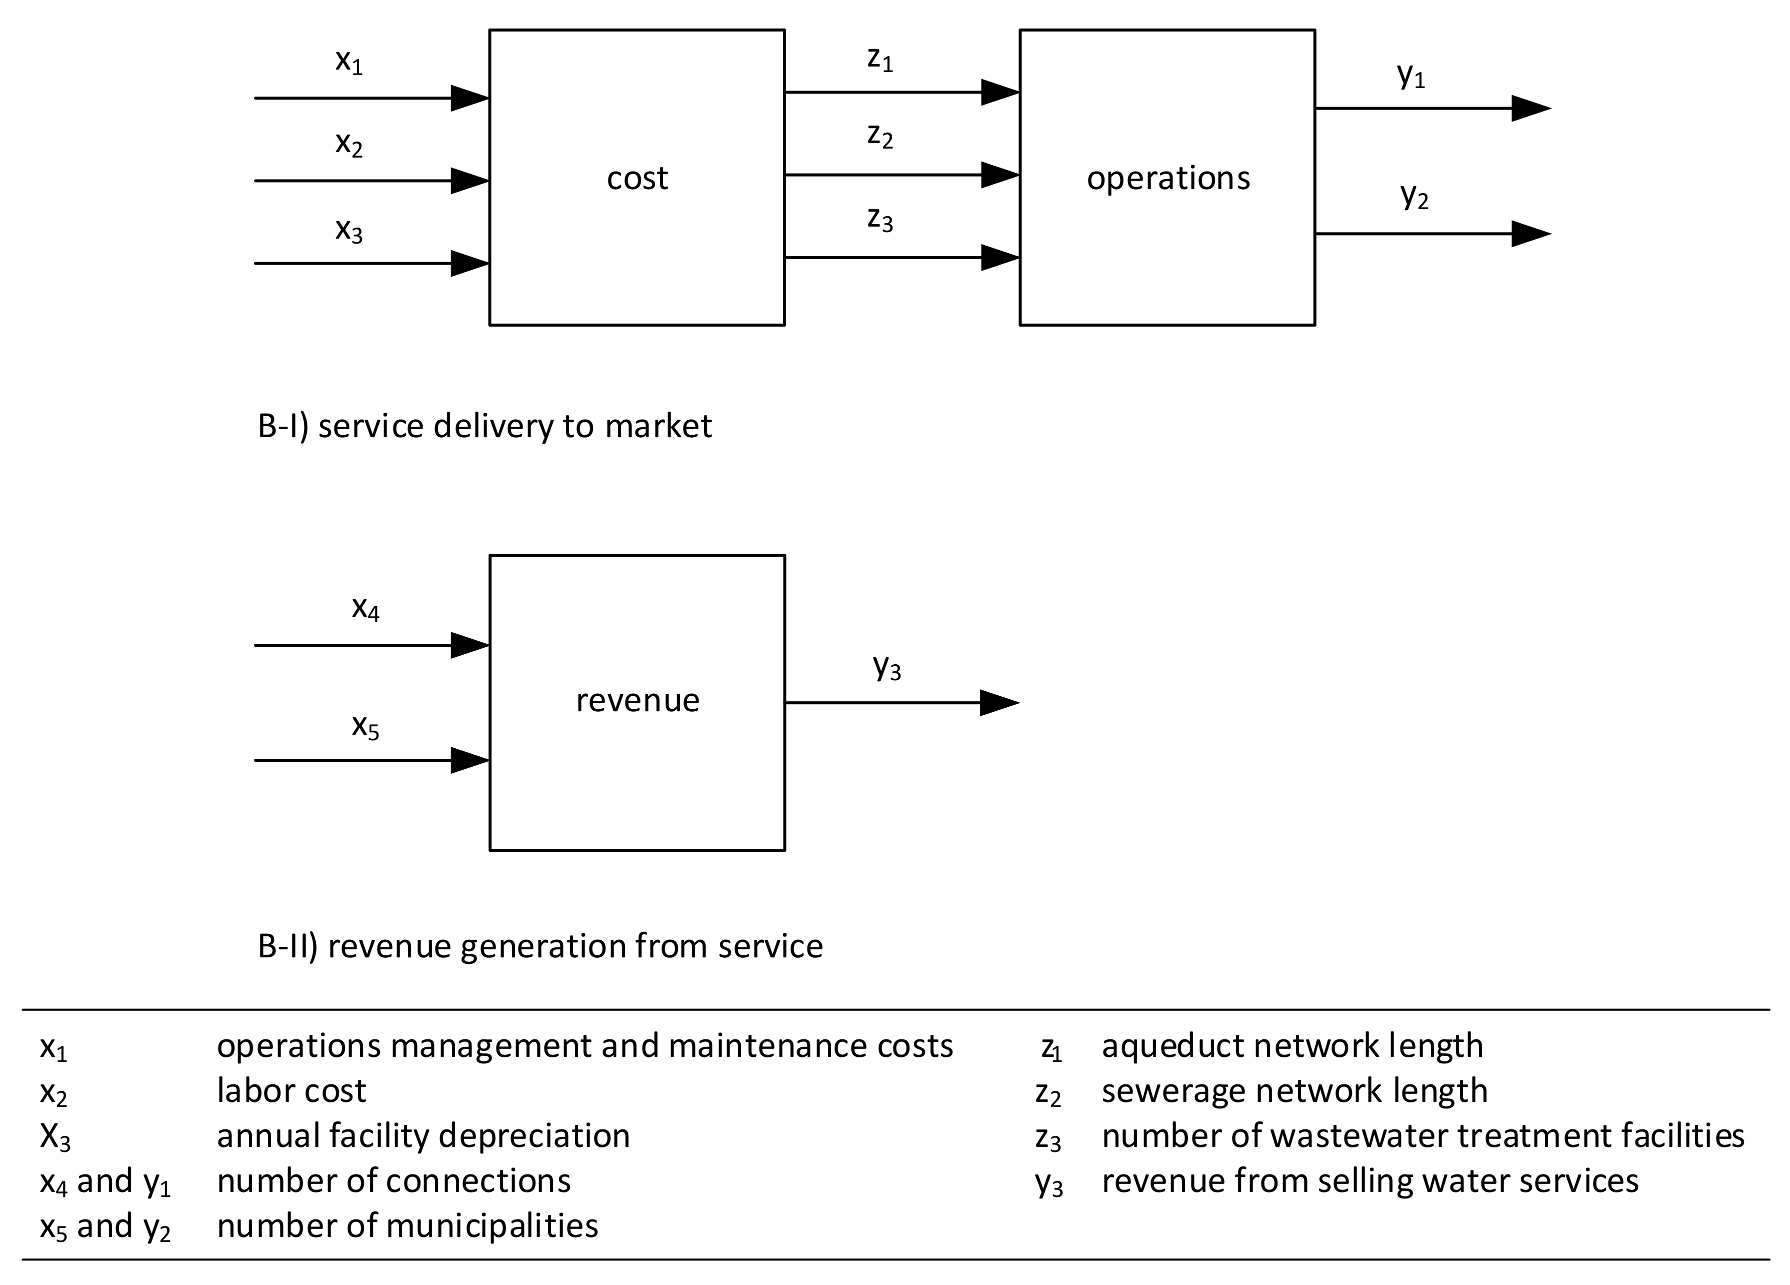
The production technology of the water service utility operator is modeled adopting a three-stage production process including the following interlinked sub-processes: (1) cost, (2) operations, and (3) revenue. In such a model, the outputs from the first production stage (
z1,
z2, and
z3) become the inputs to the second production stage and the outputs of this stage are the inputs (
y1 and
y2, or alternatively,
x4 and
x5) to the final production stage (see
Figure 1).
At the first stage of the model, the water management operators have to meet the costs of running and maintaining the water service infrastructure (i.e., the aqueduct and sewerage network, and the wastewater treatment facilities). Hence, the consumption of financial resources keeps available and functional the infrastructure assets. These costs include operations management and maintenance costs, the cost of labor and depreciation and are the inputs of the first sub-process, whereas the managed infrastructure assets are the corresponding outputs. From a cost perspective, efficiency increases when the water utility operator is able perform the daily operations and maintenance by spending the minimum cost.
At the next stage, the operators utilize the infrastructure to provide the customer market with the water service. Two outputs are relevant at this stage: the number of connection to service and the number of municipalities where the service is delivered. From the operator point of view, efficiency increases when the same number of connections and/or municipalities can benefit from the water service by utilizing a physical infrastructure having a reduced capacity with respect to the network length and the number of wastewater treatment plants. This view is consistent with a general behavior of companies managing the water infrastructure that are reluctant to make additional investment as this reduces profit.
At the final stage, the water service operator earns income from distributing and selling drinking water and sewerage services to the final customers. Inputs of this transformation process are the number of connections and the number of municipalities in which the water services are delivered, while the output is the revenue generated from the service. Efficiency at this stage is measured as the ratio of the revenue to the market size in terms of number of users and municipalities served. From the perspective of the operator, the higher the revenue for a given market size, the higher the efficiency achieved.
This multi-stage production model of the water services shows how different financial and physical resources are sequentially converted to produce outputs in greater detail than the conventional black-box or one-stage production model generally adopted in previous studies. Indeed, the model calculates the efficiencies of the water service operators combining the economic and technical perspectives. As Cherchye and Post [
28] (p. 424) emphasize “[…] Firms may succeed in minimizing relatively inexpensive inputs and maximizing inexpensive outputs. In many cases, substituting expensive inputs by inexpensive ones and substituting inexpensive outputs by expensive ones, even in a technically inefficient way, can improve economic performance. To increase the power of the efficiency measurement tools, one can bring in additional price information […]”. Hence, it is more effective to measure efficiency and identify causes of inefficiencies by adopting a multiple-perspective view of performance [
29].
Additionally, this model helps with dealing with the practical issue of the distinction between inputs and outputs, mitigating the distortion of the efficiency analysis due to incorrect labeling of the variables. As the business goals of the water service operators differ at the various stages of the production model and efficiency is measured either in terms of input reduction or output increase, a single DEA model cannot be effectively implemented. Therefore, the water service production model is purposefully split into two blocks: the first one in which the operator is focused on a resource usage reduction goal (i.e., input orientation, block B-I) that includes stages 1 and 2, and the second one having a focus on a market revenue increase goal (i.e., output orientation, block B-II) including stage 3. Hence, the efficiency analysis is conducted on a two-dimensional space, i.e., resource-efficiency and revenue or market-efficiency, rather than along one single dimension.
In this framework, the efficiencies of the two blocks are measured separately and independently as in [
30]. As the two blocks have different business goals, to calculate their efficiencies separately allows us to purposefully identify potential trade-offs between the two related efficiency measurements. This modeling approach is consistent with the aim of the study, which is more interested in investigating trade-offs rather than obtaining an overall efficiency of the water utility and identifying benchmarks. According to the characteristics of the two blocks, the water service operators’ efficiencies were calculated by implementing two different DEA models, i.e., network DEA (NDEA) in block B-I and conventional DEA in block B-II. Both methods are illustrated in
Section 5.
4. DEA Method
Since its introduction, DEA has been extensively employed in economic analysis to calculate measures of efficiencies in various situations and industries, such as transportation [
29,
31,
32], government and public sector [
33,
34,
35], public utilities [
21,
22,
36,
37,
38], healthcare [
39,
40,
41], education [
42,
43], banking and finance [
44,
45], energy and environmental studies [
46,
47,
48,
49,
50,
51,
52], manufacturing and information technology [
53,
54,
55,
56].
Differently from the typical statistical (parametric) techniques that are characterized as being “central-tendency” techniques, DEA is an “extreme-point” technique, in which each unit under evaluation is compared with the best units in the sample.
Compared with parametric techniques, DEA has several strengths [
57]. Particularly,
It makes no underlying assumption about the form of the production function adopted to model the relationship between inputs and outputs;
It does not need any information about the relative importance among outputs or inputs;
It allows consideration of multiple inputs and outputs simultaneously;
It does not require any prior assumption about the distribution of the sample containing the units to evaluate.
Consider a production unit that consumes
m inputs to produce
s outputs. All technically feasible combinations of inputs and outputs can be represented by the production possibility set
PPS as follows:
where
x ≡ (
x1, …,
xm)
T∊ℜ
+m and
y ≡ (
y1, …,
ys)
T∊ℜ
+s denote a non-zero input vector and a non-zero output vector, respectively, whereas
n is the total number of units to evaluate.
A unit k is technically feasible if any input–output combination is placed on the boundary of the PPS. In this case, the production of any output cannot be increased without decreasing the production of another output or increasing the utilization of the input (s). Similarly, the usage of any input cannot be reduced without increasing the utilization of another input or decreasing the amount of one of the outputs produced. The relative efficiency of a unit (hereafter denominated as decision-making unit and abbreviated as DMU) is defined as the ratio of the weighted outputs to the weighted inputs. In practice, there is no complete knowledge of the PPS because information relative to input–output combinations is limited to the set of n units. Hence, in order to estimate efficiency from observed data, DEA constructs an efficient frontier from the linear combination of the technically efficient DMUs. For each DMU k, DEA chooses the weights of the input and output vectors that maximize its ratio of weighted outputs to weighted inputs subject to the constraint that the DMU k weights should not allow any DMU to achieve an efficiency greater than unity.
5. DEA Models
5.1. Service Delivery to Market
Consider n DMUs which have the same production process that can be split into two sub-processes. Hence, for each DMU, the production process is performed in two stages. Suppose each DMU j (j = 1, …, n) has m inputs xij (i = 1, …, m) to the first stage and q outputs zpj (p = 1, …, q) from this stage. These q outputs behave as intermediate products as they are inputs to the second stage. The outputs from the second stage are yrj (r = 1, …, s).
Under the assumption of constant returns to scale and input orientation, in order to calculate the efficiencies of DMU
k relative to the overall production process and to the sub-processes at stages 1 and 2, Kao and Huang [
58] propose the following linear program that takes into account the relationship between the sub-processes:
In this model, the multipliers associated with the intermediate product zpj are the same by assumption, no matter if it acts as an output or input.
After calculating the optimal multipliers
u*r,
v*i, and
w*p, the efficiencies relative to the overall production process
θk and the sub-processes 1 and 2,
θ1k θ2k, are obtained as follows:
5.2. Revenue Generation from Service Delivery
Consider
n DMUs having the same production process performed in one stage only. Each DMU uses
m inputs
xij (
i = 1, …,
m) and
s outputs
yrj (
r = 1, …,
s). Assuming constant returns to scale and output orientation, the relative efficiency of DMU
k can be computed by solving the following linear program [
59]
6. The Empirical Study Setting
6.1. The Water Industry in Italy
Until the middle of the 1990s, the Italian water and wastewater industry was extremely fragmented, including 7826 utilities—about one for each municipality—that were operated mostly by municipally-owned companies. Private operators made up less than the 4% of the industry [
21]. There was no regulating body in the industry, and consequently the municipalities often had the double and conflicting roles of service providers and market regulators. The quality of service was low, particularly in the southern part of the country, with frequent disruption. Investment to upgrade the infrastructure was scarce and financed by means of government subsidies.
In 1994 Law No. 36/1994 (the so-called Galli Law) started an in-depth restructuring process of the water supply and wastewater industry, introducing significant changes. Particularly, important innovations were the adoption of principles of industrial management in the production process of the water utilities; the provision of water and wastewater services within an extended geographical area (the ATO, or territorial optimal area); the selection of water utility operators through market-based mechanisms able to stimulate competition among companies; the introduction of a method to calculate service tariffs based on the full cost recovery; and the regulation of the industry carried on by a public authority. The Galli Law was not enforced for many years for several reasons, i.e., a diffused prejudice and reluctance to open the local water markets to private companies, a diffused administrative and political inertia to transfer duties, decision-making power and responsibilities to a reduced number of entities (the ATO Authorities, in total 93 planned units) from the 8000 municipalities, the lack of technical and planning capabilities of many local governments unable to manage the complex public tendering procedure to award the water service [
21,
60].
In April 2006, the Italian Government issued the Decree No. 152/2006 (denominated “the Environmental Code”) with the aim of organizing the national environmental legislation more effectively. This decree established a more comprehensive framework in which Law No. 36/1994 was absorbed. Although no relevant changes occurred in the industry, Decree No. 152/2006 introduced new standards to organize the water services and defined the responsibilities of the main actors with greater detail. Law No. 191/2009 (the Annual Public Finance Law) and Law No. 42/2010 formally abolished the local Authorities to reduce public expenditure with the transfer of the ATO Authority responsibilities and tasks to new independent regulating bodies created by the regional governments.
In May 2011 the so-called “Decreto Sviluppo” (development decree) issued by the Government established the National Water Agency, having the main task of defining a common tariff scheme to be used in all ATOs. The Agency was incorporated into the National Authority for the Electricity and Gas market regulation creating the new Authority for the Regulation of the Electricity, Gas and Water markets (AEEGSI) in compliance with Law No. 214/2011.
Since 2006, there was a great political pressure to promote privatization in the service industries, particularly through the Ronchi Decree of November 2009 (Decree No. 166/2009). However, the public national consultation by means of the referendum held in 2011 overturned both Art. 15 of the Ronchi Decree that had established “equal treatment and no discrimination” for the privately-owned water service operators wishing to enter the industry, encouraged to buy up to 70% of any listed public water company, and Art. 154 of Decree No. 152/2006 which had established that the private operators could charge as much as necessary to have an acceptable return on invested capital and profit.
After more than twenty years from the Galli Law, the reform had certainly an important impact on the structure of the water and wastewater services industry. At the beginning of 2009, the number of water service operators—municipal departments, in-house entities, and specialized firms—was 3351, and 114 of them were concessionaries having the responsibility for providing the integrated water service (transmission and distribution of drinking water, wastewater collection and treatment, and sometimes abduction). In 1999, before the Galli reform, this number was 7826 and water services were fundamentally provided by municipal departments [
61,
62].
However, the reform goals have not been completely achieved. Indeed, the industry is still characterized by the presence of a great variety of water service providers, i.e., small and large public companies that operate with the in-house rule as a reference, large multinational companies, local public-private equity companies or fully private equity companies, and a complex and variegated contractual setting. Additionally, due to low tariffs and market uncertainty, which do not attract private capital, the investment and efficiency levels remain low, jeopardizing service quality.
6.2. Data and Variables
Data relative to the infrastructure assets managed by them were collected from the technical reports released yearly by the National Supervision Commission for Water Services [
63,
64] and the ANEA Foundation [
65,
66], the management report related to the annual financial statements, and websites of the companies. The financial statements and websites of water service operators provided cost and market data. The whole set of data refers to fiscal year 2011. The sample contains fifty-three operators that provide water and wastewater services in Italy, including thirty-two operators designated as “only public”, and twenty-one operators designated as “private/mixed private–public”. Particularly, companies whose capital is fully owned by regional or municipal administrations and offer the water and wastewater services “in-house” (i.e., not selected by competitive tender) belong to the first group, while mixed private–public equity operators in which the private partner was selected by a public tendering procedure or full private equity operators chosen by public tender are part of the second group (see
Table A1 in
Appendix A).
Table 1 reports the list of variables considered in the study and main statistics. Because the results of DEA implementation are sensitive to inputs and outputs selected to specify models, variables were carefully chosen accounting for indications from similar papers and conducting preliminary data analysis. Furthermore, as is common in such kind of studies, the choice of inputs and outputs necessary to model the two blocks of the production function was largely influenced by the availability of open data and the purpose of the study.
For each operator, the following data were collected: operations and maintenance costs (x1); labor cost (x2); infrastructure depreciation (x3); number of connections to service (x4 and y1); number of municipalities served by service (x5 and y2); aqueduct network length (z1); sewerage network length (z2); number of depuration plants (z3); revenue from delivering service to customers (y3). Figures indicate a great variance in the sample as operators differ to a large extent with respect to the size of their operations, costs and managed infrastructure. For instance, the mean length of the aqueduct network is 3678 km, whereas the minimum and maximum lengths are 240 km and 21,000 km. Data relative to the other variables confirm this significant variance in sample.
Since preliminary data analysis showed high correlations between variables, problem dimensionality was reduced employing the method proposed by Daraio and Simar [
67]. Particularly, scholars suggest implement principal component analysis (PCA) and use eigenvalues to extract one main factor from high correlated variables and eigenvectors as weights to aggregate individual variables.
Table 2 displays inputs, outputs and intermediate variables after data reduction. First, measurements of variables were divided by their means to normalize original variables, and next PCA was performed for every block of the multi-stage model considering homogeneous sets of variables (i.e., either inputs or outputs) each time. This method allowed reducing the total number of variables to 5, by merging 7 original variables into 3 new variables, i.e., variables
x[1,2,3],
x[4,5], and
z[1,2] respectively measuring the overall production cost, the network length, and the market size. A measure of the extracted factor inertia higher than 80% was considered acceptable for the aggregation of original variables as suggested by literature [
67,
68].
To improve the quality of the data set, the procedure suggested by Wilson [
69,
70] was adopted to detect outliers. To this aim, two conventional DEA models were run to calculate operators’ efficiencies. The first model adopted input-orientation and was specified utilizing variables
x[1,2,3] and
x[4,5] as input and output, respectively. The second model adopted output-orientation and included variables
x[4,5] and
y3 as input and output. As the scholar suggests, if the exclusion of a specific DMU from the dataset has a significant effect on the efficiency measurements of the remaining DMUs, that DMU might be a potential outlier. Additionally, the DEA super-efficiency measures were calculated for all the operators to conduct a more in-depth outlier analysis [
71]. This analysis did not identify critical outliers.
7. Analysis of Results
7.1. Efficiency Measurements
Results of the efficiency analysis are available in
Table 3. Particularly, four efficiency scores are displayed, i.e., three for model B-I (both efficiencies at stages 1 and 2, and the total efficiency) and one for model B-II. In model B-I, there are no water service utilities which are 100% efficient from the “service delivery/resource usage” perspective as the maximum efficiency measurement is 0.545. Only two water services operators achieve 100% efficiency at stage 1, IWC-Acquedotto Valtiglione and IWC45-Acquedotto Lucano SpA, although five utilities are very close to the efficient frontier enveloped by model B-I at this stage (IWC13, IWC25, IWC30, IWC40, and IWC47) whose efficiencies are between 0.812 and 0.984. According to the features of model B-I at stage 1, these operators are cost-efficient being able to save financial resources when they carry on production operations to deliver the water services to users. The mean efficiency at stage 1 is 0.550. At stage 2 in model B-I, there is only one water service operator that is 100% efficient (IWC49-Padania Acque Gestioni SpA).
Unlike for stage 1, the mean efficiency is very low—0.252—indicating that, in this production stage of model B-I, many utilities are very inefficient. Hence, the operations stage is the more critical one in the delivery of water services to market. Further, the higher efficiency at stage 1 (cost-related efficiency) is confirming the general orientation of the Italian water industry to not invest for upgrading and improving the infrastructure. Finally, in model B-II one operator is placed on the efficient frontier (IWC51-Amap SpA), whereas IWC20 (Acea ATO 2 SpA) and IWC35 (Acque del Chiampo SpA) are both very efficient as their efficiency scores are 0.903 and 0.896 respectively. Model B-II is characterized by a diffused low efficiency. These findings seem to support the idea that tariffs in the Italian water service industry are too low to ensure an acceptable water service remuneration and long-term business sustainability for the operators. Both model B-I and model B-II present a significant discriminating capability because a very small number of water utilities are fully efficient. In the two blocks of the water service production process, efficiency measurements are generally variable as the standard deviation measures show (see
Table 3), particularly at stage 2 in model B-I and in model B-II. The high difference between the minimum and maximum efficiency scores further highlights such variability in the efficiency measurements.
7.2. The Relationship between Efficiencies
Table 4 displays correlation values and difference comparison between efficiency measurements calculated for the blocks and stages of the water services production process. To have a more reliable and extensive assessment, correlation analysis and tests were performed under different assumptions, i.e., normal and not-normal distributions of the efficiency scores.
Both Pearson and Spearman’s rank correlations have negative signs, indicating that the efficiency measurements calculated either at the different stages or at block 1 and 2 of the production model have opposite behaviors, and, consequently, trade-offs may be important. With respect to the relationship between efficiencies of model B-I and model B-II, the size of the Pearson correlation (−0.638) points out that there is a strong but reverse relationship between them. However, as the Spearman’s rank correlation is higher than the Person correlation and very close to −1, the relationship between efficiencies is not linear and not-monotonic (i.e., when model B-I efficiency increases, model B-II efficiency decreases, and vice versa). Likewise, the Spearman’s rank correlation is higher than the Pearson correlation in the relationship between model B-I (stage 2) and model B-II efficiencies, although having a lower intensity. The correlations between efficiencies of model B-I at stage 1 and efficiencies of model B-II are less intense [
72]. Considering the efficiencies at stages 1 and 2 in the first block of the water service production model, correlations are low and not statistically significant.
The T test confirms that mean differences are statistically significant, except for the efficiencies calculated in model B-I at stage 2 and efficiencies in model B-II. Particularly, on average the total efficiency of the water service utilities in block 1 of the production model is lower than their efficiency in block 2 and, in block 1, efficiency at stage 2 is lower than efficiency at stage 1. The more robust Mann–Whitney U Test supports these findings.
Results relative to correlations and difference comparison between efficiencies of the water service providers seem to suggest that cost and operations efficiency on the one side, and market or revenue efficiency on the other side, may not be compatible business goals.
As the sample includes different typologies of water service operators, the impact of company ownership on efficiencies was also examined. The output of this analysis is reported in
Table 5 and
Table 6. The utility operators have been divided into two groups, depending on the company equity nature. Specifically, the first group contains 21 utility operators classified as either private or mixed private–public companies, and the second group includes 32 operators classified as only public companies. The first group is denominated “PRI”, while the second group is denominated “PUB”.
Table 5 shows main statistics for both groups. The Mann–Whitney U Test was performed to test differences between group efficiency distributions (see
Table 6). Figures indicate that the two groups differ only with respect to the operator efficiency calculated in model B-II.
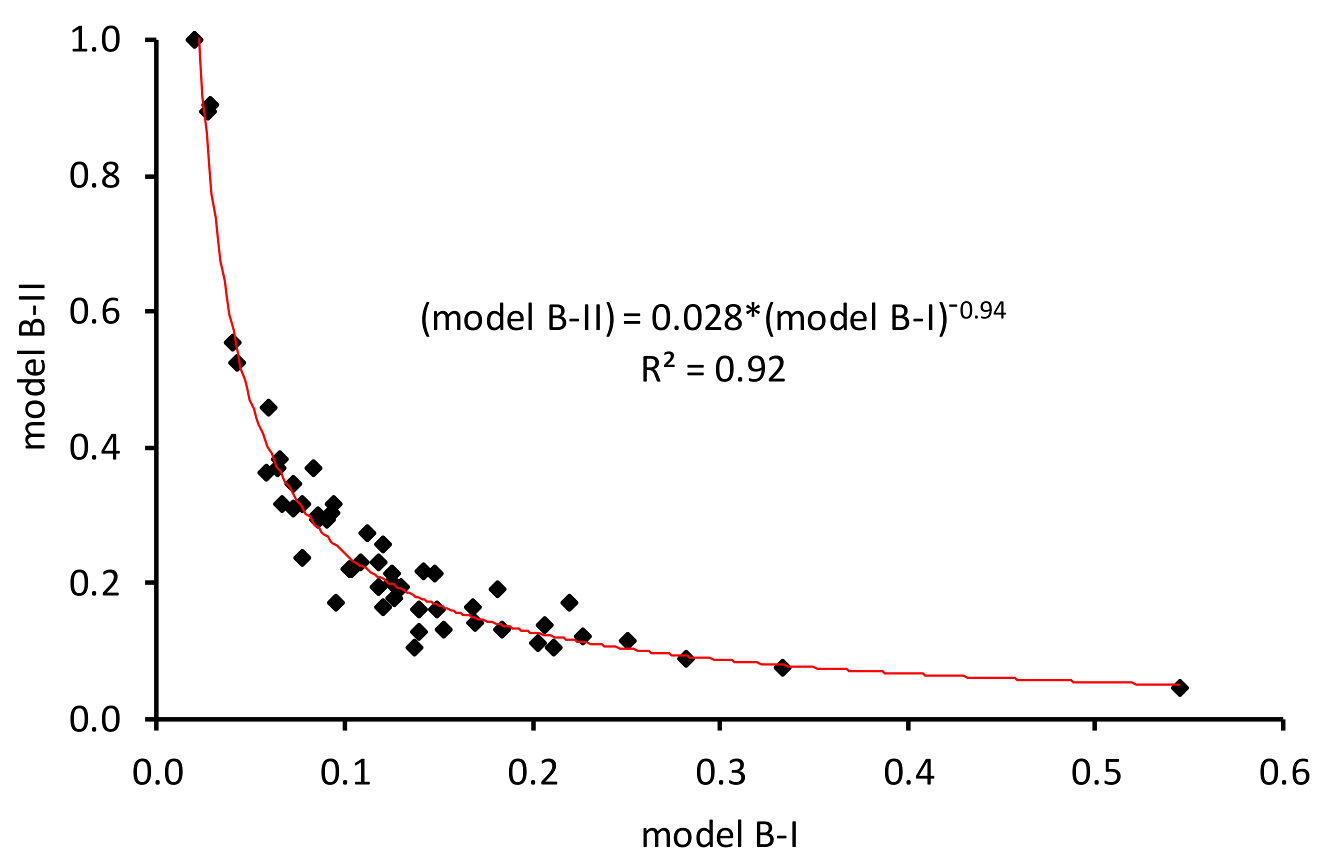
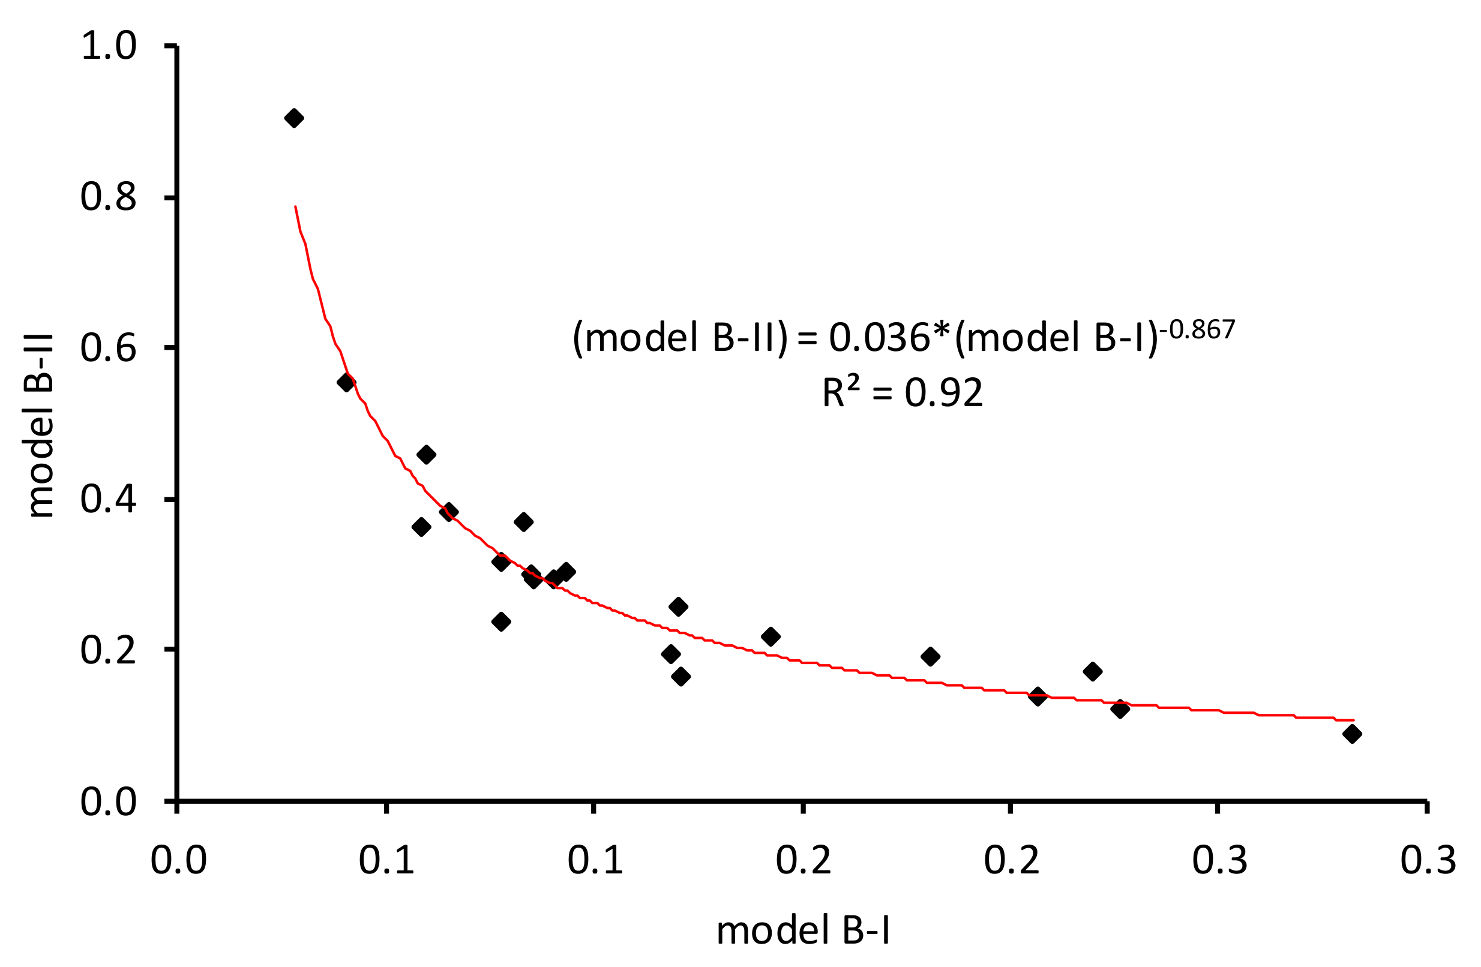
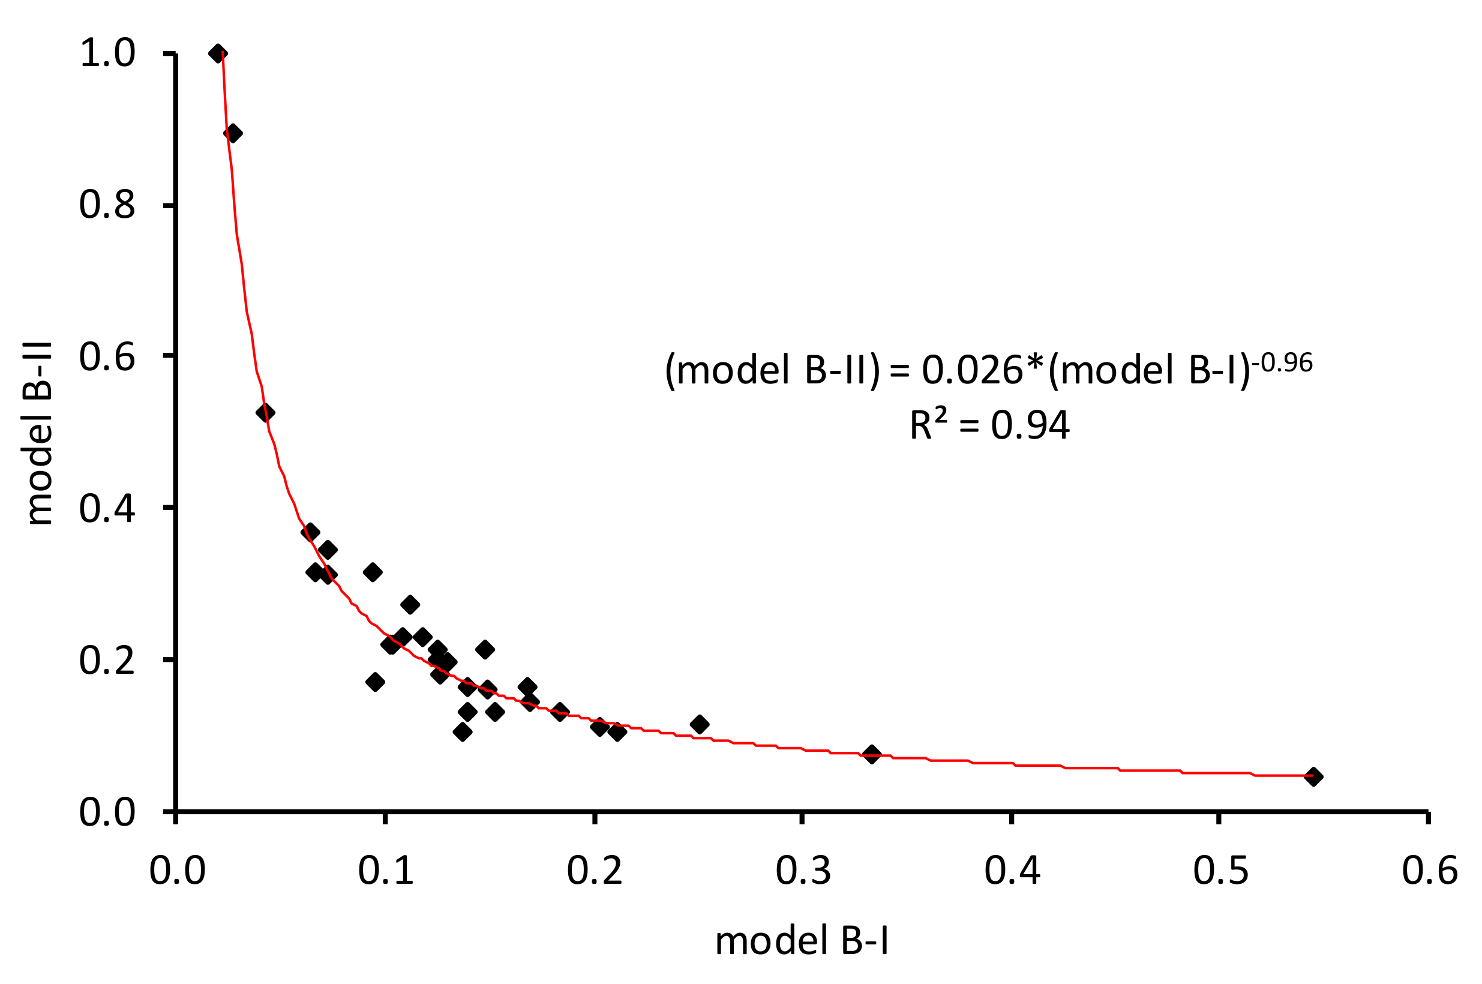
Figure 2,
Figure 3 and
Figure 4 display the scatter plots of the model B-II efficiencies versus the model B-I efficiencies. Specifically, the scatter diagrams plot the efficiencies of the two blocks of the water service production model for the pooled sample and the sample groups PRI and PUB. These plots allow investigating more effectively the relationship between efficiencies and, finally, detecting trade-offs between different performance dimensions and business goals.
All scatter plots provide evidence of what emerged from
Table 4. There is a strong negative correlation between efficiency scores. Regression analysis was implemented to fit the data. An exponential regression model proved to fit data much better in the case of the pooled sample and individual groups. Although the R-squared measurement is very high, varying from 0.92 to 0.94, the fitted line plot shows that the exponential regression line systematically under- and over-predicts the efficiency data at different points along the curve. However, the exponential model provided the best fit in comparison to other models. Results suggest that achieving high efficiency in the “service delivery to market” block of the water service production model is not compatible with achieving high efficiency in the “revenue generation” block and vice versa. Hence, given this structure of the industry and the tariff scheme a severe trade-off exists between the resource-efficiency and market-efficiency business goals of the water service operator. That is independent of the type of ownership.
8. Discussion and Conclusions
Efficiency analysis plays an important role for achieving sustainable development in the water and wastewater industry, particularly because several conflicting business and social goals must be taken into account and, sometimes, there might be scarcity of water and funds. To gain a more in-depth understanding of the performance level of the industry may help both water utilities’ managers to formulate more effective strategic plans and policy makers to design industry policies.
This study contributes to literature on the benchmarking and measurement of efficiency in the drinking water and wastewater industry by proposing a hybrid three-stage modeling approach of the water service operator production process. This modeling approach is based on the combined implementation of network DEA and conventional DEA. As this modeling approach of the water service utility production process shows how different financial and physical resources are sequentially converted to produce outputs in greater detail in comparison to the conventional black-box or one-stage production model generally adopted in previous studies, it provides important information relative to different efficiency components and the overall efficiency. This approach shifts the efficiency analysis to a two-dimensional performance space, i.e., resource and market related efficiencies, offering a more comprehensive view of the water service industry.
The modeling approach is utilized to estimate the efficiency of the water and wastewater service in Italy. A sample containing 53 operators that provide drinking water and wastewater services in Italy is used in the efficiency study. Results show that efficiency measurements are generally variable and low. There are no water service utilities which are 100% efficient from the “service delivery or resource usage efficiency” perspective as the maximum efficiency score calculated by DEA is 0.545. The examination of the efficiency components at the two stages of the first block of the water service production model indicates that there is a general orientation of the Italian water industry to not invest to upgrade and improve the infrastructure assets and the operations stage is critical in the provision of water services to market. Only one utility operator is 100% efficient from the “revenue generation from service or market-efficiency” perspective, even though two operators achieve high efficiency and are indeed very close to the efficiency frontier. Tariffs adopted by the water service operators in Italy do not allow them to get acceptable service remuneration and achieve long-term business sustainability.
Even though findings from the study provide useful insights relative to efficiencies and trade-offs between business goals linked to the specific nature of the Italian water and wastewater service industry and are not generalizable, the modeling approach can be easily extended to other countries and other industries. By modeling the production process of the utility operators adopting a three-stage network structure, this approach provides a more comprehensive and flexible performance measurement framework for monitoring efficiency. Variables can be added to the model to account for the particular characteristics of the industry. Furthermore, by using a two-dimension performance measurement, operational strengths and weaknesses can be more effectively identified to make informed decisions.
8.1. Implications for the Italian Water Services Industry
Findings have important managerial implications for the most inefficient utility operators as they indicate how far they lag behind the best performers with respect to resource usage and market-efficiencies. The best performers can be considered as the benchmarks to take into account to improve the efficiency levels at the different stages of the production models supporting the managerial decision-making process. Therefore, the most efficient management practices can be identified. The adoption of such practices in the inefficient water utility operators would contribute to improve their performance and, particularly, reduce operational costs and increase resource usage efficiency.
Given the present structure of the water services industry and the tariff scheme in Italy, the joint analysis of the resource and market efficiencies suggests that there is a trade-off between these efficiency measurements and the corresponding business goals. Choosing different forms of operator ownership does not help to avoid such a trade-off. Indeed, results clearly underline the specificities and contradictions of the water and wastewater service industry in Italy. The industry appears like being locked in a vicious cycle where several forces move in the opposite direction and work against each other, shaping its characteristics. These forces are the political and social pressure to keep service tariffs low, the need to ensure service access and affordability to low-income families, the scarce willingness and attitude of users to pay additional charges to cover increasing costs, the huge difference among the ATOs with respect to availability and features of water sources and agglomeration of users, the lack of public funds and the reluctance on the part of the private concessionaires to enter the market because of industry uncertainty that hinder the renewal and improvement of the infrastructure network, the obsolescence of this latter and the necessity to improve the quality of service. These forces lead to a low-performance of the industry and a trade-off between cost-efficiency and revenue efficiency goals.
According to the report published by the International Water Association [
73], the Italian water and wastewater services tariffs are the lowest in Europe. For instance, in 2013 the price of 1 cubic meter of water was 0.60 Euro in Milan, 1.29 Euro in Bologna and 1.45 Euro in Turin, whereas it was 2.03 Euro in Madrid (Spain), 3.6 Euro in Bordeaux (France) and 3.52 Euro in London (UK). On average, the typical Italian family composed of three people, spends about 0.85 Euro every day for both drinking water and wastewater services [
74].
The costs to deliver services and tariffs are linked together as the AEEGSI has established a common rule to calculate the water and wastewater services in accordance to the full cost criterion (i.e., covering investment and operational costs by means of tariff revenues). The low tariffs do not allow collect sufficient revenues to carry on necessary investment to renew the infrastructure and improve the quality of service, and sometimes they even negatively affect the financial viability of water utilities. The industry is still suffering from several long-lasting operational issues such as high amounts of water losses through leaks, high operational costs due to inefficiencies, and poor maintenance. Particularly, high levels of water losses increase the amount of water flowing in the transmission and distribution network that does not generate revenues, as it is not invoiced to consumers, and increase operational costs of extra energy and purchased water. Water losses caused by ineffective leakage control are about 32% on average but achieve higher rates in the south of Italy (more than 60% in Sicily) [
74]. Tariffs and service quality are necessarily interrelated. The recent Blue Book report indicates that in Italy about 11% of users do not receive wastewater depuration service [
75]. The need to meet EU regulations and standards relative to water quality further contribute to cost increase that should be covered by tariffs. However, consequently to reduced revenues, the annual investment rate remains low, about 32 Euros per capita against 100 Euros per capita in UK [
74]. According to estimates provided by the Blue Book report [
75], every year, 80 Euros per capita (i.e., about 5 billion Euros) are necessary to carry on investment to improve the service quality. Hence, increasing tariffs is necessary to make the water service provision sustainable, efficient and of high quality.
8.2. Limitations and Future Research Streams
The implemented DEA models have utilized a radial measure to compute the relative efficiency of water utilities, assuming proportional change of inputs and outputs, not allowing to deal with inputs and outputs individually (i.e., either increasing or decreasing each of them at different rates). This shortcoming can be avoided by utilizing a SBM DEA model [
76,
77].
Technical efficiency has been measured under the assumption of constant returns to scale. Hence, the efficiency may be due to the input/output configuration as well as to the size of operations. Under the assumption of constant returns to scale a given increase in inputs will determine an equi-proportionate output increase. However, in the water and wastewater service industry, economies of scale can be important and some efficiency improvement might be obtained by varying the scale of operations. To take into account the impact of scale efficiency on the overall technical efficiency measure, a modified network DEA model should be implemented [
78].
The DEA models have not considered undesirable factors such as the unaccounted water as data were not available for all water utilities. Therefore, the production technology of the water utility operators has been modeled assuming the freely disposability of the outputs, excluding that the production process might generate undesirable outputs which cannot be disposed without bearing costs.
Efficiencies relative to block 1 and block 2 of the water utility production model have been measured separately. Whereas this approach allows us to uncover inefficiencies related to conflicting business goals, it does not consider the dual-role conflict of the outputs from the block 1 and inputs to block 2 in the production model and the interaction between them. Thus, the proposed framework is unable to calculate an overall efficiency of the overall production system of the water utility. Future research aimed at measuring the efficiency of the Italian water services industry might use a non-oriented three-stage sequential network DEA model able to keep continuity of link flows across all stages and compare results with what emerged from this study, see [
76].
Although this study has considered heterogeneities due to the different forms of ownership of the utility operators, additional research should be conducted by including heterogeneities in the efficiency analysis ex-ante rather than ex-post, i.e., by using a meta-frontier efficiency analysis approach [
29]. Finally, this study has privileged the perspective of the water service operators, focusing on the performance (both resource and market-efficiencies) of their production activities. A more effective efficiency analysis of the water service market would benefit from applying complementary perspectives involving different stakeholders, for instance, by measuring efficiency considering the users and the financial investors’ perspectives.


