Identification of Population Growth and Distribution, Based on Urban Zone Functions


1
Graduate School of Environmental Engineering, The University of Kitakyushu, Kitakyushu 808-0135, Japan
2
Engineering Faculty, the University of Bandar Lampung, Bandar Lampung 35142, Indonesia
3
Department of Architecture, The University of Kitakyushu, Kitakyushu 808-0135, Japan
*
Author to whom correspondence should be addressed.
Sustainability 2018, 10(4), 930; https://doi.org/10.3390/su10040930
Submission received: 29 January 2018
/
Revised: 20 March 2018
/
Accepted: 22 March 2018
/
Published: 23 March 2018
(This article belongs to the Special Issue Sustainable Land Uses and Rural Governance)
Abstract
:Population growth and distribution are still widely seen from the perspective of urban areas. Though the city has many zones with various functions, so comes the question, what zone will have population growth and hold the highest population growth distribution? And why would residents choose that zone? The study was conducted in Bandar Lampung, Indonesia, using population data from 2004 to 2011 (8 years) and urban zoning data from government documents. The results show that the conservation zone has the highest population growth and receives the highest population growth distribution. This result is confirmed by a cross section survey of respondents who live in the conservation zone. The survey results show that purchase, wide land, environment, and native inhabitants are variables affecting the population’s choice of the conservation zone as their residential location. The study also shows that the zones with the highest population do not automatically have the highest population growth and accommodate the highest population increase. Population analysis using the zonation system can help us better understand population growth and population growth distribution in urban areas.
1. Introduction
The increase in urban population will have an impact on urban environmental, social, and economic conditions. According to the UN [1], there is 54.5 percent of the world’s population already living in the city. It will increase to above 60 percent by 2030. This situation requires the attention of governments and scholars about the urban population growth pattern and its distribution within the boundaries of urban administration. At least, we can understand, the trend of population growth and its distribution within an urban area, to help various groups to anticipate its impact.
To understand the development of population and urban studies, we studied some research results. A study conducted by Salvacion et al. [2] shows population distribution in coastal, flat, and relatively flat areas. This study is very interesting, but it does not describe the function of any such area, for example, whether the coastal area is a business area, or whether the flat area functions as a settlement. Another study conducted by Jian and Yixing [3] focused only on the total urban population as well as urban density in the case of the Beijing Metropolitan Area. However, the study does not discuss the effect of the division of spatial function (zonation) in urban areas on the number and density of the population. The same is done by Shi et al. [4], which identified population growth based on the characteristics of the eastern region and other regions and sees population growth as having coastal and noncoastal characteristics. Some studies have looked at population growth based on urban functions, as did Tian’s et al. [5], but they do not talk about the effect of inner-city functions on population growth and distribution. They see it from the perspective of the city as a whole.
Research conducted by Borrego et al. [6] about urban structure, which discusses the city’s zonation functions, sees it from the perspective of air quality (the impact of urban areas on the environment). The use of detailed city zoning types is done by Stewart and Oke [7], but it is feasible for air temperature studies based on zone functions because temperature affects the comfort of the population in each zone [8]. Each zone function also does affect city temperature differently. Urban zone functions are also discussed by Xiao et al. [9] using GIS and remote sensing. However, the change in population and its distribution cannot be described although spatial analysis using GIS will help us understand the changes in space that are thought to be caused by urban populations [10]. The effect of zone functions was also discussed by Alberti [11], but this study used the impact of space function on ecological conditions. Meanwhile, the function of space is always inhabited by a growing population and is distributed from one zone to another. This will affect various sectors [12] economically, socially, and ecologically, as has been suggested by previous researchers.
There are several considerations in choosing a residence location. As Chiang’s et al. study [13] suggests, educational facilities, business opportunities, lifestyles, and mental stability of children are considered when choosing home locations. People will avoid settlements that pose a high risk of sustainability. As Kim’s et al. research [14] shows, single and family residents will have different requirements when choosing a settlement location. The type of work and income will also affect the location of the residence. An interesting study conducted by Bullock et al. [15] investigates the necessities of residents living in rural or suburban areas. The results show that settlement design and travel time are important factors in choosing residential locations for residents living outside the city.
Indeed, population growth can be caused by many factors. Research conducted by Deng et al. [16] shows that revenue growth affects population growth. The policy of urban development also has an effect similar to that of industrial estate and services. In the results of a Burgess study [17], urban populations will continue to grow, and it will occur in the business zones, housing zones, commuter zones, and worker zones of settlements. That means all zones will experience population growth. However, the research conducted is still a preliminary study, so the zone where population growth is highest is still unknown. In addition, research on population and environmental impact has also been done by O’Neill et al [18].
From some of the studies described above, we can understand that population factors do affect the conditions of some urban sectors such as the provision of infrastructure, environmental problems, social problems, and health. Therefore, research on population growth and its distribution needs to be done, to gain a better understanding of the location of the city zone that will be populated by many residents.
Research on the city zone to be chosen by the community as a residence location is still not done by many scholars. In fact, population distribution and growth occur in specific zones within urban areas. Therefore, researchers are eager to know which zone has the highest population growth and distribution.
2. Research Thinking Framework
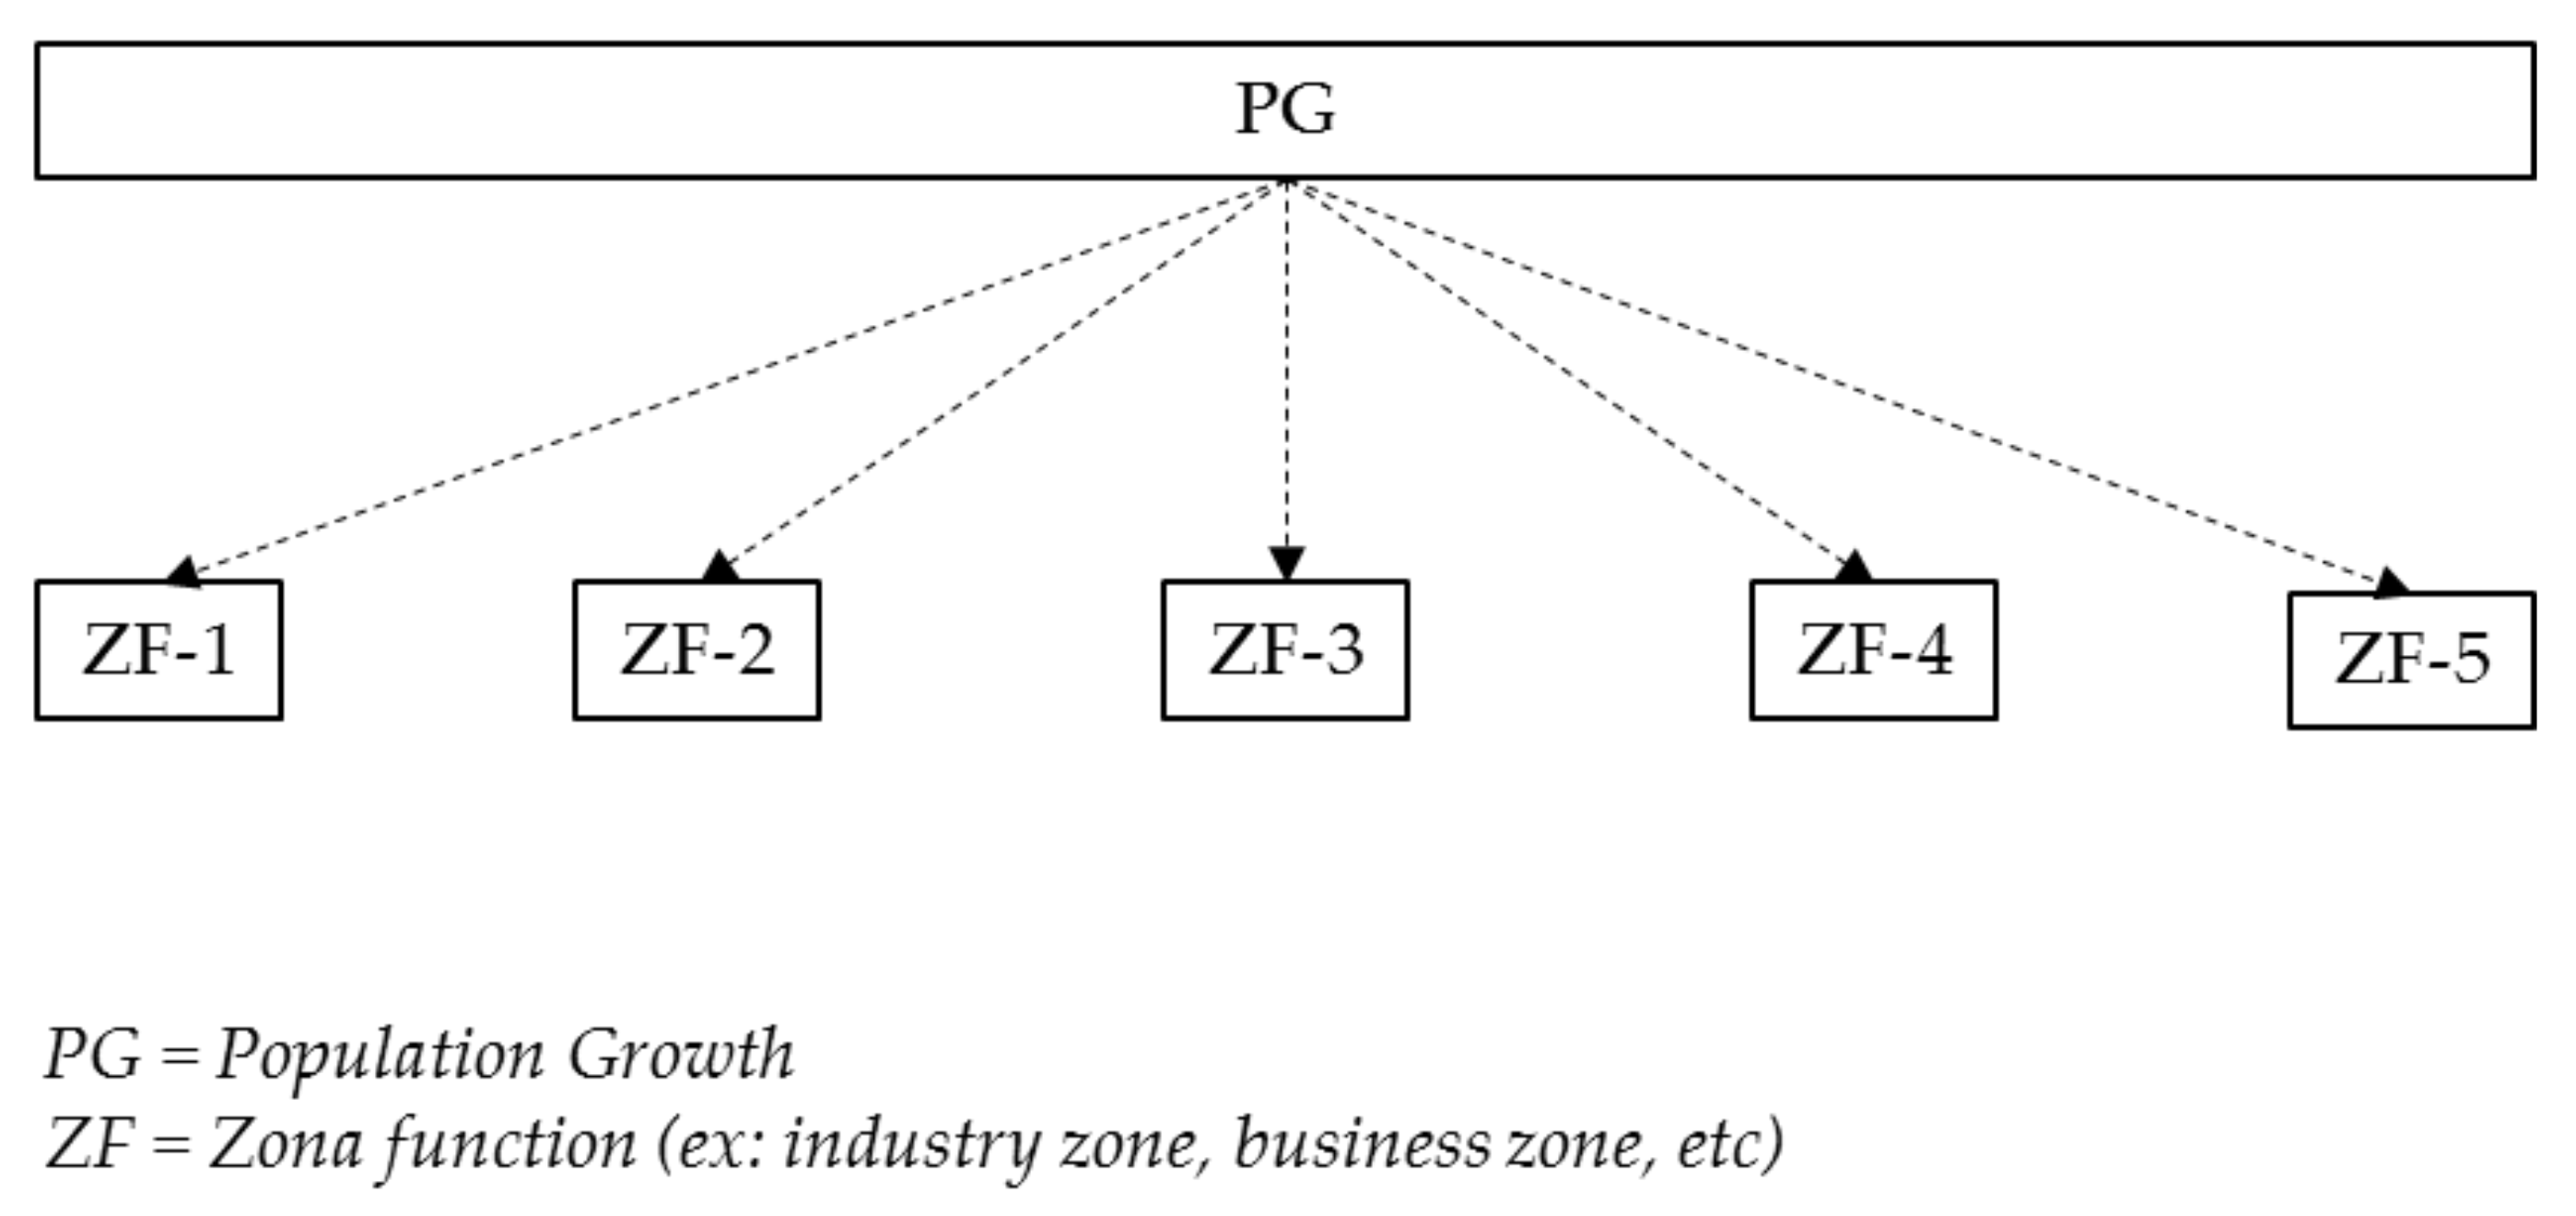
This paper discusses other issues of identifying population growth and population growth distribution based on urban zone functions. As stated by Boserup [19], the population will continue to grow. Population growth will be distributed to several zones. However, which zone will have the highest population growth and receive the highest population distribution? This study attempts to provide an answer with a frame of mind as shown in Figure 1. This study offers a more detailed identification of the growth and distribution of the urban population through the zone function approach and tests it using qualitative analysis, continuing with a quantitative analysis using Kendall’s multivariate correlation.
Figure 1 shows the mindset in the study. The continuously growing population will occupy urban areas in certain zones because the population will be distributed to each zone. In addition, there will be zones that will have a high population growth while some will not. Population growth will also be unevenly distributed to all zones, which will help determine which zone has the highest to lowest population growth. The results of this study will help inform many scholars about the zones that possess the highest population growth to the lowest and will lead to a better understanding of the population distribution in any zone as well as the factors involved when choosing a place to live. This will also be useful for planners in determining the function of each zone within a city. That is because, in this study, we will see that the zones with the highest population do not automatically have the highest population growth and receive the highest population distribution.
3. Methods
The research procedure can be seen in Figure 2. The following is a description of the flowchart of the study.
3.1. Identify Zone Functions
Zone functions are identified by studying city planning documents owned by the government, in this case the government of Bandar Lampung City, Indonesia. The document being studied is the 2004–2014 City Spatial Plan Document. Currently, it is being updated. Since 2004, the city has a spatial regulation that guides the government in creating urban development policies. In the document, there is a space and zoning utilization arrangement. The city area consists of 13 districts and 5 types of zones. Zoning is formed based on district boundaries.
3.2. Identification of Population Data and Distribution
This identification uses data from the Central Bureau of Statistics. The identified population data are from each district and subdistrict, which is processed using Microsoft Excel 2013. We confirmed the data with the district government as to the number of subdistricts, population, and population growth. The objective is to strengthen the processed data from BPS/Badan Pusat Statistik (Central Bureau of Statistics). Population data includes processed population statistics from 2004 to 2011 because of zone settings applied starting 2004. The limit year of analysis is 2011 because of a change in city spatial plan from 2012 until now.
3.3. Identify Zonation with the Highest Population Growth and Distribution
In this section, we will get the population growth for each zone during the period 2004–2011, and the population distribution will be displayed in growth and distribution charts. These results will help us understand the growth trend and population distribution to each zone (highest to lowest).
3.4. Survey of Variables that Influence Location Selection
After that, we will conduct a survey to determine the variables that make the population decide to live in the zone that has the highest growth and population distribution. A study by Joseph Prashker et al. [20] shows that the selection of residential locations is influenced by sex, socioeconomic variables, environmental characteristics, income, education level, and number of cars. This study provides an understanding of the many variables that will affect the reasons for choosing a residence location. Therefore, the research will survey to find out the perception of the community about the choice of the place where they live now. Similar research has been done by Modica et al [21], they involve public opinion to assess landscape planning. The goal is to get results that will enrich the results of the study in this field. The results of this qualitative survey will be used to examine the variable consideration of residents living in growth zones and accommodate the highest population distribution. The highest zone becomes the surveyed zone because it is expected to represent the population’s response to the considerations for living in a zone. Furthermore, since the conservation zones are the most populated and continue to receive an influx of people, we need to collect data on the factors that influence people to choose conservation sites. This data collection is done by cross section. A survey will be conducted in two stages. The first stage is a qualitative survey with open-ended questions. The second phase is a quantitative survey with close-ended approach.
3.4.1. Qualitative Survey
In this study, however, we gave the respondents the freedom to respond to their considerations for settling in the zone using qualitative surveys with open-ended questions [22]. This cross-section survey seeks to uncover the considerations that affect living in the zone with the highest growth and population distribution of conservation zones. The survey was conducted on 2 districts that entered the conservation zone. These two districts consist of 13 subdistricts. Other explanations will be presented elsewhere. For this qualitative research, the survey was conducted on 65 respondents (5 respondents × 13 subdistricts = 65 respondents). Respondents were given the freedom to provide their reasons for living in the zone. Then, all responses are categorized. In this study, we received 15 types of answers that can be grouped into 4 categories, namely, purchase, environment, wide land, and native inhabitants. The core statement of this survey is why they live in that location. However, there are other questions such as work, age, number of family members, number and type of vehicle, and income. Their answers will provide a new understanding of the reasons for choosing where to live. Because there is a tendency, residents select the location of residence with a very diverse perception. The diversity of these perceptions requires grouping answers to facilitate researchers about the trend of site selection in an urban area.
3.4.2. Quantitative Survey
The result of the previous qualitative survey becomes the material for carrying out the follow-up survey to get a more quantitative answer as to why people choose their residence in the conservation area. The cross-section survey involved 195 respondents from the same location in the previous survey. At this stage, 15 respondents were taken in each subdistrict. The survey was conducted on 195 respondents (15 respondents × 13 subdistricts = 195 respondents). The result of analysis and grouping in qualitative survey will be the second-stage survey material. The survey results are processed using JMP 7 to see the correlation analysis results. Correlation analysis is done to measure the attachment of variable purchase, environment, wide land, native inhabitants, and count. The correlation values are divided into 5 groups: very low correlation (0.0–0.20), low correlation (0.21–0.40), moderate correlation (0.41–0.60), high correlation (0.61–0.80), and very high correlation (0.81–1.00). The results of this survey analysis will help researchers to understand the relationship between one variable with other variables that become the factors causing the community to choose the location of residence based on the zone function that has been set in the regulation of spatial planning. A strong correlation will determine the conclusions of the study.
3.5. The Result
The whole process will confirm the results of a preliminary analysis, which states that the conservation zone is the zone that has the highest population growth and accommodates the highest population distribution. The paper also shows that the zone with the highest population does not automatically have the highest population growth and receive the highest population distribution.
4. Results
4.1. Identify Zone Functions
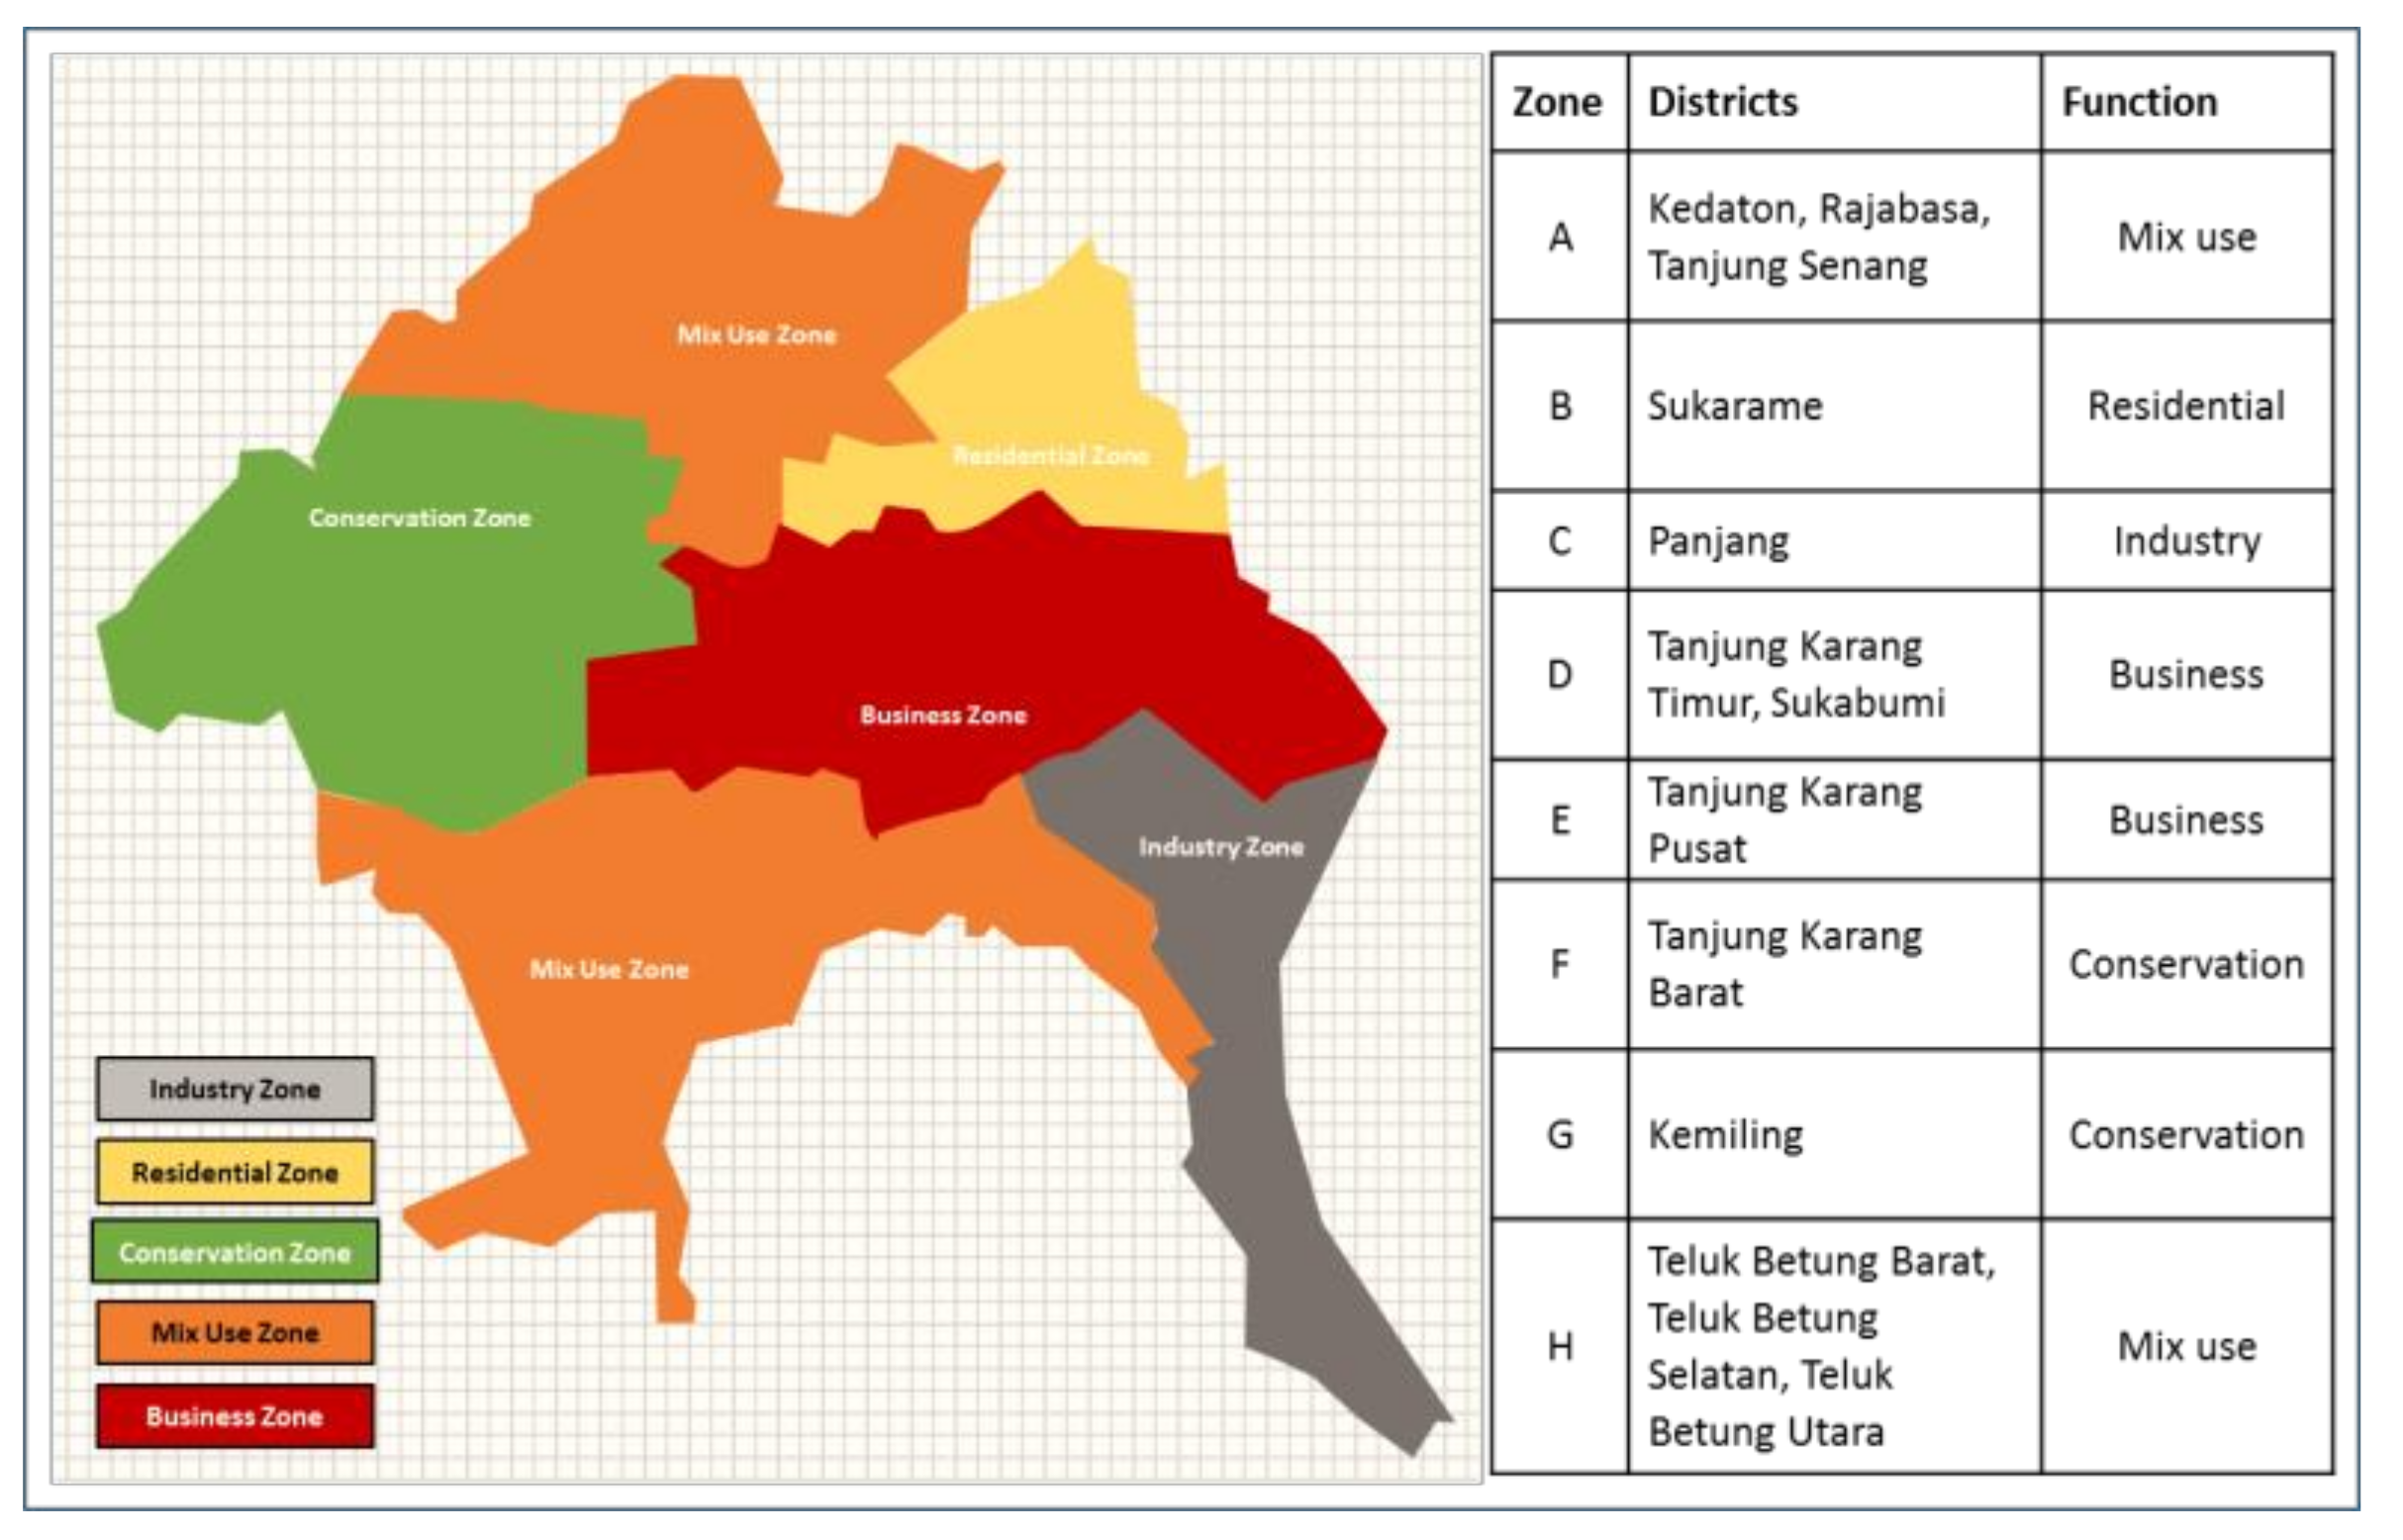
Zone data is arranged based on the list of subdistricts within the zone group, including entering the function of each zone. From government documents, we know of 8 urban zones (A, B, C, D, E, F, G, H) consisting of 13 districts. A zone has 5 functions: mixed use, residential, industry, business, and conservation. Some zones consist of several districts, such as zones A, D, and H. The other zones consist of one district.
Figure 3 shows the five main functions of a zone and several districts incorporated therein. The mixed-use zone has six districts (Kedaton, Rajabasa, Tanjung Senang, Teluk Betung Barat, Teluk Betung Selatan, Teluk Betung Utara) and is a combination of two zones (A and H). The residential zone has one district (Sukarame) and is in Zone B. The industry zone has one district (Panjang) and is in Zone C. The business zone has three districts (Tanjung Karang Timur, Sukabumi, Tanjung Karang Pusat) and a combination of two zones (D and E). The conservation zone also has two districts (Tanjung Karang Barat, Kemiling) and a combination of two zones (F and G). See Table 1.
4.2. Identification of Population Data and Distribution
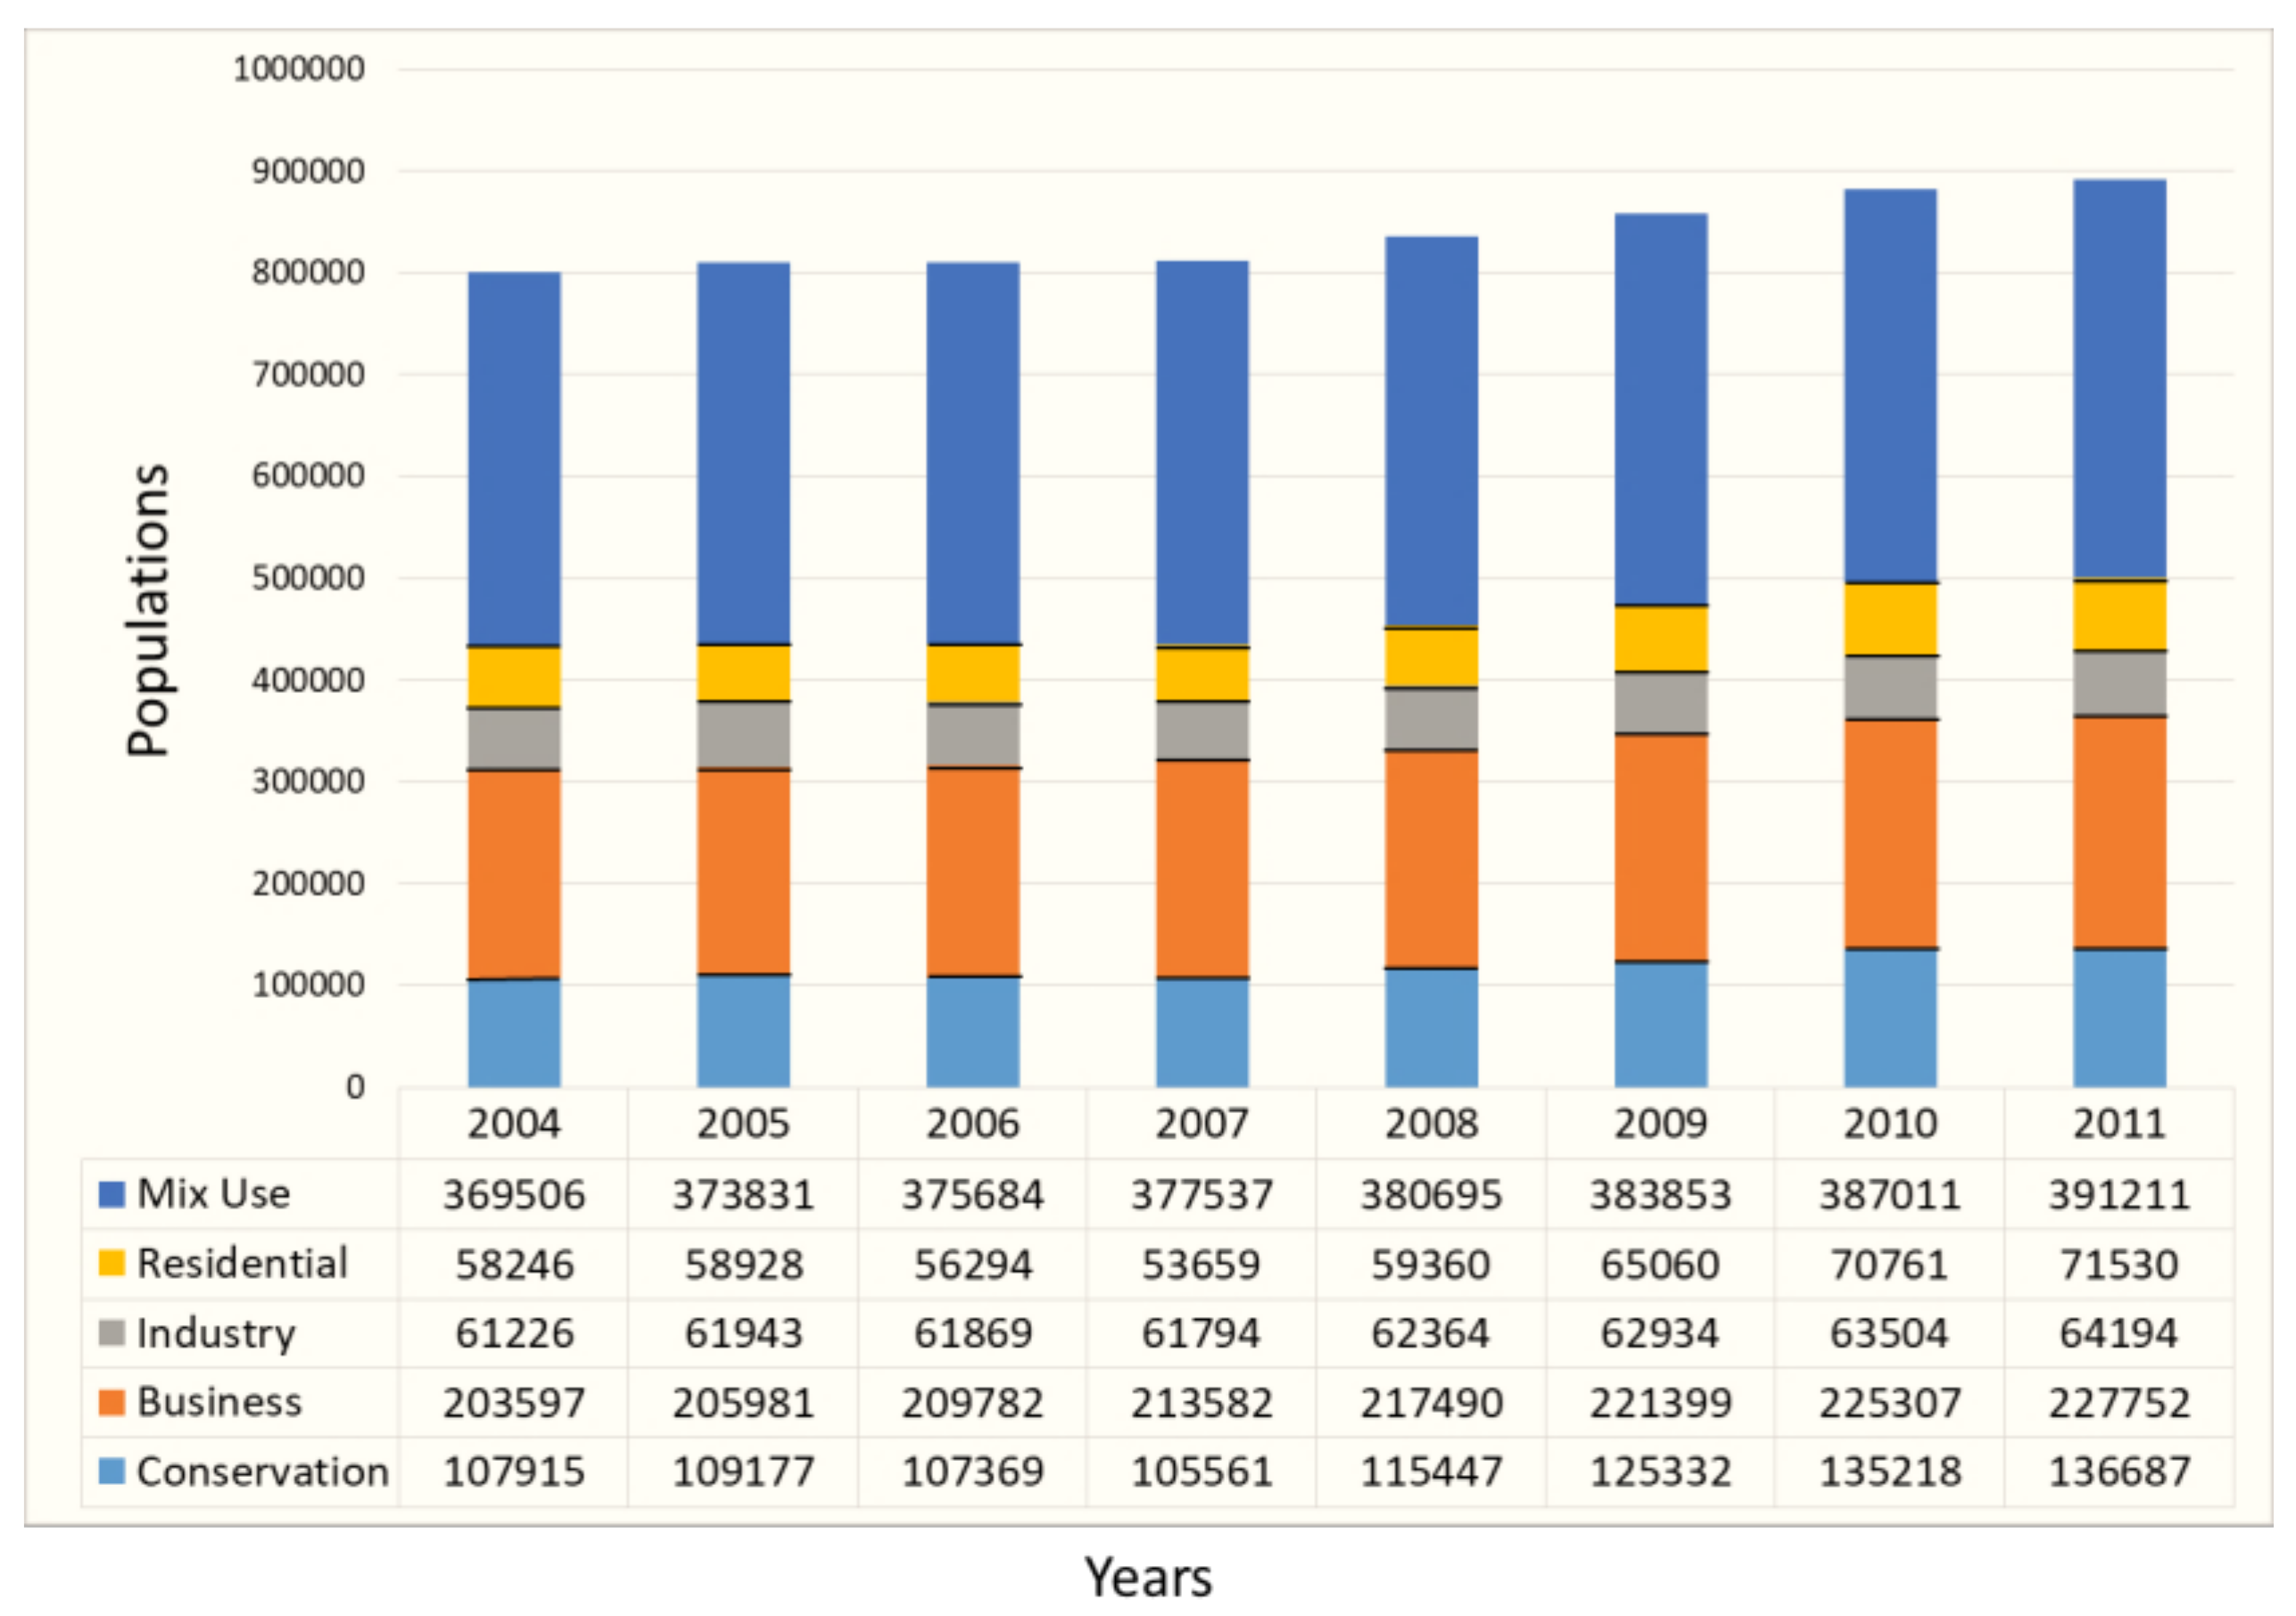
Population data in all districts within 8 years (2004–2011) are grouped by zone function. The population of all zones is growing voluntarily. See Figure 4.
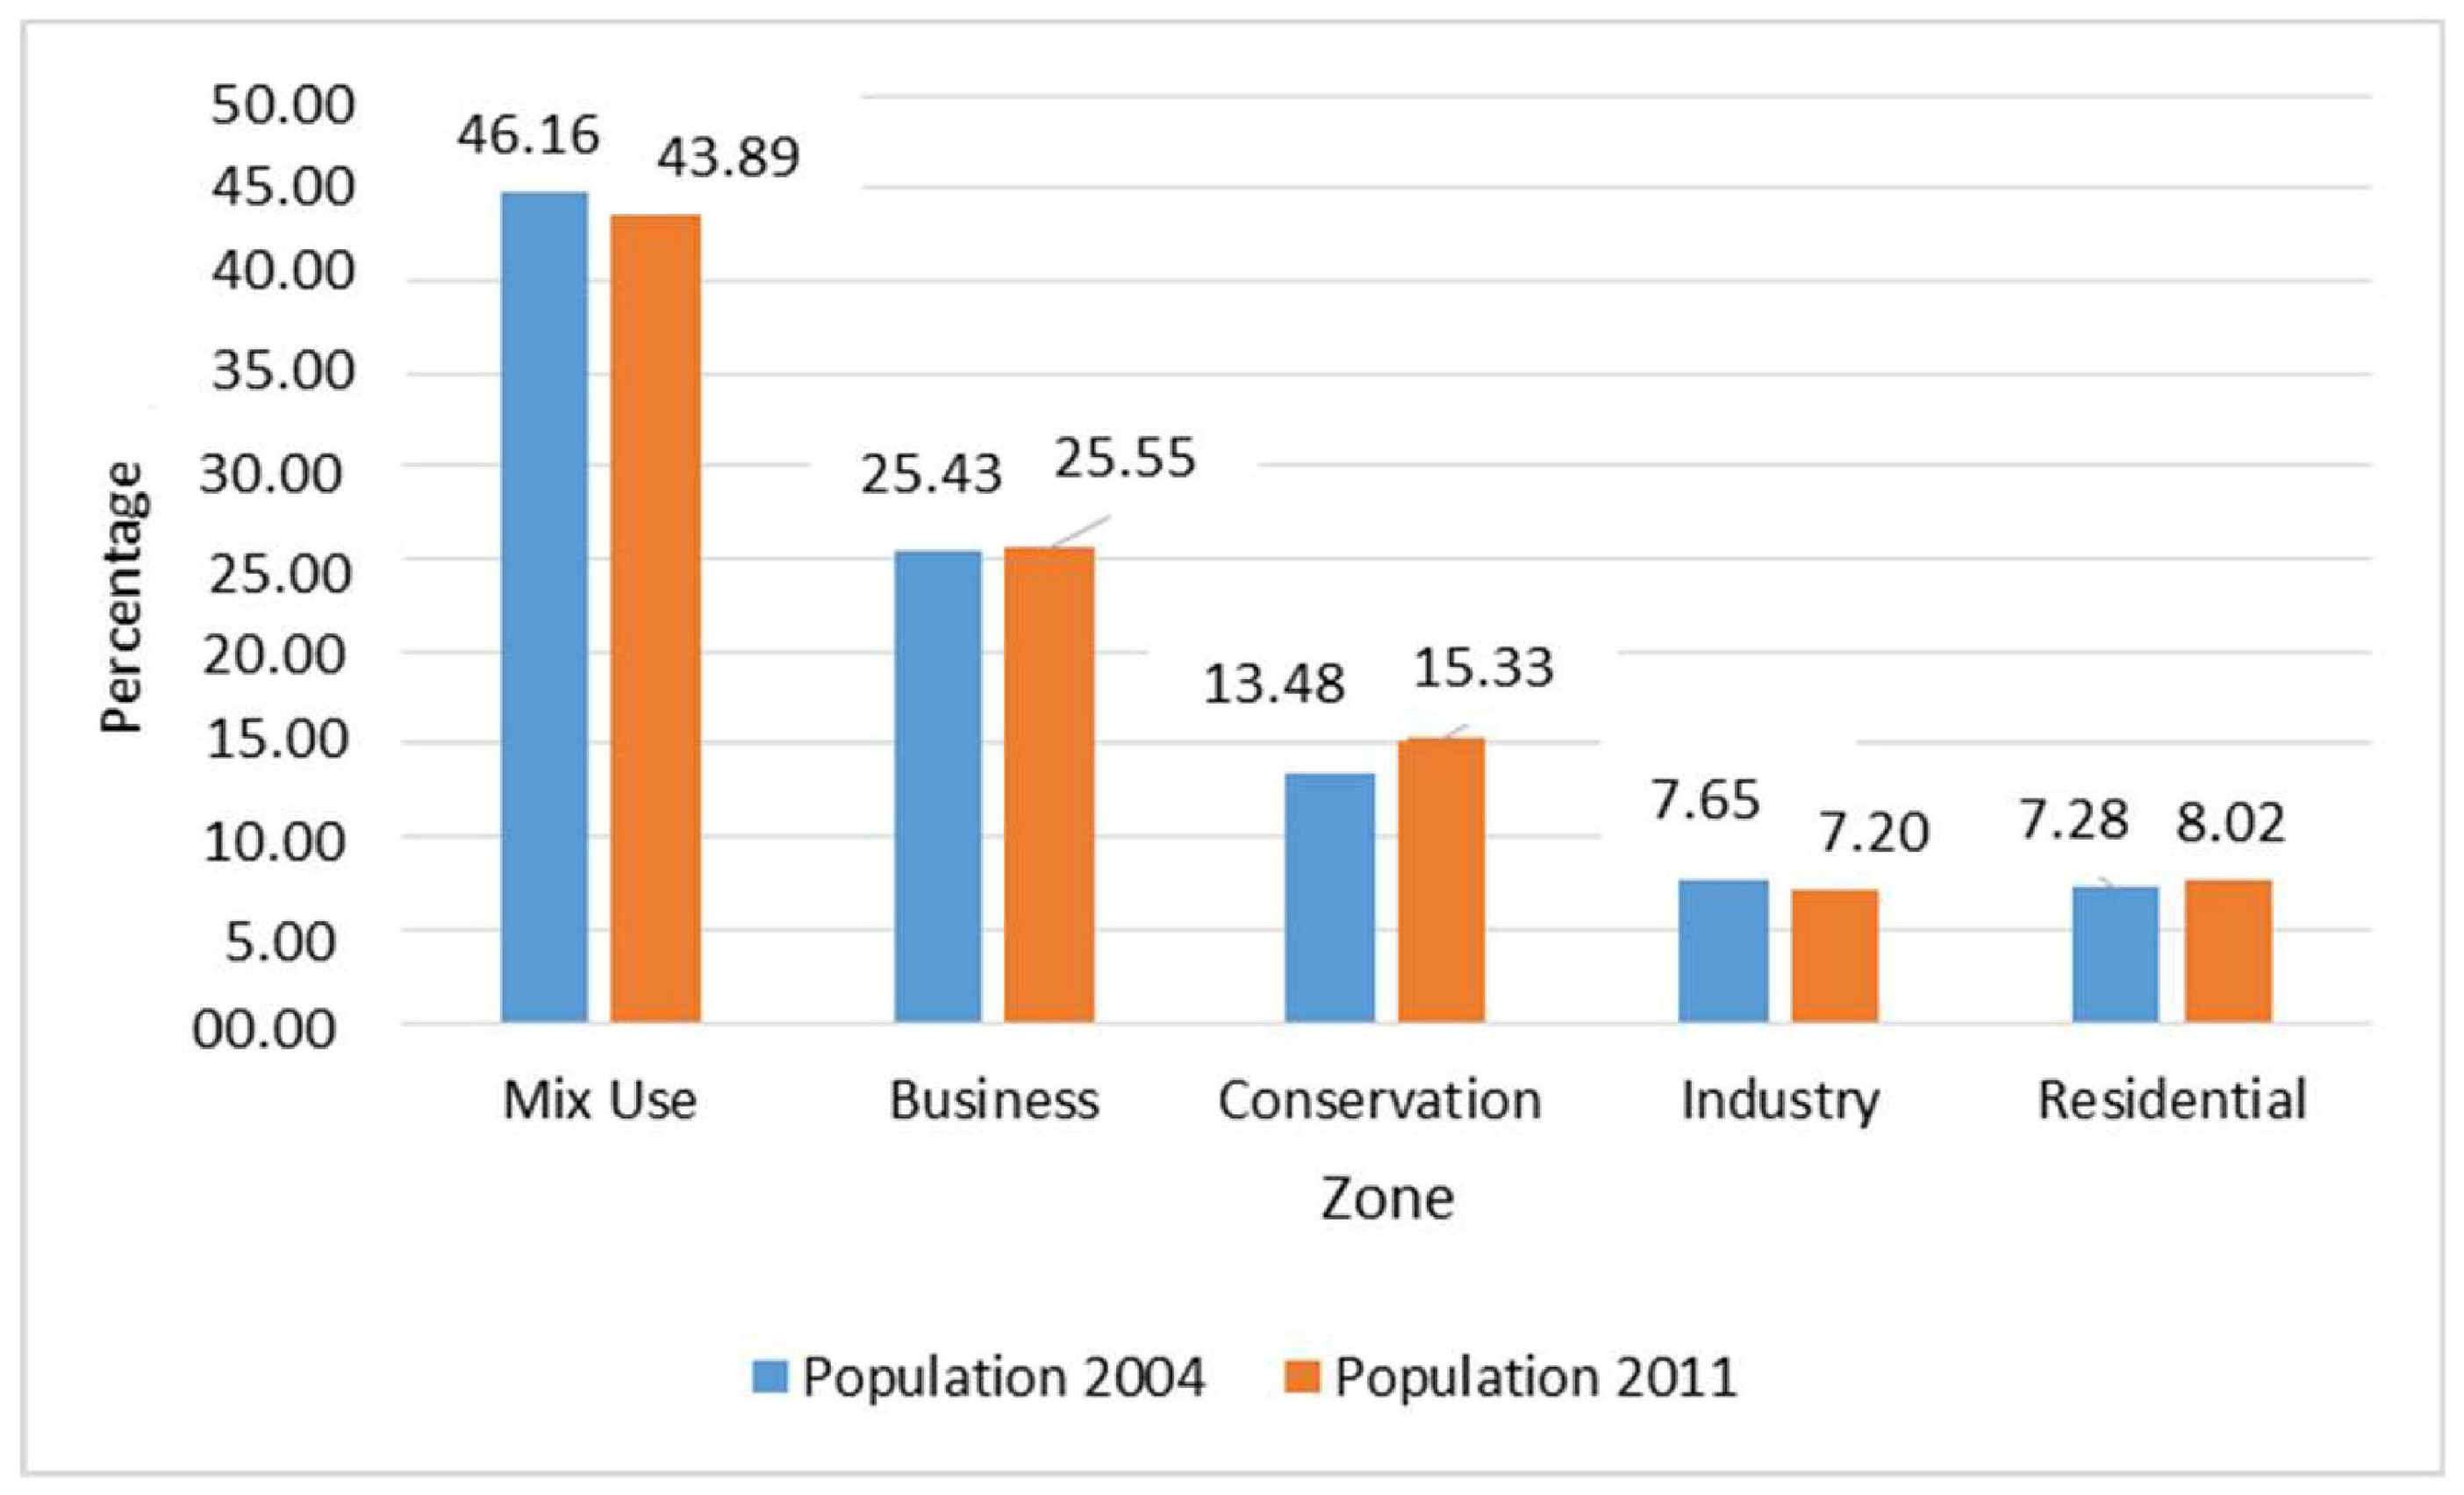
In 2004, mixed-use zones were inhabited by 46.16% of the population, followed by business (25.43%), conservation (13.48%), industry (7.65%), and residential zones (7.28%). The population difference in each zone is very high. See Figure 5.
In 2011, the highest population was still in the mixed-use zone (43.89%), followed by the business zone (25.55%), conservation zone (15.33%), residential zone (8.02%) and industry zone (7.20%). See Figure 5. Two zones exchange positions, namely, residential zones and industrial zones. Previously, between the two functions of this zone, the highest population was in the industry zone and then the residential zone (2004). However, in 2011, the highest population is in the residential zone and no longer in the industrial zone.
However, in general, from 2004 to 2011, the population continues to grow, but there is a change in the proportion of the population in each zone. In 2004, 46.16% of the population lived in the mixed-use zone. However, in 2011, the number dropped to 43.89%. The same decline happened in the industrial zone, from 7.65% to 7.20%. This change raises interest for future research.
4.3. Identify Population Growth and Distribution to Each Zone
Next, we conducted population analysis in each zone to find out population growth and population growth distribution. Combined zone and population data show that during 2004–2011, the largest growth occurred in the conservation zone (26.66%). Furthermore, growth also occurs in the residential zone (22.81%), business zone (11.86%), mixed-use zone (5.87%), and industry zone (4.85%). Population growth in the mixed-use zone and industry zones is very low compared to others whereas the former has the largest population and the latter requires high labor. See Figure 6.
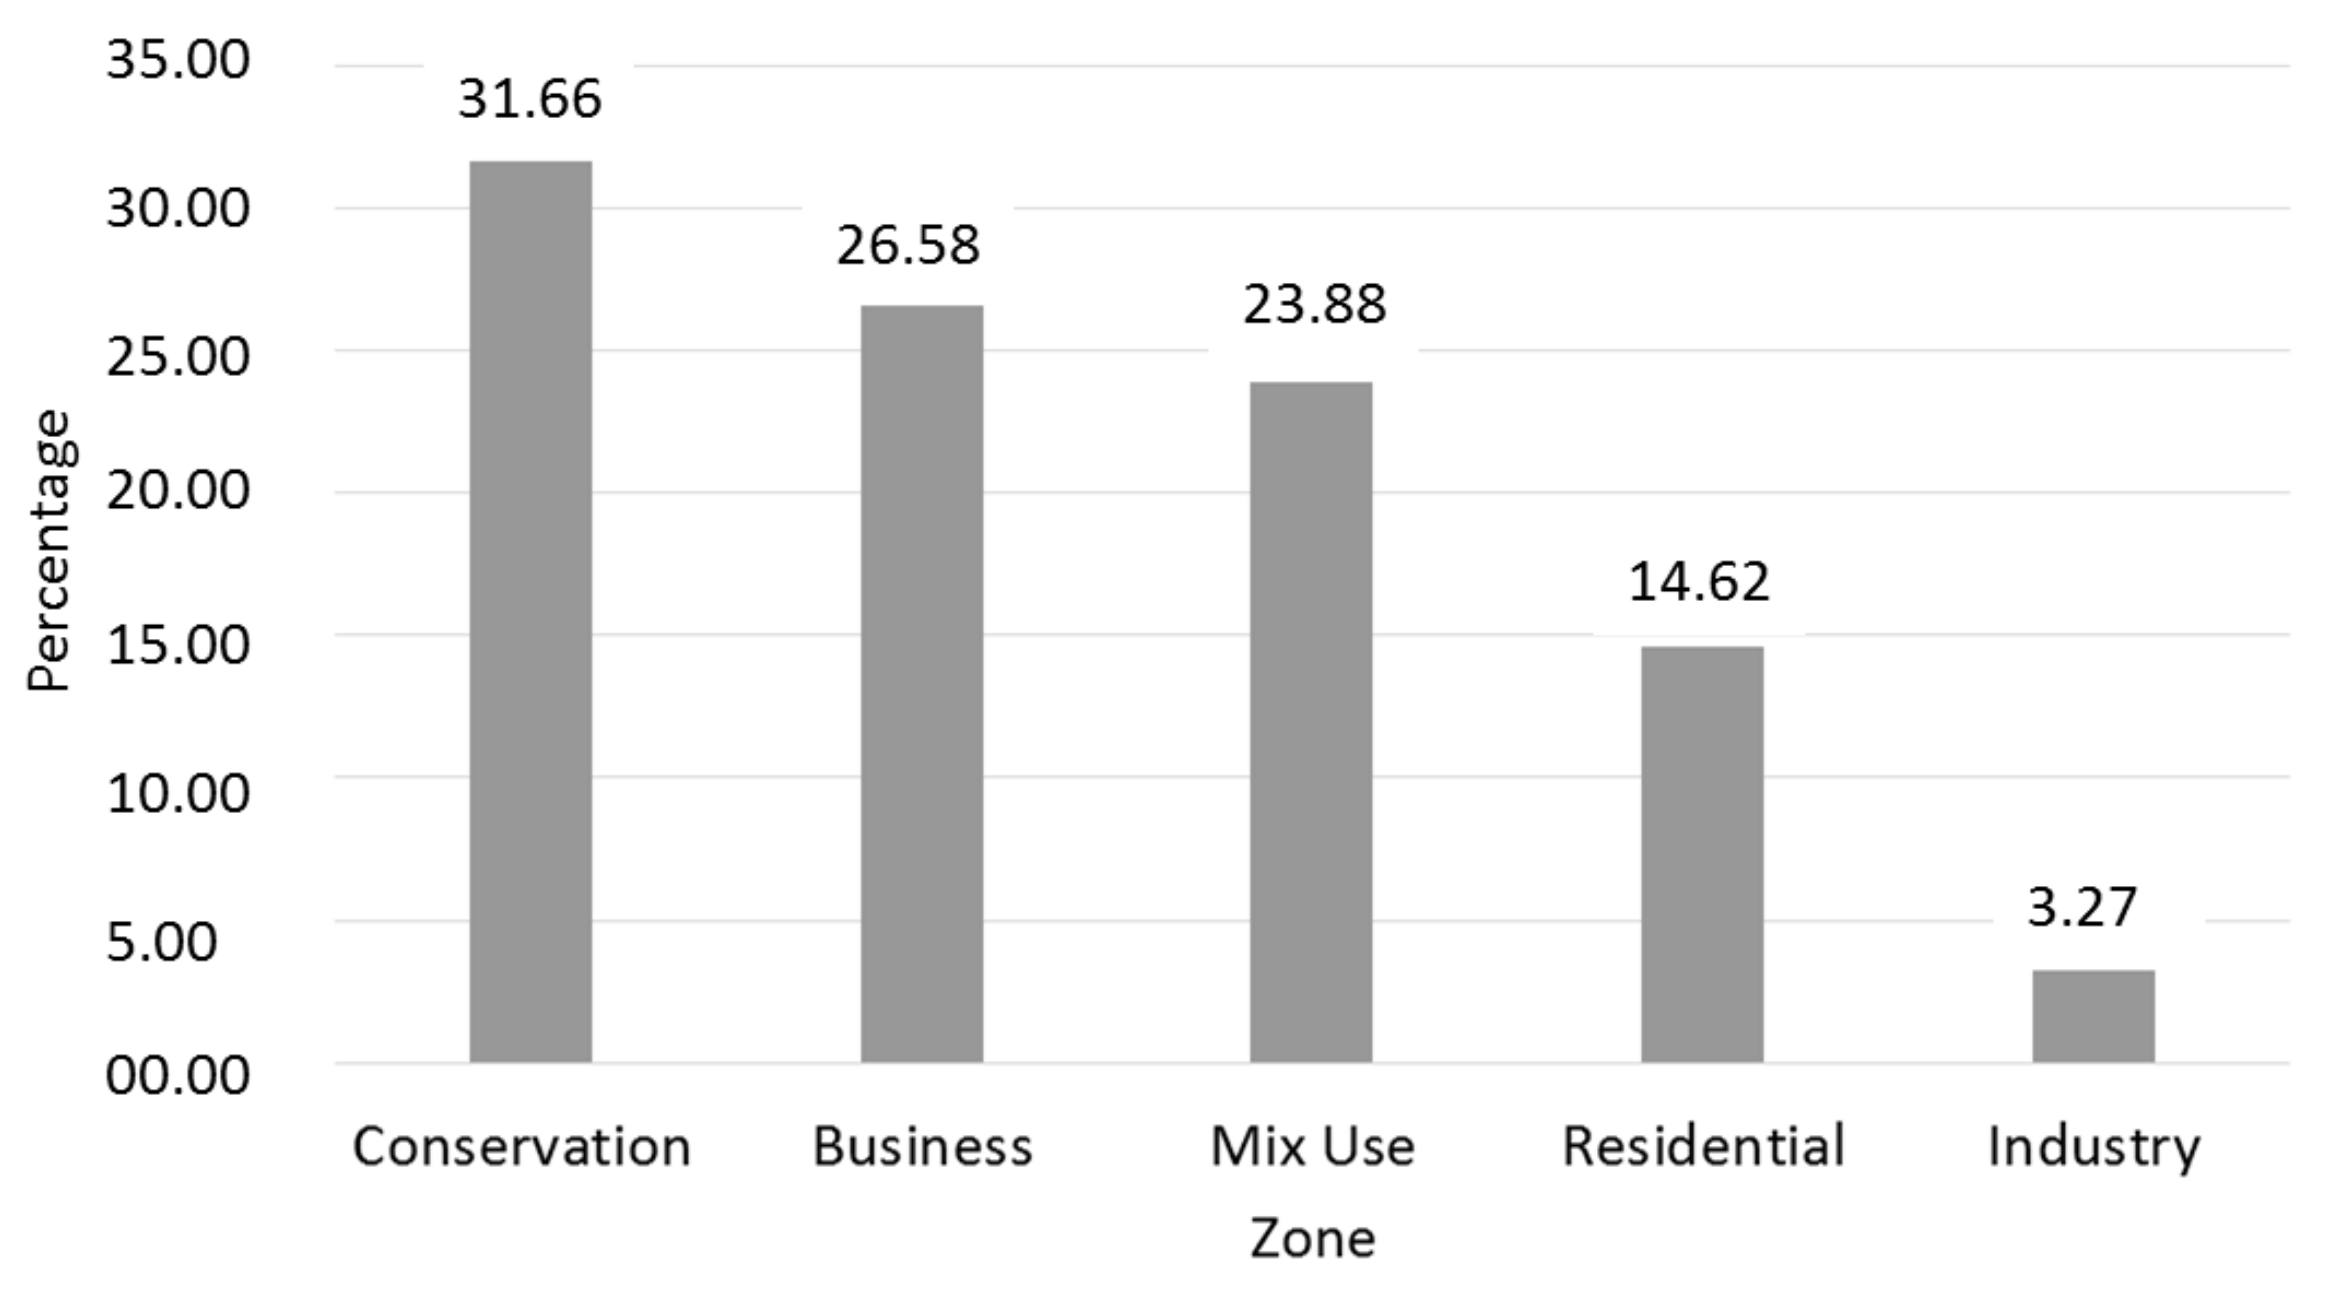
The population has increased by 90,884 people since 2004–2011. They are distributed to all zones. The zones that received the highest number of residents were the conservation zone (31.66%), followed by business zone (26.58%), mixed-use zone (23.88%), residential zone (14.62%), and industry zone (3.27%). See Figure 7.
From this data processing, it can be said that the conservation zone is the one that has the highest population growth trend and receives the highest population distribution.
4.4. Qualitative Survey
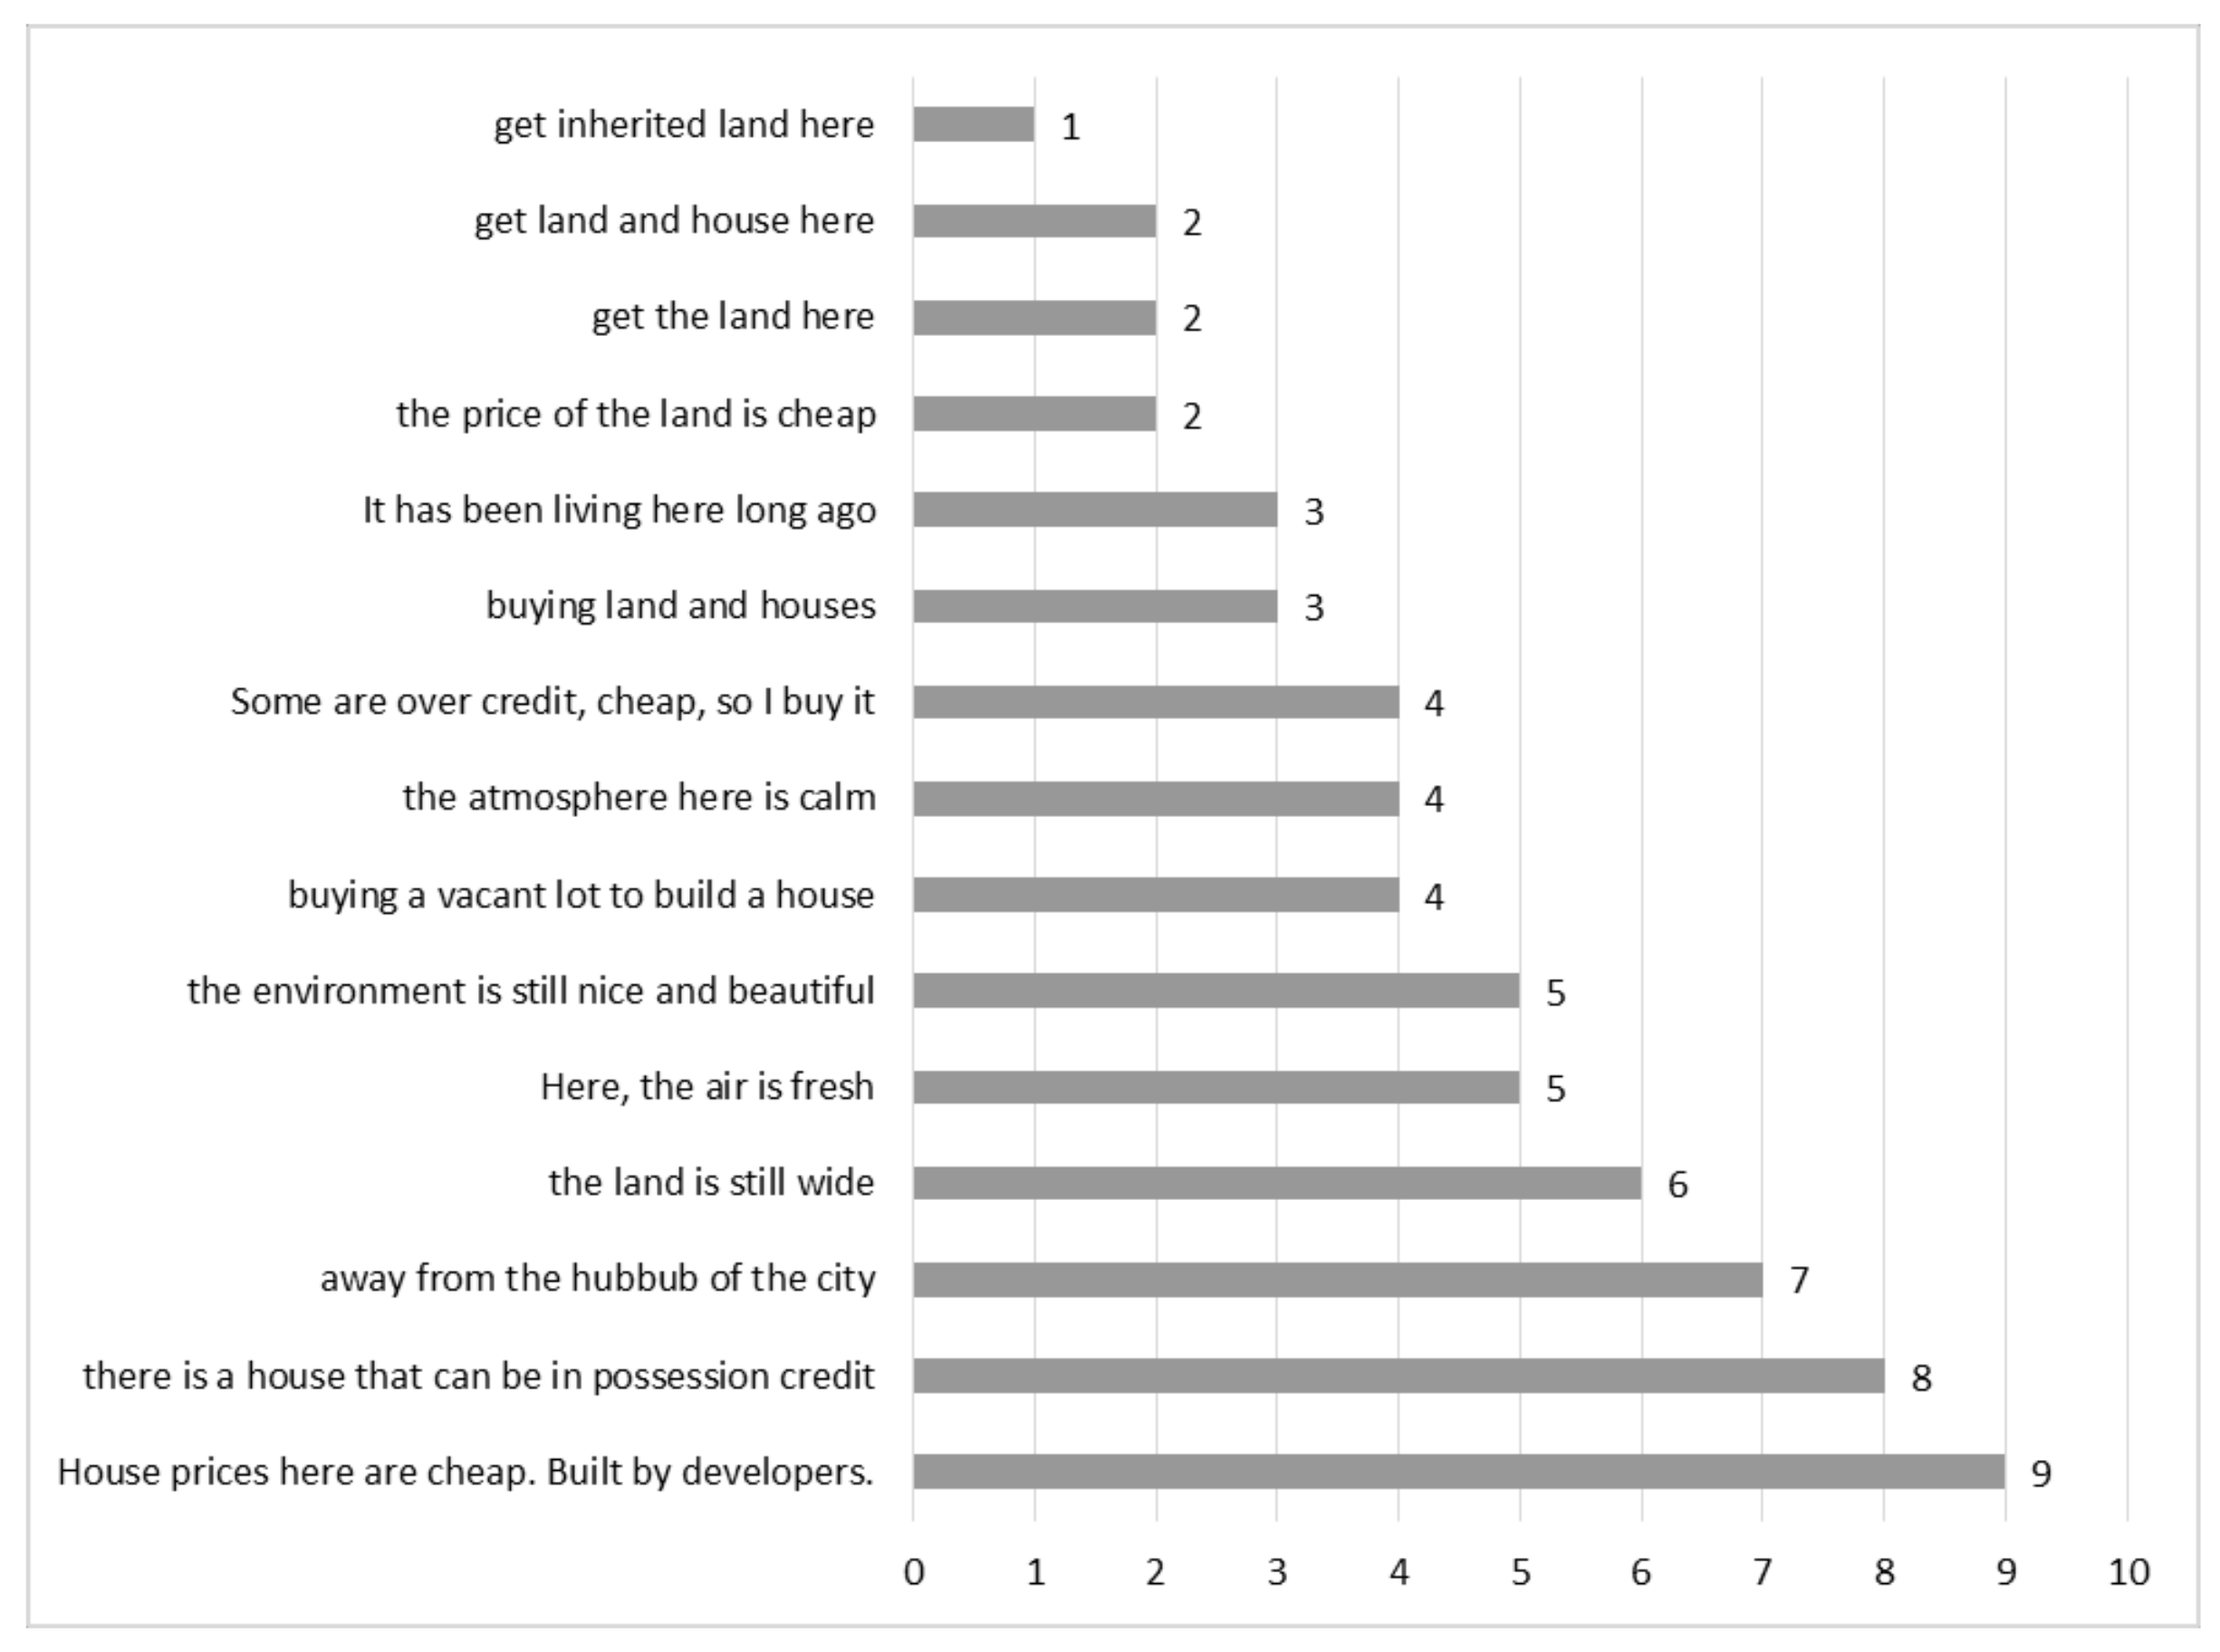
The first-stage survey aims to find out the factors that influence the population to choose the conservation location as residence. Therefore, this is a preference survey and the answer is qualitative. Sixty-five respondents interviewed, and they were the heads of the family (father). The survey locations are Districts Kemiling and Tanjung Karang Barat, which has a total of 13 subdistricts. In each subdistrict, we took 5 respondents, so the total number of respondents is 65. The survey was conducted to determine the initial opinions of residents about their reasons for living in the conservation zone. The results can be seen in Figure 8.
From the results of this qualitative survey, four categories can be derived, namely, purchase, environment, wide land, and native inhabitants. See Table 2. There are 15 types of responses given by the 65 respondents: 8 were under purchase, 1 under wide land, 4 under environment, and 2 under native inhabitants. It was expected that most of the answers were under the purchase factor. Meanwhile, the responses under native inhabitants is very small. This result can be discussed in future studies.
The results of this grouping then made the total value of answers from all respondents. We can see that the biggest answer is purchase (50.77%), then environment (32.31%), wide land (9.23%) and native inhabitants (7.69%). Figure 9 shows that the main reason people live in conservation zone locations is purchase.
4.5. Quantitative Survey and Correlation Analysis
Table 3 shows the description of the analysis from the survey data. The description of the data shows the variables to be analyzed to gain an understanding of the dominant variables affecting the use of conservation zones as residence locations. The highest number is in the purchase variable of 721,000, followed by environment (623,000), wide-land variable (450,000), and native in-habitants variable (216,000). Meanwhile, the highest Mean values are purchase (3.6974), environment (3.1949), wide-land (2.3077), and native inhabitants (1.1077).
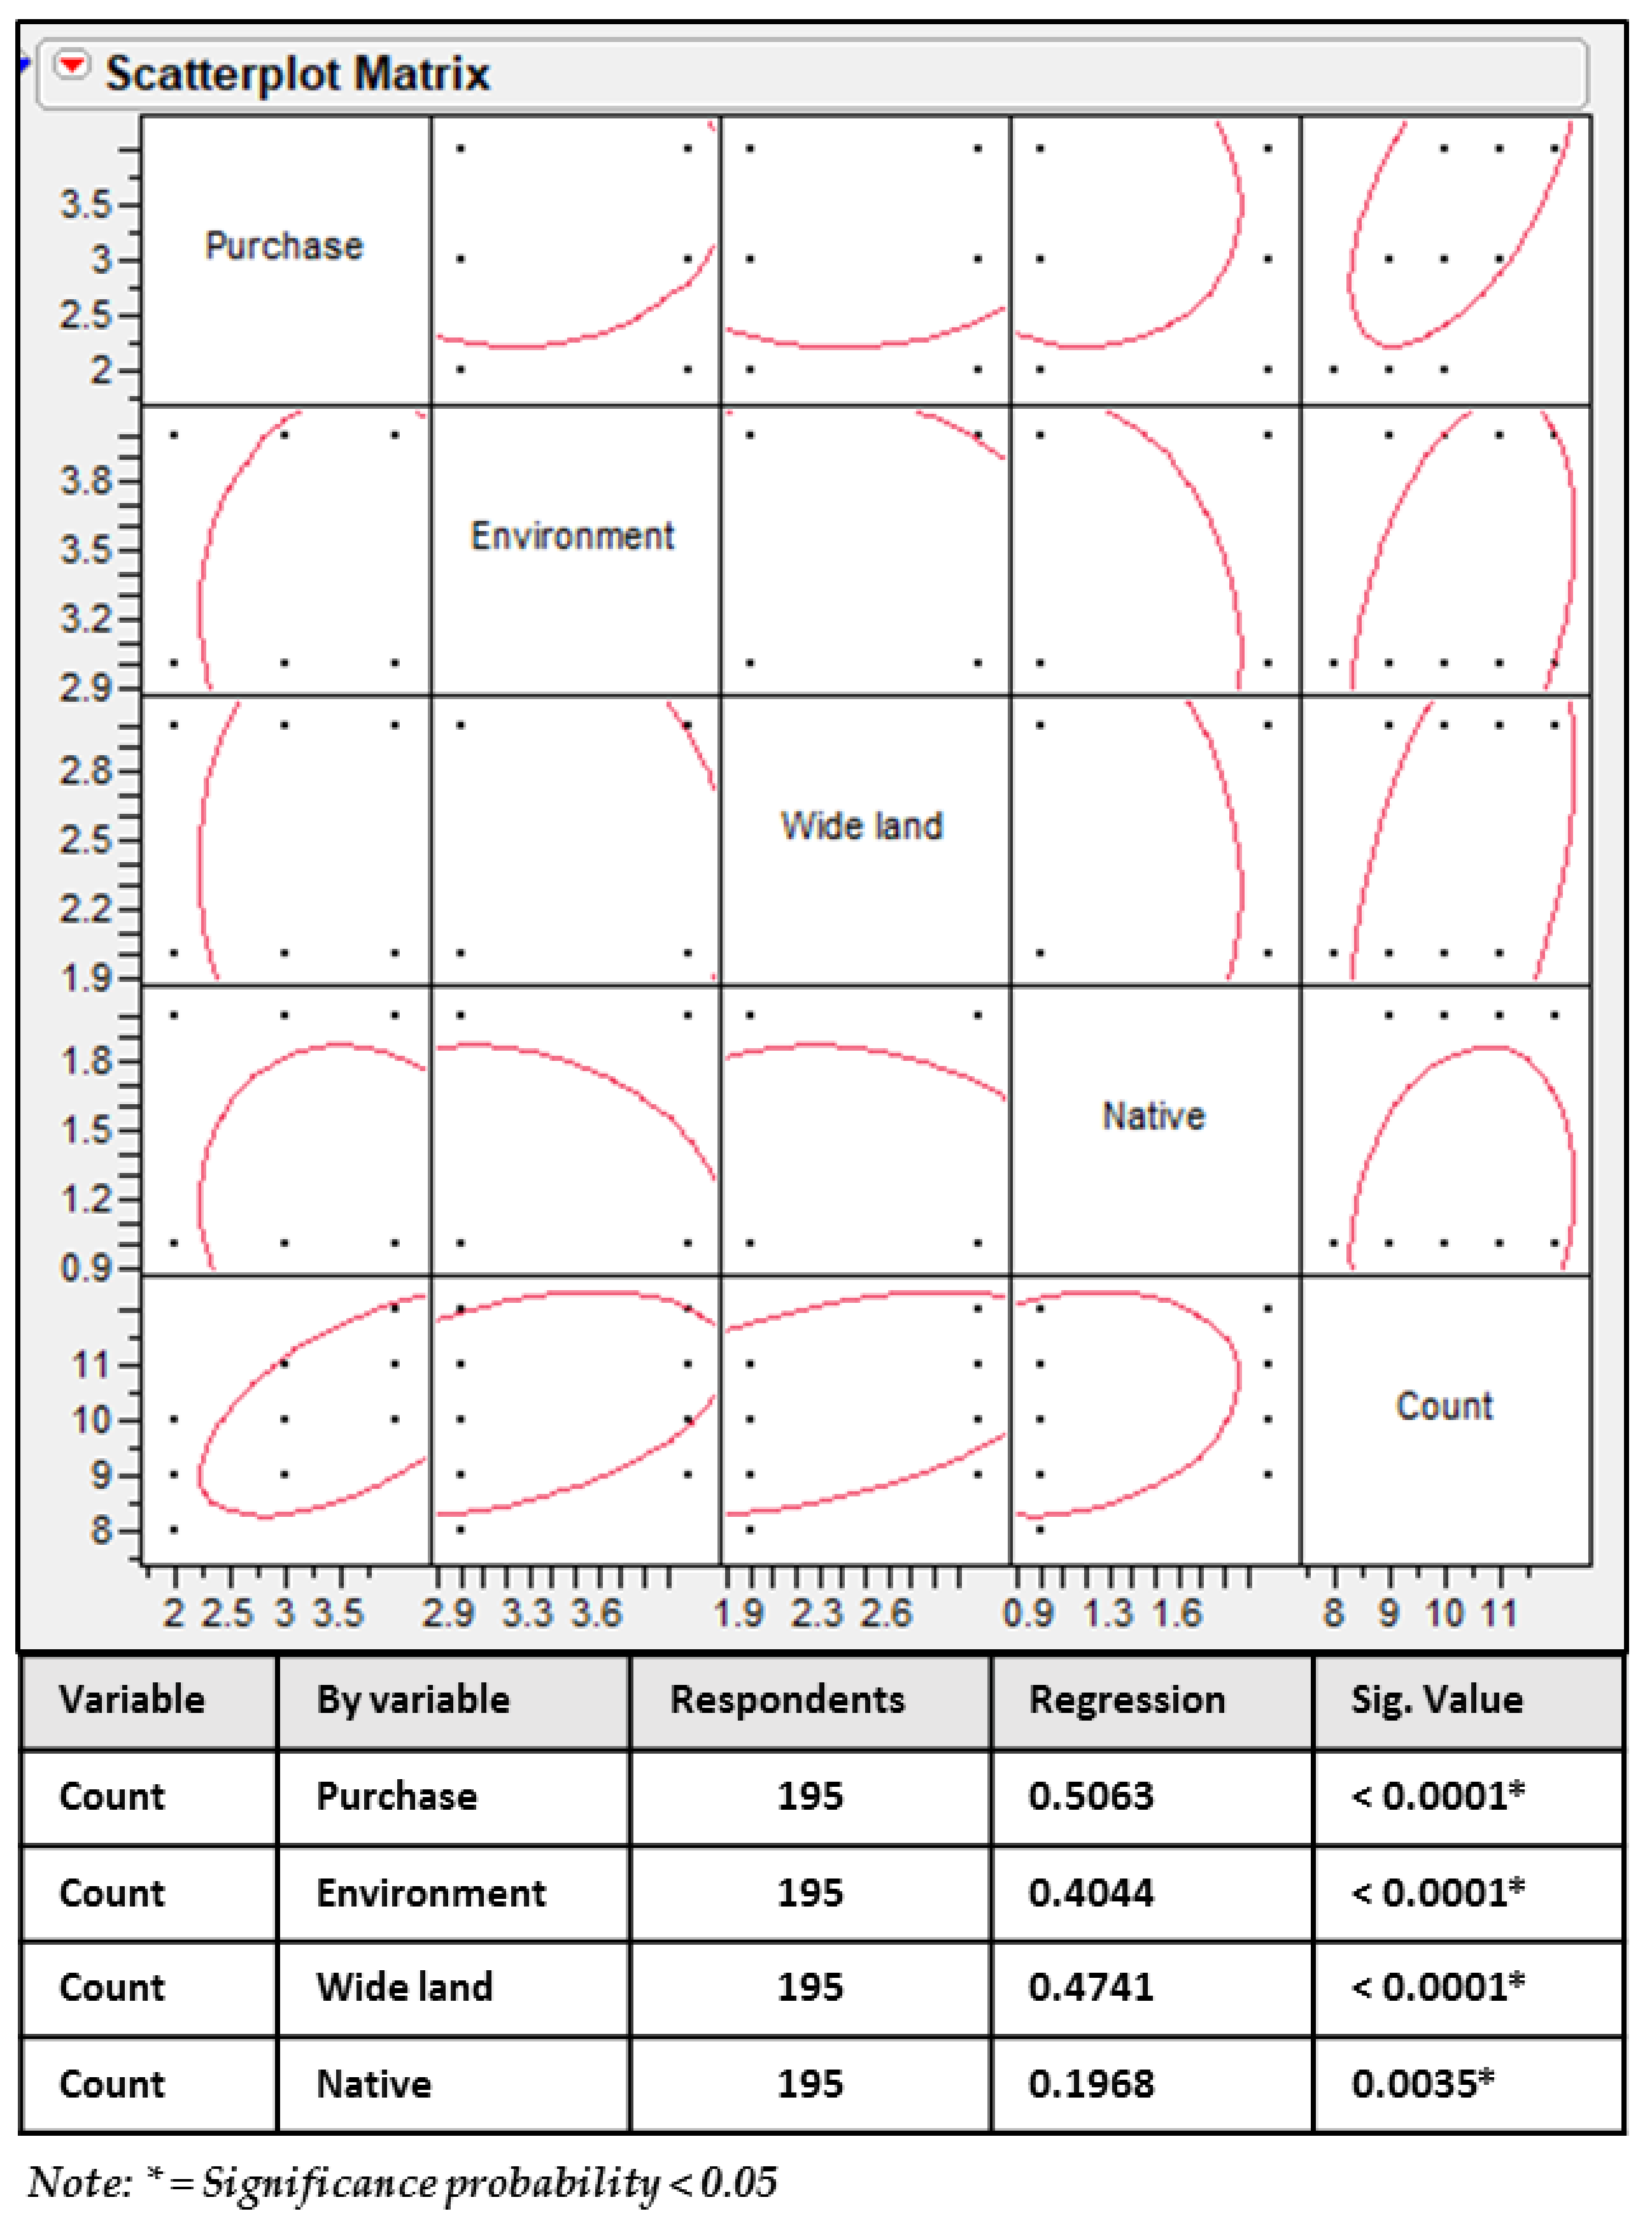
The result showed that purchase has the highest correlation analysis value (0.5063) followed by wide land (0.4741), environment (0.4044), and native inhabitants (0.1968). See Figure 10.
Figure 10 shows that all variables influence land use in the conservation zone. Some of the certain variables are the purchase of land, which residents currently buy land from previous landowners. Then, wide variables of land availability, proper environmental condition variable, and local population variable. This result confirms that three very dominant variables influence people to live in conservation zones, namely purchase variables, land area variables, and environmental variables. Therefore, these three variables have regression value > 0.4. (See Figure 10). The sig. value of the three variables also shows a dominant tendency that these three variables are the decisive factor in land use in the conservation zone as the location of the residence. Regulation of land use should be able to suppress the tendency of this land function change.
5. Discussion
This study aims to determine population growth and population growth distribution based on urban zones. Population research in a city scale has been done by many scholars. However, a discussion on population per zone has not been done. Therefore, this study is interesting to do and can complement the results of other previous research efforts.
Based on the results of this study, we can say that the growth of the urban population does not occur evenly. Trend and distribution of growth are very dependent on the function of each zone. Research conducted in Bandar Lampung shows that the conservation zones have the highest population growth. It also receives more population growth distribution when compared to other zones. In addition, zones with a high to low population growth are residential zones, business zones, mixed-use zones, and industrial zones.
Conservation zones are estimated to have many large and unused pieces of land. They encourage residents and housing developers to buy land within the zone. Government policy may also allow concessions in land use within the conservation zone. Thus, a lot of new housing was built. Housing developers are also building homes in the conservation zones, which gets a favorable response from the community. New residents living in conservation zones may come from within the city but from different zones, from within the zone itself, or from out of town who decide to settle within the city. It is interesting to deepen this research in the future, especially on the origin of the population occupying conservation zones and other zones, to further understand the causes of population growth and the distribution of population growth.
We are trying to delve into the variables that cause the population to settle in the conservation zone. Of course, people have many reasons for this. In addition, we have confidence that residents know more about the reasons why they live in conservation zones. Therefore, we conducted a qualitative survey with open-ended questions to find out these reasons. The results were grouped into four, namely, purchase, environment, wide land, and native inhabitants. Then, we do a retest with close-ended questions to know the correlation between variables. The results show that variable purchase is the highest variable, followed by wide land, environment, and native inhabitants. This result confirms that the conservation zones do have land that has not been built on and that the land is then traded and becomes new settlement areas.
In addition to population growth per zone, this study also conducted research on the distribution of population growth to each zone. This will complement population growth studies in other areas such as those of Ray and Ray [23], which is related to the environment; Ukpolo [24] and Headey and Hodge [25], related to socioeconomics; or Sheykhi MT [26], relating to crime, and others. The advantage of this research is the understanding that the function of an urban zone influences the acceleration of population growth and population distribution.
There are other interesting findings. Zones that have a high population do not necessarily have the highest population growth. This is indicated by the highest number of population data in the mixed-use zone. However, population growth there is not the highest. Industrial zones are zones that require high labor but do not have a high population growth and do not accept the distribution of high population growth. Research on relationships between the industrial zone and other zones becomes interesting as a theme of future research.
The results of this study also show that the community chose the conservation zone. However, if the community is not interested in environmental sustainability and implementing a way of life that protects the environment, the existence of settlements in the conservation zone can be a major factor causing environmental damage. However, from another perspective, the tendency of people to choose a house in a zone with good environmental conditions is a sign that the government should consider creating a city with sustainable environmental conditions. That way, urban population growth does not contribute to global warming.
Previous research, conducted by many scholars, uses the perspective of urban areas as a whole. This study provides an alternative variable that can affect the growth of urban population, especially in terms of population growth within the city that is divided into several zones.
6. Conclusions
Each urban zone has different population growths and distributions. This study shows that the conservation zone has the highest population growth despite not having the highest population. The highest population is in the mixed-use zone. Population growth from highest to lowest occurs in the conservation zone, residential zone, business zone, mixed-use zone, and industrial zone (CRBMI). Meanwhile, zones that receive the highest number of people from highest to lowest are conservation zones, business zones, mixed-use zones, residential zones, and industrial zones (CBMRI). The highest variables in home location selection are purchase, wide land, environment, and native inhabitants. This paper contributes to population growth analysis in more detail, as it sees the population issue from a zonation perspective. Previously, population research was widely seen from the perspective of urban areas. Further research is strongly advised to gain a more detailed understanding of the growth and distribution of urban dwellers, considering the classification of zones and the advantages or disadvantages of each zone.
Acknowledgments
This research can be carried out with the support of the government of Japan through the Monbukagakusho MEXT 2015 Scholarship, the University of Kitakyushu, and the University of Bandar Lampung. We would like to thank Erina Noviani, research staff at the Center for Urban and Regional Studies, and to the respondents of the survey.
Author Contributions
The research paper was written by both authors. Ida Bagus Ilham Malik contributed to the preparation of the framework, method, data collection, and analysis. Bart Julien Dewancker contributed to the control of and advice for the research process and the preparation of the paper as a whole.
Conflicts of Interest
The authors state that there is no conflict of interest in this research paper.
References
- The Worlds Cities in 2016. Available online: http://www.un.org/en/development/desa/population/publications/pdf/urbanization/the_worlds_cities_in_2016_data_booklet.pdf (accessed on 12 March 2018).
- Salvacion, A.R.; Magcale-Macandog, D.B. Spatial analysis of human population distribution and growth in Marinduque Island, Philipines. J. Mar. Isl. Cult. 2015, 4, 27–33. [Google Scholar] [CrossRef]
- Feng, J.; Zhou, Y. The growth and distribution of population in Beijing Metropolitan Area (1982–2000). Acta Geogr. Sin. 2003, 58, 903–916. [Google Scholar]
- Shi, L.; Taubenbock, H.; Zhang, Z.; Liu, F.; Wurm, M. Urbanization in China from the end 1980s until 2010—Spatial dynamics and patterns of growth using EO-data. Int. J. Digit. Earth 2017, 1–17. [Google Scholar] [CrossRef]
- Tian, G.; Jiang, J.; Yang, Z.; Zhang, Y. The urban growth, size distribution and spatio-temporal dynamic pattern of the Yangtze River Delta megalopolitan region, China. Ecol. Model. 2011, 222, 865–878. [Google Scholar] [CrossRef]
- Borrego, C.; Martins, H.; Tchepel, O.; Salmim, L.; Monteiro, A.; Miranda, A.I. How urban structure can effect city sustainability from an air quality perspective. Environ. Model. Softw. 2006, 21, 461–467. [Google Scholar] [CrossRef]
- Stewart, I.D.; Oke, T.R. Local climate zones for urban temperature studies. Am. Meteorol. Soc. J. Online 2012, 93, 1879–1900. [Google Scholar] [CrossRef]
- Fredrick, L.; Grimmond, C.S.B. The influence of vegetation and building morphology on shadow patterns and mean radiant temperatures in urban areas: Model development and evaluation. Theor. Appl. Climatol. 2011, 105, 311–323. [Google Scholar]
- Xiao, J.; Shen, Y.; Ge, J.; Ryutaro, T.; Tang, C.; Liang, Y.; Huang, Z. Evaluation urban expansion and land use change in Shijiazhuang, China, by using GIS and remote sensing. Landsc. Urban Plan. 2006, 75, 69–80. [Google Scholar] [CrossRef]
- Al-shalabi, M.; Billa, L.; Pradhan, B.; Mansor, S.; Al-Sharif, A.A.A. Modelling urban growth evolution and land-use changes using GIS based cellular automata and SLEUTH models: The case of Sana’a metropolitan city, Yemen. Environ. Earth Sci. 2012, 70, 425–437. [Google Scholar] [CrossRef] [Green Version]
- Alberti, M. The effects of urban patterns on ecosystem function. Int. Reg. Sci. Rev. 2005, 28, 168–192. [Google Scholar] [CrossRef]
- DeFries, R.S.; Rudel, T.; Uriarte, M.; Hansen, M. Deforestation driven by urban population growth and agricultural trade in the twenty-first century. Nat. Geosci. 2010, 3, 178–181. [Google Scholar] [CrossRef]
- Chiang, L.-H.N.; Hsu, J.-C.R. Locational decisions and residential preferences of Taiwanese Immigrants in Australia. GeoJournal 2005, 64, 75–89. [Google Scholar] [CrossRef]
- Kim, T.-K.; Horner, M.W.; Marans, R.W. Life cycle and environmental factors in electing residential and job location. Hous. Stud. 2003, 20, 457–473. [Google Scholar] [CrossRef]
- Bullock, C.H.; Scott, M.; Gkartzios, M. Rural residential preferences for house design and location: Insights from a discrete choice experimen applied to Ireland. J. Environ. Plan. Manag. 2011, 54, 685–706. [Google Scholar] [CrossRef]
- Deng, X.; Huang, J.; Rozelle, S.; Uchida, E. Growth, population and industrialization, and urban land expansion of China. J. Urban Econ. 2008, 63, 96–115. [Google Scholar] [CrossRef]
- Burgess, E.W. The growth of the city: An Introduction to a research project. In Urban Ecology; Springer: Boston, MA, USA, 2008; pp. 71–78. [Google Scholar]
- O’Neill, B.C.; Kriegler, E.; Ebi, K.L.; Kemp-Benedict, E.; Riahi, K.; Rothman, D.S.; van Ruijven, B.J.; van Vuuren, D.P.; Birkmann, J.; Kok, K.; et al. The roads ahead: Narratives for shared socioeconomic pathways describing world futures in the 21st century. Glob. Environ. Chang. 2017, 42, 169–180. [Google Scholar] [CrossRef]
- Boserup, E. The Condition of Agricultural Growth: The Economic of Agrarian Change under Population Pressure; Transaction Publisher: New Brunswick, NJ, USA; pp. 43–54.
- Prashker, J.; Shiftan, Y.; Hershkovitch-Sarusi, P. Residential choice location, gender and the commute trip to work in Tel Aviv. J. Transp. Geogr. 2008, 16, 332–341. [Google Scholar] [CrossRef]
- Modica, G.; Zoccali, P.; Di Fazio, S. The e-Participation in Tranquillity Areas Identification as a Key Factor for Sustainable Landscape Planning. Comput. Sci. Appl. 2013, 7973, 550–565. [Google Scholar] [CrossRef]
- Open-ended vs. Closed-Ended Question in User Research. Available online: https://www.nngroup.com/articles/open-ended-questions/ (accessed on 21 March 2018).
- Ray, S.; Ray, I.A. Impact of population growth on environment degradation: Case of India. J. Econ. Sustain. Dev. 2011, 2. Available online: http://www.iiste.org/Journals/index.php/JEDS/article/view/627 (accessed on 21 March 2018).
- Ukpolo, V. Population growth and economic growth in Africa. J. Dev. Soc. 2002, 18, 315–329. [Google Scholar] [CrossRef]
- Headey, D.D.; Hodge, A. The effect of population growth on economic growth: A meta-regression analysis of the macroeconomic literature. Popul. Dev. Rev. 2009, 35, 221–248. [Google Scholar] [CrossRef]
- Sheykhi, M.T. Incresing crimes vs. Population density in megacities. Soc. Crimonol. 2016, 4, 136. [Google Scholar] [CrossRef]
Figure 1.
Research framework.

Figure 2.
Flowchart of research implementation.
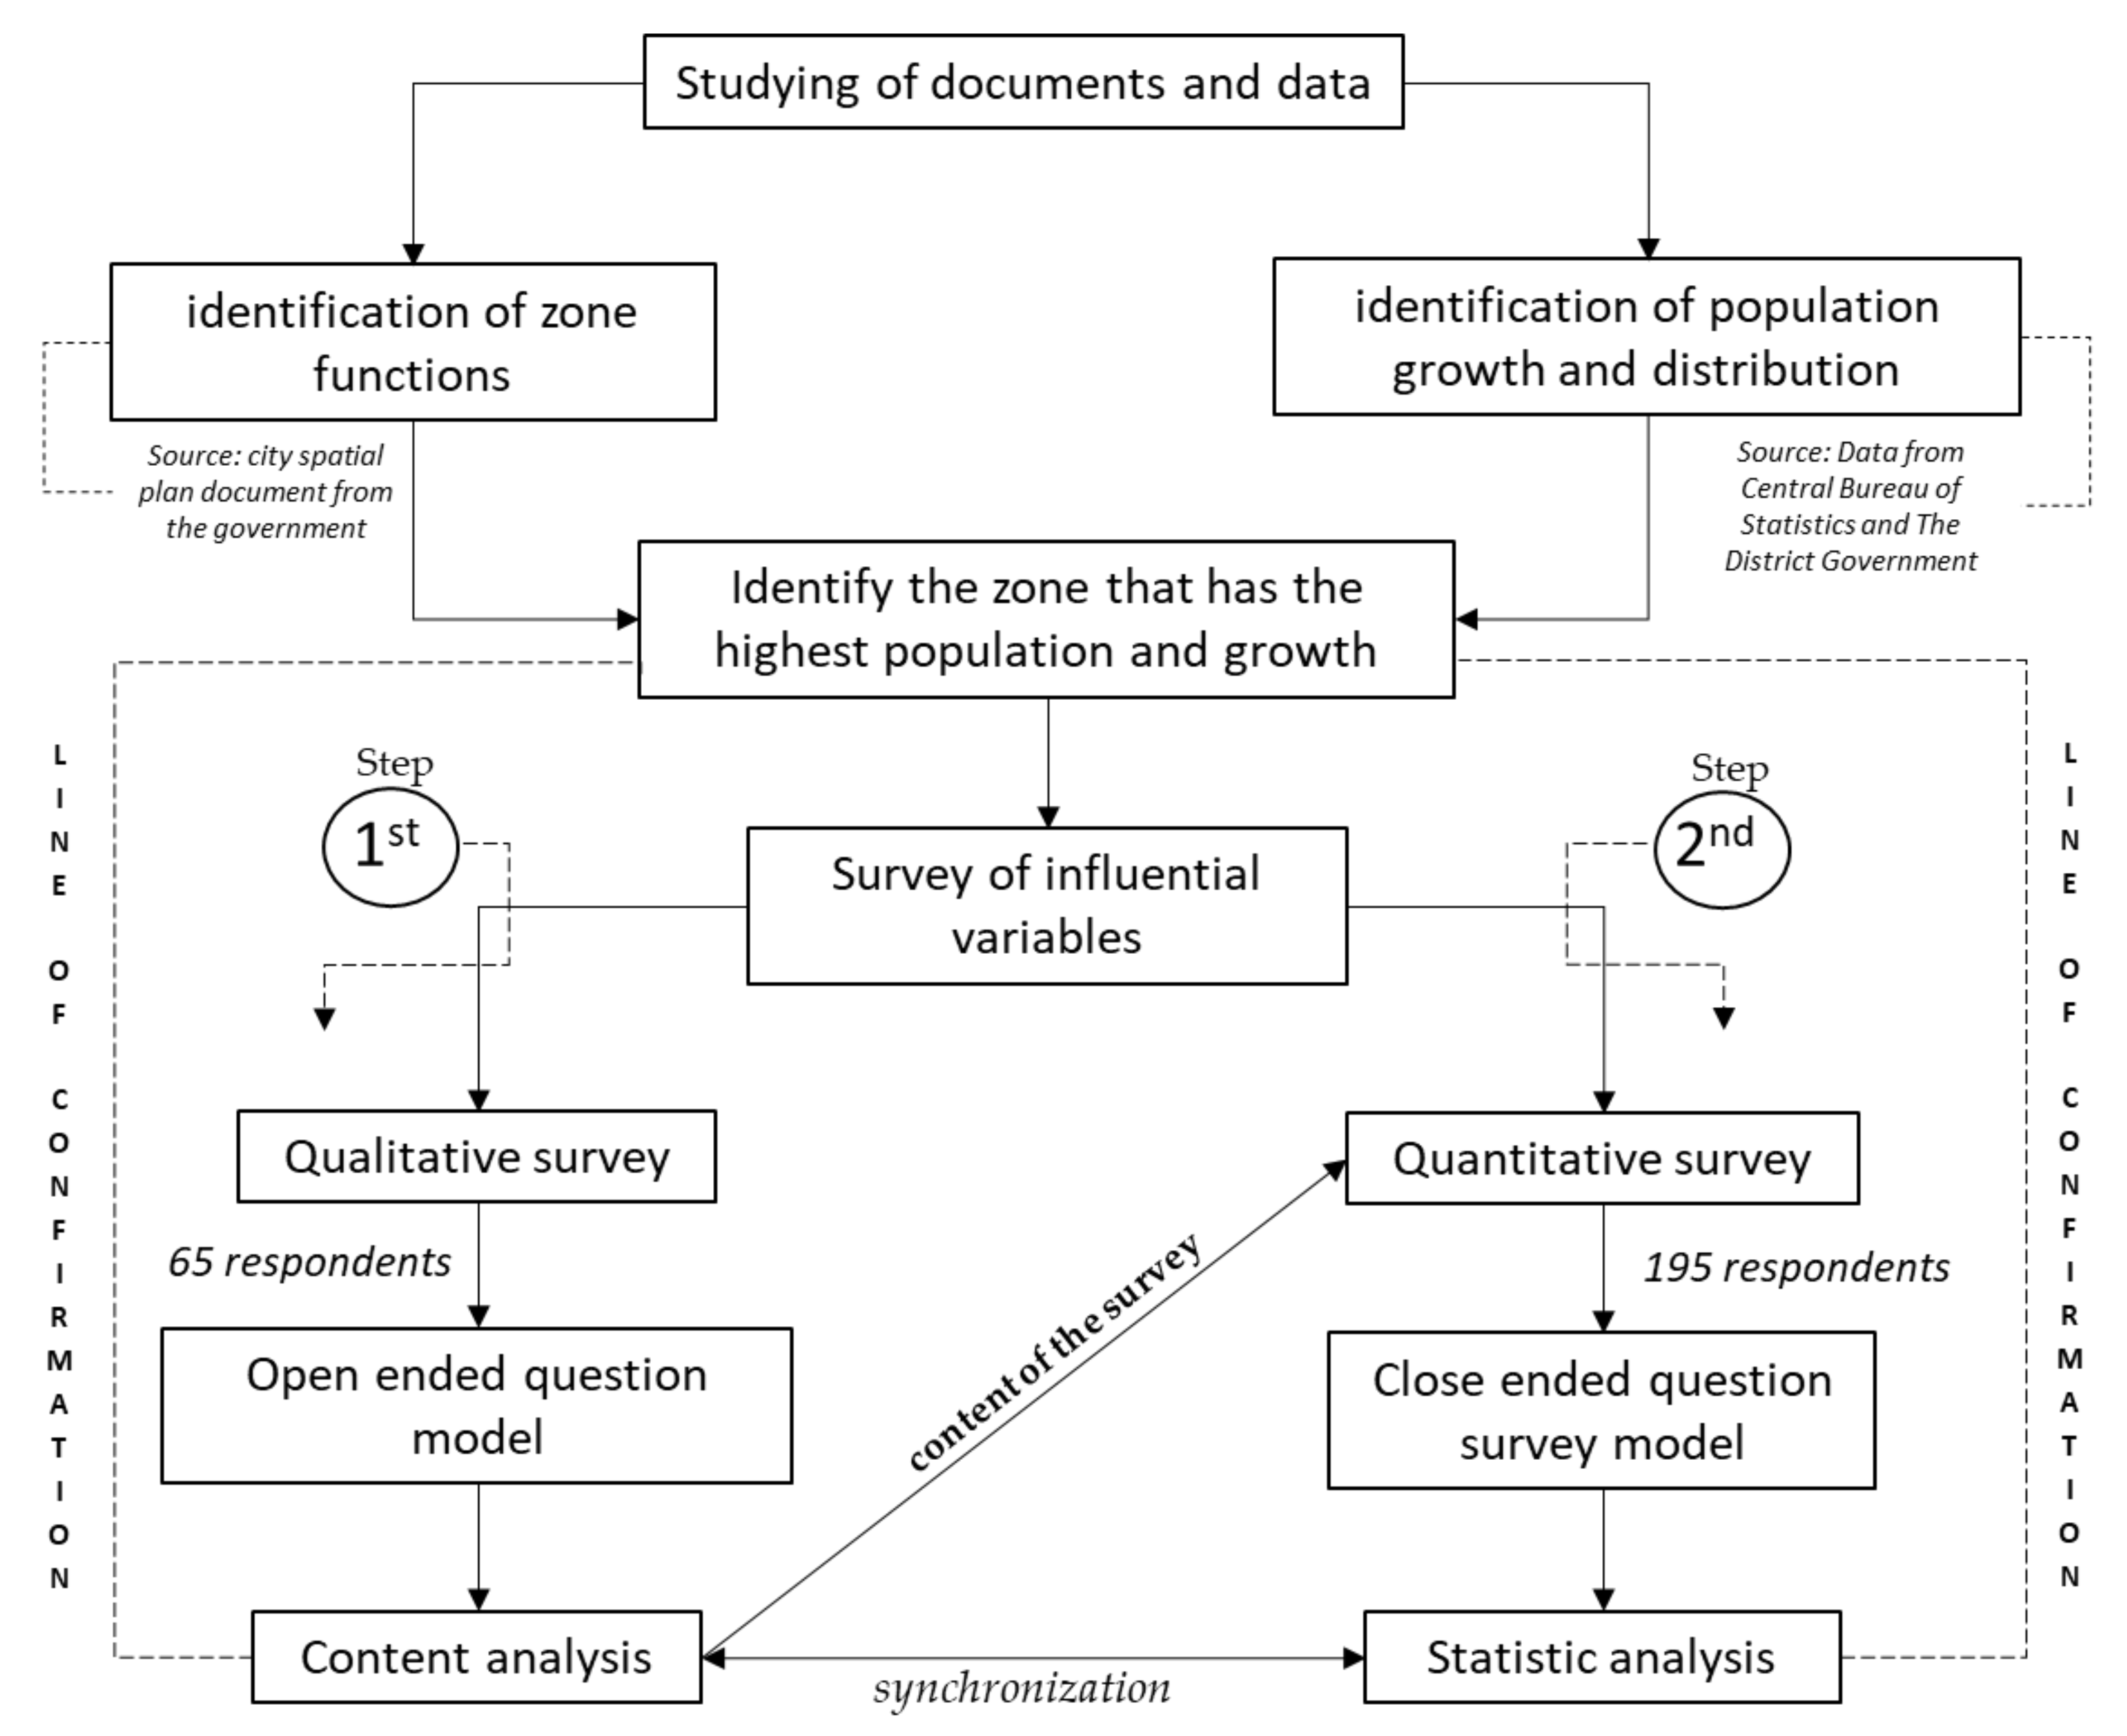
Figure 3.
Zoning map and function of each zone.

Figure 4.
Population in each zone (2004–2011).

Figure 5.
Population in each zone (2004 and 2011).

Figure 6.
Growth of population in each zone.
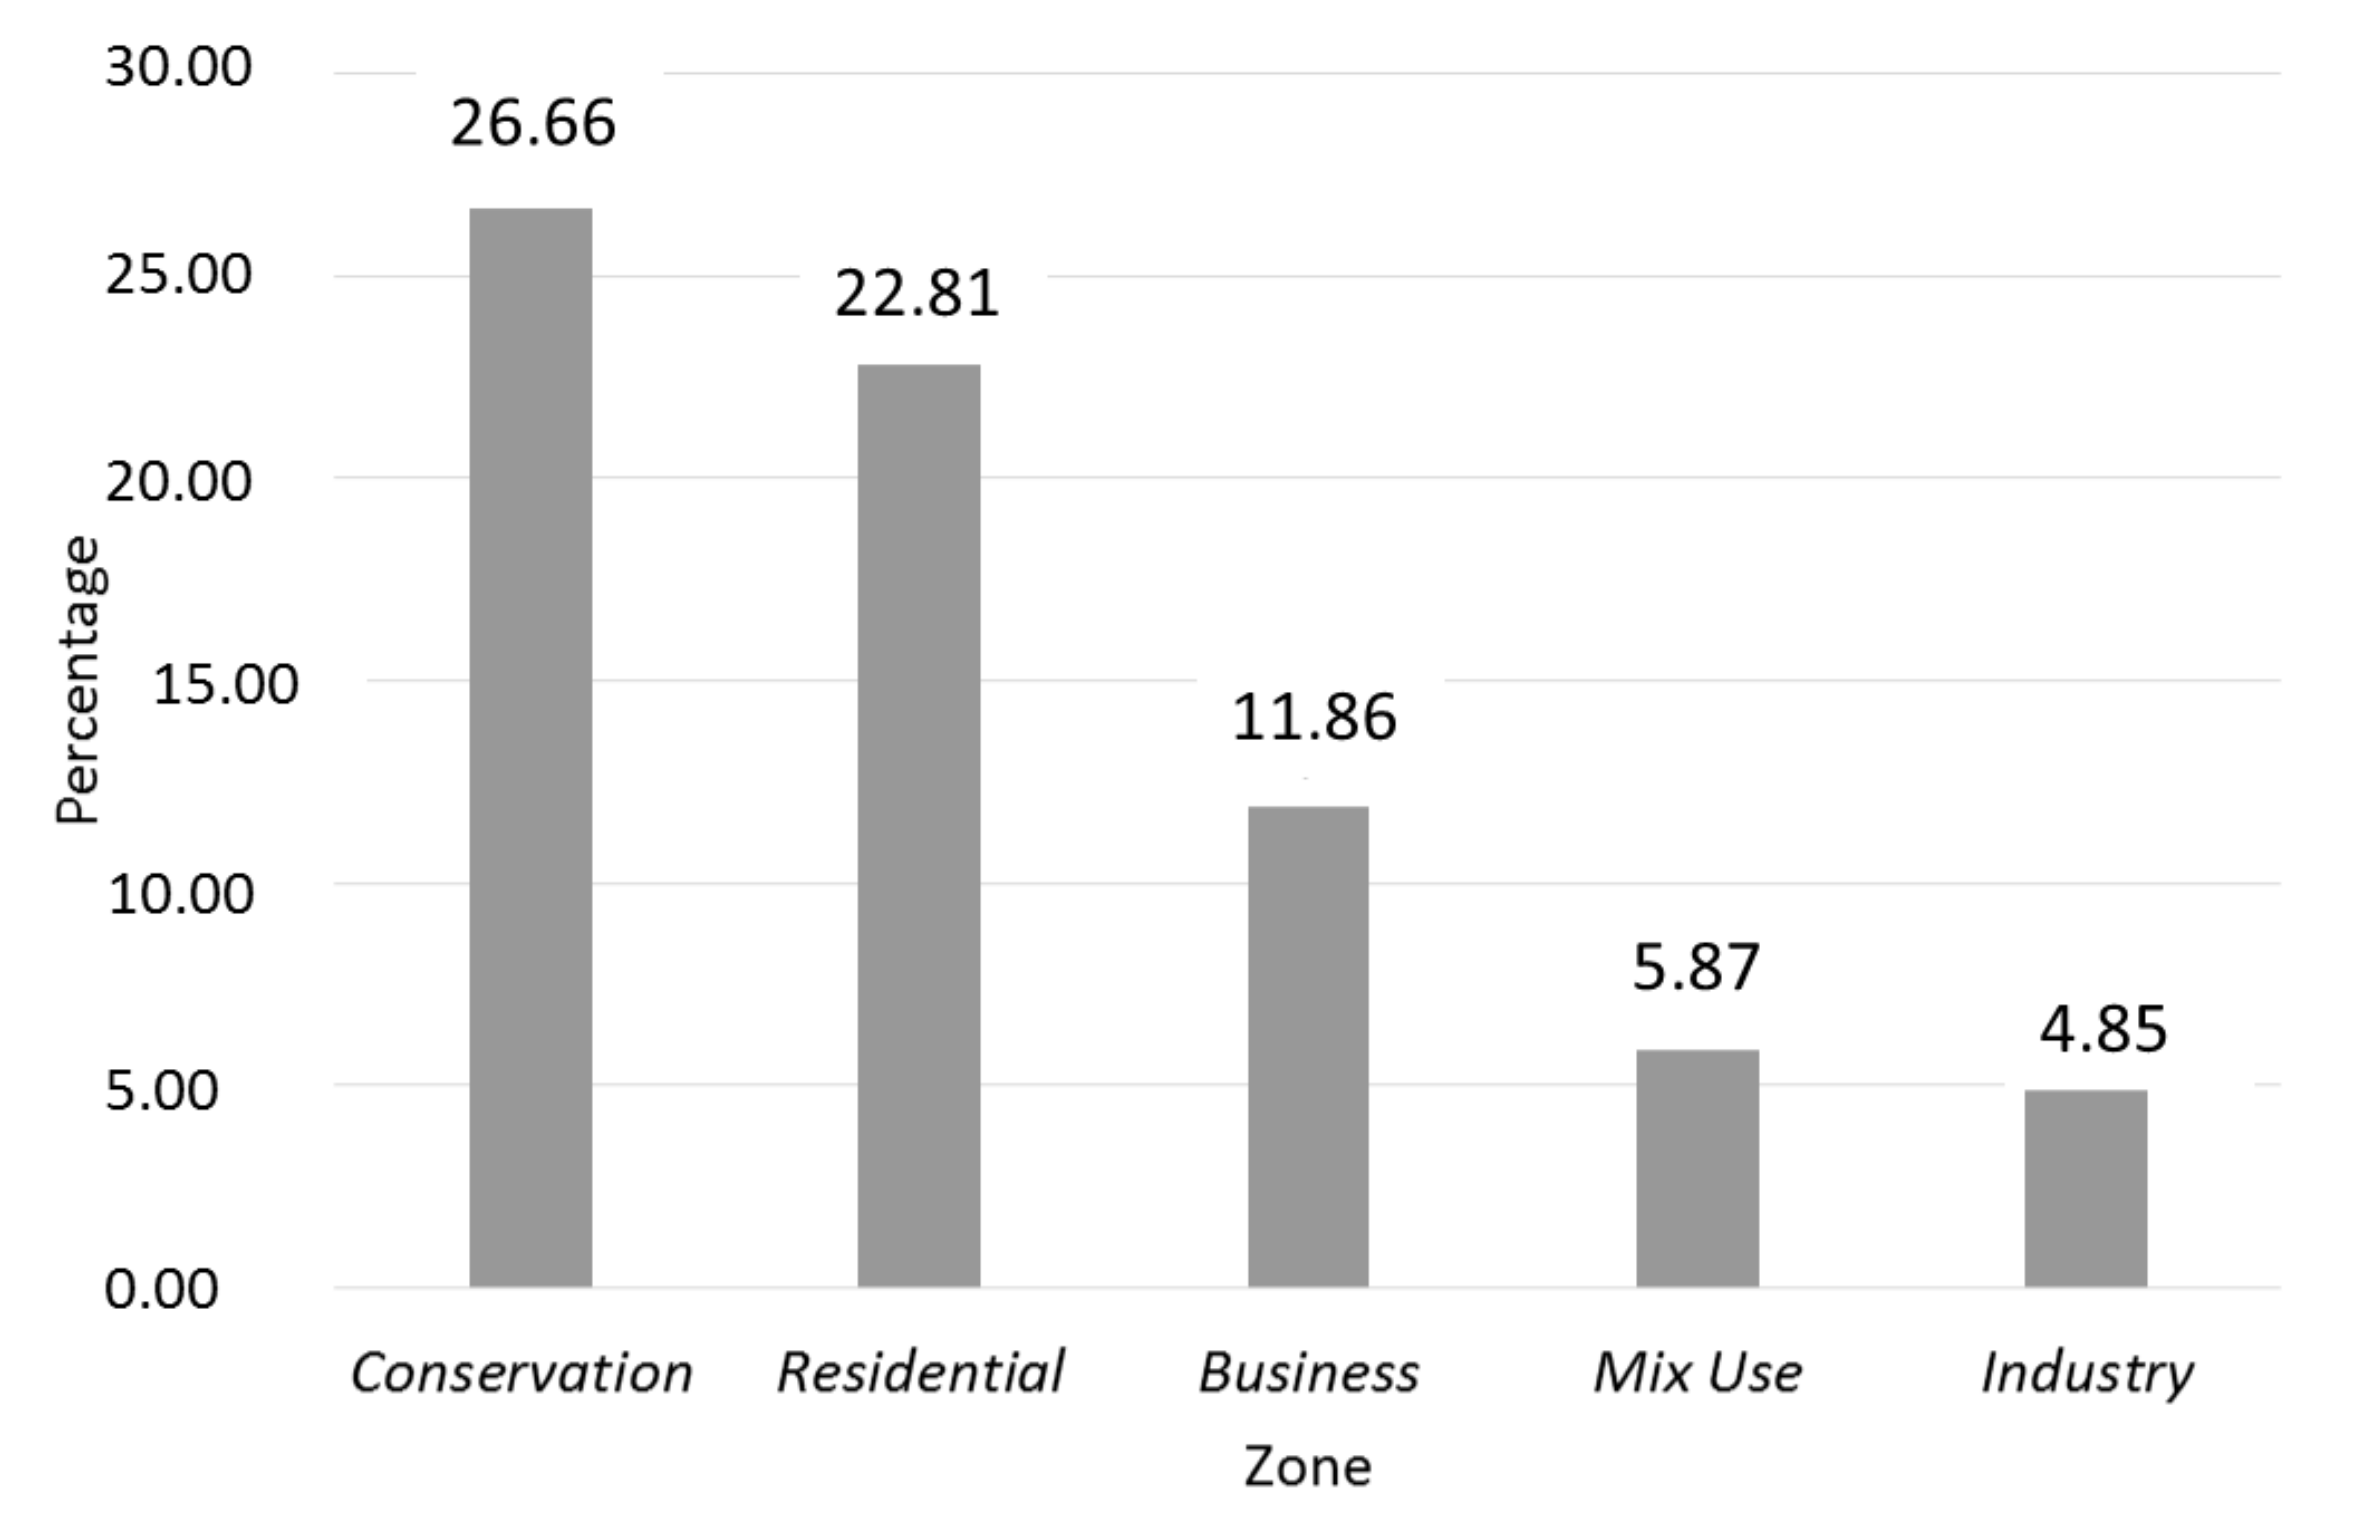
Figure 7.
Distribution of population growth.

Figure 8.
Respondents’ answers about factors affecting them living in conservation zones (65 respondents).
Figure 8.
Respondents’ answers about factors affecting them living in conservation zones (65 respondents).

Figure 9.
Groups and trends of respondents’ answers (%).

Figure 10.
Scatterplot Matrix and nonparametric correlation analysis results.

Table 1.
Zone function and group.
| Zone Function (After Grouping) | Districts | Zones Grouping |
|---|---|---|
| Mix Use | Kedaton, Rajabasa, Tanjung Senang, Teluk Betung Barat, Teluk Betung Selatan, Teluk Betung Utara | A, H |
| Residential | Sukarame | B |
| Industry | Panjang | C |
| Business | Tanjung Karang Timur, Sukabumi, Tanjung Karang Pusat | D, E |
| Conservation | Tanjung Karang Barat, Kemiling | F, G |
Table 2.
Grouping of qualitative answers as an advanced survey material.
| Points of Answers | Response Amount | Total Answers | Grouping |
|---|---|---|---|
| buying a vacant lot to build a house | 4 | 34 | Purchase |
| buying land and houses | 3 | ||
| the price of the land is cheap | 2 | ||
| House prices here are cheap. Built by developers | 9 | ||
| there is a house that can be in possession credit | 8 | ||
| get the land here | 2 | ||
| get land and house here | 2 | ||
| Some are over credit, cheap, so I buy it | 4 | ||
| the land is still wide | 6 | 6 | Wide land |
| Here, the air is fresh | 5 | 21 | Environment |
| the environment is still nice and beautiful | 5 | ||
| away from the hubbub of the city | 7 | ||
| the atmosphere here is calm | 4 | ||
| It has been living here long ago | 3 | 4 | Native inhabitants |
| get inherited land here | 1 |
Table 3.
Analytical description.
| Column | N | Mean | Std Dev | Sum | Minimum | Maximum |
|---|---|---|---|---|---|---|
| Purchase | 195 | 3.6974 | 0.6056 | 721,000 | 2.0000 | 4.0000 |
| Environment | 3.1949 | 0.3971 | 623,000 | 3.0000 | 4.0000 | |
| Wide land | 2.3077 | 0.4627 | 450,000 | 2.0000 | 3.0000 | |
| Native inhabitants | 1.1077 | 0.3108 | 216,000 | 1.0000 | 2.0000 | |
| Count | 10.3077 | 0.8297 | 2010,000 | 8.0000 | 12.0000 |
© 2018 by the authors. Licensee MDPI, Basel, Switzerland. This article is an open access article distributed under the terms and conditions of the Creative Commons Attribution (CC BY) license (http://creativecommons.org/licenses/by/4.0/).
Share and Cite
MDPI and ACS Style
Malik, I.B.I.; Dewancker, B.J. Identification of Population Growth and Distribution, Based on Urban Zone Functions. Sustainability 2018, 10, 930. https://doi.org/10.3390/su10040930
AMA Style
Malik IBI, Dewancker BJ. Identification of Population Growth and Distribution, Based on Urban Zone Functions. Sustainability. 2018; 10(4):930. https://doi.org/10.3390/su10040930
Chicago/Turabian StyleMalik, Ida Bagus Ilham, and Bart Julien Dewancker. 2018. "Identification of Population Growth and Distribution, Based on Urban Zone Functions" Sustainability 10, no. 4: 930. https://doi.org/10.3390/su10040930
Note that from the first issue of 2016, this journal uses article numbers instead of page numbers. See further details here.