Article

Quantifying and Monetizing Renewable Energy Resiliency

1
National Renewable Energy Laboratory, 15013 Denver West Parkway, Golden, CO 80401, USA
2
Sustainable CUNY, The City University of New York, 205 East 42nd Street, New York, NY 10017, USA
3
KatRisk LLC, 2397 Shattuck Ave., Suite 212, Berkeley, CA 94704, USA
*
Author to whom correspondence should be addressed.
Sustainability 2018, 10(4), 933; https://doi.org/10.3390/su10040933
Submission received: 20 February 2018 / Revised: 20 March 2018 / Accepted: 21 March 2018 / Published: 23 March 2018
(This article belongs to the Special Issue Energy Security and Sustainability)

Abstract

:
Energy resiliency has been thrust to the forefront by recent severe weather events and natural disasters. Billions of dollars are lost each year due to power outages. This article highlights the unique value renewable energy hybrid systems (REHS), comprised of solar, energy storage, and generators, provide in increasing resiliency. We present a methodology to quantify the amount and value of resiliency provided by REHS, and ways to monetize this resiliency value through insurance premium discounts. A case study of buildings in New York City demonstrates how implementing REHS in place of traditional backup diesel generators can double the amount of outage survivability, with an added value of $781,200. For a Superstorm Sandy type event, results indicate that insurance premium reductions could support up to 4% of the capital cost of REHS, and the potential exists to prevent up to $2.5 billion in business interruption losses with increased REHS deployment.

Graphical Abstract

1. Introduction

Electricity system resiliency focuses on preventing power disruption and restoring electricity supply as quickly as possible when an outage does occur, while mitigating the consequences of the outage. Resiliency in energy services has always been a top priority, especially for critical or high-value facilities, such as emergency response centers, hospitals, and shelters. Currently, facilities owners rely upon diesel or gas-powered generators for the majority of emergency power needs, however, in dense urban areas, like New York City, there are significant barriers to generators, such as stringent codes and noise and environmental concerns. In addition, fuel supply interruptions for generators, experienced during Hurricane Sandy, now have emergency planners looking to renewable energy and other forms of distributed generation to play a larger role in energy resiliency [1].
The number and cost of disasters is increasing. In the first nine months of 2017, the US experienced a record number of weather and natural disasters (15) in which the overall damages exceeded $1 billion [2]. Based on National Oceanic and Atmospheric Administration (NOAA) data, there have been, on average, six disasters that exceed $1 billion dollars per year since 1980. These types of disasters cause widespread, long-duration outages and lead to lost production, wages, and inventory. Existing approaches to energy resiliency are insufficient to mitigate the damages caused by these outages. Current approaches are vulnerable to failure of unreliable, scarce equipment; interruptions in natural gas and diesel fuel supply chains; as well as aging infrastructure [3,4,5,6]. The current cornerstone of resiliency, fossil fuel backup generation, is useful for riding out short outages, but for longer outages these systems are vulnerable to refueling supply chains that can be, and have been, compromised due to physical damage of transportation and distribution infrastructure.
While research is still in the early stages, there is a growing body of literature regarding the resiliency impacts of renewable energy resources (both utility-scale and distributed). At a macro level, research has focused on both the challenges associated with fluctuations resulting from intermittent renewable energy sources [7], as well as the benefits associated with the more distributed nature of renewable generation relative to conventional baseload plants [8,9,10]. At the distribution level, ongoing research and regulatory efforts are exploring the potential for strategically placed distributed renewable energy resources to help prevent or reduce the impacts of resilience events [4,11,12,13,14,15,16].
Renewable energy hybrid systems (REHS) can serve as an alternative or supplement to existing forms of backup power, extending limited fuel supplies and providing greater system redundancy. A REHS can sustain longer outages for a given amount of diesel fuel by reducing the runtime (and, therefore, fuel consumption) of the diesel generator, thus increasing the energy resiliency of the site [17]. A REHS can also extend the scale of backup power available by extending backup power to loads that otherwise would not be powered [18,19]. Furthermore, these REHS can be operated for economic gain when the grid is functional by offsetting bulk energy purchases, reducing peak demand charges, performing energy arbitrage, and providing ancillary services.
In this work, we seek to quantify the magnitude and value of energy resilience provided by REHS at the building and campus scale. We define the magnitude of resilience provided by REHS as the amount of time that the critical load is served during a grid outage. The value of the resilience is defined as the economic value of serving the critical load. This work focuses on the magnitude and value of the resilience provided by REHS as compared to traditional diesel-only back-up systems.
Quantifying the resilience of an energy system is a nebulous task. Several approaches have been developed in which metrics are generated to quantify resilience, including the Resilience Analysis Process [16] and a matrix format for quantifying energy resilience [20]. As a result, many metrics have been proposed in the literature [21,22], but there are currently no generally agreed upon resilience metrics that are used widely today [12,15,16,21,23,24]. Such metrics can best be described as considering resilience from the perspective of the macro-grid, or a top-down approach to energy resilience that has been specifically designed for use at the utility level [22].
Our work takes a bottom-up approach to quantifying resilience: namely, identifying the magnitude of resilience that REHS can provide in the event of a grid outage. No consistent method for quantifying the magnitude of resilience has yet surfaced. Rieger [25] defines resilience as the integral-area below a performance curve and above a certain resilience performance-threshold, over time and during a disturbance to the optimal operation of the system. For the purposes of this work, a REHS is defined as resilient if it can meet the critical load of a facility and the quantity of resilience provided by a REHS is the amount of time that the system can sustain the critical load. Similar methodologies have been proposed and used in previous studies that assessed the value of resiliency, albeit through different analytical approaches and for different types of systems [18,19,26,27].
Much of the work surrounding the value of resilience in the context of surviving electric grid outages has centered around the concept of the Value of Lost Load (VoLL) [28,29,30,31,32,33]. The difficulty of determining the VoLL lies in the fact that it is endogenous to the electricity consumer [34]. In fact, the most effective method of determining VoLL is through customer surveys [35], which attempt to capture the direct costs that customers experience as a result of lost load. There are multiple limitations to customer surveys: VoLL is endogenous to the electricity customer [34], it can vary widely depending on context (e.g., timing and duration of outage, season, and region or location), [27] and analysis of VoLL for outages lasting longer than 12 h is limited [15,29,36]. Moreover, customer surveys (and reliability metrics in general) are not sufficient for capturing the system-wide costs and consequences of resiliency events, which often include indirect spillover effects to the greater economy [12,23,36].
Despite these shortcomings and in the absence of universally agreed upon resilience metrics, VoLL provides useful (albeit conservative) insights into the financial benefits associated with resilience improvements that increase the quantity of resilience (as previously defined) [12,15,23,35,36]. Often, VoLL is defined as a static $/kWh, such that one could multiply VoLL times the integral of the lost load to determine the total cost of a disturbance. VoLL typically ranges from $10–300/kWh [29] and can vary with the duration of an outage. For the case study used in this analysis, we assumed a VoLL equal to $100/kWh. The value of resilience provided by the REHS is then equal to the reduction in the cost of disturbance, calculated as the VoLL multiplied by the energy served during the outage.
While this methodology provides an estimate of the value of resiliency provided by REHS, there are currently few options for monetizing this value. Some utility programs are attempting to access avenues for monetizing resiliency, but these programs are isolated and mostly in a pilot-phase. Examples include the Con Edison Virtual Power Plant Initiative [37] and the Green Mountain Power Powerwall program [38]. There are three industries which most readily lend themselves to the concept of monetizing the value of energy resiliency: banking, government, and insurance. For example, banks may offer lower mortgage rates if their borrowers’ investment is less likely to be damaged or inoperable in a disaster; governments may incentivize resiliency investments to avoid future recovery expenses; and insurance companies may offer lower insurance premiums for resiliency investments that could reduce future claims. Our work focuses on the insurance industry because it is a leader in risk management policies and concepts, and there is precedence in the industry for offering a premium reduction or upfront incentive in exchange for lower risk [39,40].

2. Materials and Methods

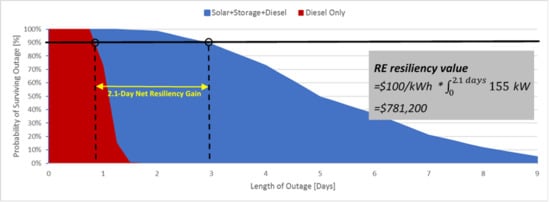
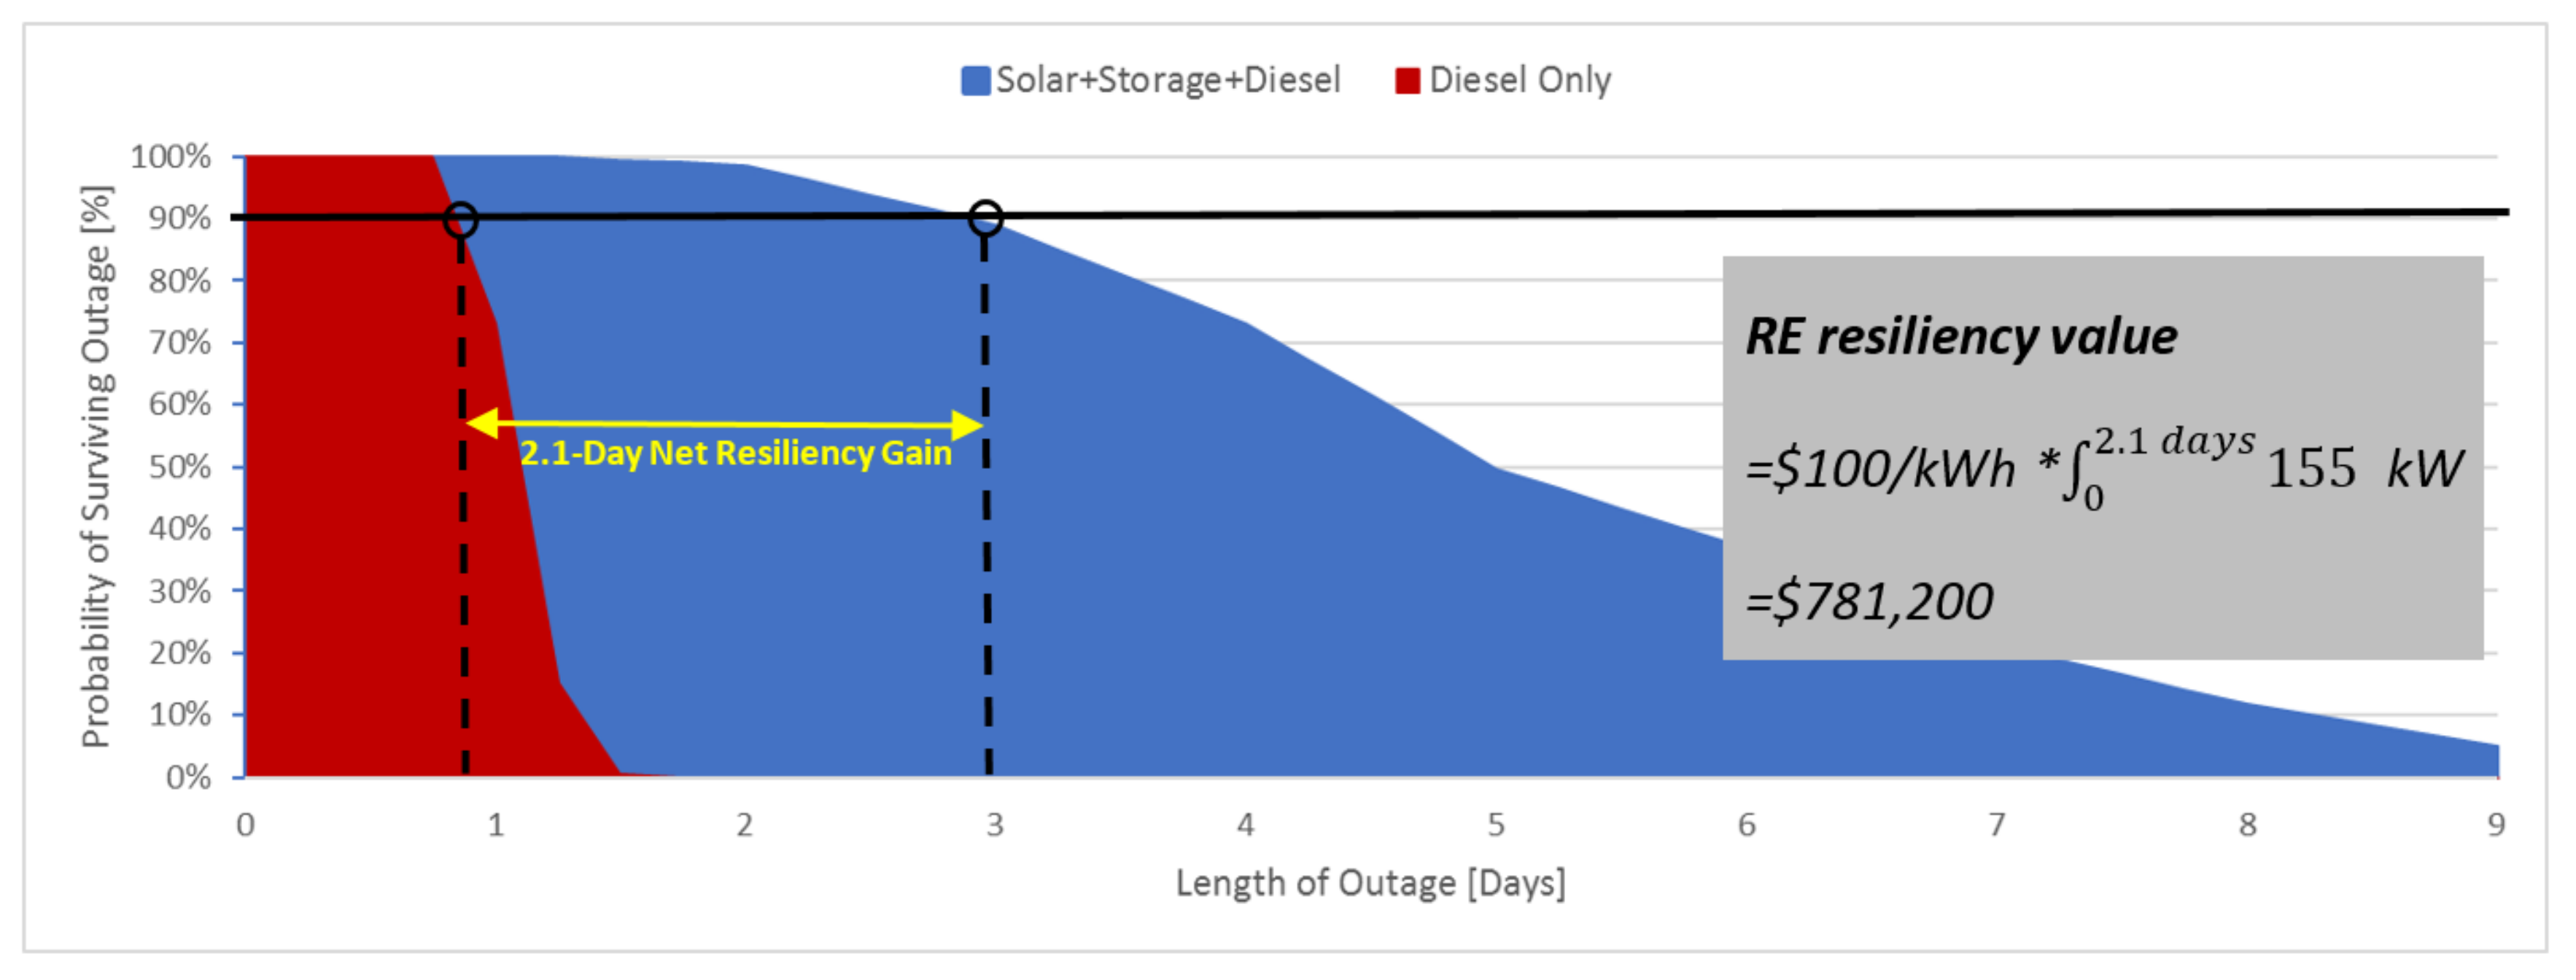
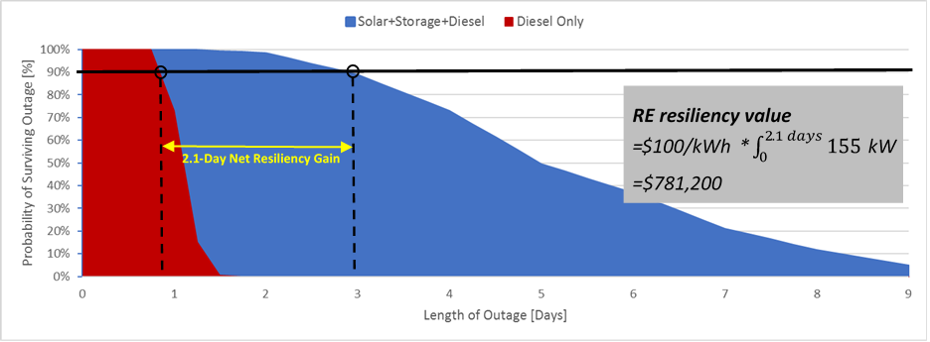
2.1. Estimating the Value of Resiliency from REHS

While backup generators are typically only used when the grid is down, REHS can be used while grid-connected to reduce energy costs, mitigate demand charges, and capture value from ancillary services, and capacity markets. These grid-connected benefits of REHS are well defined. However, little work has been done to quantify the value of resiliency provided by REHS during grid outages, as well as how that value compares to the value provided by traditional backup generation systems. We use the term outage survivability to refer to the probability that a site can supply energy to the critical loads for a specified outage given a certain set of energy assets. Survivability is defined as a probability because the ability to survive an outage of a given duration depends on when that outage occurs during the day/year (impacting the load during the outage), and—for sites with RE systems—the concurrent RE resources. With a traditional generator and a fixed amount of fuel onsite, outage survivability varies as a function of the outage duration, with survivability quickly dropping as the fuel supply is exhausted. For a REHS, the outage survivability is sustained for longer outages due to the ability of the RE systems to offset some of the generator fuel consumption.
To determine the increased energy resilience provided by RE, the outage survivability is calculated first with only the existing diesel or gas backup generators and fixed fuel supply. The outage survivability is then calculated again with the hybrid RE/storage system included in the simulations (along with any existing diesel or natural gas backup generators). The increase in outage survivability is attributable to the REHS.
For this analysis, we used NREL’s Renewable Energy Optimization (REopt) model to estimate the magnitude of resiliency provided by REHS (for a detailed derivation of the REopt model, see [41]). At a high level, the objective function in REopt is to minimize the lifecycle cost of energy while requiring that the load be met at every time step with a combination of utility purchases and/or distributed energy resources. If the lifecycle cost cannot be reduced by purchasing and operating a distributed energy system, then the minimum cost solution will be to meet the load entirely with electricity purchased from the utility.
The first step is to determine the REHS that provides the minimum lifecycle cost, where the lifecycle cost consists of electricity purchased from the utility, including energy and demand charges, as well as capital, operating, and maintenance costs. The assumed economic parameters are summarized in Table 1 [42,43] and detailed in the screenshots shown in Figure 1. The screenshots in Figure 1 are from a free, online version of REopt, which provides a subset of the capabilities contained in the in-house, desktop version of REopt (as detailed in [41]). For this study, the abilities to model a diesel generator and stochastic outages in the desktop version of REopt were used. The online tool can be found at www.reopt.nrel.gov/tool.
After determining the minimum lifecycle cost REHS, we use REopt again to determine the probability of surviving an outage as a function of outage duration. However, rather than using REopt to determine the minimum cost system, we constrain the system capacities to match the cost-optimal capacities and perform a series of stochastic outage simulations by not allowing the grid to meet the site load during outage periods.
In determining the probability of surviving outages, random grid failures are injected into the REopt model; the outage can occur in any hour in the year, and the outage duration can take any value. For the case-study presented here, 10,000 simulations of outages ranging from 1–9 days in length are modeled for the solar, storage, and diesel systems. In each simulation the model will either fail to have sufficient resources to meet the critical load, or it will be able to meet the critical load. For the diesel-only system, 4096 simulations of outages ranging from 1–48 h in length are modeled and the results are binned by six-hour blocks. We assume diesel fuel supplies to the site have been compromised and fuel deliveries are not being made during the outage.
Following the outage simulations, the results are binned based on the outage duration by 24-h blocks (or six-hour blocks for the diesel-only system), and the probability of surviving a certain outage duration is determined as:
p = N s u r v i v e d N s i m u l a t e d
where:
  • p = probability of survival;
  • Nsurvived = number of simulated outages that the REHS or diesel generator can meet the critical load; and
  • Nsimulated = total number of outages simulated for the given outage duration bin.
In addition to extending the amount of time that a traditional diesel generator can serve a critical load, REHS provide additional part-time resiliency once fossil fuel supplies are exhausted or unavailable. If the solar resource is adequate, a site can continue to operate some loads during daytime hours using just the solar and battery. We estimate the part-time resiliency as the portion of RE generation that is coincident with load, plus the amount of generation that can be time-shifted with storage to align with load, per day:
R E c o i n c + min ( R E n o n c o i n c , S k W h )
where:
  • REcoinc = kWh/day of RE generated coincident with demand;
  • REnon-coinc = kWh/day of RE generated not coincident with demand; and
  • SkWh = kWh size of storage (assuming storage inverter (kW) is ≥critical load).
Having estimated the value of resiliency provided by RE, we now examine options for monetizing this value, focusing on opportunities for reducing insurance premiums in buildings in New York City.

2.2. Monetizing the Value of Resiliency

In the aftermath of Superstorm Sandy, a majority of the buildings south of 42nd Street in Manhattan were without power for days or weeks [44]. Using New York City’s property valuation census data for all 16,973 buildings in that area, we worked with a catastrophe modeling firm to: (a) understand how REHS can reduce expected insurance claims in the event of a power outage at both an individual building and (b) determine how such expected loss reductions can be reflected in the pricing and underwriting of insurance premiums.
We researched three types of insurance coverage that might be affected by power outages and the presence of REHS: property, contents, and business interruption. The first two types of coverage, property and contents, cover the losses associated with the physical damage or loss of use of the real estate property or removable contents within the property. Business interruption policies provide coverage to policyholders for the losses associated with a disruption to their ongoing business operations. Based on the existing literature and a survey with insurance industry decision makers, we concluded that business interruptions (BI) would be most positively impacted by the sustained presence of emergency power. If further research determines that emergency power would be sufficient to power sump pumps or other equipment that mitigates the damage to the physical building; property and contents policies may also provide opportunities to monetize resiliency.
We focused our analysis on buildings south of 42nd Street in New York City (see Figure 2). Statistics for these buildings were gathered from data.ny.gov, which provides values for street address, building width and depth, market value, building class, number of stories in building, and detailed zone description (building use type) [45]. The data was obtained from the Condensed Assessed Value Roll created 2 September 2011. A manual scrubbing of the data was performed to account for multiple tenants residing within the same address. ArcMap from ArcGIS developed by Esri (Redlands, CA, USA) was used to geocode each property parcel. Property assessment data was acquired from the New York City Department of Finance 2010 census. As data was defined by building owner in the dataset, market values were summarized by building address to assess the complete value of each building. Building size was estimated using the data provided by the Department of Finance in building width and depth to compute area, and number of stories to calculate height and volume of the building [46].
Once equipped with data regarding the portfolio of 16,973 buildings, including information about each parcel’s value, address, zoning/use type, and size, a catastrophe simulation was performed with a focus on storm surge and wind damages.
First, using the building statistics, we calculated the exposure of the insurance industry within the portfolio of buildings to risks associated with power loss, setting a high-water mark if there should be a total loss event. We then conducted a 500,000-year catastrophe modeling simulation (i.e., running a five-year simulation under 10 different scenarios 10,000 times) to assess the Average Annual Loss (AAL) across the portfolio of buildings, which gauges the expected loss per year, averaged over the 500,000-year simulation, at both an individual building and portfolio-wide level. Given that insurers use both AAL and exposure to calculate premium, these two figures set the parameters for both how REHS can reduce expected losses and how such expected loss reductions can lead to premium discounts.
While various authors and organizations have attempted to quantify the cost of disruptions to the U.S. economy generally [47], and even to the insurance industry specifically, none have specifically sought to quantify the business interruption exposure attributable to power loss. Therefore, we had to pair the hard, non-proprietary data that could be reasonably attained from public records with the assumptions listed below.
Business interruption (BI) insurance coverage plans correlate well with energy disruption concerns because BI plans are designed to compensate policyholders for losses that occur because of their inability to carry out ordinary business operations. Unlike other types of insurance coverage, business interruption insurance policies are highly individualized and require an underwriter to investigate the nature of the policyholder’s business (which might range from the manufacturing of widgets to a commercial landlord), cash flows, and exposures to idiosyncratic risks. To gauge the size of the business interruption market within the portfolio, we assumed that for each building in the portfolio, a business interruption policy was issued with a 30-day limit as the upper bound on the claim size and a 72-h deductible before the claim is triggered.
Relatedly, given a lack of information about the number and distribution of active business interruption policies within the portfolio of buildings analyzed, we assumed the presence of a business interruption policy at all parcels in the portfolio. At this stage, it is virtually impossible to determine the precise number of policies issued within the portfolio. It is likely that there are fewer than 16,973 policies; this might decrease the overall AAL within the portfolio, but given that the overall AAL was determined by using the full dataset and was then divided into all 16,973 parcels identified, the AAL for each insured parcel would remain the same on average.
The value of all the buildings in the data set, as of 2010, was $136.4 billion. As 2010 was near the nadir of the New York City real estate market, and since then, average real estate values have doubled in Manhattan, we doubled these value estimates. Using this figure as a baseline we assumed that (a) the value of each buildings contents was 40% of the total value of the building; and (b) the total BI exposure of each building was 20% of total value of the building (these figures are based on industry feedback and KatRisk’s historical experience). From this we arrived at: (a) total building value of $272.9 billion; (b) total contents value of $109.1 billion; (c) total BI value of $54.6 billion; and (d) an overall value exposure of $436.6 billion [48]. Another way of stating these figures is that the total value of the buildings (excluding the value of the land), the contents, and the cost of 30 days of lost business operations (less the first 72 h of interruption) is $436.6 billion. These values were used as the input to the catastrophe model to set an upper bound on the amount of insurance exposure.
Using the REopt platform, an analysis of the economic case for REHS was performed using the new revenue that is available from BI premium reduction in the study neighborhood. To run the economic case associated with these systems, a prototypical case was created using the Con Edison SC-9 rate 1 tariff (commercial standard), which has a seasonal demand charge of $21.82/kW in the summer months, and $17.22/kW October through May; and an energy charge of approximately 6.3 cents/kWh (https://openei.org/apps/USURDB/rate/view/539f6bbdec4f024411eca0df). Using seasonal average load profiles for SC-9 subscribers, a representative load profile was selected from the commercial reference building dataset [49]. System performance requirements were then entered as constraints that the REopt solutions were required to meet. We estimated that the vast majority of claim payouts would happen because of eight or less days of outage, and defined system performance requirements to achieve survivability for different fractions of this. Given that the time deductible for BI is typically 72 h, the number of days that the load was required to be supported was four days or more in all cases to ensure that there is reduction in exposure to the insurance industry that could justify reduced premiums. The following technical requirements were developed for the various targets for reducing expected business interruption losses: 10%, 25%, 50%, and 95% (see Table 2).

3. Results

3.1. Value of Resiliency

The example in this paper uses a building in New York City as a case study to demonstrate the concepts that are discussed. The RE and storage systems are sized for maximum economic gain under grid-connected operation, where the RE system can offset grid purchases of electricity, reduce peak demand charges, and/or engage in energy arbitrage. The typical load is 500 kW on average, and the critical load is 30% of the typical load (155 kW on average). The load is modeled using DOE’s commercial reference building hospital model.
Using the REopt model to minimize the lifecycle cost of electricity, along with the economic assumptions in Table 1, it was found that integrating a 1287-kW DC solar system and a 214 kW, 1557 kWh storage system with the existing 500 kW of diesel generators (with 250 gallons of fuel storage) provided $1,737,800 of grid-connected savings over the project lifecycle of 25 years. Furthermore, using the methods described in Section 2, it was found that the solar and storage system extended the amount of time that the site could survive an outage by 2.1 days (from 0.9 days with diesel-only to 3.0 days) with a 90% probability. The capital cost to implement this solution was estimated to be $5,588,420. The lifecycle cost of energy for the site was found to be $18,842,600.
For this case study, the VoLL is estimated as $100/kWh. The additional critical load, Lc, served during the outage period T (averaging 155 kW for 2.1 days), multiplied by the VoLL, is the Value of Resiliency (VoR):
VoR = VoLL   0 T L c ( t ) d t
The Value of Resiliency provided by the REHS (in excess of the baseline generator only solution) calculated using the methodology above is $781,200. This equates to 14% of the system capital cost. This value would reduce the life cycle cost of the system by 4%. If this value could be monetized, it would increase the net present value of the system by 45%.
Figure 3 shows the number of days of an outage that using diesel generators only (shown in red) can sustain the load, compared to the REHS (shown in blue) for an example site. With a fixed fuel supply, the diesel generator can power 90% of simulated outages less than one day in length, but few longer outages. When the generator is combined with the REHS, 90% of outages three days in length can be sustained. The REHS effectively triples the amount of time the site can survive an outage with 90% probability.
The extra days of net resiliency gain provided by the REHS can be valued by multiplying the VoLL of $100/kWh with the additional energy served by the REHS during the outage (see Methods). At this site, the extra resiliency value would result in a 4% decrease in the system life cycle cost and 45% increase in net present value.
Extending the example above, the 1287-kW solar generates an average of 4605 kWh/day. If we assume a flat 155 kW (3720 kWh/day) critical load, on average half of the critical load (1860 kWh/day) is coincident with the load, and the remaining half of the load occurs during nighttime hours when solar is not generating. The 214 kW, 1557 kWh battery can shift 1557 kWh of the excess solar generation to nighttime hours. For this site, on average, 3417 kWh of load per day can be met indefinitely (approximately 92% of the critical load). Again, applying the VoLL of $100/kWh, the value of this long-term, part load resiliency is $341,700 per day.
This daily value can be multiplied by the outage duration to arrive at a total resiliency value. If the REHS supports the site for at least one outage-day over the 25-year project lifetime, this value would reduce the capital cost of the system by 6%, the lifecycle cost of the system by 2% and increase the net present value by 20%. In practice, the value of sustaining only part of the load may be less per kilowatt-hour than the value of sustaining the full critical load.
While this methodology provides an estimate of the value of resiliency provided by RE, not all this value can be monetized. In the next section, we quantify the potential for monetizing resiliency value through one new value stream: reduced insurance premiums.

3.2. Monetization of Resiliency

The results of the analysis showed that the total exposure for BI losses for the dataset would equate to $54.6 billion or $3.2 million per building. Using the catastrophe model to run through the possible loss scenarios, an average loss was calculated by the model to determine the total size of the opportunity for savings. The Average Annual Loss (AAL)—the expected loss per year, on this exposure would be $5 million, resulting in a premium paid for BI coverage of approximately $15 million/year or $884/building/year assuming current conditions. A sea level rise scenario was also evaluated. Using conservative estimates for sea level rise, the models showed that AAL numbers would increase to $6.8 million, resulting in a premium paid for BI coverage of $20.5 million/year or $1210/building/year. The premium paid for coverage was used as the upper bound for the amount of monetizable value that could be saved by REHS by improving resiliency [46].
We then evaluated the potential insurance premium reduction compared to other revenue streams (peak shaving, demand response, capacity payments) available to REHS, and to the overall capital cost of the system. We evaluated REHS sized to sustain varying levels of load for varying numbers of days. As shown in Table 3, the reduced premiums translate into additional revenue (between 5.8% and 9.2%) or offsetting of capital cost (between 0.5% and 4.4%) for these projects that improves the value proposition for REHS.
The impact of including the new BI premium reduction for REHS project economics is not trivial. For current conditions, the new revenue accounts for between 5.8% and 6.7% of the annual system revenue, and offsets between 0.5% and 3.2% of the total capital cost. For the sea level rise case the monetizable resiliency is even more impactful, accounting for between 8.0% and 9.2% of the annual system revenue and between 0.7% and 4.4% of the total capital cost. In some cases, this would be enough to boost a project from marginal to positive economics.

4. Discussion and Conclusions

During catastrophic storms, the opportunity for savings to the insurance industry increases greatly. Hurricane Sandy has been billed as a 700-year to 2500-year event [50]. Using the same catastrophe model that we used to generate the average annual loss number of $5 million, the single year-loss from a Sandy-type event would be $2.5 billion. Given the uncertainty of the weather patterns moving forward, another event of this magnitude could be catastrophic to the industry. REHS technologies could help to mitigate the impact of such an event.
This work demonstrates ways to quantify the amount of resiliency provided by RE and storage in REHS, place a value on that resiliency, and identified opportunities for monetizing that value. The aim of this work is to inform building owners, policy makers, insurance companies, and mortgage lenders about potential market offerings that incentivize energy resiliency and reduce energy costs.
Work is underway to expand upon the methods for quantifying and valuing energy resiliency presented herein. By quantifying and monetizing the tradeoffs in capital cost, net present value, amount of load served, hours of load served, and probability of load being served for different energy investment options, building owners will be able to make more informed decisions about resiliency investments. This work focuses specifically on REHS serving electrical loads, but the framework could be expanded to non-REHS resiliency investments (such as burying electrical lines) to allow comparison of the economic and resiliency impacts of a broader range of alternatives.
A more refined understanding of the VoLL would be useful to show how VoLL varies as a function of the fraction of load met and the number of hours that the critical load is sustained. Incorporating probabilities of outages and uncertainty around RE and generator availability into the methodology would provide a more accurate picture of the VoLL.
To fully monetize resiliency benefits, more work must be done to change how tangible price signals are communicated to the marketplace for resiliency investments. We have engaged leading insurers to increase understanding of business interruption loss causation at a granular level, which will encourage proper accounting of the risk mitigation provided by REHS. In this way, the market for contingent business interruption coverage can be expanded, as policyholders will desire the coverage and insurers will have a standardized way of assessing their risk exposure. The market for monetizing resiliency is large and the opportunities are worldwide. One large insurer, Allianz, reported the status of their BI holdings and stated that from 2010 to 2014 they paid out 1807 claims for a value of $3.03 billion (758 million/year). In comparison, this single organization holds 150 times more BI coverage than the total dataset used in this analysis [51]. The losses to the economy are much larger than the impact to the insurance industry, as the insurer Munich RE estimated that 70% of the losses caused by natural catastrophes in 2016 were uninsured [52]. This indicates that there may be many other pathways to resiliency monetization beyond the mechanisms investigated here.
This research has shown that REHS have the potential to make a step change to the amount of survivability that is provided by backup power systems and do so at a lower life cycle cost than generator-only solutions. By including VoLL in the analysis of REHS, the value proposition is greatly altered, and organizations can use VoLL to understand the risks they face due to power system interruption. Finally, by partnering with organizations that have a vested interest in lowering risk, such as banks, insurance companies, and government organizations, resiliency can be monetized and used to partially fund REHS. This is a market that must be developed further but is a worldwide multi-billion-dollar opportunity.

Acknowledgments

The authors gratefully acknowledge project advisors including Doug Arent, Robin Newmark, Andrea Watson, Eliza Hotchkiss, Adam Warren, Jerry Davis, Sam Booth, Doug Gagne, Caitlin Murphy, and Karl Kintner-Meyer of NREL. This work was funded under NREL’s Laboratory-Directed Research and Development program. This project builds on the work of Sustainable CUNY’s Smart DG Hub: Working to create a pathway to the marketplace for energy storage since 2013 with support from the U.S. Department of Energy and the State of New York.

Author Contributions

Kate Anderson led the project and wrote the value of resilience section of the article. Nicholas D. Laws conducted the literature review and developed methodologies for modeling the value of resiliency. Spencer Marr and Lars Lisell led the monetization research and wrote the monetization section of the article. Dag Lohmann conducted the catastrophe modeling. Xiangkun Li conducted the economic and resiliency modeling. Dylan Cutler developed the methodology for quantifying the resiliency provided by a REHS. Tony Jimenez conducted value of resilience research and reviewed the article. Tria Case conceived the Value of Resiliency Project, supervised the monetization of resiliency work, and edited the article.

Conflicts of Interest

The authors declare no conflict of interest. The founding sponsors had no role in the design of the study; in the collection, analyses, or interpretation of data; in the writing of the manuscript, and in the decision to publish the results.

References

  1. Olinsky-Paul, T. Solar + Energy Storage = Resilient Power in Vermont. Available online: https://www.cleanegroup.org/solar-energy-storage-resilient-power-in-vermont/ (accessed on 18 February 2018).
  2. Smith, A.B.; Katz, R.W. US billion-dollar weather and climate disasters: Data sources, trends, accuracy and biases. Nat. Hazards 2013, 67, 387–410. [Google Scholar] [CrossRef]
  3. Gibbs, L.I.; Holloway, C.F. Hurricane Sandy after Action Report and Recommendations. 2013. Available online: http://www.nyc.gov/html/recovery/downloads/pdf/sandy_aar_5.2.13.pdf (accessed on 18 February 2018).
  4. Ornstien, C. Why Do Hospital Generators Keep Failing?—ProPublica (WWW Document). 31 October 2012. Available online: https://www.propublica.org/article/why-do-hospitals-generators-keep-failing (accessed on 19 February 2018).
  5. Electric Service Reliability Reports (WWW Document). 3 October 2017. Available online: http://www3.dps.ny.gov/W/PSCWeb.nsf/All/D82A200687D96D3985257687006F39CA?OpenDocument (accessed on 19 February 2018).
  6. Office of Inspector General, Department of Homeland Security. FEMA Has No Assurance that Only Designated Recipients Received $6.37 Million in Fuel. 2 November 2015. Available online: https://www.oig.dhs.gov/assets/GrantReports/2016/OIG-16-04-D-Nov15.pdf (accessed on 18 February 2018).
  7. Mureddu, M.; Damiano, A. A statistical approach for resilience analysis of ESS deployment in RES-based power systems. In Proceedings of the 2017 IEEE 26th International Symposium on Industrial Electronics (ISIE), Edinburgh, UK, 19–21 June 2017; pp. 2069–2074. [Google Scholar]
  8. Valentine, S.V. Emerging symbiosis: Renewable energy and energy security. Renew. Sustain. Energy Rev. 2011, 15, 4572–4578. [Google Scholar] [CrossRef]
  9. Esteban, M.; Portugal-Pereira, J. Post-disaster resilience of a 100% renewable energy system in Japan. Energy 2014, 68, 756–764. [Google Scholar] [CrossRef]
  10. Cox, S.L.; Hotchkiss, E.L.; Bilello, D.E.; Watson, A.C.; Holm, A. Bridging Climate Change Resilience and Mitigation in the Electricity Sector Through Renewable Energy and Energy Efficiency: Emerging Climate Change and Development Topics for Energy Sector Transformation; No. NREL/TP-6A20-67040; National Renewable Energy Lab. (NREL): Golden, CO, USA, 2017. [Google Scholar]
  11. Qazi, S.; Young, W. Disaster relief management and resilience using photovoltaic energy. In Proceedings of the 2014 International Conference on Collaboration Technologies and Systems (CTS), Minneapolis, MN, USA, 19–23 May 2014; pp. 628–632. [Google Scholar]
  12. National Academies of Sciences, Engineering, and Medicine. Enhancing the Resilience of the Nation's Electricity System; The National Academies Press: Washington, DC, USA, 2017. [Google Scholar]
  13. McGranaghan, M.; Clearczyk, M.; Gellings, C. Enhancing Distribution Resiliency—Opportunities for Applying Innovative Technologies; EPRI: Palo Alto, CA, USA, 2013. [Google Scholar]
  14. The Integrated Grid. A Benefit-Cost Framework; EPRI: Palo Alto, CA, USA, 2015. [Google Scholar]
  15. Kintner-Meyer, M.C.W.; Homer, J.S.; Balducci, P.J.; Weimar, M.R. Valuation of Electric Power System Services and Technologies; No. PNNL-25633; Pacific Northwest National Lab. (PNNL): Richland, WA, USA, 2017. [Google Scholar]
  16. Vugrin, E.D.; Castillo, A.R.; Silva-Monroy, C.A. Resilience Metrics for the Electric Power System: A Performance-Based Approach; No. SAND-2017-1493; Sandia National Lab. (SNL-NM): Albuquerque, NM, USA, 2017. [Google Scholar]
  17. Anderson, K.; Burman, K.; Simpkins, T.; Helson, E.; Lisell, L.; Case, T. New York Solar Smart DG Hub-Resilient Solar Project: Economic and Resiliency Impact of PV and Storage on New York Critical Infrastructure; No. NREL/TP-7A40-66617; National Renewable Energy Laboratory: Golden, CO, USA, 2016. [Google Scholar]
  18. Marqusee, J.; Schultz, C.; Robyn, D. Power Begins at Home: Assured Energy for US Military Bases; Noblis: Reston, VA, USA, 2017. [Google Scholar]
  19. Judson, N.; Pina, A.L.; Dydek, E.V.; Van Broekhoven, S.B.; Castillo, A.S. Application of a Resilience Framework to Military Installations: A Methodology for Energy Resilience Business Case Decisions; Massachusetts Institute of Technology Lincoln Laboratory: Lexington, MA, USA, 2016. [Google Scholar]
  20. Roege, P.E.; Collier, Z.A.; Mancillas, J.; McDonagh, J.; Linkov, I. Metrics for energy resilience. Energy Policy 2014, 72, 249–256. [Google Scholar] [CrossRef]
  21. Willis, H.H.; Loa, K. Measuring the Resilience of Energy Distribution Systems; RAND Corporation: Santa Monica, CA, USA, 2015. [Google Scholar]
  22. Grid Modernization: Metrics Analysis (GMLC1.1); Reference Document Version 2.1; Grid Modernization Laboratory Consortium, U.S. Department of Energy: Washington DC, USA, 2017.
  23. Keogh, M.; Cody, C.; NARUC Grants & Research. Resilience in Regulated Utilities. NARUC, 2013. Available online: https://pubs.naruc.org/pub/536F07E4-2354-D714-5153-7A80198A436D (accessed on 20 March 2018).
  24. Climate Change and the Electricity Sector: Guide for Climate Change Resiliency Planning, September 2016, U.S. Department of Energy, Office of Energy Policy and Systems Analysis. Available online: https://www.energy.gov/sites/prod/files/2016/10/f33/Climate%20Change%20and%20the%20Electricity%20Sector%20Guide%20for%20Climate%20Change%20Resilience%20Planning%20September%202016_0.pdf (accessed on 20 March 2018).
  25. Rieger, C. Resilient Control Systems: Practical Metrics Basis for Defining Mission Impact. In Proceedings of the 2014 7th International Symposium on Resilient Control Systems, Denver, CO, USA, 19–21 August 2014. [Google Scholar]
  26. Industrial Economics, Inc. Assessing the Benefits and Costs of Developing a Microgrid: Model User’s Guide; Industrial Economics, Inc.: Cambridge, MA, USA, 2015. [Google Scholar]
  27. Stadler, M.; Cardoso, G.; Mashayekh, S.; Forget, T.; DeForest, N.; Agarwal, A.; Schönbein, A. Value streams in microgrids: A literature review. Appl. Energy 2016, 162, 980–989. [Google Scholar] [CrossRef]
  28. Shivakumar, A.; Welsch, M.; Taliotis, C.; Jakšić, D.; Baričević, T.; Howells, M.; Gupta, S.; Rogner, H. Valuing blackouts and lost leisure: Estimating electricity interruption costs for households across the European Union. Energy Res. Soc. Sci. 2017, 34, 39–48. [Google Scholar] [CrossRef]
  29. Schroeder, T.; Kuckshinrichs, W. Value of Lost Load: An Efficient Economic Indicator for Power Supply Security? A Literature Review. Front. Energy Res. 2015. [Google Scholar] [CrossRef] [Green Version]
  30. Coll-Mayor, D.; Pardo, J.; Perez-Donsion, M. Methodology based on the value of lost load for evaluating economical losses due to disturbances in the power quality. Energy Policy 2012, 50, 407–418. [Google Scholar] [CrossRef]
  31. De Nooij, M.; Koopans, C.; Bijvot, C. The value of supply security: The costs of power interruptions: Economic input for damage reduction and investment in networks. Energy Econ. 2007, 29, 277–295. [Google Scholar] [CrossRef]
  32. Ghajar, R.; Billinton, R. Economic costs of power interruptions: A consistent model and methodology. Int. J. Electr. Power Energy Syst. 2006, 28, 29–35. [Google Scholar] [CrossRef]
  33. Kariuki, K.K.; Allan, R.N. Evaluation of reliability worth and value of lost load. Gener. Transm. Distrib. 1996, 143, 171–180. [Google Scholar] [CrossRef]
  34. Bustos, C.; Watts, D. Novel methodology for microgrids in isolated communities: Electricity cost-coverage trade-off with 3-stage technology mix, dispatch & configuration optimizations. Appl. Energy 2017, 195, 204–221. [Google Scholar]
  35. Ratha, A.; Iggland, E.; Andersson, G. Value of Lost Load: How much is supply security worth? In Proceedings of the 2013 IEEE Power & Energy Society General, Vancouver, BC, Canada, 21–25 July 2013; pp. 1–5. [Google Scholar]
  36. Sullivan, M.J.; Schellenberg, J.A.; Blundell, M. Updated Value of Service Reliability Estimates for Electric Utility Customers in the United States; LBNL-6941E; Berkeley Lab: Berkeley, CA, USA, 2015. [Google Scholar]
  37. Con Edison. Con Edison “Virtual Power Plant” Program Combines Solar and Storage to Improve Grid Resiliency. Available online: https://www.coned.com/en/about-con-edison/media/news/20160613/virtual-power-plant (accessed on 20 March 2018).
  38. TESLA Powerwall 2. Available online: http://products.greenmountainpower.com/product/tesla-powerwall/ (accessed on 19 February 2018).
  39. Spencer, S. Out of the Dark. Available online: http://www3.ambest.com/ambv/bestnews/articlecontent.aspx?pc=1009&AltSrc=108&refnum=208627 (accessed on 20 March 2018).
  40. Spencer, S. Personal Communication; City University of New York: New York, NY, USA, 2012. [Google Scholar]
  41. Cutler, D.; Olis, D.; Elgqvist, E.; Li, X.; Laws, N.; DiOrio, N.; Walker, A.; Anderson, K. REopt: A Platform for Energy System Integration and Optimization; No. NREL/TP-7A40-70022; National Renewable Energy Laboratory: Golden, CO, USA, 2017. [Google Scholar]
  42. Hand, M.; Augustine, C.; Feldman, D.; Kurup, P.; Beiter, P.; O’Connor, P. 2017 Annual Technology Baseline (ATB): Cost and Performance Data for Electricity Generation Technologies; National Renewable Energy Laboratory: Golden, CO, USA, 2017. [Google Scholar]
  43. Lavappa, P.D.; Kneifel, J.D.; O’Rear, E.G. Energy Price Indices and Discount Factors for Life-Cycle Cost Analysis—2017; NIST Interagency/Internal Report (NISTIR) 85-3273-32; National Institute of Standards and Technology: Gaithersburg, MD, USA, 2017. [Google Scholar]
  44. Webley, K. Hurricane Sandy by the Numbers: A Superstorm’s Statistics, One Month Later. TIME.com. 26 November 2012. Available online: http://nation.time.com/2012/11/26/hurricane-sandy-one-month-later/ (accessed on 19 February 2018).
  45. Property Valuation and Assessment Data (Condensed Assessed Value Roll). Available online: https://data.cityofnewyork.us/Housing-Development/Property-Valuation-and-Assessment-Data/rgy2-tti8 (accessed on 19 February 2018).
  46. Lisell, L.; Anderson, K.; Laws, N.; Marr, S.; Lohman, D.; Li, X.; Jimenez, T.; Cutler, D.; Case, T. Quantifying and Monetizing Renewable Energy Resiliency; National Renewable Energy Laboratory: Golden, CO, USA, 2018. [Google Scholar]
  47. LaCommare, K.H.; Eto, J.H. Understanding the Cost of Power Interruptions to U.S. Electricity Consumers; No. LBNL-55718; Ernest Orlando Lawrence Berkeley National Laboratory: Berkeley, CA, USA, 2004. [Google Scholar]
  48. Manhattan Home Prices & Values. Zillow Home Value Index. Available online: https://www.zillow.com/manhattan-new-york-ny/home-values/ (accessed on 20 March 2018).
  49. Deru, M.; Field, K.; Studer, D.; Benne, K.; Griffith, B.; Torcellini, P.; Liu, B.; Halverson, M.; Winiarski, D.; Rosenberg, M.; et al. U.S. Department of Energy Commercial Reference Building Models of the National Building Stock; No. NREL/TP-5500-46861; National Renewable Energy Laboratory: Golden, CO, USA, 2011. [Google Scholar]
  50. Hall, T.M.; Sobel, A.H. On the impact angle of Hurricane Sandy’s New Jersey landfall. Geophys. Res. Lett. 2013. [Google Scholar] [CrossRef]
  51. Allianz Global Corporate & Specialty. Business Interruption Claims on the Rise: Allianz. 2015. Available online: https://www.insurancejournal.com/news/international/2015/12/10/391437.htm (accessed on 19 February 2018).
  52. Munich RE. Natural Catastrophe Losses at Their Highest for Four Years. Available online: https://www.munichre.com/en/media-relations/publications/press-releases/2017/2017-01-04-press-release/index.html (accessed on 19 February 2018).
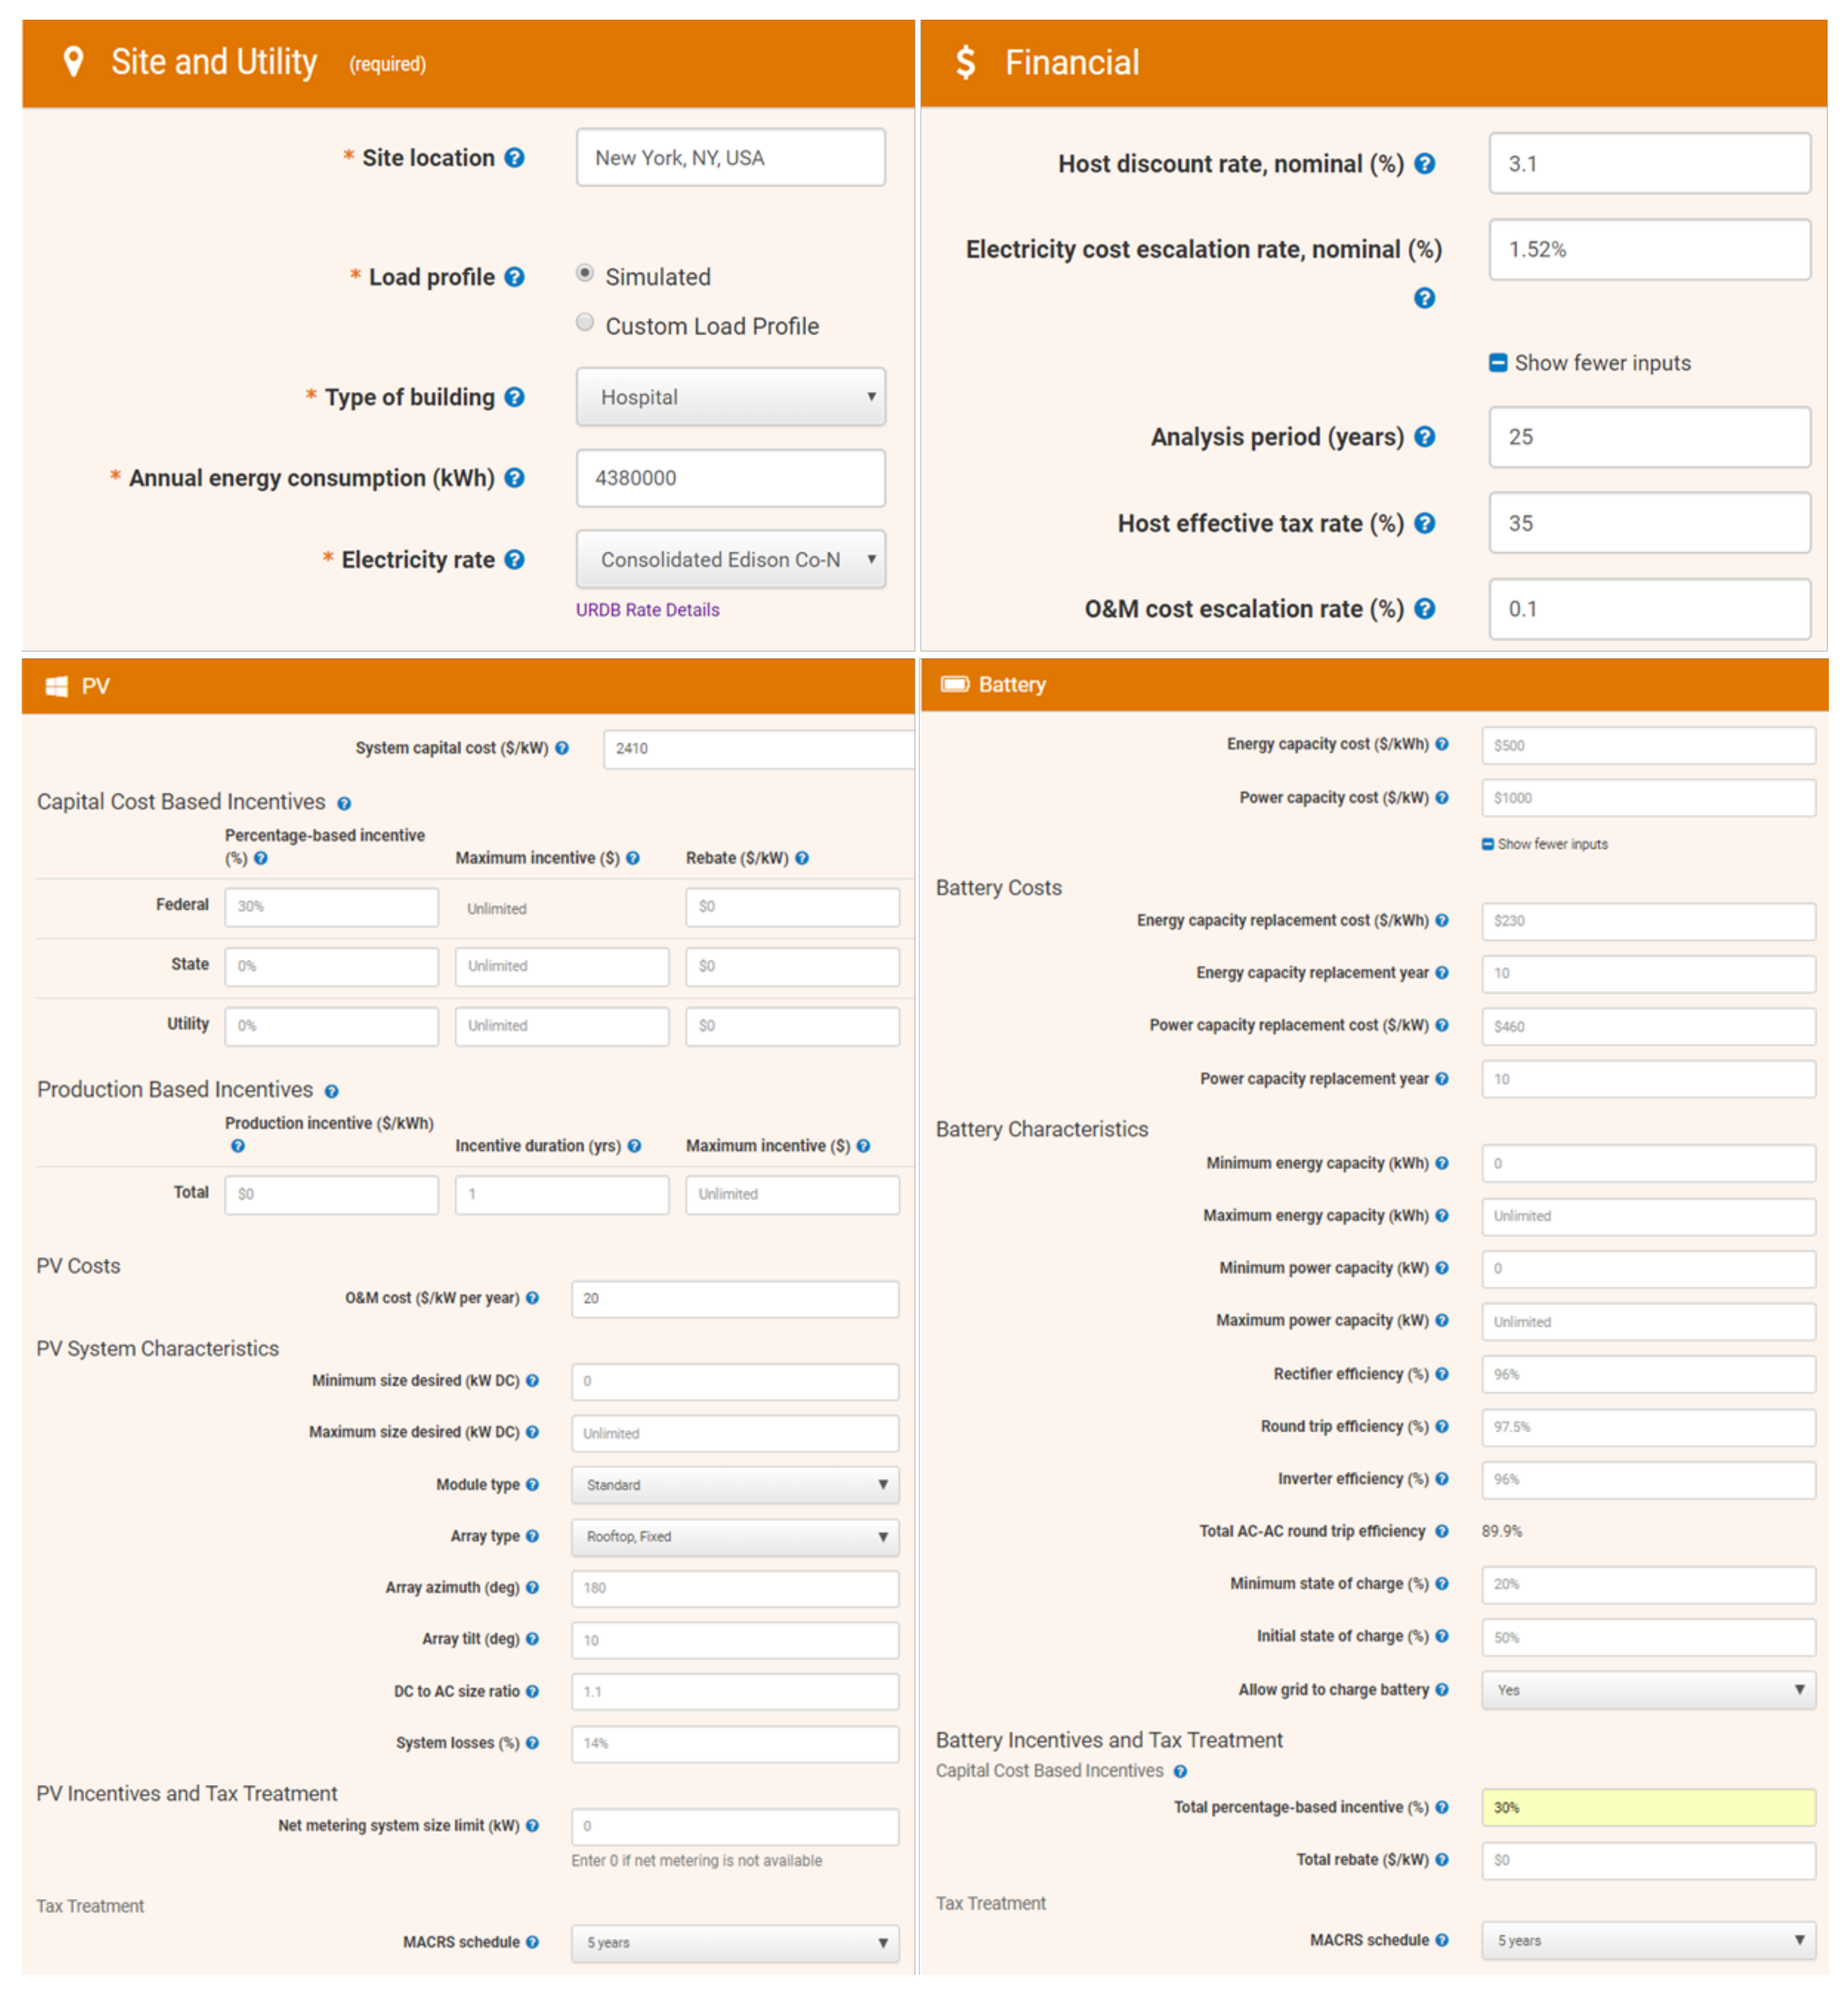
Figure 1. REopt modeling inputs used to determine the minimum lifecycle cost REHS.
Sustainability 10 00933 g001
Figure 2. This analysis focuses on business interruption losses in buildings south of 42nd Street in New York City.
Sustainability 10 00933 g002
Figure 3. REHS triples outage survivability from 0.9 days under a traditional system to three days (at a 90% probability of outage survival).
Sustainability 10 00933 g003
Table 1. Economic assumptions.
ItemValue
PV installed cost$2.41/W
PV O&M cost$20/kW/year
Battery cost$1000/kW, $500/kWh
Battery replacement cost (year 10)$460/kW, $230/kWh
Discount rate3.1%
Inflation rate0.1%
Electricity escalation rate1.52%
Tax rate35%
Investment Tax Credit30%
Depreciation schedule5 Yr. MACRS
Table 2. System performance requirements of REHS that were used in modeling business interruption premium reductions.
Model InputSystem Performance Requirements
BI Reduction Levels (%)Critical Load Supported (%)Hours of Load Supported
10%20%4 days (96 h)
25%30%4 days (96 h)
50%50%5 days (120 h)
95%90%8 days (192 h)
Table 3. Economic Impact of including business interruption premium reductions in REHS.
Simulation CaseEconomic Impact (Current Conditions)Economic Impact (Sea Level Rise)
BI Reduction Levels (%)Percent of Revenue from Premium Reduction (%)Percent of System Capital Cost Offset with BI Premium Reduction (%)Percent of Revenue from Premium Reduction (%)Percent of System Capital Cost Offset with BI Premium Reduction (%)
Baseline 0000
10%6.7%0.5%9.2%0.7%
25%6.7%1.3%9.1%1.7%
50%6.7%2.3%9.2%3.1%
95%5.8%3.2%8.0%4.4%

