Eco-Efficiency Assessment of Bioplastics Production Systems and End-of-Life Options


1
The Joint Graduate School of Energy and Environment, King Mongkut’s University of Technology Thonburi, 126 Prachauthit, Bangmod, Tungkru, Bangkok 10140, Thailand
2
Center of Excellence on Energy Technology and Environment, PERDO, Bangkok 10140, Thailand
*
Author to whom correspondence should be addressed.
Sustainability 2018, 10(4), 952; https://doi.org/10.3390/su10040952
Submission received: 16 January 2018
/
Revised: 19 March 2018
/
Accepted: 22 March 2018
/
Published: 24 March 2018
(This article belongs to the Special Issue Responsible Value Chains for Sustainability: Practices and Challenges from EcoBalance)
Abstract
:Bioplastics demand has been increased globally due to concerns regarding environmentally friendly consumption and production. Polylactic acid (PLA), polyhydroxyalkanoates (PHAs), and polybutylene succinate (PBS) are promising bioplastics with bio-based feedstocks and property of biodegradability. They are produced by bacterial fermentation of sugars from carbohydrate sources. With flexibility in their properties, PLA, PHAs, and PBS can potentially substitute conventional plastics such as polypropylene (PP), polyethylene terephthalate (PET), and polystyrene (PS). This study aims at evaluating the environmental and economic sustainability of bioplastics production together with end-of-life (EOL) options. The combination of environmental and economic indicators, eco-efficiency (E/E), was selected to investigate the performance of PLA, PHAs, and PBS from sugarcane and cassava in comparison with PP. The environmental impacts were determined using life cycle assessment. The product cost was used to represent the economic value. The E/E results showed that the environmental and economic sustainability could be enhanced with 100% mechanical recycling of all kinds of studied plastics. It is also important to highlight that mechanical recycling showed a better performance in terms of E/E than composting of bioplastics.
1. Introduction
Generation of plastic waste is a global problem, one of the major problems being the accumulation of plastic waste in the ocean that has caught the attention of environmental agencies worldwide [1]. The intrinsic property of durability of petroleum-based or conventional plastics has made them persist in the environment for decades [2]. The development of bio-based plastics or bioplastics as an alternative to conventional, fossil-based plastics gives hope that such problems can be solved with an additional advantage of reducing the use of fossil resources as agricultural feedstocks are used to produce bioplastic resins. Bioplastics are produced from renewable biomass feedstocks (e.g., corn, cassava, and sugarcane) through microbial fermentation processes [3]. One of the interesting properties of bioplastics is biodegradability; they can be fully degraded under suitable conditions, aerobic condition with temperature of 60 °C and 80% humidity in a composting facility [4].
Currently, the production capacity of conventional plastics worldwide is about 320 million tonne annually [5]. According to the market data of bioplastics provided by European Bioplastics, the global capacity of bioplastic production was 2.05 million tonnes in 2017, accounting for 0.6 percent of plastics produced. However, it has been forecasted to reach 2.44 million tonnes in 2022. Asia is the hub of bioplastics production, where about 56% of bioplastics were produced in 2017 [5]. Thailand, as one of the predominantly agricultural countries in the world, has a high potential for producing bioplastics. Despite the fact that rice is the main crop grown nationwide, the country is on the top ranks of sugarcane and cassava products exporters [6]. The Thai government has launched a ten-year plan to build a bio-economy hub for the region, the bioplastics industry being one of the targets [7]. An important point to consider is that the biomass feedstocks to be supplied to the bioplastics industry are also being used to produce food, feed, and energy for domestic consumption. Therefore, it may result in competition of the use of feedstocks and impacts on land and water use.
Polylactic acid (PLA), polyhydroxyalkanoates (PHAs), and polybutylene succinate (PBS) are promising bio-based and biodegradable bioplastics. With flexibility in their properties, PLA, PHAs, and PBS can potentially substitute conventional plastics such as polypropylene (PP), polyethylene terephthalate (PET), and polystyrene (PS) [8,9]. Life Cycle Assessment (LCA) has been used as a tool to quantify environmental impacts associated with bioplastics throughout its life cycle. Some studies focused on ‘cradle-to-factory gate’ [10,11,12,13,14,15] LCA or from the feedstock cultivation and harvesting to bioplastic resin. However, some researchers studied the impacts from acquisition of feedstock to end-of-life (EOL) or ‘cradle-to-grave’ approach [14,16,17]. Bioplastics have been reported to have lower environmental impacts in terms of greenhouse gas emissions and fossil depletion than their conventional plastic counterparts [18,19,20]. Despite consuming less fossil resources, cultivation of agricultural crops for feedstocks can result in environmental impacts such as land use change and may also give rise to issues pertaining to competition between food, energy and materials.
For the bioplastics to be practically viable, consideration of environmental impacts alone may not be sufficient. Interest should be given to economic impacts as well. There are studies that have emphasized the economic impacts of bioplastic production systems, particularly on cost benefit analysis of bioplastics production [21]. However, these studies lack consideration of the overall life cycle stages of the bioplastics system or considered either environmental impacts or economic impacts, but not both. Therefore, this study aims at assessing the environmental and economic sustainability of bioplastics production systems, which includes EOL options. Eco-efficiency (E/E), an indicator that integrates the economic and environmental sustainability dimensions, is used to investigate the comparative performance of PLA, PHAs, and PBS from sugarcane and cassava with PP.
2. Materials and Methods
2.1. Scope of the Study
In this study, E/E was used as an indicator to investigate environmental and economic sustainability of bioplastic production systems from cassava and sugarcane feedstocks in Thailand together with EOL scenarios. The E/E of disposable takeaway food boxes produced from conventional plastic and different bioplastics is evaluated using environmental impact reduction and cost. The detailed definition of E/E has been elaborated in Section 2.2. LCA was used to quantify environmental impacts and total cost was used as an economic indicator; the details of LCA and the economic indicator are given in Section 2.3 and Section 2.4, respectively.
The materials studied in this paper are PLA, PHAs, PBS, and PP. The functional unit for the four types of disposable takeaway food boxes with lids is defined as 1000 boxes with dimension of 17.4 × 12.0 × 4.8 cm and the thickness of 0.045 cm. The dimension of the lids is 17.3 × 14.0 × 0.8 cm with the thickness of 0.045 cm as well. The boxes have a carrying capacity of 650 mL and they are stackable. The weights of each type of material per functional unit are 35.2, 46.5, 43.7, and 32.1 kg for PLA, PHAs, PBS, and PP, respectively.
2.2. Eco-Efficiency
E/E has become recognized as an indicator to promote the sustainable development of production systems that has been standardized by the International Organization for Standardization as described in ISO 14045 [22]. It attempts to include the economic and environmental aspects of a product in a single indicator with a view to increasing economic benefit while reducing environmental degradation. Though basically defined as a goal of making value while reducing environmental impact [23], various definitions have been proposed for operationalizing the calculation of the E/E term. The implementation of E/E varies depending upon the environmental and economic performance indicators of interest [24,25,26]. Cost is a measure in economics of the value of goods and services produced in an industry or an economy. For application of the E/E concept, the particular indicators and scope of comparison system must be defined wisely to ensure that it will enable a fair comparison of the different production alternatives for a similar product. The E/E of the takeaway food boxes can be calculated using Equation (1):
The environmental impact reduction was calculated as the difference of the environmental impact of the simulated scenario and the base case. The environmental impacts are evaluated using life cycle assessment (more details in Section 2.3). As can be intuitively understood, a higher level of impact reduction will lead to higher E/E. The cost in the equation refers to the costs associated with the production and EOL of the bioplastic boxes (more details in Section 2.4). The calculations were done based on the functional unit.
2.3. Life Cycle Assessment
In this study, midpoint and endpoint impacts from cradle-to-grave LCA of PLA, PHAs, and PBS boxes from cassava and sugarcane and PP boxes were investigated using the ReCiPe life cycle impact assessment method with the hierarchist perspective. The calculation was done using an Excel spreadsheet. All 18 midpoint environmental impacts and three endpoint impacts (environment, human health, and resources) were investigated. Normalization and average weighting were used to aggregate the endpoint impacts into single scores.
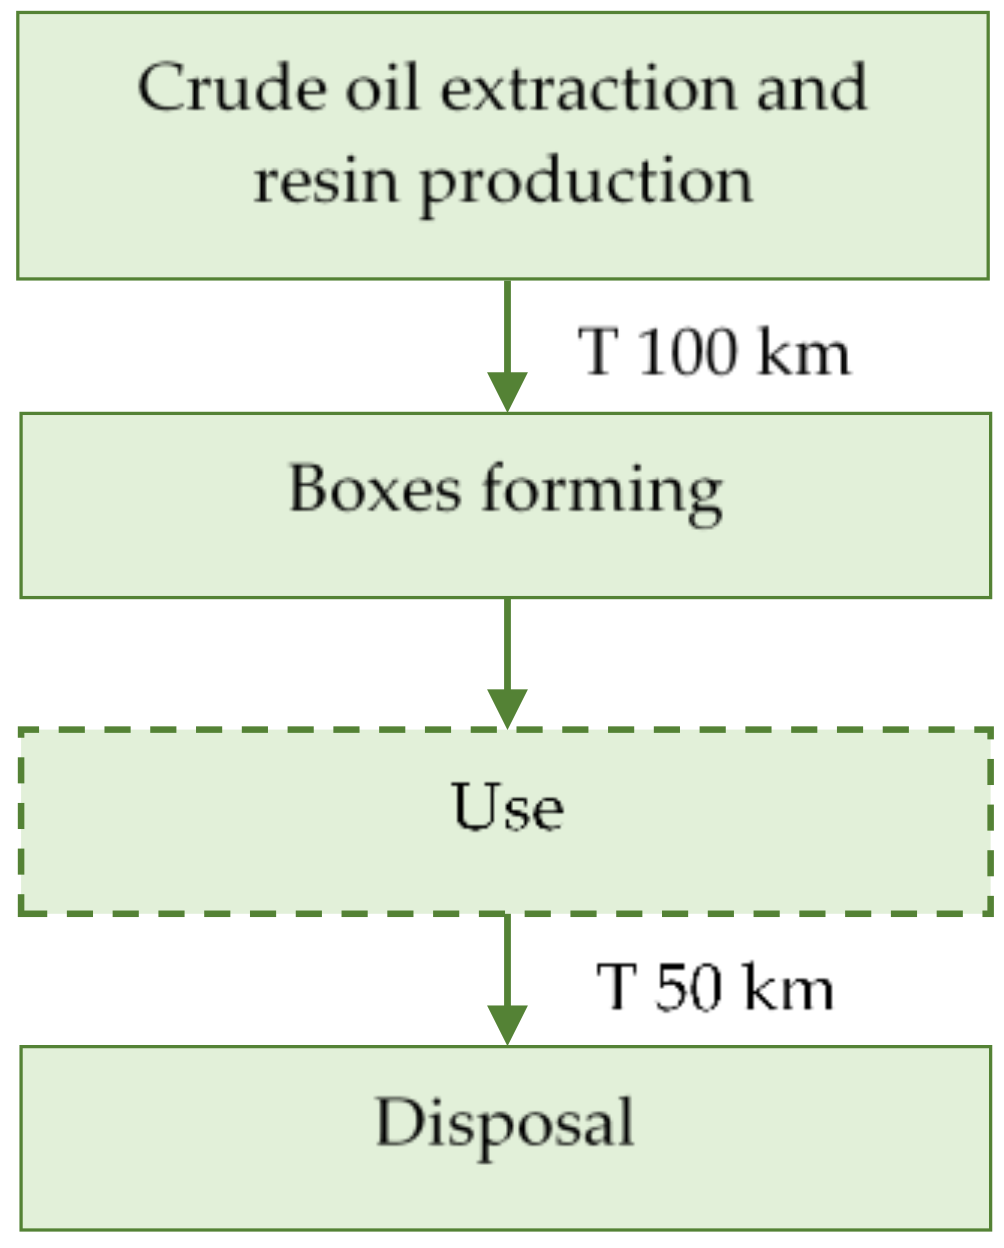
The system boundary of the bioplastics production includes feedstocks cultivation and harvesting, starch/sugar production, resin production, plastic boxes forming, transportation, and disposal. Crude oil extraction, plastic resin production, and disposal are included in the conventional plastic production system. Life cycle inventories (LCI) of chemicals, materials, and fuels used were referred from the Thai national life cycle inventory database [27] and the ecoinvent 3.0 database [28]. The LCI used in this study considers process-based data. This study was developed according to Life Cycle Assessment concept based on cradle-to-grave evaluation. The life cycle stages of bioplastics boxes from sugarcane and cassava and plastic from petroleum are illustrated in Figure 1 and Figure 2, respectively. The use phase is not included in the assessment as there are no impacts anticipated from this phase.
• Feedstock cultivation and harvesting
Sugarcane is an annual crop grown in many regions of Thailand such as the Northeast and Central regions. It can be planted in both rainfed and irrigated areas. The Thai sugarcane farming data were from Pongpat et al. [29]. The average sugarcane yield is 67 tonnes/ha-y. The current harvesting practice is done mainly by burning the cane trash and leaves before cutting the cane manually. The input chemical fertilizers, pesticides, and fuels as well as emissions from the conventional practices were considered. The data for cassava cultivation and harvesting were extracted from Kawasaki et al. [30]. The average cassava root yield is 30 tonnes/ha-y. The main areas of cassava cultivation in Thailand are in the Northeast.
• Production of starch/sugar
At the sugar mill where sugar is extracted from sugarcane, the data from Silalertruksa et al. [31] were used. Economic allocation was used to allocate environmental burdens among the co-products, viz., raw sugar, refined sugar, molasses, and surplus electricity from bagasse. To produce bioplastics from cassava feedstock, the cassava roots are first converted to cassava starch; the processing data for this were from Jakrawatana et al. [32]. Environmental burdens were allocated between cassava starch and cassava pulp based on the economic values of the co-products. Starch cannot be directly used in the bacterial fermentation process; it must be converted to sugar. The inventory data of the starch to sugar conversion process are from Papong et al. [12].
• Bioplastic resin production
Bioplastics are produced using microbial processes. Sugarcane-based PLA (SPLA) and cassava-based PLA (CPLA) can be produced via a fermentation process where sugar is converted to lactic acid before polymerization to PLA. The data on energy and chemicals used in the process were extracted from Groot and Boren [11]. PHAs are linear polymers produced by bacterial fermentation of sugar. Two different feedstock-based PHAs were studied, namely, sugarcane-based PHAs (SPHAs) and cassava-based PHAs (CPHAs). Data on PHAs production were retrieved from Khoo et al. [14]. PBS is produced via bacterial fermentation from succinic acid and 1,4 butanediol. Sugarcane-based PBS (SPBS) and cassava-based PBS (CPBS) were studied. The inventory data were from Charoennet et al. [33]. In addition, 1,4 butanediol can be produced from succinic acid and bio-ethanol. The molasses ethanol was used for the case of SPBS, the inventory data were from Silalertruksa and Gheewala [34]. For the case of CPBS, cassava-based ethanol was used by utilizing inventory data from Silalertruksa et al. [32].
• Boxes forming
There are a variety of technologies for forming of plastic products; one of the most efficient technologies is injection molding [35]. The plastic resin is directly put into a molding machine where, with heat, it will melt and can be formed into a desired product. During this life cycle stage, scrap is assumed to be reprocessed. The inventory data for the injection molding process are from the ecoinvent 3 database.
• Transportation
The transport of feedstock from farms to sugar mill or to cassava starch production plant was assumed to be done by ten-wheel trucks. The transport of sugar to the bioplastic resin plant and transport of resin to plastic converter were assumed to be done by a ten-wheel truck as well. The transport of plastic waste to the disposal facility was assumed to use a 10-wheel waste dump type truck. The inventory data of transportation were from the Thai national life cycle inventory database.
• End-of-life
In this study, EOL scenarios were made to investigate the environmental impact reductions from improving the EOL management system. Currently, about 75% of the plastic waste is disposed in sanitary landfills and about 25% is recycled [36]. Bioplastics can degrade under anaerobic conditions in landfills releasing methane, a potent greenhouse gas. With a proper composting facility, bioplastics can be converted to compost. Furthermore, bioplastics can technically also be recycled. An important property of conventional plastic is recyclability, so recycling of conventional plastics is considered in this study. The inventory data on EOL were from the ecoinvent 3 database and European reference life cycle database. Sources of the data used in the different life cycle stages are summarized in Table 1 and the scenarios are shown in Table 2.
2.4. Economic Indicator
In this study, the total cost of the plastic production systems and plastic waste management were used as the economic indicator to investigate the eco-efficiency of the takeaway food boxes. The total cost of each production system included plastic resin prices [37], the cost of electricity consumption during molding of boxes [38], and the cost of EOL management [39,40]. They were calculated based on the functional unit of each plastic production system and EOL option. Table 3 shows the prices and costs associated with the plastic boxes production systems. The currency of 1 USD to 32 THB was applied to convert the prices and costs into THB. The calculation of the total cost is shown in Equation (2):
3. Results and Interpretation
3.1. Life Cycle Environmental Impacts
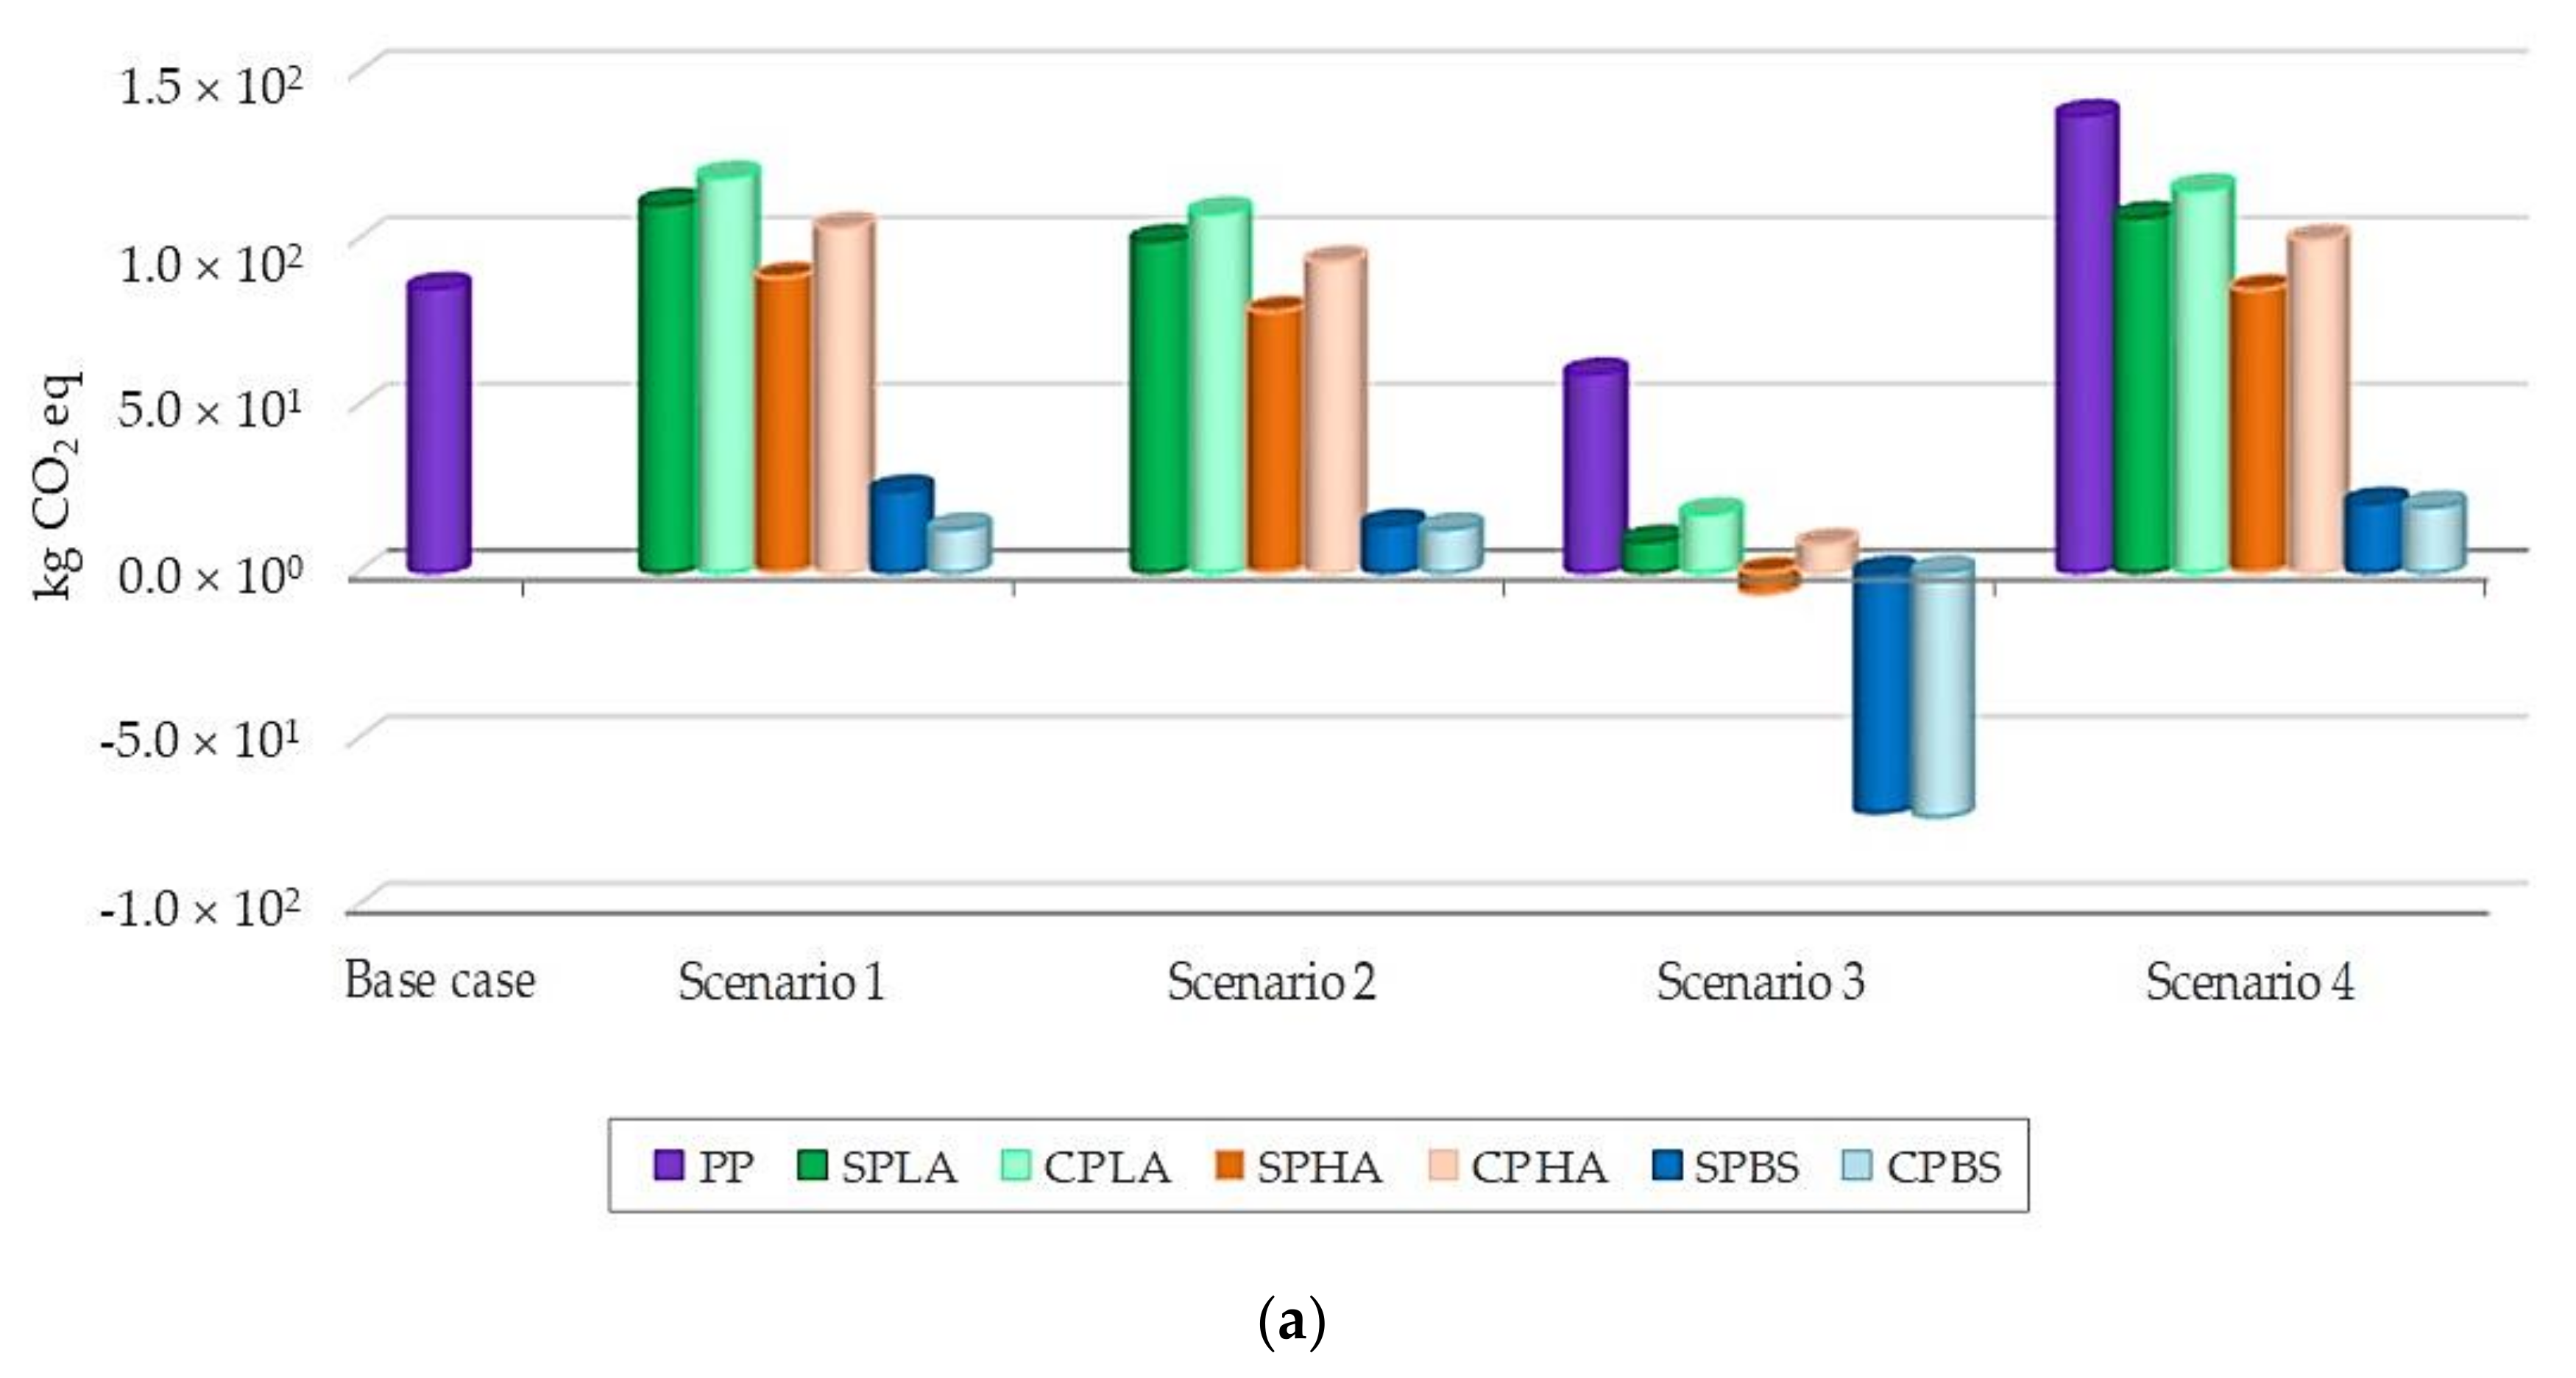
Eighteen midpoint environmental impacts were investigated. Global warming potential (GWP), acidification potential (AP), eutrophication potential (EP), fossil depletion potential (FDP), land occupation potential (LOP), and toxicity potential (TP) are discussed in detail below. These particular categories were chosen only as examples for detailed discussion as the other impact categories also show similar trends and would result in similar discussion points. However, it should be noted that all of the impacts are included in the single score results and also in the E/E calculations.
Figure 3 shows the life cycle environmental impacts associated with the boxes considering different EOL scenarios and different types of feedstock. In this study, carbon dioxide fixation during cultivation of feedstocks was considered. It can be clearly seen that, under the EOL scenario of 100% recycling, GWPs of all bioplastics exhibit lower values. This is because the requirement of virgin resin is reduced, consequently offsetting the GWP of producing virgin resin. Comparing the different types of bioplastics considered in the study, PBS showed lower GWP compared to PLA and PHAs due to the lower amount of electricity required in the PHA resin production process. Within the same kind of bioplastic, sugarcane-based bioplastics always showed lower GWP than the cassava-based ones. This is because of the use of bagasse and molasses to produce electricity and bioethanol, respectively. Thus, the environmental burdens from the producing of sugar at the sugar mills are allocated between the co-products, thus reducing the burdens on the raw sugar used for the bioplastics production.
For FDP, the PP box had a lower impact than many types of bioplastic boxes. The scenario of 100% mechanical recycling exhibited the lowest impacts for all types of plastics. However, comparison of mechanical recycling scenario of PP box showed a lower FDP than every other bioplastic with every EOL scenario except for mechanical recycling. Thus, by looking at the FDP alone, conventional plastic with 100% recycling, is more environmentally friendly than bioplastics with other EOLs (except recycling). Following the same trend as with the GWP, PBS showed lower FDP than PLA and PHAs, as the main contributor of FDP is electricity consumption in the resin production process. The quantity of electricity required for the PBS resin production process is significantly lower than others; 1.07, 1.09, and 0.13 kWh/kg for PLA, PHAs, and PBS resin, respectively.
For the other impact categories, bioplastics showed higher impact as compared to PP. This is because of the acquisition of feedstock and the intensive energy used during resin production. The calculations showed that the resin production stage is the main environmental impact contributor followed by the box forming stage. During feedstocks’ cultivation, fertilizers and pesticides are applied in the field leading to higher eutrophication potential. Growing of feedstocks for bioplastic production requires arable land; therefore, the LOP of bioplastics boxes was much higher than for PP boxes. Considering of different EOLs showed that the 100% mechanical recycling scenario had lower LOP for all bioplastics because, for the use of recycled material, land is not required for producing feedstocks.
It is important to highlight that the composting of bioplastics was not found to be the most efficient EOL for all kinds of bioplastics.
It is quite difficult to point out which plastic is better than others when not all the environmental impact categories considered show a single plastic option as the best one on all counts. Thus, endpoint impact assessment followed by aggregation into a single score was investigated. The results are expressed in Figure 4. Different feedstocks contributed to different levels of impact. Sugarcane-based bioplastics had lower impact than cassava-based bioplastics. Comparing all EOL scenarios with the base case of PP boxes showed that PBS had lower impacts for all EOL options. The calculations showed that, for all of the kinds of studied bioplastics, fossil depletion is the main contributor accounting for more than 90% of the single score environmental impact for damage to human health and damage to ecosystems’ endpoints. Even considering the recycling scenario of PLA and PHAs boxes, the base case (PP) had lower impacts than PLA and PHAs. Similarly, the 100% recycling scenario of PP boxes gave about 50% lower impact than the base case. With respect to EOL options, recycling showed lower impacts for all types of plastic boxes. Hence, plastic recycling should be promoted as the most appropriate plastic waste management option. The resources endpoint predominates the single score impacts followed by human health and ecosystems. This is because the conversion factors that were used to convert midpoint impact of fossil and metal depletion to endpoint are about 6–9 times higher than for other impact categories.
Another point to consider is the stages in the life cycle of the bioplastics that contributed largely to the environmental impacts. Figure 5 shows the GWP and FDP profiles of the boxes studied. It can be seen that GWP of PLA and PHA boxes was contributed to largely by the resin production stage followed by the boxes forming stage. The results are in line with a previous study that used corn as a feedstock for bioplastic resin production [10]. This is due to the intensive use of electricity. Moreover, the use of chemicals, such as lime, in the process also makes a major contribution to the GWP. During cultivation of feedstocks, CO2 in the atmosphere is fixed by sugarcane and cassava through photosynthesis. For PLA, PHAs, and PBS, the amounts of 1833.5, 2199.1, and 2046.0 kg CO2 per kg resin were fixed. As a result, GWP during cultivation and harvesting exhibited negative results. At the sugar mill, bagasse, molasses, and filter cake were utilized for electricity generation, bioethanol production, and fertilizer, respectively. Consequently, the GWP was relatively low. Likewise, the FDP was also contributed mainly by the resin production stage followed by boxes forming. This was due to the use of electricity. However, it can be noticed that boxes forming showed higher impact than other life cycle stages for the case of PBS. The main reason is that the electricity consumption required for PBS resin production is lower than the other two types of bioplastic.
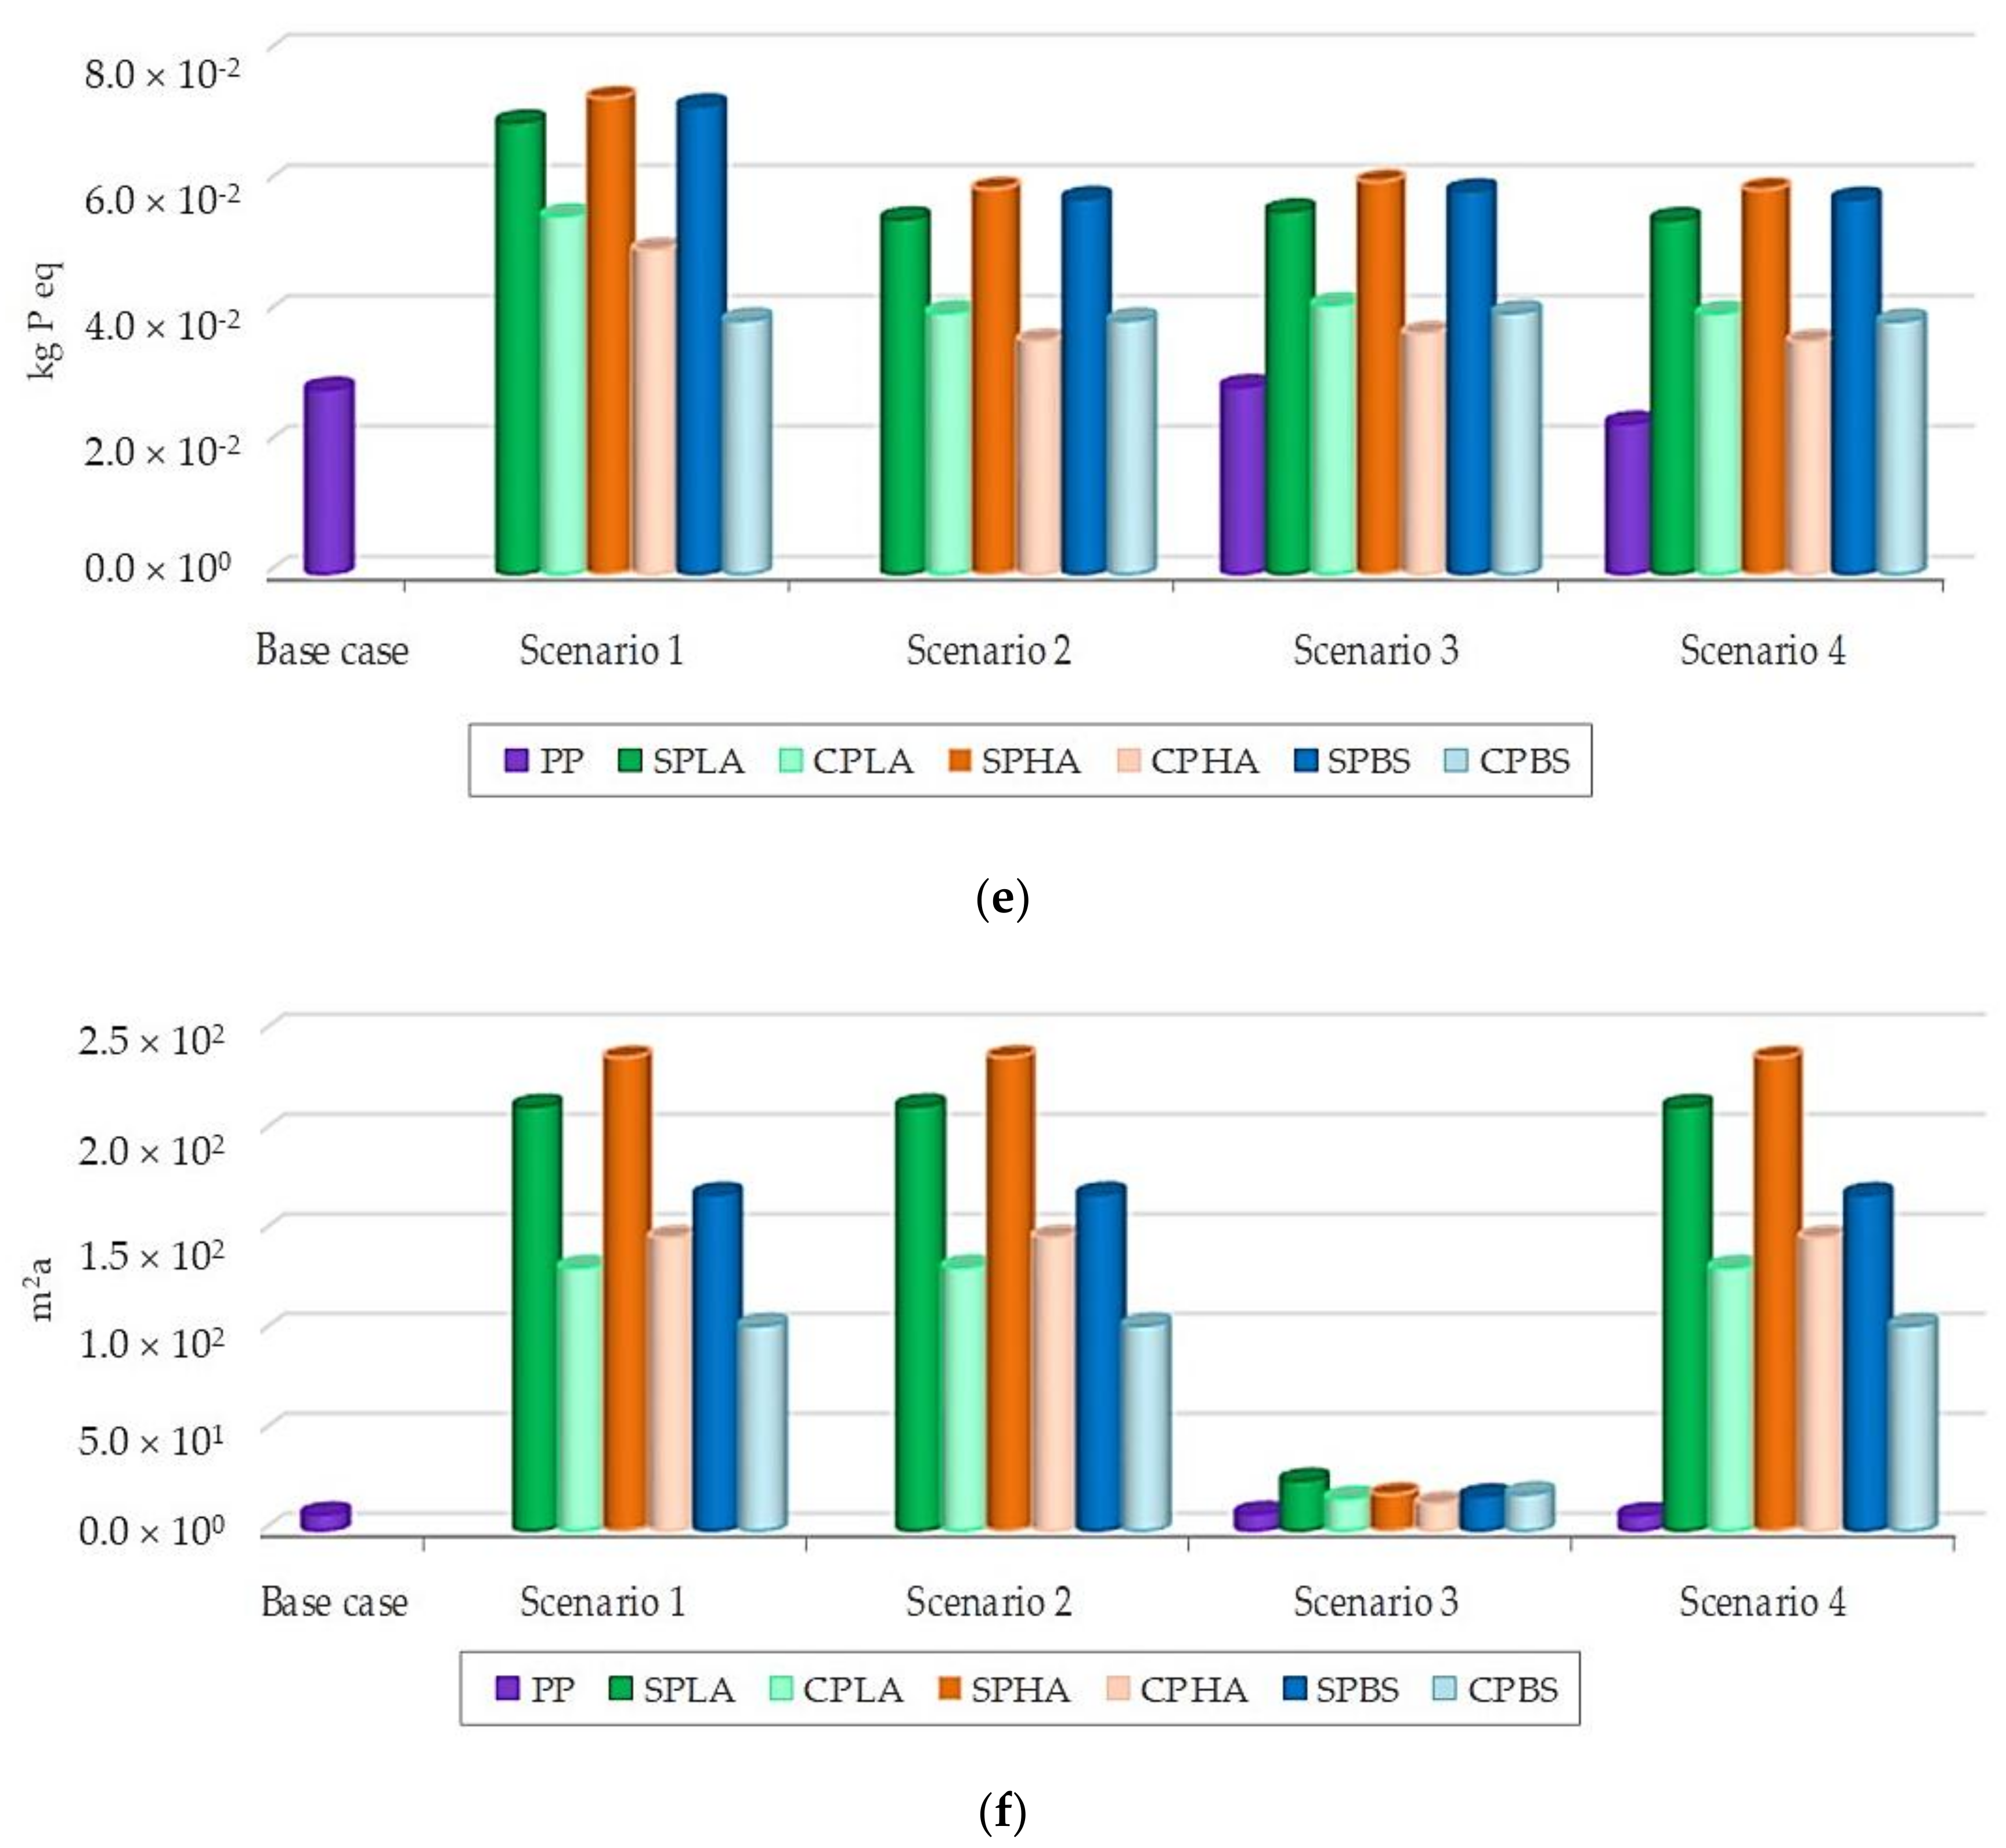
3.2. E/E of Bioplastic Production Systems
The reduction of environmental impacts (endpoint impact) was calculated in comparison with the base case. The results of E/E are shown in Table 4 and Figure 6. The negative values showed the higher environmental impacts than the base case. The EOL of 100% mechanical recycling showed better E/E than other EOL options. PLA boxes showed higher E/E than PBS and PHAs. This result is opposite to the one obtained when considering only the environmental impacts (Figure 4). This shows the advantage of using E/E as the indicator for assessment. By looking at the conventional plastic boxes, based on E/E value, mechanical recycling is preferable to other EOL options.
The prices of bioplastics, being about two to three times higher than conventional plastic resins, largely influenced the value of E/E. Based on the report of Sustainable Bioplastics Council of Maine [41], the breakup cost of bioplastics indicated that about 29% of the total cost was the cost of dextrose and 15% was the cost of chemicals used in the resin production process. Hence, reducing the price of feedstock and chemicals will consequently decrease the resin price. The bioplastics industry is currently at the very beginning stage and thus it is expected to improve in terms of efficiency and technology. Therefore, a lot of research and development is needed. More specifically, the bioplastic resin producers are trying to improve their production efficiency and one of the targets is to reduce the amount of electricity and chemicals used in the process [10].
The cultivation and harvesting stage is also a major contributor to the life cycle environmental impacts of bioplastics. The Thai government has made an effort to increase the production yields of cassava and sugarcane. This will help with reducing the environmental impacts associated with bioplastics production. Finally, the cost of bioplastics resin production is also expected to be reduced.
4. Discussion
The results of this study show that the main contributor to environmental impacts is the intensive use of electricity during resin production and boxes forming stages. Another significant contributor to many of the environmental impacts is the use of chemicals e.g., lime, in the resin production processes. Hence, environmental impacts from bioplastics production can be reduced by technology improvement leading to improved yields while using a lower amount of electricity and chemicals.
The Thai database was used in this study especially during the feedstock cultivation and harvesting stages. With the improvement in agricultural practices such as mechanical harvesting of green cane instead of the current practice of burning the leaves and cane before harvesting, the environmental impacts and the total costs of bioplastics may change resulting in the variation of the E/E values. Furthermore, the LCI of electricity and road transport are also from the Thai database. This may lead to a limitation of the study results in that they may not be valid for other countries. Accordingly, the results are more specific to Thailand and are useful for the country’s bioplastics policy-making process.
In this study, it can be seen that the environmental impacts can be reduced by improving the plastic waste disposal method. Mechanical recycling EOL showed higher E/E than other EOLs for all kinds of plastics considered in this study. However, efficient mechanical recycling can only be achieved with a well-organized system in place including labelling, collection, sorting, grinding, cleaning, and processing into new products. Most of the time bioplastics are labelled with resin identification code 7 (other plastics) [42]. Thus, they cannot be sorted out by each type of biopolymer. This is very important, as it is the upstream of the bioplastic recycling chain. Therefore, a more specific biopolymer identification code system should be developed.
The current high prices of bioplastic resins are a major drawback to the large-scale introduction bioplastics, as the majority of consumers consider price of a product over environmental profile [43]. This is something that needs attention. It is to be noted that the bioplastics industry is at a very nascent stage. The technology and production efficiency are expected to be improved e.g., reducing electricity consumption during bioplastic resin production process.
In this study, PBS shows the best performance in terms of environmental impacts for all EOL scenarios, but it does not show the best performance for the economic indicator. On the other hand, when considering the economic indicator, PP reveals lower costs than all kinds of bioplastics, but it does not show the best environmental performance. By applying the E/E approach, despite better environmental performance of PBS and lower costs of PP, PLA has the highest E/E values indicating better environmental and economic sustainability. As a matter of fact, there is no standard definition of E/E, and the environmental impact reduction as an environmental indicator and the total cost as an economic indicator that were used in this study were useful to differentiate which production and EOL was better in terms of both environment and economics.
Since E/E takes both environmental and economic aspects into account but does not consider social aspects, for further study, the social aspects should be included in the sustainability assessment to cover all sustainability aspects.
5. Conclusions
The E/E, a combination of environmental and economic indicators, was used to investigate the environmental and economic sustainability of different bioplastic production systems with different EOL scenarios. Bioplastics (PLA and PHAs) do not necessarily perform better than plastic (PP) in the current situation where most of the plastic and bioplastics are landfilled; PBS, however, is seen to have the best E/E. Introduction of recycling changes the results in favor of PLA. PLA coupled with 100% mechanical recycling showed the highest E/E, followed by PP, PBS and PHAs. Out of the four EOL options, 100% mechanical recycling always showed the highest E/E values for all types of plastic and bioplastics boxes. Based on the results of this study, the composting scenario of bioplastics did not show a better environmental and economic sustainability as it is intuitively forecasted. The E/E could help to differentiate which production and EOL was better in terms of environment and economics. Thus, the results are useful for policy makers to make a decision as to which trade-off problems can be solved.
Acknowledgments
The authors would like to express their gratitude to the Joint Graduate School of Energy and Environment, King Mongkut’s University of Technology Thonburi, and the Center of Excellence on Energy Technology and Environment, PERDO, Bangkok, Thailand for financial support.
Author Contributions
K.C. collected and analyzed the data and wrote the paper; T.S. and S.G. advised on the data analysis and S.G. corrected the paper.
Conflicts of Interest
The authors declare no conflict of interest.
References
- Mitchell, A. Thinking without the ‘circle’: Marine plastic and global ethics. Political Geogr. 2015, 47, 77–85. [Google Scholar] [CrossRef]
- Gross, M. Oceans of plastic waste. Curr. Biol. 2015, 25, R93–R96. [Google Scholar] [CrossRef] [PubMed]
- Curran, M.A. Biobased materials. In Kirk-Othmer Encyclopedia of Chemical Technology; John Wiley & Sons Inc.: Hoboken, NJ, USA, 2000. [Google Scholar]
- Emadian, S.M.; Onay, T.T.; Demirel, B. Biodegradation of bioplastics in natural environments. Waste Manag. 2017, 59, 526–536. [Google Scholar] [CrossRef] [PubMed]
- European-Bioplastics. Bioplastics Market Data. Available online: http://www.european-bioplastics.org/market/ (accessed on 2 January 2018).
- Food and Agriculture Organization of the United Nations. Trade and Markets. Available online: http://www.fao.org/economic/est/est-commodities/en/#.Wls72KiWbIU (accessed on 2 January 2018).
- Bank of India. Thailand’s Bioeconomy Industry; Bank of India: Mumbai, India, 2017. [Google Scholar]
- Chen, G.Q.; Patel, M.K. Plastics derived from biological sources: Present and future: A technical and environmental review. Chem. Rev. 2012, 112, 2082–2099. [Google Scholar] [CrossRef] [PubMed]
- Shen, L.; Worrell, E.; Patel, M. Present and future development in plastics from biomass. Biofuels Bioprod. Biorefin. 2010, 4, 25–40. [Google Scholar] [CrossRef]
- Vink, E.T.H.; Davies, S. Life cycle inventory and impact assessment data for 2014 ingeo™ polylactide production. Ind. Biotechnol. 2015, 11, 167–180. [Google Scholar] [CrossRef]
- Groot, W.; Borén, T. Life cycle assessment of the manufacture of lactide and pla biopolymers from sugarcane in thailand. Int. J. Life Cycle Assess. 2010, 15, 970–984. [Google Scholar] [CrossRef]
- Papong, S.; Malakul, P.; Trungkavashirakun, R.; Wenunun, P.; Chom-in, T.; Nithitanakul, M.; Sarobol, E. Comparative assessment of the environmental profile of pla and pet drinking water bottles from a life cycle perspective. J. Clean. Prod. 2014, 65, 539–550. [Google Scholar] [CrossRef]
- Tecchio, P.; Freni, P.; De Benedetti, B.; Fenouillot, F. Ex-ante life cycle assessment approach developed for a case study on bio-based polybutylene succinate. J. Clean. Prod. 2016, 112, 316–325. [Google Scholar] [CrossRef]
- Khoo, H.H.; Tan, R.B.H.; Chng, K.W.L. Environmental impacts of conventional plastic and bio-based carrier bags. Int. J. Life Cycle Assess. 2010, 15, 284–293. [Google Scholar] [CrossRef]
- Suwanmanee, U.; Leejarkpai, T.; Mungcharoen, T. Assessment the environmental impacts of polylactic acid/starch and polyethylene terephthalate boxes using life cycle assessment methodology: Cradle to waste treatments. Int. J. Life Cycle Assess. 2013, 7, 259–266. [Google Scholar] [CrossRef]
- Khoo, H.; Tan, R.B.H. Environmental impacts of conventional plastic and bio-based carrier bags: Part 2: End-of-life options. Int. J. Life Cycle Assess. 2010, 15, 338–345. [Google Scholar] [CrossRef]
- Hottle, T.A.; Bilec, M.M.; Landis, A.E. Biopolymer production and end of life comparisons using life cycle assessment. Resour. Conserv. Recycl. 2017, 122, 295–306. [Google Scholar] [CrossRef]
- Madival, S.; Auras, R.; Singh, S.P.; Narayan, R. Assessment of the environmental profile of pla, pet and ps clamshell containers using lca methodology. J. Clean. Prod. 2009, 17, 1183–1194. [Google Scholar] [CrossRef]
- Tsiropoulos, I.; Faaij, A.P.C.; Lundquist, L.; Schenker, U.; Briois, J.F.; Patel, M.K. Life cycle impact assessment of bio-based plastics from sugarcane ethanol. J. Clean. Prod. 2015, 90, 114–127. [Google Scholar] [CrossRef]
- Suwanmanee, U.; Varabuntoonvit, V.; Chaiwutthinan, P.; Tajan, M.; Mungcharoen, T.; Leejarkpai, T. Life cycle assessment of single use thermoform boxes made from polystyrene (ps), polylactic acid, (pla), and pla/starch: Cradle to consumer gate. Int. J. Life Cycle Assess. 2013, 18, 401–417. [Google Scholar] [CrossRef]
- Chiarakorn, S.; Permpoonwiwat, C.; Nanthachatchavankul, P. Cost benefit analysis of bioplastic production in thailand. Econ. Public Policy 2011, 3, 44–73. [Google Scholar]
- ISO14045:2012. Environmental Management—Eco-Efficiency Assessment of Product Systems—Principles, Requirements and Guidelines; International Organization for Standardization: Geneva, Switzerland, 2012. [Google Scholar]
- Huppes, G.; Ishikawa, M. Eco-efficiency guiding micro-level actions towards sustainability: Ten basic steps for analysis. Ecol. Econ. 2009, 68, 1687–1700. [Google Scholar] [CrossRef]
- Ibbotson, S.; Dettmer, T.; Kara, S.; Herrmann, C. Eco-efficiency of disposable and reusable surgical instruments—A scissors case. Int. J. Life Cycle Assess. 2013, 18, 1137–1148. [Google Scholar] [CrossRef]
- Silalertruksa, T.; Gheewala, S.H.; Pongpat, P. Sustainability assessment of sugarcane biorefinery and molasses ethanol production in thailand using eco-efficiency indicator. Appl. Energy 2015, 160, 603–609. [Google Scholar] [CrossRef]
- Robaina-Alves, M.; Moutinho, V.; Macedo, P. A new frontier approach to model the eco-efficiency in european countries. J. Clean. Prod. 2015, 103, 562–573. [Google Scholar] [CrossRef] [Green Version]
- M-Tec. Thai National Life Cycle Inventory Database; M-Tec: Hahn, Spain, 2017. [Google Scholar]
- Wernet, G.; Bauer, C.; Steubing, B.; Reinhard, J.; Moreno-Ruiz, E.; Weidema, B. The ecoinvent database version 3 (part i): Overview and methodology. Int. J. Life Cycle Assess. 2016, 21, 1218–1230. [Google Scholar] [CrossRef]
- Pongpat, P.; Gheewala, S.H.; Silalertruksa, T. An assessment of harvesting practices of sugarcane in the central region of thailand. J. Clean. Prod. 2017, 142, 1138–1147. [Google Scholar] [CrossRef]
- Kawasaki, J.; Silalertruksa, T.; Scheyvens, H.; Yamanoshita, M. Environmental sustainability and climate benefits of green technology for bioethanol production in thailand. ISSAAS J. 2015, 21, 78–95. [Google Scholar]
- Silalertruksa, T.; Pongpat, P.; Gheewala, S.H. Life cycle assessment for enhancing environmental sustainability of sugarcane biorefinery in thailand. J. Clean. Prod. 2017, 140, 906–913. [Google Scholar] [CrossRef]
- Jakrawatana, N.; Pingmuangleka, P.; Gheewala, S.H. Material flow management and cleaner production of cassava processing for future food, feed and fuel in thailand. J. Clean. Prod. 2016, 134, 633–641. [Google Scholar] [CrossRef]
- Cheroennet, N.; Pongpinyopap, S.; Leejarkpai, T.; Suwanmanee, U. A trade-off between carbon and water impacts in bio-based box production chains in thailand: A case study of ps, plas, plas/starch, and pbs. J. Clean. Prod. 2017, 167, 987–1001. [Google Scholar] [CrossRef]
- Silalertruksa, T.; Gheewala, S.H. Environmental sustainability assessment of bio-ethanol production in thailand. Energy 2009, 34, 1933–1946. [Google Scholar] [CrossRef]
- Matarrese, P.; Fontana, A.; Sorlini, M.; Diviani, L.; Specht, I.; Maggi, A. Estimating energy consumption of injection moulding for environmental-driven mould design. J. Clean. Prod. 2017, 168, 1505–1512. [Google Scholar] [CrossRef]
- Pollution Control Department (PCD). The Draft of the Integrated Plastic Waste Management Plan (2017–2021); Pollution Control Department: Bangkok, Thailand, 2017.
- Ottawa Catholic School Board. The Project of Sugar and Sugarcane Preparedness for Bioplastic Industry; Ottawa Catholic School Board: Ottawa, ON, Canada, 2016. [Google Scholar]
- EPPO Electricity Tariff. Available online: http://www2.eppo.go.th/power/pw-Rate-PEA.html (accessed on 2 January 2018).
- WorldBank. What a Waste: A Global Review of Solid Waste Manafement; World Bank: Washington, DC, USA, 2012. [Google Scholar]
- Cost-Benefit Analysis of Recycling in the United States: Is Recycling Worth It? Available online: http://www.english.umd.edu/interpolations/2601 (accessed on 5 January 2018).
- Maine Technology Institute. The Business Case for Commercial Production of Bioplastics in Maine; Maine Technology Institute: Brunswick, ME, USA, 2010. [Google Scholar]
- PCA Labelling for Recyclability. Available online: http://www.pca.org.au/application/files/7014/3796/8256/Labellingdiscussionpaper.pdf (accessed on 13 March 2018).
- Kaewphan, N.; Gheewala, S.H. Greenhouse gas evaluation and market opportunity of bioplastic bags from cassava in thailand. J. Sustain. Energy Environ. 2013, 4, 5–19. [Google Scholar]
Figure 1.
Life cycle stages of the studied bioplastic boxes.
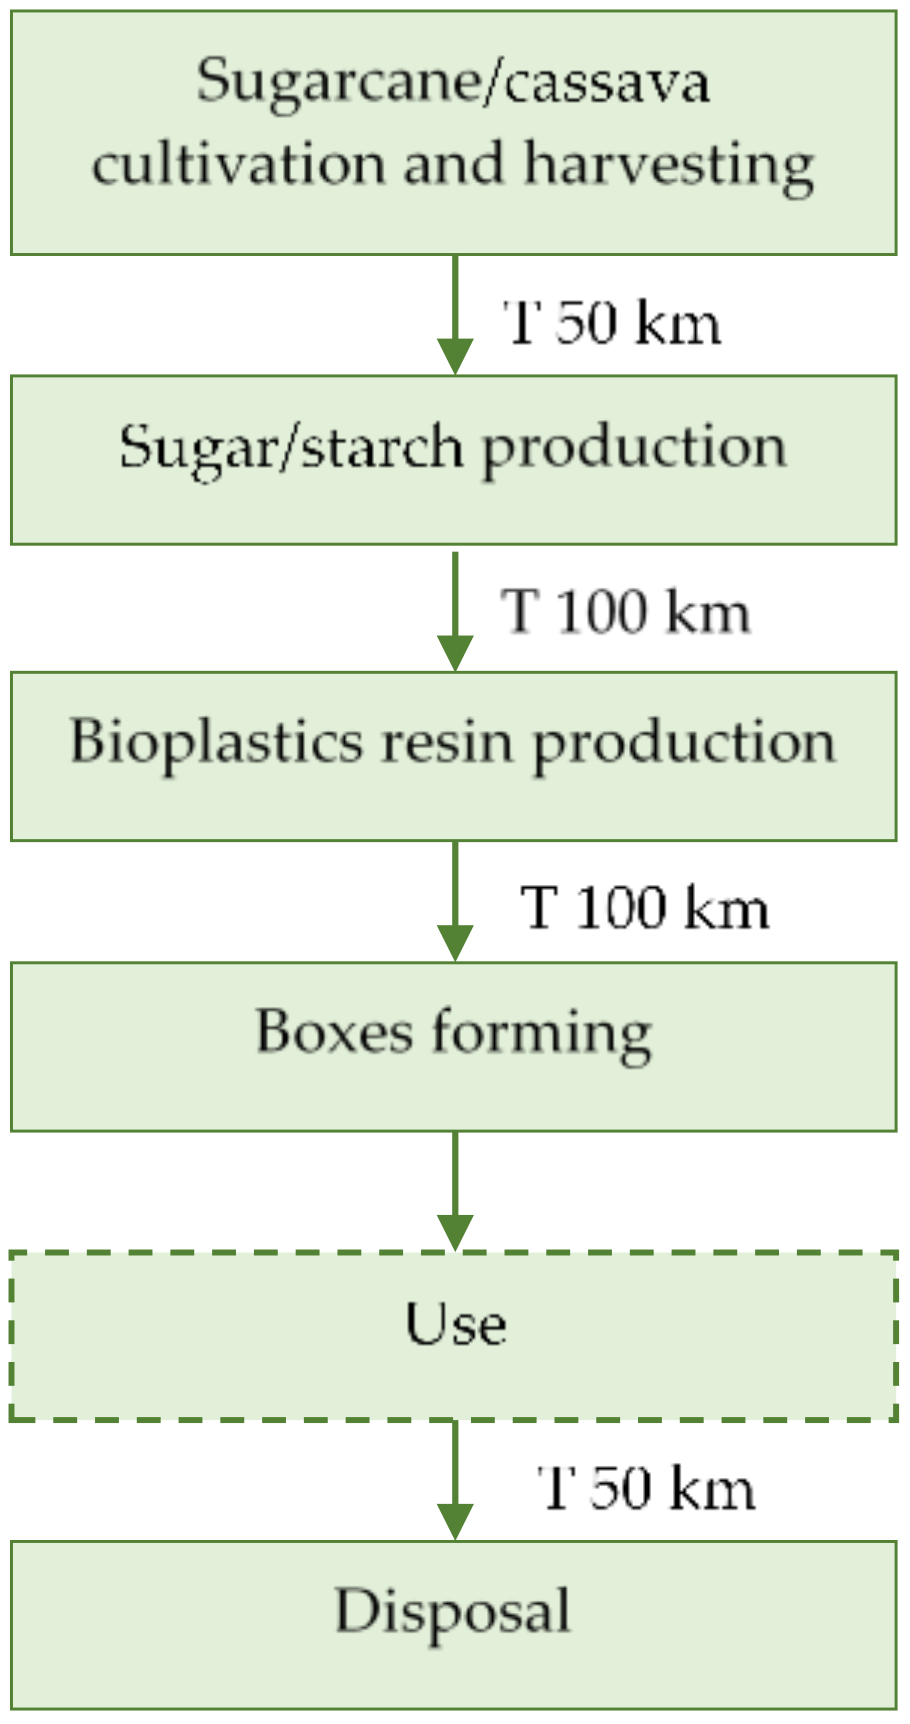
Figure 2.
Life cycle stages of the studied polypropylene boxes.

Figure 3.
Environmental midpoint impacts associated with the boxes: (a) global warming potential; (b) fossil depletion potential; (c) acidification potential; (d) toxicity potential; (e) eutrophication potential; and (f) land occupation potential.
Figure 3.
Environmental midpoint impacts associated with the boxes: (a) global warming potential; (b) fossil depletion potential; (c) acidification potential; (d) toxicity potential; (e) eutrophication potential; and (f) land occupation potential.

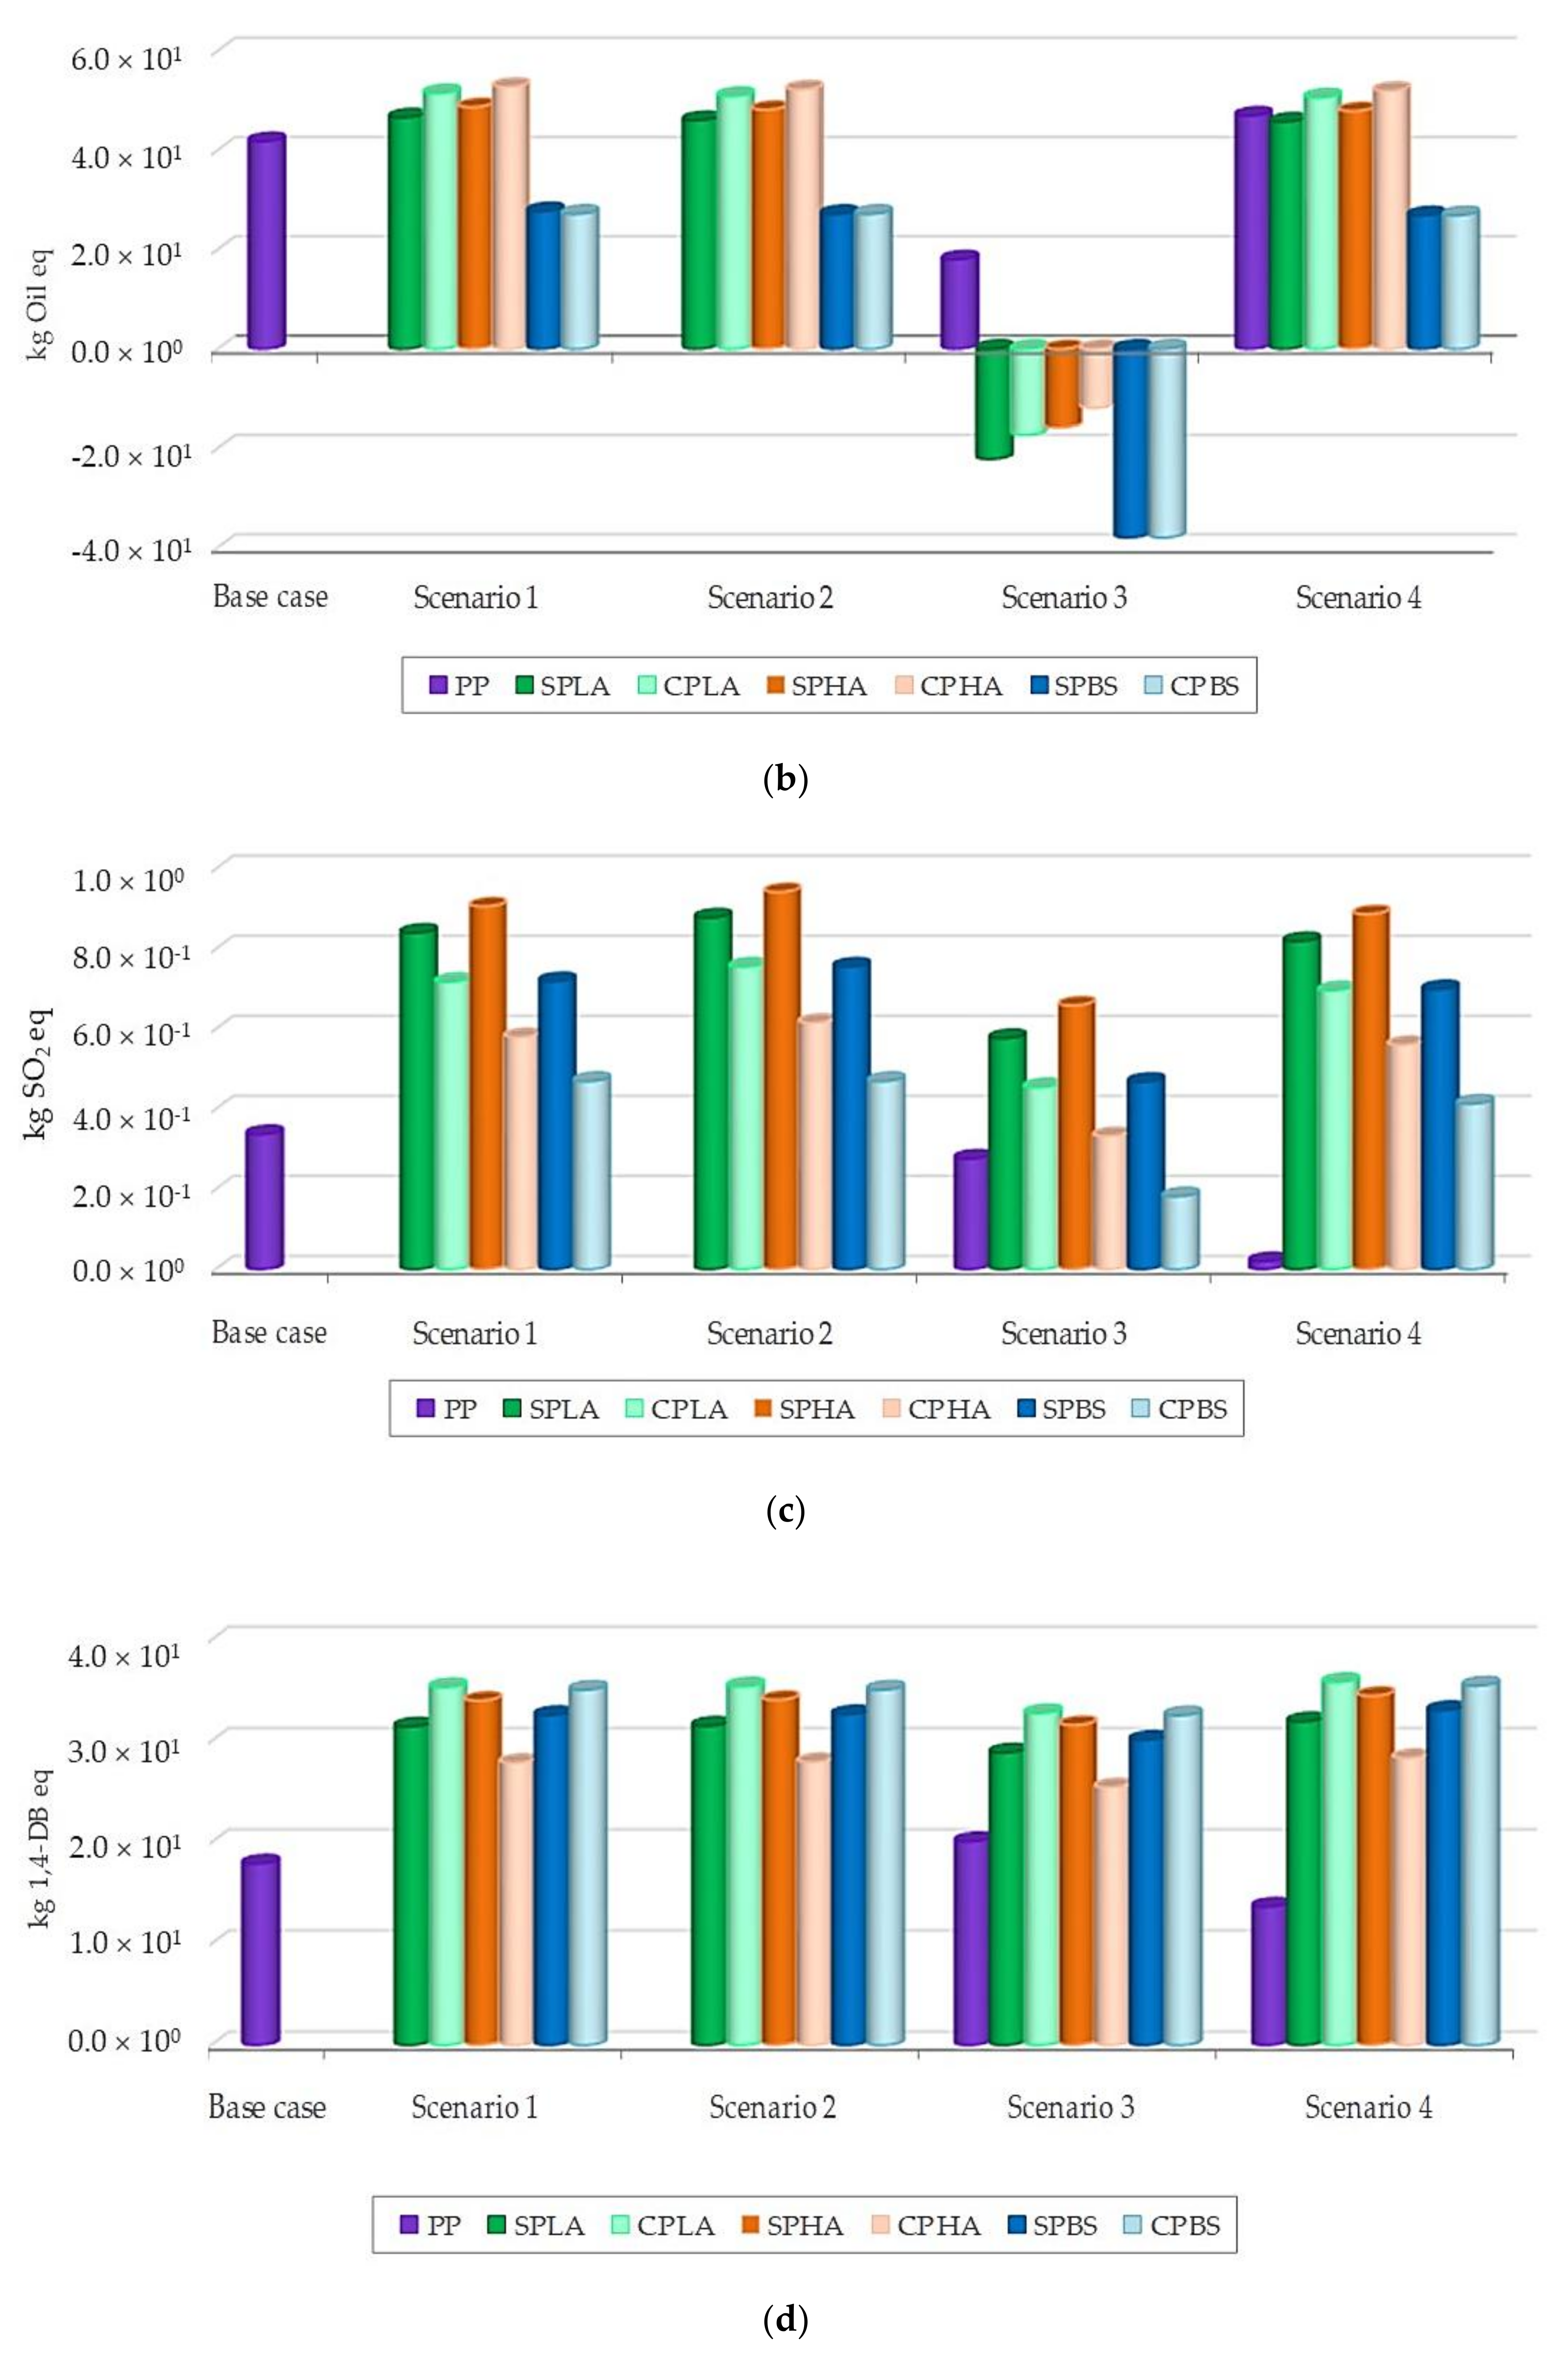

Figure 4.
Single score environmental impacts of studied plastic boxes.
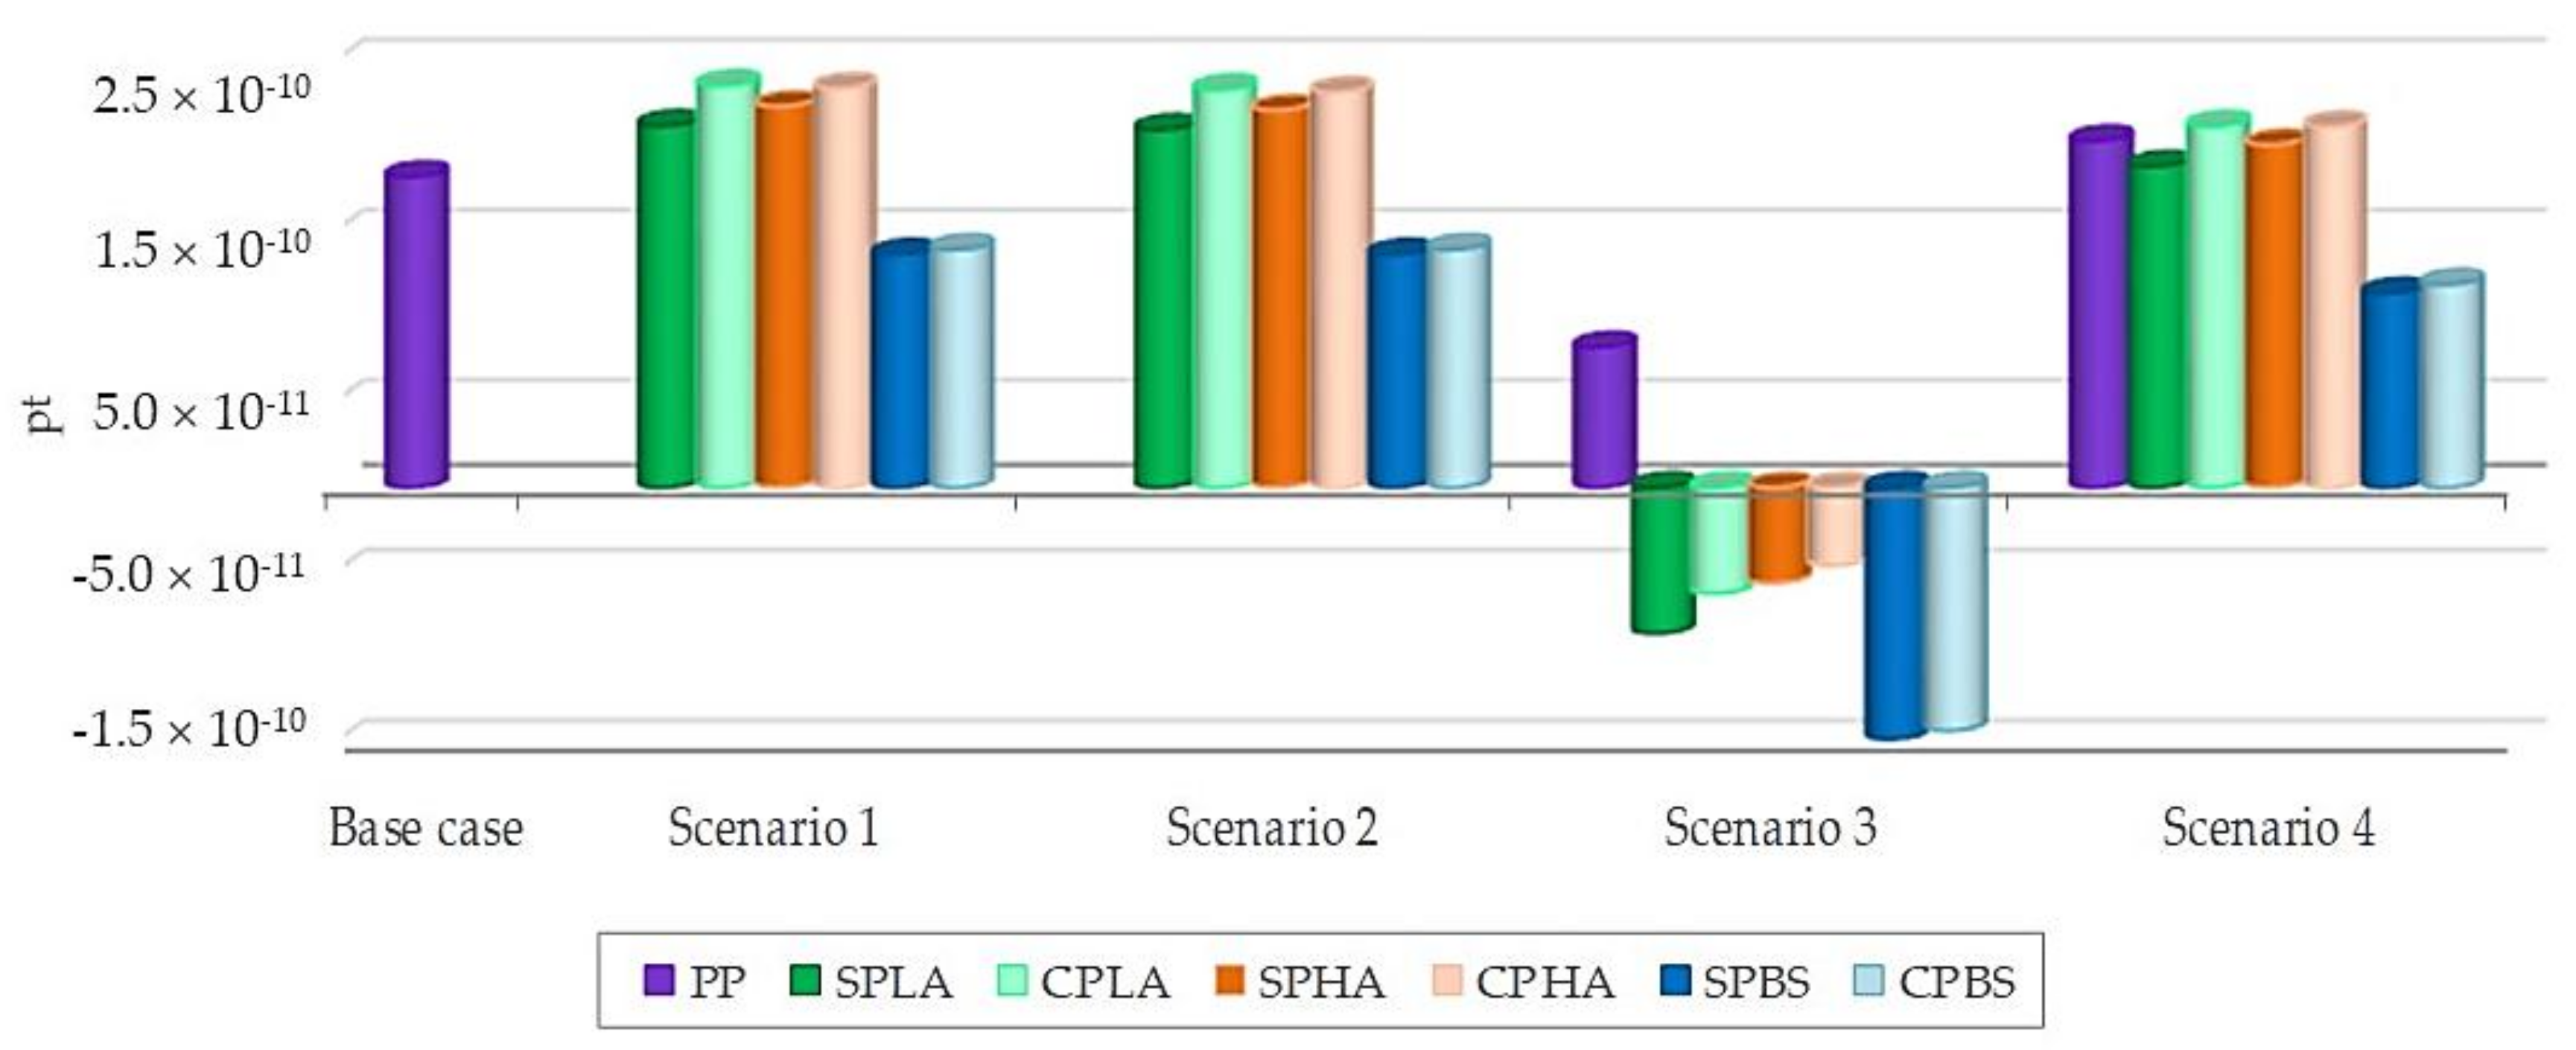
Figure 5.
Environmental profiles of the bioplastic boxes: (a) global warming potential; (b) fossil depletion potential.
Figure 5.
Environmental profiles of the bioplastic boxes: (a) global warming potential; (b) fossil depletion potential.
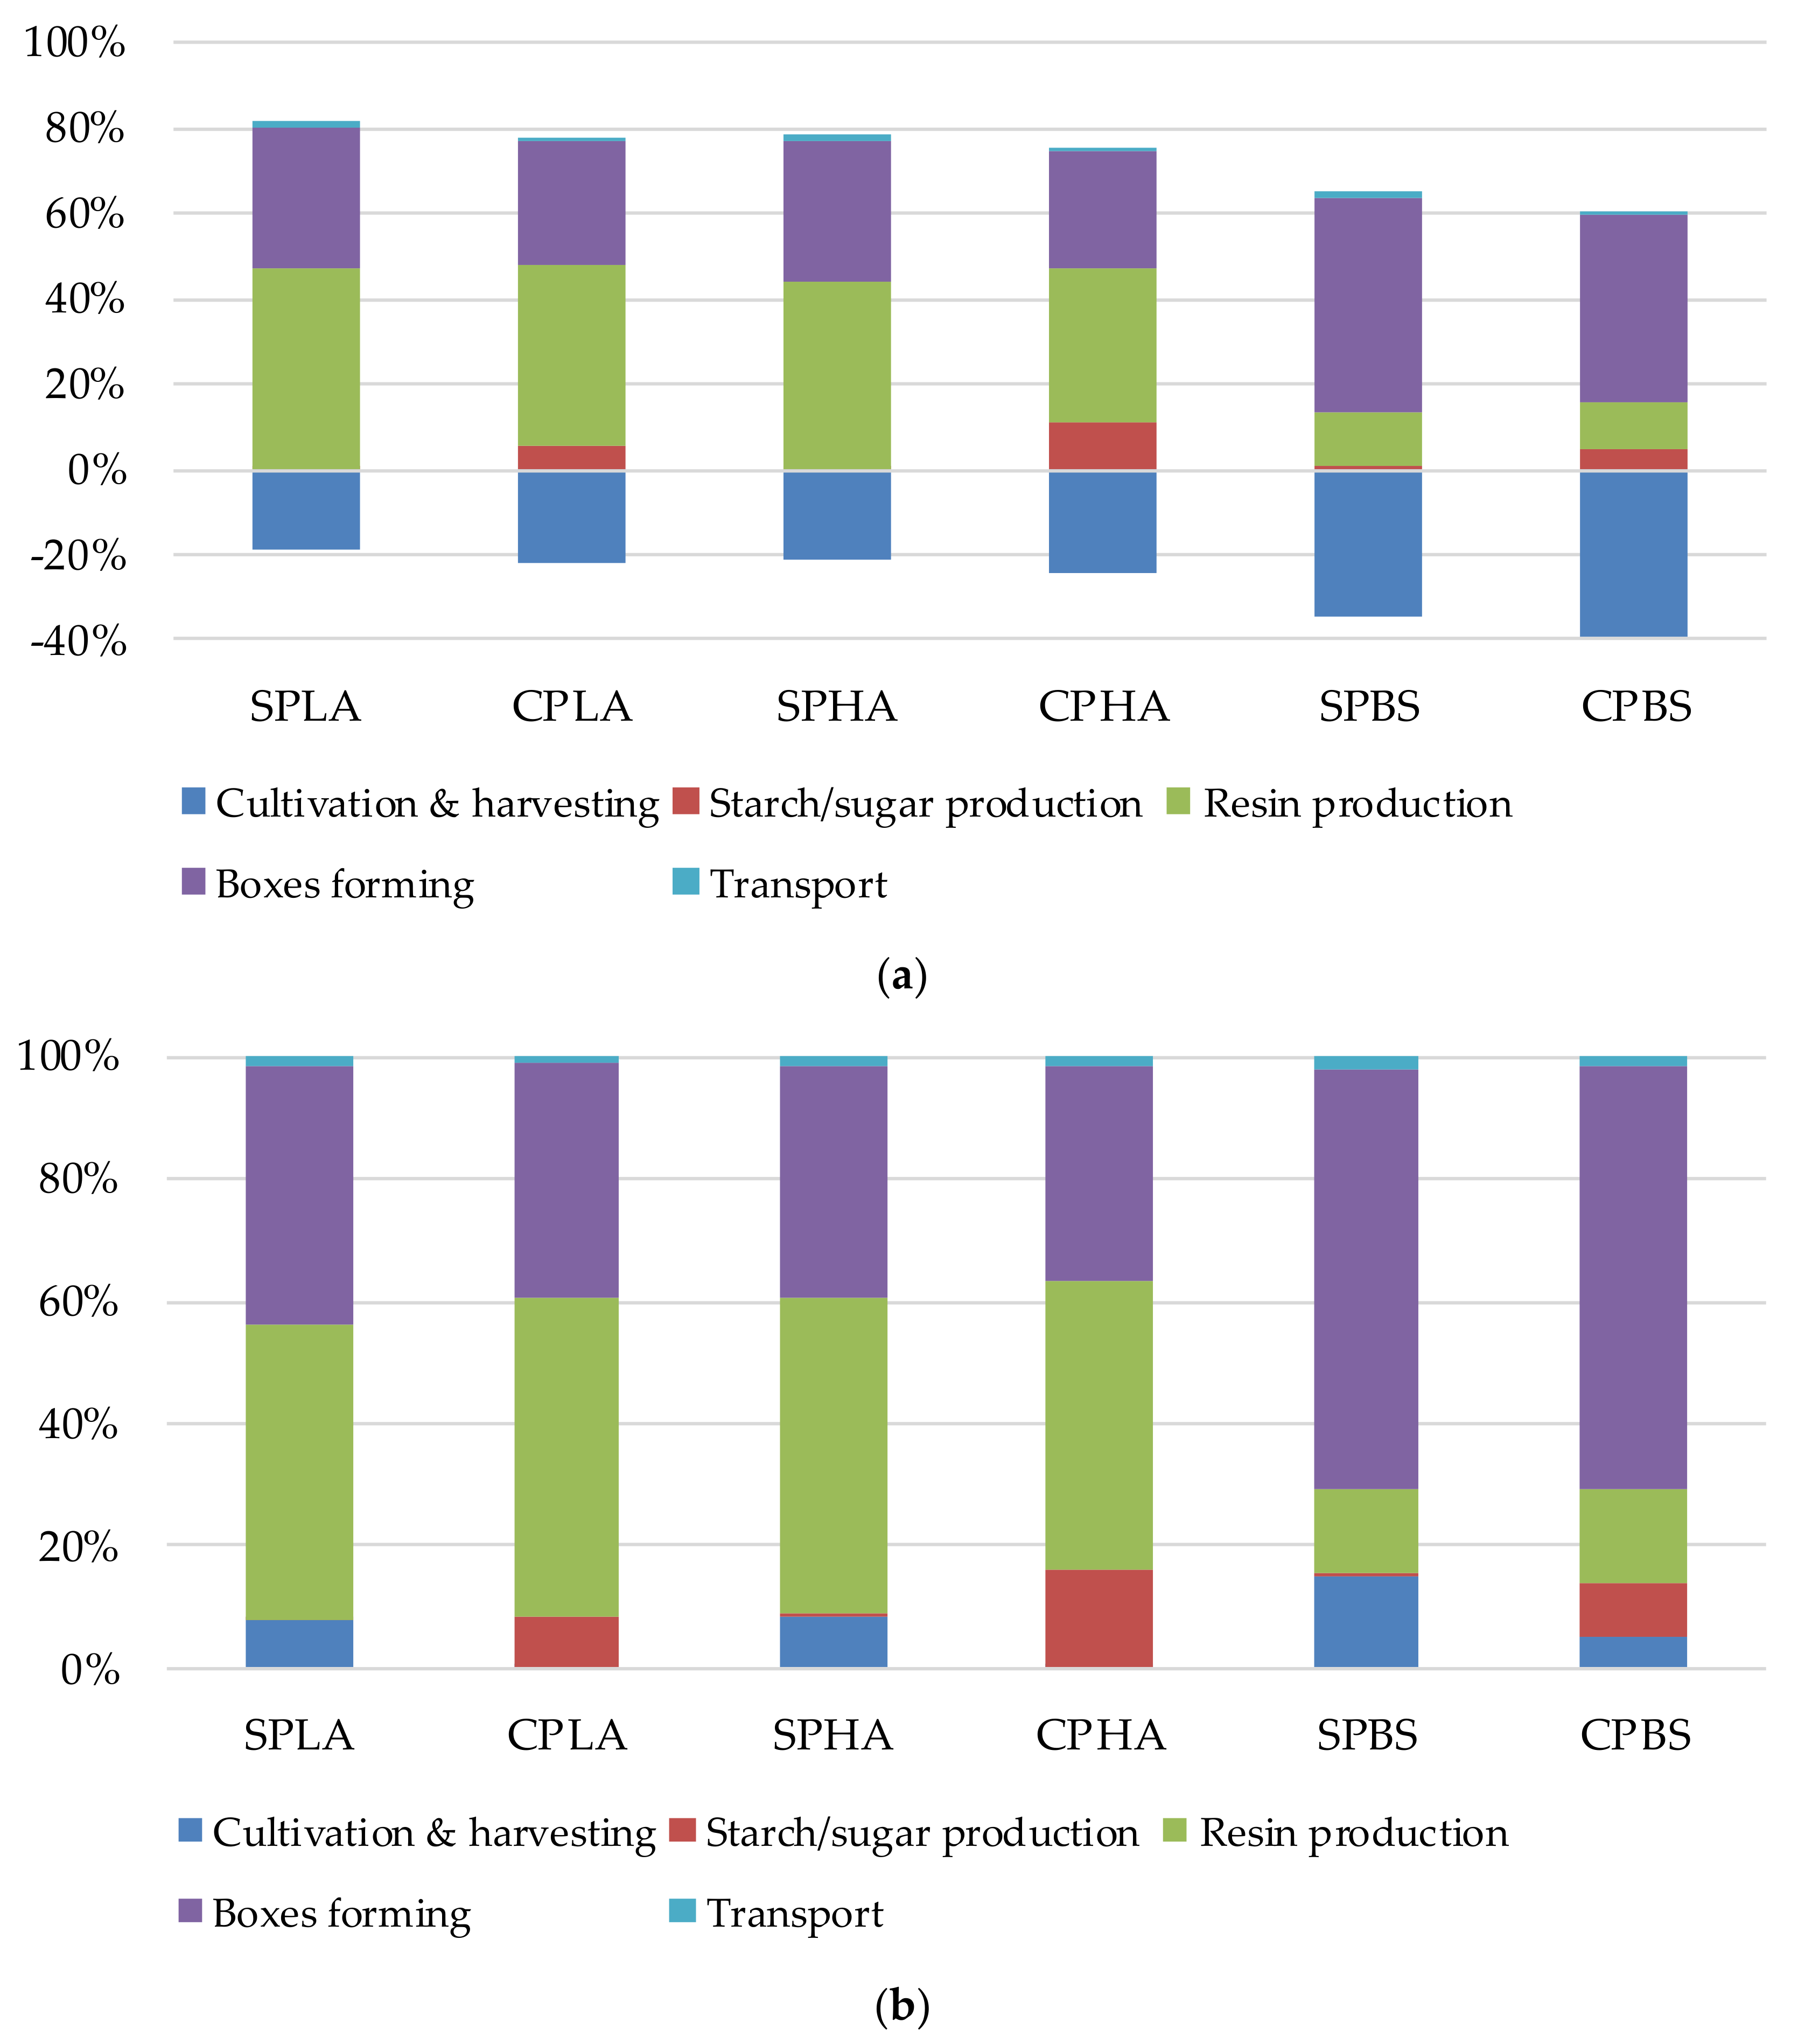
Figure 6.
Eco-efficiency of the studied plastic boxes under different end-of-life options.


Table 1.
Data sources for all stages of plastics life cycle.
| Data | Source |
|---|---|
| Sugarcane cultivation and harvesting | Pongpat et al. [26] |
| Cassava cultivation and harvesting | Kawasaki et al. [27] |
| Sugar milling | Silalertruksa et al. [28] |
| Cassava starch production | Jakrawatana et al. [29] |
| Glucose production | Papong et al. [8] |
| PLA resin production | Groot and Boren [11] |
| PHAs resin production | Khoo et al. [10] |
| PBS resin production | Charoennet et al. [30] |
| PP resin production | ecoinvent 3 database |
| Molasses based ethanol production | Silalertruksa and Gheewala [31] |
| Cassava based ethanol production | Silalertruksa et al. [29] |
| Box forming | ecoinvent 3 database |
| Road transport | Thai national life cycle inventory database |
| Landfilling | European reference life cycle database |
| Composting | ecoinvent 3 database |
| Recycling | ecoinvent 3 database |
| Waste-to-energy incineration | European reference life cycle database |
| Electricity | Thai national life cycle inventory database |
| Chemicals | ecoinvent 3 database |
Note: Polybutylene succinate (PBS); Polyhydroxyalkanoates (PHAs); Polylactic acid (PLA); Polypropylene (PP).
Table 2.
End-of-life scenarios for plastic and bioplastics.
| Scenario | Type of Plastic | Disposal (Percentage) | |||
|---|---|---|---|---|---|
| Landfilling | Composting | Recycling | Incineration | ||
| Base case | PP | 75 | - | 25 | - |
| Scenario 1 | SPLA, CPLA, SPHAs, CPHAs, SPBS, CPBS | 70 | 30 | - | - |
| Scenario 2 | SPLA, CPLA, SPHAs, CPHAs, SPBS, CPBS | - | 100 | - | - |
| Scenario 3 | PP, SPLA, CPLA, SPHAs, CPHAs, SPBS, CPBS | - | - | 100 | - |
| Scenario 4 | PP, SPLA, CPLA, SPHAs, CPHAs, SPBS, CPBS | - | - | - | 100 |
Note: Cassava-based polybutylene succinate (CPBS); Cassava-based polyhydroxyalkanoates (CPHAs); Cassava-based polylactic acid (CPLA); Polypropylene (PP); Sugarcane-based polybutylene succinate (SPBS); Sugarcane -based polyhydroxyalkanoates (SPHAs); Sugarcane -based polylactic acid (SPLA).
Table 3.
Prices and costs associated with the plastic boxes production systems.
| Item | Price/Cost |
|---|---|
| PP resin | 57 THB/kg |
| PLA resin | 93 THB/kg |
| PHAs resin | 170 THB/kg |
| PBS resin | 176 THB/kg |
| Electricity | 2.7 THB/kWh |
| Landfilling | 0.9 THB/kg |
| Composting | 0.8 THB/kg |
| Waste-to-energy incineration | 2.2 THB/kg |
| Recycling | 4.7 THB/kg |
Note: Polybutylene succinate (PBS); Polyhydroxyalkanoates (PHAs); Polylactic acid (PLA); Polypropylene (PP).
Table 4.
Eco-efficiency of plastic and bioplastics boxes.
| Scenario | Material | Environmental Impact (pt) | Environmental Impact Reduction (pt) | Cost (THB) | E/E (pt/THB) |
|---|---|---|---|---|---|
| Base case | PP | 1.83 × 10⁻¹⁰ | - | 2075 | - |
| Scenario 1 | SPLA | 2.13 × 10⁻¹⁰ | −3.01 × 10⁻¹¹ | 4634 | −6.49 × 10⁻¹⁵ |
| CPLA | 2.36 × 10⁻¹⁰ | −5.35 × 10⁻¹¹ | 4634 | −1.16 × 10⁻¹⁴ | |
| SPHA | 2.24 × 10⁻¹⁰ | −4.14 × 10⁻¹¹ | 7720 | −5.36 × 10⁻¹⁵ | |
| CPHA | 2.35 × 10⁻¹⁰ | −5.20 × 10⁻¹¹ | 7720 | −6.73 × 10⁻¹⁵ | |
| SPBS | 1.37 × 10⁻¹⁰ | 4.56 × 10⁻¹¹ | 8110 | 5.63 × 10⁻¹⁵ | |
| CPBS | 1.40 × 10⁻¹⁰ | 4.29 × 10⁻¹¹ | 8110 | 5.29 × 10⁻¹⁵ | |
| Scenario 2 | SPLA | 2.10 × 10⁻¹⁰ | −2.76 × 10⁻¹¹ | 4631 | −5.97 × 10⁻¹⁵ |
| CPLA | 2.34 × 10⁻¹⁰ | −5.11 × 10⁻¹¹ | 4631 | −1.10 × 10⁻¹⁴ | |
| SPHA | 2.22 × 10⁻¹⁰ | −3.91 × 10⁻¹¹ | 7717 | −5.07 × 10⁻¹⁵ | |
| CPHA | 2.32 × 10⁻¹⁰ | −4.97 × 10⁻¹¹ | 7717 | −6.44 × 10⁻¹⁵ | |
| SPBS | 1.37 × 10⁻¹⁰ | 4.56 × 10⁻¹¹ | 8107 | 5.63 × 10⁻¹⁵ | |
| CPBS | 1.40 × 10⁻¹⁰ | 4.29 × 10⁻¹¹ | 8107 | 5.29 × 10⁻¹⁵ | |
| Scenario 3 | PP | 8.24 × 10⁻¹¹ | 1.00 × 10⁻¹⁰ | 2166 | 4.62 × 10⁻¹⁴ |
| SPLA | −8.56 × 10⁻¹¹ | 2.68 × 10⁻¹⁰ | 4812 | 5.57 × 10⁻¹⁴ | |
| CPLA | −6.22 × 10⁻¹¹ | 2.45 × 10⁻¹⁰ | 4812 | 5.09 × 10⁻¹⁴ | |
| SPHA | −5.63 × 10⁻¹¹ | 2.39 × 10⁻¹⁰ | 7887 | 3.03 × 10⁻¹⁴ | |
| CPHA | −4.58 × 10⁻¹¹ | 2.28 × 10⁻¹⁰ | 7887 | 2.90 × 10⁻¹⁴ | |
| SPBS | −1.48 × 10⁻¹⁰ | 3.30 × 10⁻¹⁰ | 8280 | 3.99 × 10⁻¹⁴ | |
| CPBS | −1.43 × 10⁻¹⁰ | 3.25 × 10⁻¹⁰ | 8280 | 3.93 × 10⁻¹⁴ | |
| Scenario 4 | PP | 2.04 × 10⁻¹⁰ | −2.11 × 10⁻¹¹ | 2086 | −1.01 × 10⁻¹⁴ |
| SPLA | 1.89 × 10⁻¹⁰ | −6.14 × 10⁻¹² | 4696 | −1.31 × 10⁻¹⁵ | |
| CPLA | 2.12 × 10⁻¹⁰ | −2.96 × 10⁻¹¹ | 4696 | −6.31 × 10⁻¹⁵ | |
| SPHA | 2.02 × 10⁻¹⁰ | −1.89 × 10⁻¹¹ | 7778 | −2.43 × 10⁻¹⁵ | |
| CPHA | 2.12 × 10⁻¹⁰ | −2.95 × 10⁻¹¹ | 7778 | −3.79 × 10⁻¹⁵ | |
| SPBS | 1.14 × 10⁻¹⁰ | 6.85 × 10⁻¹¹ | 8169 | 8.38 × 10⁻¹⁵ | |
| CPBS | 1.19 × 10⁻¹⁰ | 6.34 × 10⁻¹¹ | 8169 | 7.76 × 10⁻¹⁵ |
Note: Cassava-based polybutylene succinate (CPBS); Cassava-based polyhydroxyalkanoates (CPHAs); Cassava-based polylactic acid (CPLA); Polypropylene (PP); Sugarcane-based polybutylene succinate (SPBS); Sugarcane -based polyhydroxyalkanoates (SPHAs); Sugarcane -based polylactic acid (SPLA).
© 2018 by the authors. Licensee MDPI, Basel, Switzerland. This article is an open access article distributed under the terms and conditions of the Creative Commons Attribution (CC BY) license (http://creativecommons.org/licenses/by/4.0/).
Share and Cite
MDPI and ACS Style
Changwichan, K.; Silalertruksa, T.; Gheewala, S.H. Eco-Efficiency Assessment of Bioplastics Production Systems and End-of-Life Options. Sustainability 2018, 10, 952. https://doi.org/10.3390/su10040952
AMA Style
Changwichan K, Silalertruksa T, Gheewala SH. Eco-Efficiency Assessment of Bioplastics Production Systems and End-of-Life Options. Sustainability. 2018; 10(4):952. https://doi.org/10.3390/su10040952
Chicago/Turabian StyleChangwichan, Kunnika, Thapat Silalertruksa, and Shabbir H. Gheewala. 2018. "Eco-Efficiency Assessment of Bioplastics Production Systems and End-of-Life Options" Sustainability 10, no. 4: 952. https://doi.org/10.3390/su10040952
Note that from the first issue of 2016, this journal uses article numbers instead of page numbers. See further details here.