The Economic Valuation of Change in the Quality of Rural Tourism Resources: Choice Experiment Approaches


Department of Sustainable Development Research, Korea Environment Institute, Sejong 30147, Korea
Sustainability 2018, 10(4), 959; https://doi.org/10.3390/su10040959
Submission received: 2 February 2018
/
Revised: 22 March 2018
/
Accepted: 23 March 2018
/
Published: 26 March 2018
(This article belongs to the Special Issue Developing Tourism in Rural and Agricultural Regions)
Abstract
:This study examined tourists’ preferences for the change in the quality of rural tourism resources in Korea. This study measured tourists’ satisfaction levels about their recent tourism experience in a stated preference mechanism to estimate the economic value of qualitative improvement associated with tourism resources. Using a pivot-style experimental design approach in developing the choice experiment, this study estimated econometric models that allow for flexible structures in error components of the utility function. The results revealed that the welfare impacts of increase in satisfaction levels for tourism resources appear to be substantial. Among tourism resources, the households are more sensitive for the change in the quality of local amenities than other tourism resources. Total aggregated benefits generated by the improvement of satisfaction levels for local amenities make up 17.9–18.1% of the total tourism costs. This suggests that the continuous efforts to enhance the quality of tourism resources in rural areas and attract and satisfy rural tourists are important and necessary for the sustainability of rural economies.
1. Introduction
Rural tourism can be defined as a wide range of attractions and activities that the visitors directly experience in agricultural or rural areas including farm-based, sport and health, hunting and angling, educational travel, arts and heritage tourism [1]. Previous studies have found that rural tourism generates a variety of potential benefits such as employment growth, repopulation, and social improvement which results in rural socio-economic revitalization [2]. Consequently, rural tourism has been supported by national and local governments around the globe. Western countries such as Portugal and France [3], Eastern Europe including former Soviet nations [4], and many developing countries—such as those in sub-Saharan Africa, Asia, and South America [5]—have, for example, implemented nationwide development projects to increase the effectiveness of rural tourism activities. It is, in this respect, evident that rural tourism as a key mechanism for economic growth can significantly contribute to an increase in rural communities’ incomes [6].
In South Korea, the rural areas have been recently faced with increasing uncertainty and dynamic changes due to the agricultural market opening, aging and decline in rural population, damage to rural natural resources, and reduction in farm household income. In particular, the roles of the rural environment have increasingly shifted away from economic function (provision of food resources) towards public value promotion such as natural and environmental function (maintaining ecosystems, prevention of natural disasters, environmental preservation) and socio-cultural function (provision of rest or recreation and educational spaces, preservation of traditional cultural heritage, fostering of emotion). The urban environment is also complex and changing fast along with improvements in living standards due to increasing income. In addition to increasing consumers’ demand for agricultural (environment-friendly/organic) products, their tourism patterns are varying such as theme tourism including nature, adventure, and culture seeking types [7].
In these circumstances, rural tourism could be a vital vehicle to (1) offer a possible solution to the rural areas’ problems related to loss in economic opportunities and reduction in population and (2) provide places to play for relatively wealthy urban citizens who want to have enjoyment from varied (technological and resource-intensive) activities. Muresan et al. [8] and Giannakis [9] examined important effects of rural tourism on the rural economic development. They found that rural dwellers deem tourism to be a sustainable rural development instrument and to have a significant role in improving local economy. Dashper [6] stated that tourists (or urban residents) are important stakeholders in rural tourism development and their demand for more satisfactory experiences has significantly affected how the local tourism industry has been developed over recent years.
Due to the increased recognition of importance of rural tourism the Korean government has, since 2012, promoted policies that further enhance the rural economy via rural tourism, namely the Act on Fostering and Supporting Rural Convergence Industry. Supported by this act, rural communities which have plentiful tourism resources are provided with various supporting systems for systematic tourism planning in order to revitalize those local areas [10]. Nevertheless, rural tourism has frequently been found to under-deliver with regard to expected economic benefits. Rural communities often lack the experience required to successfully attract and satisfy tourists through their tourism resources such as amenities, attractions, shows/festivals/adventures, and specialties [3].
The examination of tourists’ satisfaction for tourism resources is crucial to assess the trends and prospects of the tourism industry. Understanding tourists’ perceived satisfaction in rural tourism experiences is important to enhance the sustainability of rural tourism in terms of economic aspects based on the following. Tourists’ satisfaction levels can have an influence on their subsequent behavior such as revisitation and recommendation of areas they visited to others [11]. Previous studies identified the positive influence of tourists’ satisfaction on the likelihood of their revisitation or recommendation [12]. The improvement of the quality of tourism services can lead to an increase in loyal customers and attract new customers. This can result in generating more wealth and income in rural areas by means of enhancing sales of local products and farm profits since the creation of regional income relies on how well the quality of tourism services is managed in tourism sites. Shin et al. [10] investigated the economic effect of rural tourism membership on a rise in sales of agricultural products. However, few studies have, to my knowledge, been conducted focusing on rural tourism choice in the perspective of a socio-economic preference in South Korea. In this context, this study attempts to estimate the economic impact of change in tourists’ satisfaction for rural tourism resources using a pivot-style choice experimental (CE) design approach. In addition, this study also contributes to restricted tourism and leisure studies based on rural areas using the CE approach in South Korea. This study, in particular, focuses on a welfare-economic CE study that describes tourists’ satisfaction with respect to various tourism resources.
This paper makes contributions to tourism literature based on the following aspects. First, this study utilized the tourists’ perceptions about the various tourism resources as a mechanism to estimate economic impact of change in the quality of tourism resources. With respect to the empirical contribution, this study employed a pivot-style experimental design to present the attribute levels of the alternatives in the choice tasks in developing choice experiments. This design approach has been recently used in other choice literature but few studies have examined econometric issues that may arise through use of the pivot-style design described by Hess and Rose [13]. Specifically, this paper examines systematic differences in unobserved parts of the utility function (i.e., error terms) between alternatives.
The next section reviews related literature that applied the stated CE method in tourism and leisure studies. Section 3 presents methodology including the applied method and experimental design, survey questionnaire, data acquisition, and empirical analysis. Section 4 outlines estimation results and welfare measures. This study closes with brief conclusions.
2. Review of Related Literature
Using a stated CE method, Boxall and Macnab [14] administered a survey to Saskatchewan moose hunters and wildlife viewers and investigated how they choose among hypothetical forest management plans proposed by the Saskatchewan Forest Habitat Project. They found that preferences for the attributes related to moose hunting experience differ between hunters and viewers. With respect to forest management schemes which provide many benefits to wildlife species, their results indicated a more important role of passive-use values than use values.
Hearne and Salinas [15] examined both domestic and foreign tourists’ preferences for ecotourism development in Costa Rica using CE. The result of the study indicated that both tourist groups preferred sets of attributes such as improved infrastructure, aerial trams with observation towers and picnic areas, more tour information, and low entrance fees. They also expressed that CE approaches are useful methods for the examination of tourist preferences.
Similar to Hearne and Salinas [15], Hearne and Santos [16] conducted a CE survey to investigate the stakeholders’ preference for alternative ecotourism scenario in the Maya Biosphere Reserve, Guatemala. The results show that foreign tourists and local residents have unequal but similar preference orderings for attributes such as enhanced national park management and the hire of guides for wildlife viewing.
Naidoo and Adamowicz [17] examined biodiversity and nature-based tourism at forest reserves in Uganda. Using a CE survey targeting tourists and foreign residents in Uganda, this study aimed to discover how preferences for particular forest reserves are formed. The main results indicated that when the number of bird species increases in a reserve tourists increase their willingness to visit a protected area, holding other factors constant.
Biénabe and Hearne [18] investigated the preferences of foreign tourists and Costa Ricans for the increased levels of nature conservation and scenic beauty supported by payment for environmental services (PES). Based on the nested logit model, they found that both groups of respondents are in favor of increasing PESs to improve both nature conservation and scenic beauty. Because of the existence value of nature, the willingness to pay (WTP) for the nature conservation PES was estimated to be greater than that for scenic beauty.
Albaladejo-Pina and Díaz-Delfa [19] evaluated potential or effective attributes associated with rural house stays in Spain using discrete choice methods. They used five factors that affect tourists’ preferences for rural houses such as house size, type of building, quality of equipment, services, and activities. The study provided valuable information, regarding marketing planning and investment decisions, to promoters and home owners.
Crouch et al. [20] studied potential consumer responses to a variety of options appearing in the initial space tourism industry through stated preference choice experiments. They found that the consumers’ preference for the type of space tourism is determined according to their characteristics as well as the type of flight options.
Chaminuka et al. [21] estimated marginal willingness to pay (MWTP) for ecotourism in Kruger National Park (KNP). The data collected from 319 tourists through the choice experiment survey were analyzed using a conditional probit model. The results show that, at all income classes, the MWTP was negative for accommodation, but positive for village tours and craft markets. It was even much higher than fees proposed for village tours among international and high income classes of tourists.
Giergiczny et al. [22] indicated that respondents prefer older stands with vertical layering, irregularly spaced trees, and greater number of tree species for forest structural attributes. Moreover, forests managed for biodiversity purposes are likely to be attractive to humans. They stated that since people prefer biodiversity, forest management should be designed to protect biodiversity.
Tran et al. [23] estimated the tourists’ preferences (WTP) for ecotourism services and biodiversity conservation in a protected area in Vietnam. The results show that tourists have interest in ecotourism and want to enjoy it. Since they are willing to donate for biodiversity conservation activities in the protected area, WTP for ecotourism service is also quite high.
Lee and Yoo [24] valued the attributes of cruise tourism through the application of a choice experiment. The MWTP was, in this study, elicited by using attributes of cruise tourism such as duration, cost, service, and accommodation. Depending on the levels of ocean views and on-board services, the MWTP was estimated to be $954.8 and $584.9 respectively. In addition, they also found that tourists prefer on-board activities most above all other attributes.
Hio-Jung et al. [10] examined households’ preferences for rural tourism experience in association with sales of local agricultural products. Using a choice experiment method developed by experimental designs, they examined households’ preferences to trade off purchasing costs of local agricultural products against various benefits provided by the rural tourism membership.
Recently, Cho et al. [11] examined the factors affecting tourists’ satisfaction and their impact on the likelihood of revisitation and recommendation using a Korean Case Study. They found that physical infrastructure, service quality, and satisfaction level with tour programs have more influence on tourists’ overall satisfaction while tourists’ revisitation and recommendation to others was more affected by the quality of services. They suggested that the improvement of service quality can contribute to invigorating domestic tourism.
Zong et al. [25] estimated the economic value of various community-based ecotourism programs in a Taiwan forest park using a choice experiment method. Their results suggested that, to improve the quality of tour programs related to community-based ecotourism in the forest park, it is important to focus on providing program participants with unique and profound experiences. The best program scenarios, they found, involved small groups enjoying high quality and deeply experiential activities. For policy implications, the local residents and other stakeholders should be encouraged to implement new types of tour packages which should reflect tourists’ various needs.
Choi et al. [26] investigated the important factors affecting service quality associated with rural accommodations in Korean rural tourism villages. Applying importance–performance analysis (IPA), they found that 11 attributes out of 18 service attributes, 11 service attributes are estimated to be high performance and high importance attributes that are performing well and that the tourists are more likely to emphasize. Based on the gap analysis, all of the 18 service attributes were evaluated to satisfy consumer expectations. In addition, based on the combination of IPA and Gap analysis, they found that visitors have more satisfaction when they satisfied with the attributes they perceived more important than those they perceived less. This result suggested that, to improve service qualities, priority should be given to the attributes which have larger variances between importance and performance.
3. Methodology
3.1. Rural Tourism in Korea
According to Ministry of Agriculture, Food and Rural Affairs (MAFRA), the number of rural tourism villages designated was estimated be about 840 in 2014 while the number of accommodation units available in these villages was estimated to be about 25,196. In addition, 1214 of local festival/show/events were held in the rural areas in 2014 and about 730 local specialties were available for the tourists to purchase in the rural tourism in 2014.
Since 2010, the demand for rural tourism in Korea has steadily increased as urban household incomes increase and average working hours decrease. According to the 2014 Fact-Finding Survey on Rural Tourism provided by Rural Development Administration, 21.5% of urban residents are familiar with rural tourism while it was only 10.1% in 2003. With respect to rural tourism experiences, 27.0% of urban people have experienced rural tourism before, having increased by 17.0% compared to 2003. Furthermore, 65.3% were willing to experience rural tourism in the near future while it was only 43.4% in 2003. With regards to satisfaction levels, the satisfaction levels that urban residents experienced in the rural tourism were lower than those experienced in other tourism cases. In particular, most of urban residents were unsatisfied with the quality of services associated with local amenities and with the management of inconveniences at local festival/show/events [27].
3.2. Methods and Experimental Design
Choice experiments, which are one of the most common stated preference methods (SPMs), aim to estimate economic values for attributes of an environmental good/service in which the environmental good/service comprises several attributes, including price- or cost-related attributes [28]. In choice experiments, the respondents are presented with choice alternatives in which each choice alternative consists of different levels of attributes and asked to choose one of the alternatives that maximize their utility. Compared to other SPMs, the main advantage of a choice experiment would be associated with its ability to provide respondents with a sequence of choice scenarios. The CE approach has been particularly useful for valuation problems where the actual attributes are of an insufficient range to allow for policy analysis or where new attributes are being considered that do not currently exist in actual markets. In these circumstances, stated preference data obtained from a CE setting can be used to identify households’ preferences with respect to various changes in attribute levels and to assess the welfare changes for policy analysis.
This study uses a pivot-style (or reference) design approach in order to develop rural tourism choice experiments. In this pivot-style choice experimental design approach, attribute levels are drawn based on specific experience or knowledge of respective respondents [13,29]. Choice alternatives associated with the combination of tourism attributes are given to the respondents. Among the choice alternatives, one is related to the status quo which serves as the reference alternative. The rest are associated with new and hypothetical alternatives in which attribute levels are altered from the reference alternative. In accordance with individual respondents’ current situation (or reference levels), they are, in other words, confronted with customized choice scenarios. Kim et al. [30] stated that the pivot-style design method has a distinct feature from other design approaches in generating choice sets. Rose et al. [29] also mentioned that there are many benefits to the use of the pivot-style design as respondents are allowed to disclose their preferences more effectively. This is based on support of multiple theories, e.g., prospect theory, case-based decision theory, and minimum-regret theory.
This study applies five rural tourism attributes in the process of developing rural tourism choice experiments. Table 1 shows the set of attributes and their levels employed for the generation of choice alternatives. The selection of the relevant attributes and their levels was, in general, based on a search of the previous literature. However, there is a limit to the literature investigation. This is because there are very few academic studies which evaluated tourists’ satisfaction in terms of tourism resources based on their recent tourism experience using the choice experiment approach. In this case, as explained by Champ et al. [28], a focus group meeting with rural tourism experts and a representative of households can be helpful to identify important attributes. For a more detailed description regarding attribute identification, please refer to page 139 in Champ et al. [28]. Conversations with the focus group participants can be an effective way to choose relevant attributes and levels since they can provide useful information on whether or not the attributes being considered are appropriate.
This study, thus, had a focus group meeting and consulted experts on rural tourism in order to select attributes and their levels. In the survey, individual respondents are provided with the respective levels of attributes which are relevant to or completely different from ones related with their status quo. The focus group participants expressed in general a similar opinion that while staying and visiting famous tourist attractions available in tourism attractions, rural tourists would also be likely to enjoy local festival/show/events and purchase regional specialty goods.
The five rural tourism attributes chosen in this study are defined as follows. Local amenities represent restaurants, accommodations, tourist information centers, and public restrooms that respondents experienced during rural tourism. Local tourist attractions signify all tourism resources that exist in rural areas such as natural resources including mountains, rivers, and seas; cultural resources involving historical sites, museums, etc.; and social resources including local communities’ interests, living culture, history, and customs. Local festivals/shows/experiences indicates all events held in rural areas such as culture and art performances, local festivals, leisure sports, etc. Local specialties represents agricultural products, traditional liquor, and local souvenirs that the respondents purchased during rural tourism. Tourism costs imply all the expenses spent for the purchase of food, fuel, toll gates, and accommodations during rural tourism.
The five chosen rural tourism attributes—local amenities, tourist attractions, local festivals/shows/experiences, local specialties, and tourism costs—were designed to remain the same or to increase or decrease by 30% compared to each respondent’s satisfaction scores from each attribute. The specification of these attributes’ levels is also assisted by results from the focus group interview and consultation with experts on rural tourism. This indicates that a respondent who had experience with rural tourism could comprehend whether levels of the rural tourism satisfaction as a result of change in attribute levels are better or worse.
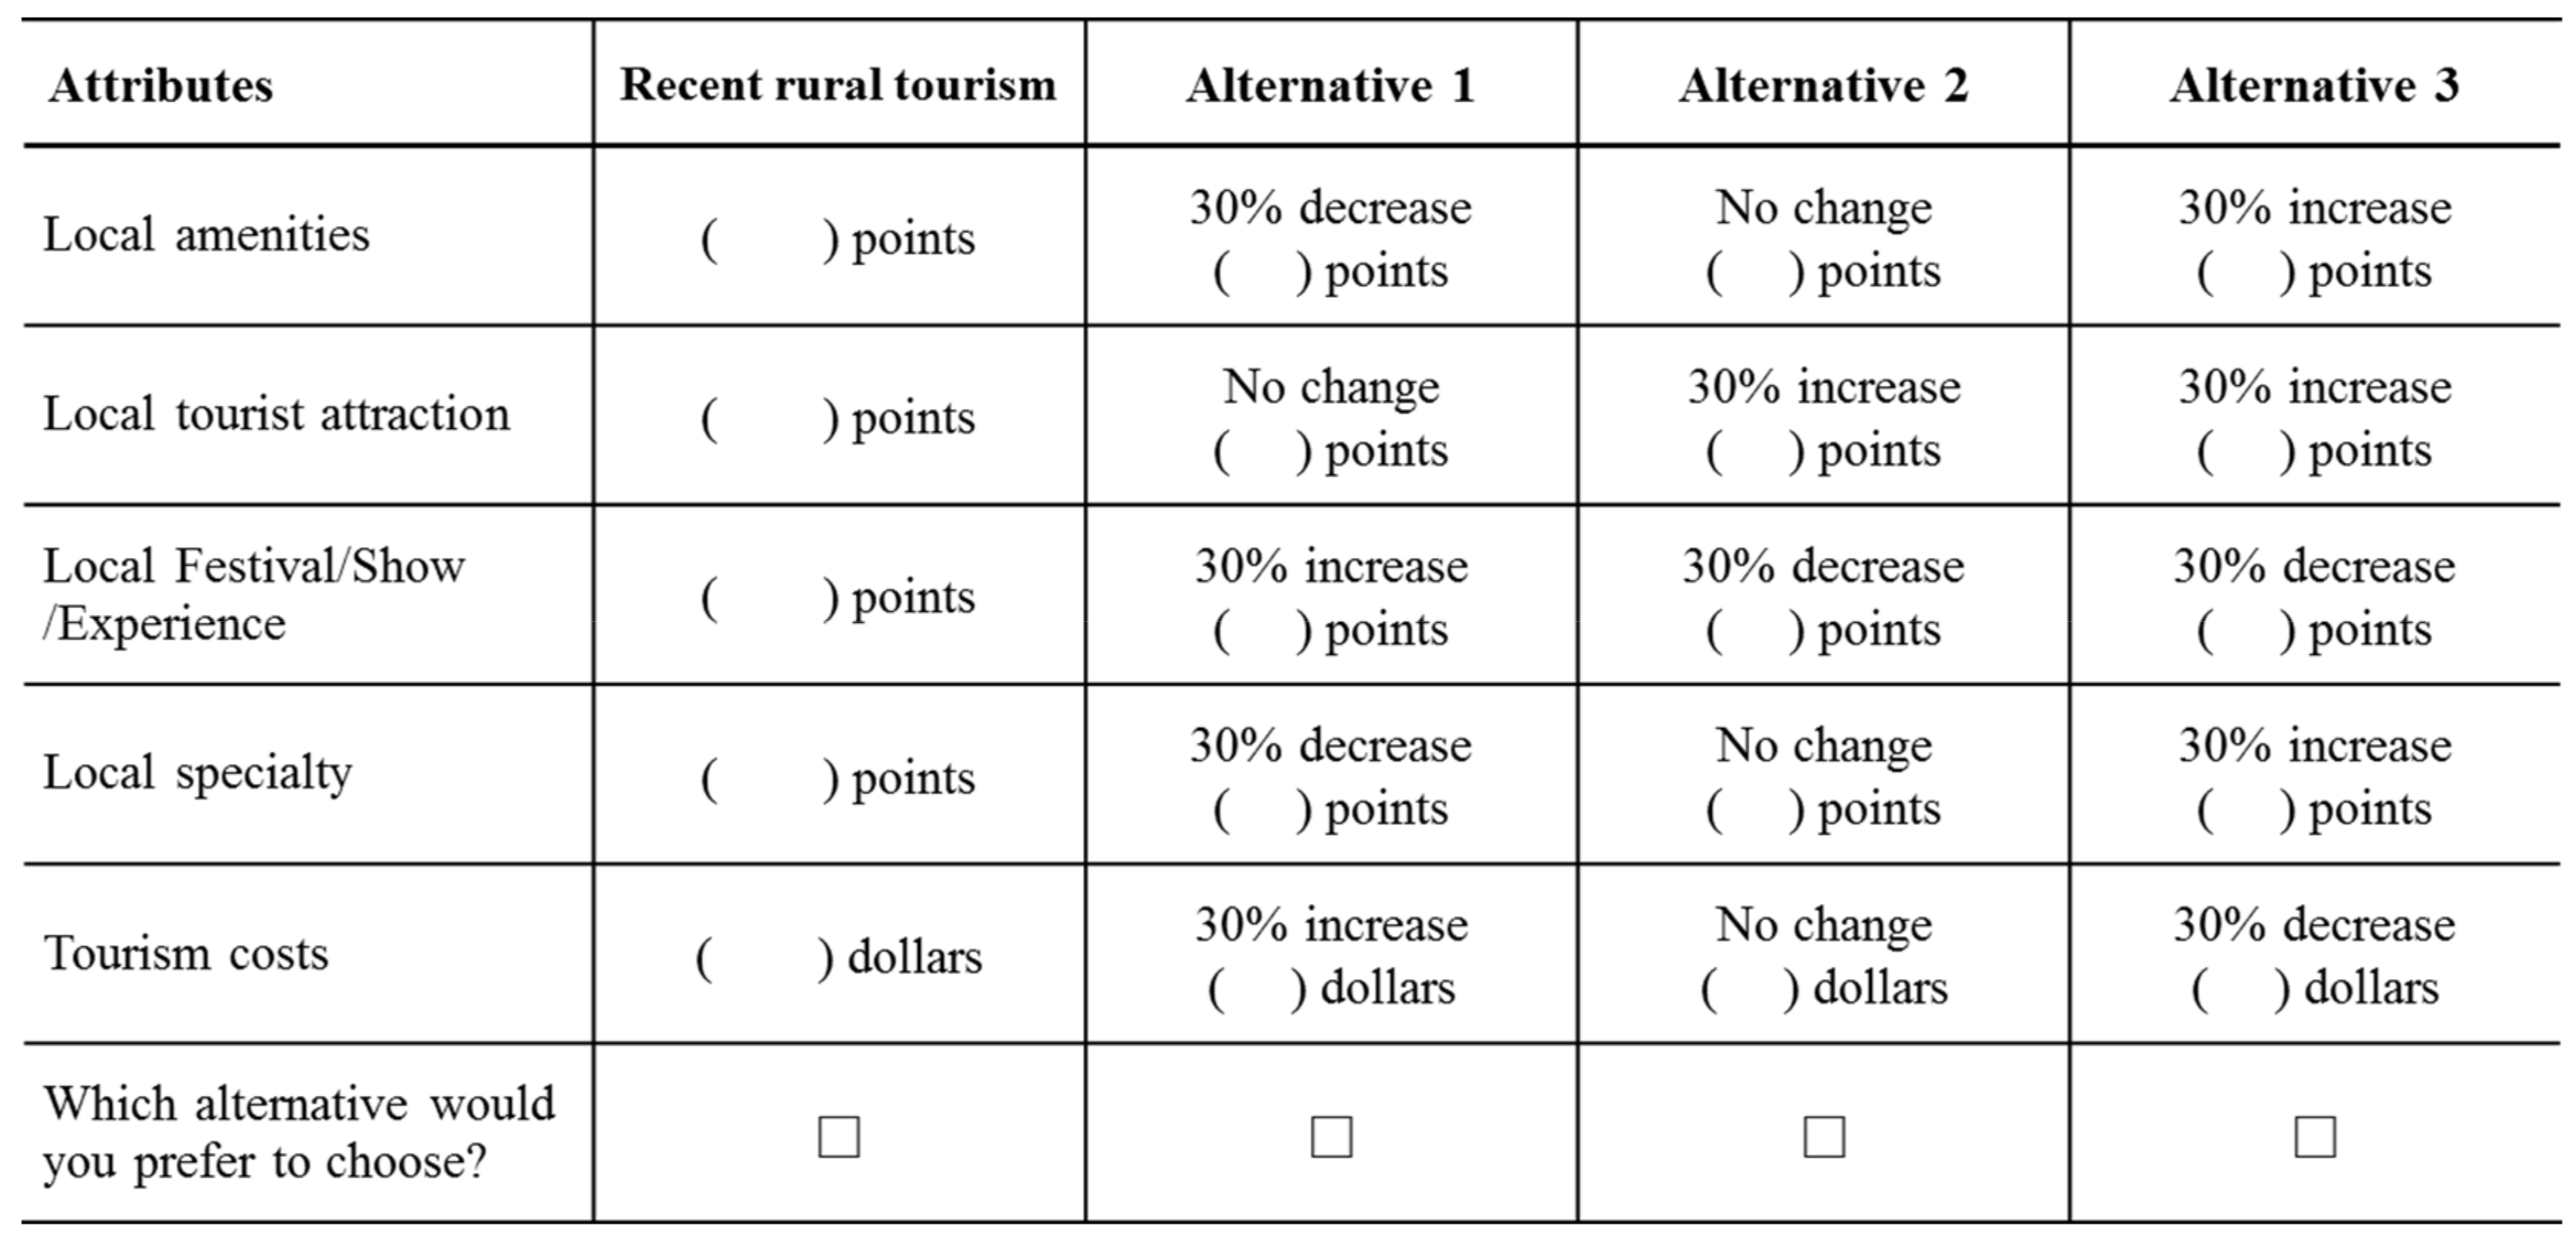
In this set of attributes and their levels, this study applied statistical design techniques with three hypothetical choice alternatives in order to form choice sets. It is possible that a universe of 35 × 35 × 35 combinations is made by the set of attributes and levels. The formation of the choice sets can be considered as sampling from this universe of the rural tourism satisfaction alternatives. A total 27 choice sets divided into 9 sets of 3 were generated by the resulting sample. In the survey, respondents are provided with the respective nine sets which are equally distributed and presented to them, which means three pairs of alternative descriptions of rural tourism are, thus, presented to each of the respondents. Figure 1 shows an example of one of the resulting choice sets.
In this study, respondents indicate satisfaction scores for their recent rural tourism experience on a scale of 0 to 100 points. On the basis of respondents’ satisfaction scores served as the reference alternative, the levels of each attribute in hypothetical alternatives are depicted as percentage changes compared to those in the reference alternative. The respondents were asked to select one of the four alternatives (recent rural tourism, Alternative 1, Alternative 2, Alternative 3). This process is repeated three times in the choice tasks in which hypothetical alternatives in each choice task are composed of different satisfaction levels of tourism attributes.
3.3. Survey Questionnaire
This study aims to estimate the economic value of improvements in rural tourism services. A questionnaire consisting of four components and each component was designed as follows: The first component consisted of basic questions that aimed to elicit the information regarding respondents’ experience and overall satisfaction on their recent rural tourism. The second component included a few questions such as the purpose of rural tourism and activities during the trip, which was used as reference to select tourism attributes, rural areas most frequently visited, willingness to revisit the areas that respondents had already visited, and willingness to recommend to others. In the third component, the respondents were first asked to reveal their satisfaction level on a scale of 0 to 100 points for each tourism attribute, namely local amenities, local tourist attractions, local festivals/shows/events, local specialties, as well as tourism costs. Based on their inputs, this study then asked them to make a choice between possible alternative tourism options—their recent rural tourism experience and hypothetical tourism alternatives in which some of satisfaction levels of the tourism attributes are different from their recent tourism. The last component asked respondents to fill in their demographic characteristics such as sex, age, residence, education, and household income.
Before implementing the survey, this study held a focus group meeting which involved a panel of rural tourism experts from the government agency and a representative of households who had sufficient knowledge in rural tourism to validate question items in the questionnaire. Based on the feedback from the focus groups meeting, the questionnaire was revised to adjust question wording—as well as format and flow of the questions—in order to optimize responses and ensure accuracy.
3.4. Data Acquisition
This study conducted a survey of households who have experience of visiting rural areas for tourism such as hiking, water activities, local market, field trip, purchase specialties, using amenities in the last five years (from August 2010 to August 2015). Only those who reside in the survey area over the age of 19 years old were targeted for considering the characteristics of household survey. The market research survey firm Global Research Co. was in charge of recruiting survey respondents through e-mail contact. This paper used a random sampling method to ensure that each household has the same probability of being chosen. The initial contact outlined the intent and purpose of the survey and then the recipient was invited to participate. Interested participants were asked to go to a web link to obtain a login for the online survey, which was programmed and hosted by Global Research Co. Using this procedure, 800 completed answers were collected which include respondents who have the rural tourism experience in the last five years. Among these 800 answers, 377 respondents do not have experience for at least one of the rural tourism attributes. In the end, 423 respondents who had experience in all rural tourism attributes were used only for choice experiment analysis.
3.5. Empirical Analysis
In random utility theory, it is assumed that a respondent maximizes his/her utility by choosing one alternative, , which gives him/her the highest utility among a finite set of alternatives, . The stochastic utility function related to alternative can be defined as involving two components: observed utility components, , and unobservable components, . The utility function is defined as below:
where . are a set of the attributes of alternative having an alternative specific constant and the attributes displayed in Table 2. are parameters to be estimated.
In a pivot-style dataset, the attributes of the reference alternative are invariant across choice occasions for the same respondent [13]. More specifically, in the case where respondent is given four alternatives where one of which is their recent rural tourism (j = 1) and the others are hypothetical alternatives () in choice occasions the utility function () can be specified as
Note that since the attributes are held constant across replications (n) for each respondent, the observed utility components for the recent rural tourism are expressed as rather than .
This study estimated Equation (2) as a base model through use of a conditional logit model (CNL) formulation where the error terms are assumed to follow a Gumbel distribution. In other words, unobserved components of utility are independently and identically distributed (i.i.d) across the set of alternatives () and observations.
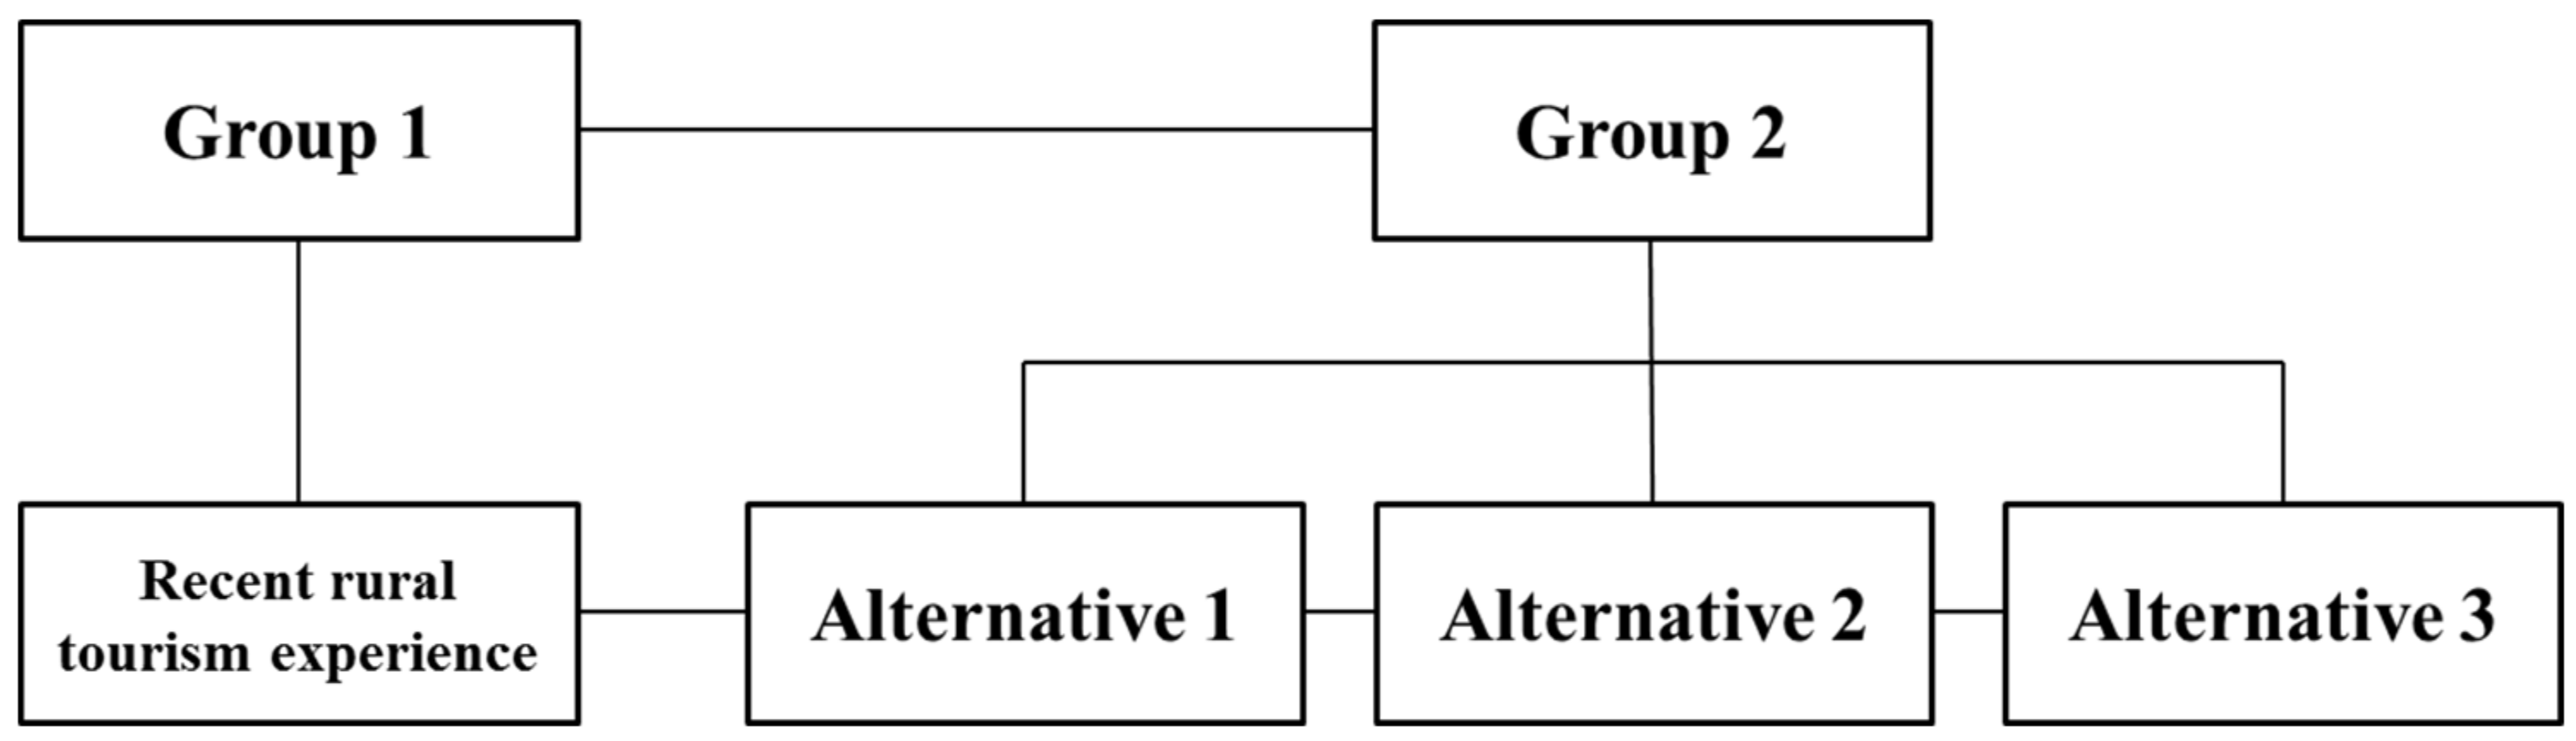
The assumptions for error terms can be, however, violated due to circumstances related to the dataset generated by pivot designs. Hypothetical alternatives are more likely to be correlated with each other than a reference alternative and a hypothetical alternative. This indicates a potential violation of the i.i.d. assumption across the alternatives [12]. Such correlations between hypothetical alternatives can be addressed through use of a nested logit (NL) model by imposing the nesting structures in Equation (2). One formulation assumes a recent tourism experience is located in Group 1 and the three hypothetical alternatives are located in Group 2. This is described in Figure 2.
Hess and Rose [13] raised another issue in relation to error terms. That is the possible violation of homoscedasticity across the alternatives. They also consider the possible existence of heteroscedasticity across alternatives, which derive from the different levels of variation in attributes between alternatives. This issue can be accommodated through an error component logit (ECL) formulation of the mixed multinomial logit model approach which introduces error components associated with the alternative specific variance in Equation (2). To take account of such heteroscedasticity, the utility functions can be re-specified as
where is the standard deviation and parameter to be estimated associated with the variance for each alternative and is the error component which has a standard normal distribution, ~N [0,1]. As discussed by Walker [31], one of the ’s should be normalized to 0, which would have the smallest variance between them. The normalization can be identified from preliminary estimation.
Table 2 provides the definition of the variables used in the rural tourism choice analysis. Note that in empirical estimation, the sq variable is a dummy variable which served as an alternative specific constant (ASC) equal to 1 for recent rural tourism and 0 for three other hypothetical alternatives. The cost variable was converted to constant 2015 price for tourism costs applying consumer price index. To incorporate an income effect, we created a categorical dummy variables denoted as low, mid, and high for three income groups which were generated based on the reported income percentiles in the sample (respondents were asked to indicate household’s income ranges rather than their actual incomes).
This study also examines the welfare measures for a change in satisfaction levels for each tourism attribute. To measure the compensating variation associated with a change in the satisfaction level, this paper considers the improvement of satisfaction levels of each tourism resource that could be expected as a result of new implementation of the rural tourism policy. In other words, rural tourism conditions regarding tourism resources in the rural areas would be better than the current situation.
The step-by-step procedures to compute welfare measures are as follows. First, this study calculates the utility levels for each household using the parameter estimates in Table 5 and the corresponding attribute levels which represent the current situation. Second, the utility levels for each individual are recalculated by changing the attribute level; a 10% increase in each respondent’s satisfaction level. Finally, the compensating variation (CV) is computed as dividing the difference of utility values between two situations by the marginal utility of income. An expression for CV in this case is
where i = low, middle, and high income households and superscript 1 and 0 denote the hypothetical and reference situations, respectively. Note that the difference of utility values for attribute k in Equation (4) is equal to
where k = amenity, attraction, festival, specialty.
4. Results
4.1. Socio-Demographic Characteristics and Trip Profiles of Respondents
The socio-demographic characteristics and trip profiles of respondents who had rural tourism experience in the last five years are summarized in Table 3. It is verified that there were more females in the sample than males. For household annual incomes, about 43% of respondents earned between US $40,000 and US $69,999, and the second largest group belonged to households with an annual income under US $40,000. Of 423 answers, 47.5% of the households were aged 50 and above; the second largest age group were in their 40s. In terms of residence, about 51% of the respondents resided in Seoul, Incheon, and Gyeonggi area and the second largest group were Gyeongsang area. We also asked respondents about each attribute satisfaction score for their rural tourism experience and recent tourism costs. Average satisfaction for each attribute was 65.4 for amenities, 70.1 for tourist attractions, 66.8 for festivals/shows/experiences, and 69.3 for specialties. With respect to tourism costs, the household spent on average about US $291.4 per rural trip.
The results of the survey on the purposes and activities enjoyed in rural tourism are shown in Table 4. With respect to rural tourism purposes, the respondents chose rest (61.6%) as the most preferred tourism purpose, followed by experience of local attractions (45.3%), experience of local food (40.5%), purchase of local specialties (36.4%), leisure/historic site tours (31.1%), and enjoyment of local festivals/shows (30.9%). Similarly, rest (54.6%) was the most frequent activity that the respondents enjoyed in their rural tourism, followed by experience of local attractions (37.6%), experience of local foods (36.1%), purchase of local specialties (31.9%), leisure/enjoyment of local festivals/shows (25.9%), and visiting relatives (25.6%).
4.2. Estimation Results
All econometric model parameter estimates were estimated using maximum or simulated maximum likelihood estimation procedures using the econometric software NLOGIT 4. The results are summarized in Table 5. CNL represents the base conditional logit model which does not deal with potential concerns arising from the use of pivot-style data; NL is the nested logit model which allows for correlated error terms for the three hypothetical alternatives by grouping them together in the same nesting structure (Figure 2); and the ECL model represents an error component logit model which is specified to allow for heteroscedasticity across choice alternatives.
Parameter estimates in the CNL model follow expected signs. The sq variable is positive and statistically significant implying that all else being equal, respondents prefer their recent tourism experiences to hypothetical alternatives. The interaction terms, low*cost, med*cost, and high*cost represent the marginal utility of income for each income level. The coefficients on these variables are negative and highly significant, implying that an increase in tourism costs has a negative impact on choice. The coefficients on the variables, low*amenity, mid*amenity, and high*amenity are all negative implying that an increase in tourism amenity satisfaction has a positive influence on choice. While low*festival is statistically insignificant, mid*festival and high*festival are positive and significant implying middle and high income households are sensitive to local festival/show/event. While the high*specialty parameter is not significant, low*specialty and mid*specialty are significant with positive signs indicating that low and middle income households place a premium on local specialty.
In the NL model, Group 1 represents a recent rural tourism and the two hypothetical alternatives are assigned to Group 2. Since Group 1 contains one alternative, we took a degenerate nest into account, constraining the inclusive value (IV) parameter for Group 1 to 1. The estimated coefficients on most of the utility parameters are statistically significant and are not much different from those in the CNL model. However, the IV parameter for Group 2 is greater than one, which is not consistent with global utility maximization as discussed by Hensher et al. [32]. In such a case, one possible way to deal with this issue is to regroup alternatives in the new structures [32]. However, in our case, restructuring tree structures is not valid because the natural nesting involves one status quo alternative and three hypothetical alternatives. Thus, a NL model would not be of further merit to consider.
In the ECL model, the standard deviation for the error components for the reference alternative (recent rural tourism) was set to 0. The identification procedures for normalization were based on preliminary estimation, which exhibited the reference alternative having the smallest variance across the four alternatives. The results for the ECL model indicate that compared to the CNL model, allowing for heteroscedasticity across alternatives significantly improves the log-likelihood values as well as McFadden value. Based on a likelihood ratio test, the ECL is preferred over the CNL ((3) = 48.72, p-value = 0.000). While is statistically insignificant, the statistically significant parameter for and indicates that while the variance for the reference alternative is fixed to , the variance for the second and third hypothetical alternatives is + 0.95132 and + 1.00142, respectively. This suggests presence of heteroscedasticity. In terms of the estimated parameters in the observed components of utility, the estimated coefficients on the most of the variables are slightly higher in absolute terms than those in CNL. Note that the low*attraction variable is no longer statistically significant in ECL model. In addition, we observe a relatively large increase in magnitudes on sq. Changes on the estimated parameters either in the magnitude or in the level of significance between CNL and ECL models would have an influence on welfare measures regarding change in the satisfaction levels for tourism attributes.
4.3. Welfare Measures
Table 6 presents the mean welfare measures associated with hypothetical change in satisfaction level of each tourism attribute calculated by low, middle, and high income groups from each model. To illustrate, the mean welfare measures calculated from the CNL model for local amenities are about $65.8 for low income households, $41.2 for middle income households, and about $108 for high income households. Using the G-ECL model, they are about $71.7, $37.7, and $103.9 for low, middle, and high income groups. There is a relatively large difference in welfare measures between tourism attributes. Among tourism attributes, the welfare impacts are higher for local amenities. This is probably due to the fact that local amenities have the lowest satisfaction scores, which would imply tourists are more sensitive to changes in the levels of this attribute than other attributes (See Table 4).
In Table 6, we also compare the welfare impacts to the tourism costs that each income group has spent in their recent rural tourism. Based on mean values of the tourism costs, the estimated welfare impacts for local amenities attribute comprise 30.2, 14.4, and 28.5% of the mean tourism costs in the CNL model, while in the ECL model they account for 32.9, 13.2, and 27.4% for low, middle, and high income households, respectively. Interestingly, the welfare impact as a percentage of tourism costs is larger for low income household than medium and high income households for local amenities. This result begs some explanation.
To examine this, Table 7 compares mean satisfaction scores associated with the local amenities attribute between low and middle/high income groups. Compared to middle/high income households, the low income households have much lower satisfaction scores for the local amenities attribute. In addition, the result of statistical tests indicates that satisfaction scores between two income groups are statistically different, which may imply low income households are more sensitive than middle/high income households with respect to change in the levels of local amenities. This can explain why welfare measures are larger for low income households than the other two income groups.
4.4. Discussion
The values in Table 6 can be interpreted as the average increase in tourism costs due to the improvement of satisfaction levels of tourism resources. Using these estimates, we assess the aggregated impacts of perceived changes associated with local amenities by applying them across the total number of tourism households in Korea. We then compare these aggregated benefits to total tourism costs that tourism households have spent in rural tourism in 2015 to illustrate how much the economic benefits generated by an increase in the satisfaction levels for local amenities account for the tourism costs. The comparison of benefits and costs can be used to assess the magnitude of economic impact on the revitalization of local economies due to an increase in tourists’ satisfaction.
According to the 2016 Fact-Finding Survey on Rural Tourism provided by Rural Development Administration, there were 1,836,000 households who visited rural areas for the purpose of rural tourism in 2015. In addition, household incomes which are under $40,000 (low income), between $40,000 and $69,999 (middle income), and more than $70,000 (high income) correspond to 30, 40, and 30% of the population in South Korea, respectively based on data from Statistics Korea. So, we applied these percentages to 2015 urban tourism households to calculate number of low, middle, and high income households. The total tourism costs are the actual fees that urban tourism households have spent in rural tourism in 2015.
Table 8 presents total aggregated benefits, total tourism costs, and benefit–cost ratios associated with the increase in the perceived satisfaction levels for local amenities. Total aggregated benefits were calculated using the formula
where i = low, middle, and high income households and is given in Table 6.
The calculated total benefits are considerable, ranging from $124.4 to $126.0 million depending on the model specifications. The estimated economic impacts of the increase in the satisfaction levels for local amenities comprise 17.9–18.1% of the total tourism costs. This illustrates that rural tourists are willing to spend more money if their satisfaction levels increase compared to those experienced in their recent tourism, which implies more benefits to rural areas resulting in invigoration of the rural economy. Therefore, a systematic support system designed to improve the quality of tourism resources is necessary to maintain the sustainability of rural economies by means of increases in tourism costs.
While the previous studies [11,12] addressed the positive impact of tourists’ satisfaction associated with quality of services in rural tourism on the possibility of revisitation or recommendation, this study contributes to the rural tourism literature by assessing the economic benefits (monetary values) that result from an increase in the perceived satisfaction levels and the magnitude of their impact on rural economies. These results could be useful to set budgets for future tourism management and thus may be of interest to policy makers associated with rural development and rural tourism industry.
5. Conclusions
This study focuses on understanding households’ preferences for the qualitative improvement of tourism resources in South Korea. To identify tourists’ preferences with respect to change in satisfaction levels for tourism resources, this study administered a survey to a sample of rural tourists to measure their satisfaction with the quality of tourism resources in rural areas. This paper employed a pivot-style experimental design to develop the choice experiments to generate choice sets for respondents. Via empirical analysis, this study attempted to explore the issue of model specifications that may arise through use of a pivot-style data. Few studies attempt to examine welfare-economic CE study that describes tourists’ satisfaction with respect to various tourism resources by applying relatively new experimental CE design approaches.
This paper estimated two empirical models; the base model which does not control for potential concerns arising from the use of pivot-style data and an advanced model which are modified to allow for different structures in unobserved components of the utility function across choice alternatives. The results indicate that the advanced model outperforms the base model. The statistically significant parameter for error components indicates the presence of heteroscedasticity across choice alternatives. The welfare impacts of increase in satisfaction levels for tourism resources appear to be substantial. The provision of quality services that ensure customers’ satisfaction is important and necessary for the success of regional tourism industries, which in turn revitalizes the rural economy. Therefore, government and/or rural tourism operators need to develop new strategies to enhance the quality of tourism resources in rural areas.
This study recommends some guidelines that policy makers associated with rural tourism development and managers of tourism resources in rural areas may consider for improving the quality of services in the future. First, tourists’ willingness to pay (WTP) for the increase in the quality of local amenities was relatively high because of low satisfaction levels. Therefore, it is necessary to secure human resources capable of developing a comprehensive framework to improve the local amenities infrastructures and to manage them efficiently. Second, it is necessary to introduce various local festivals/shows/events and to prioritize managing inconvenience efficiently. Moreover, in order to improve the overall satisfaction of local tourism programs, it is necessary to respond quickly to new rural tourism demand. For instance, it would be a good strategy to develop new tourism features that reflect the identity of a rural region such as special products, souvenirs, and experience programs.
The revitalization of rural tourism depends on the participation of the local residents. Therefore, in order to facilitate their participation in the process of implementing new policies, a public–private partnership that includes the central and local governments as well as local residents should be organized. Each role can be assigned as follows. First of all, the resident group could promote tourism products and services and fulfill autonomous quality control and networking, self-education and training, and efforts to strengthen business capabilities. Meanwhile the central and local government could develop rural tourism activation policies, focusing on the provision of village-specific contents, establish mid- and long-term plans, and promote pilot projects for implementing relevant policies. In addition, they could also play a role in publicizing rural tourism villages, establishing a networking system for information exchange, and supporting the resident group.
To conclude, this study generally focused on understanding tourists’ preferences for change in the quality of services associated with rural tourism resources in South Korea. However, to demonstrate the necessity of a new policy/strategy implementation, it would be better to investigate tourists’ preferences for change in the quality of rural tourism as well as the relationship between their satisfaction and the possibility of revisitation based on a region-specific context. This is the major limitation of this study and thus future studies are needed to examine this issue using a particular case study.
Acknowledgments
I would like to acknowledge the support for the data acquisition and statistical software as well as financial support from the research project (GP2018-11) of the Korea Environment Institute (KEI).
Conflicts of Interest
The authors declare no conflict of interest.
References
- Lane, B. What is rural tourism? J. Sustain. Tour. 1994, 2, 7–21. [Google Scholar] [CrossRef]
- Irshad, H. Rural Tourism: An Overview; Rural Development Division: Edmonton, AB, USA, 2010; 28p. [Google Scholar]
- Costa, C.A.; Chalip, L. Adventure sport tourism in rural revitalization: An ethnographic evaluation. Eur. Sport Manag. Q. 2005, 5, 257–279. [Google Scholar] [CrossRef]
- Dimitrovski, D.D.; Todorovic, A.T.; Valjarevic, A.D. Rural tourism and regional development: Case study of development if rural tourism in the region of Gruza, Seriba. Procedia Environ. Sci. 2012, 14, 288–297. [Google Scholar] [CrossRef]
- Briedenhann, J.; Wickens, E. Tourism routes as a tool for the economic development of rural areas: Vibrant hope or impossible dream? Tour. Manag. 2004, 25, 71–79. [Google Scholar] [CrossRef]
- Dashper, K. Rural Tourism: An International Perspective; Cambridge Scholars Publishing: Newcastle, UK, 2014; 440p. [Google Scholar]
- Kang, S.G. Rural Tourism: A New Strategy for Revitalizing Rural Communities; Daewansa: Seoul, Korea, 2007. [Google Scholar]
- Muresan, I.C.; Oroian, C.F.; Harun, R.; Arion, F.H.; Porutiu, A.; Chiciudean, G.O.; Todea, A.; Lile, R. Local Residents’ Attitude toward Sustainable Rural Tourism Development. Sustainability 2016, 8, 100. [Google Scholar] [CrossRef]
- Giannakis, E. The role of rural tourism on the development of rural areas: The case of Cyprus. Rom. J. Reg. Sci. 2014, 8, 38–53. [Google Scholar]
- Shin, H.-J.; Kim, H.N.; Son, J.-Y. Measuring the Economic Impact of Rural Tourism Membership on Local Economy: A Korean Case Study. Sustainability 2017, 9, 639. [Google Scholar] [CrossRef]
- Cho, H.; Byen, B.; Shin, S. An examination of the relationship between Rural Tourists’ Satisfaction, Revisitation, and Information Preferences: A Korean Case Study. Sustainability 2014, 6, 6293–6311. [Google Scholar] [CrossRef]
- Yoon, Y.; Uysal, M. An examination of the effects of motivation and satisfaction on destination loyalty: A structural model. Tour. Manag. 2005, 26, 45–56. [Google Scholar] [CrossRef]
- Hess, S.; Rose, J.M. Should reference alternatives in pivot design SC surveys be treated differently? Environ. Resour. Econ. 2009, 42, 297–317. [Google Scholar] [CrossRef]
- Boxall, P.C.; Macnab, B. Exploring the preferences of wildlife recreationists for features of boreal forest management: A choice experiment approach. Can. J. For. Res. 2000, 30, 1931–1941. [Google Scholar] [CrossRef]
- Hearne, R.R.; Salinas, Z.M. The use of choice experiments in the analysis of tourist preferences for ecotourism development in Costa Rica. J. Environ. Manag. 2002, 65, 153–163. [Google Scholar] [CrossRef]
- Hearne, R.R.; Santos, A.C. Tourists “and locals” preferences toward ecotourism development in the Maya Biosphere Reserve, Guatemala. Environ. Dev. Sustain. 2005, 7, 303–318. [Google Scholar] [CrossRef]
- Naidoo, R.; Adamowicz, W.L. Biodiversity and nature-based tourism at forest reserves in Uganda. Environ. Dev. Econ. 2005, 10, 159–178. [Google Scholar] [CrossRef]
- Bienabe, E.; Hearne, R.R. Public preferences for biodiversity conservation and scenic beauty within a framework of environmental services payments. For. Policy Econ. 2006, 9, 335–348. [Google Scholar] [CrossRef]
- Albaladejo-Pina, I.P.; Díaz-Delfa, M.T. Tourist preferences for rural house stays: Evidence from discrete choice modelling in Spain. Tour. Manag. 2009, 30, 805–811. [Google Scholar] [CrossRef]
- Crouch, G.I.; Devinney, T.M.; Louviere, J.J.; Islam, T. Modelling consumer choice behaviour in space tourism. Tour. Manag. 2009, 30, 441–454. [Google Scholar] [CrossRef]
- Chaminuka, P.; Groeneveld, R.A.; Selomane, O.A.; Ierland, E.C. Tourist preferences for ecotourism in rural communities adjacent to Kruger National Park: A choice experiment approach. Tour. Manag. 2012, 33, 168–176. [Google Scholar] [CrossRef]
- Giergiczny, M.; Czajkowski, M.; Żylicz, T.; Angelstam, P. Choice experiment assessment of public preferences for forest structural attributes. Ecol. Econ. 2015, 119, 8–23. [Google Scholar] [CrossRef]
- Duyen, T.T.T.; Hisako, N.; Mitsuyasu, Y. Tourists’ Preferences toward Ecotourism Development and Sustainable Biodiversity Conservation in Protected Areas of Vietnam-The Case of Phu My Protected Area. J. Agric. Sci. 2015, 7, 81. [Google Scholar]
- Lee, M.-K.; Yoo, S.-H. Using a Choice Experiment (CE) to value the attributes of cruise tourism. J. Travel Tour. Mark. 2015, 32, 416–427. [Google Scholar] [CrossRef]
- Zong, C.; Cheng, K.; Lee, C.; Hsu, N. Capturing Tourists’ Preferences for the Management of Community-Based Ecotourism in a Forest Park. Sustainability 2017, 9, 1673. [Google Scholar] [CrossRef]
- Choi, H.; Ann, S.; Lee, K.; Park, D. Measuring Service Quality of Rural Accomodations. Sustainability 2018, 10, 443. [Google Scholar] [CrossRef]
- Korea Culture and Tourism Institute. A Study on Development Strategies to Invigorate Tourism of Rural Villages; Working Paper; Korea Culture and Tourism Institute: Singapore, 2016. [Google Scholar]
- Champ, P.A.; Boyle, K.J.; Brown, T.C. (Eds.) A Primer on Nonmarket Valuation, 2nd ed.; Springer: Rotterdam, The Netherlands, 2017; 504p. [Google Scholar]
- Rose, J.M.; Hess, S. Designing efficient stated choice experiments in the presence of reference alternatives. Transp. Res. Part B Methodol. 2008, 42, 395–406. [Google Scholar] [CrossRef]
- Kim, H.N.; Boxall, P.C.; Adamowicz, W.L. Analysis of the Impact of Water Quality Changes on Residential Property Prices. Water Resour. Econ. 2016, 16, 1–14. [Google Scholar] [CrossRef]
- Walker, J.L. Extended Discrete Choice Models: Integrated Framework, Flexible Error Structures, and Latent Variables. Ph.D. Thesis, Massachusetts Institute of Technology, Cambridge, MA, USA, 2001. [Google Scholar]
- Hensher, D.A.; Rose, J.M.; Greene, W.H. Applied Choice Analysis: A Primer; Cambridge University Press: Cambridge, UK, 2005. [Google Scholar]
Figure 1.
Example choice scenario.

Figure 2.
Group structure used for the nested logit model.


Table 1.
Attributes, levels, and definition used in choice experiment.
| Attributes | Level | Definition |
|---|---|---|
| Local amenities | 30% decrease | The level of local amenities satisfaction decreases by 30% |
| No change | No change compared to current levels | |
| 30% increase | The level of local amenities satisfaction increases by 30% | |
| Local tourist attractions | 30% decrease | The level of local tourist attraction satisfaction decreases by 30% |
| No change | No change compared to current levels | |
| 30% increase | The level of local tourist attraction satisfaction increases by 30% | |
| Local festivals/shows/experiences | 30% decrease | The level of local festival/show/experience satisfaction decreases by 30% |
| No change | No change compared to current levels | |
| 30% increase | The level of local festival/show/experience satisfaction increases by 30% | |
| Local specialties | 30% decrease | The level of local specialty satisfaction decreases by 30% |
| No change | No change compared to current levels | |
| 30% increase | The level of local specialty satisfaction is 30% increase | |
| Tourism costs | 30% decrease | The tourism cost decreases by 30% |
| No change | No change compared to current levels | |
| 30% increase | The tourism cost increases by 30% |
Table 2.
Definition of the variables used in choice analysis.
| Variables | Definition |
|---|---|
| sq | 1 for recent rural tourism, 0 otherwise |
| cost | Tourism costs (2015 constant price; consumer price index applied) |
| low | 1 for low income household (under $ 40,000/year), 0 otherwise |
| mid | 1 for middle income household (between $ 40,000 and $ 69,999/year), 0 otherwise |
| high | 1 for high income household (greater than $70,000/year), 0 otherwise |
| amenity | Local amenities satisfaction (out of 100) |
| attraction | Local tourist attraction satisfaction (out of 100) |
| festival | Local festival/show/experience satisfaction (out of 100) |
| specialty | Local specialty satisfaction (out of 100) |
Table 3.
Socio-demographic characteristics and profiles of the respondents.
| Gender | Frequency (%) | Annual Income (US $) | Frequency (%) |
|---|---|---|---|
| Male | 205 (48.5) | Under 40,000 | 126 (29.8) |
| Female | 218 (51.5) | 40,000–69,999 | 180 (42.6) |
| More than 70,000 | 117 (27.6) | ||
| Age | Frequency (%) | Residence | Frequency (%) |
| 19–29 years | 67 (15.8) | Seoul, Incheon, and Gyeonggi | 215 (50.8) |
| 30–39 years | 73 (17.3) | Gyeongsang | 104 (24.6) |
| 40–49 years | 82 (19.4) | Chungcheong | 43 (10.2) |
| 50 and above | 201 (47.5) | Jeola | 49 (11.6) |
| Gangwon | 12 (2.8) | ||
| Attributes | Satisfaction Score (Mean, 0–100) | Attributes | Mean(US $) |
| Local amenities | 65.4 | Tourism costs/household | 291.4 |
| Local tourist attractions | 70.1 | ||
| Local festivals/shows/experiences | 66.8 | ||
| Local specialties | 69.3 |
Note: we converted annual income and tourism costs at exchange rate of KRW 1000 equal to US $1.
Table 4.
The purpose and activities enjoyed in rural tourism.
| Classification | Frequency (%) | |
|---|---|---|
| Rural Tourism Purposes | Activities Enjoyed | |
| Experience of traditional culture | 22.5 | 16.4 |
| Experience of farming | 16.1 | 12.5 |
| Experience of nature | 20.9 | 13.6 |
| Rest | 61.6 | 54.6 |
| Leisure (hiking, tracking, swim) | 31.1 | 25.9 |
| Recreation | 7.4 | 4.8 |
| Historic site tour | 31.1 | 25.4 |
| Museum tour | 18.6 | 14.0 |
| Experience of local food | 40.5 | 36.1 |
| Experience of local attraction | 45.3 | 37.6 |
| DMZ tour | 5.4 | 3.8 |
| Purchase of local specialty | 36.4 | 31.9 |
| Enjoyment of local festival/show | 30.9 | 25.9 |
| Making craft/food | 8.5 | 6.1 |
| Visiting relatives | 29.6 | 25.6 |
| Enjoying the country | 19.4 | 14.8 |
| Inexpensive tour cost | 11.0 | 7.0 |
| Other | 0.3 | 0.3 |
Note: Allow multiple responses.
Table 5.
Coefficient estimates for conditional logit (CNL), nested logit (NL), and error component logit (ECL) models.
Table 5.
Coefficient estimates for conditional logit (CNL), nested logit (NL), and error component logit (ECL) models.
| Variable | Choice Model | |||||
|---|---|---|---|---|---|---|
| CNL Model | NL Model | ECL Model | ||||
| Coefficient | Std. Err. | Coefficient | Std. Err. | Coefficient | Std. Err. | |
| sq | 0.3772 *** | 0.0608 | 0.6545 *** | 0.0623 | 0.5629 *** | 0.0703 |
| low*amenity | 0.0221 *** | 0.0052 | 0.0264 *** | 0.0062 | 0.0241 *** | 0.0057 |
| mid*amenity | 0.0143 *** | 0.0040 | 0.0169 *** | 0.0049 | 0.0148 *** | 0.0045 |
| high*amenity | 0.0257 *** | 0.0064 | 0.0314 *** | 0.0076 | 0.0278 *** | 0.0071 |
| low*attraction | 0.0079 * | 0.0045 | 0.0092 * | 0.0053 | 0.0077 | 0.0050 |
| mid*attraction | 0.0106 *** | 0.0036 | 0.0119 *** | 0.0043 | 0.0103 *** | 0.0040 |
| high*attraction | 0.0174 *** | 0.0056 | 0.0218 *** | 0.0067 | 0.0189 *** | 0.0061 |
| low*festival | 0.0034 | 0.0048 | 0.0038 | 0.0056 | 0.0038 | 0.0053 |
| mid*festival | 0.0079 ** | 0.0038 | 0.0087 * | 0.0046 | 0.0076 * | 0.0041 |
| high*festival | 0.0120 ** | 0.0058 | 0.0155 ** | 0.0072 | 0.0134 ** | 0.0065 |
| low*specialty | 0.0100 ** | 0.0050 | 0.0129 ** | 0.0058 | 0.0127 ** | 0.0055 |
| mid*specialty | 0.0081 ** | 0.0040 | 0.0099 ** | 0.0048 | 0.0091 ** | 0.0044 |
| high*specialty | 0.0049 | 0.0063 | 0.0077 | 0.0075 | 0.0055 | 0.0068 |
| low*cost | −0.0021 ** | 0.0010 | −0.0023 ** | 0.0012 | −0.0021 * | 0.0011 |
| mid*cost | −0.0023 *** | 0.0007 | −0.0027 *** | 0.0009 | −0.0026 *** | 0.0008 |
| high*cost | −0.0016 *** | 0.0006 | −0.0018 *** | 0.0007 | −0.0018 *** | 0.0007 |
| IV parameters | ||||||
| Group1 | 1 | fixed | ||||
| Group2 | 1.2618 *** | 0.0259 | ||||
| Error Components | ||||||
| σ2 | 0.9513 *** | 0.0427 | ||||
| σ3 | 1.0014 *** | 0.0398 | ||||
| σ4 | 0.0287 | 0.0424 | ||||
| Log-likelihood | −1699.21 | −1698.97 | −1674.85 | |||
| ρ2 | 0.034 | 0.060 | 0.048 | |||
Significant at the *** 0.01 level; ** 0.05 level; * 0.10 level.
Table 6.
Welfare measures associated with a 10% increase in respondents’ satisfaction of recent tourism attributes.
Table 6.
Welfare measures associated with a 10% increase in respondents’ satisfaction of recent tourism attributes.
| Attribute | Model | Income | Welfare Measures (A) | Tourism Cost (B) | (A)/(B) × 100 |
|---|---|---|---|---|---|
| Mean | Mean | ||||
| Local amenities | CNL | low income | 65.8 | 217.9 | 30.2% |
| middle income | 41.2 | 286.2 | 14.4% | ||
| high income | 108.0 | 378.6 | 28.5% | ||
| ECL | low income | 71.7 | 217.9 | 32.9% | |
| middle income | 37.7 | 286.2 | 13.2% | ||
| high income | 103.9 | 378.6 | 27.4% | ||
| Tourism attractions | CNL | low income | 25.2 | 217.9 | 11.6% |
| middle income | 32.4 | 286.2 | 11.3% | ||
| high income | 79.1 | 378.6 | 20.9% | ||
| ECL | low income | - | 217.9 | 0.0% | |
| middle income | 27.9 | 286.2 | 9.7% | ||
| high income | 76.3 | 378.6 | 20.2% | ||
| Local festivals/shows/experiences | CNL | low income | - | 217.9 | 0.0% |
| middle income | 23.7 | 286.2 | 8.3% | ||
| high income | 48.8 | 378.6 | 12.9% | ||
| ECL | low income | - | 217.9 | 0.0% | |
| middle income | 20.1 | 286.2 | 7.0% | ||
| high income | 48.4 | 378.6 | 12.8% | ||
| Local specialties | CNL | low income | 30.9 | 217.9 | 14.2% |
| middle income | 25.0 | 286.2 | 8.7% | ||
| high income | - | 378.6 | 0.0% | ||
| ECL | low income | 39.2 | 217.9 | 18.0% | |
| middle income | 24.8 | 286.2 | 8.7% | ||
| high income | - | 378.6 | 0.0% |
Notes: Tourism costs are in $2015/household based on the dataset. The number of observations in the dataset for low, middle, and high income households are 126, 180, and 117 respectively.
Table 7.
The comparison of satisfaction scores for local amenities between low and middle/high income households.
Table 7.
The comparison of satisfaction scores for local amenities between low and middle/high income households.
| Group | N | Mean Satisfaction Scores for Local amenities a |
|---|---|---|
| Low income | 126 | 62.5 |
| Middle/high income | 297 | 66.7 |
| Difference | 4.2 | |
| t-test b | 2.04 (p-value = 0.04) |
a Average scores in the dataset; b The null hypothesis of the t-test is that the mean difference of satisfaction scores between two groups is equal to 0; the results indicate satisfaction scores between two groups are statistically different.
Table 8.
Total aggregated benefits, total costs, and benefit-cost ratios associated with the increase in the perceived satisfaction levels for local amenities.
Table 8.
Total aggregated benefits, total costs, and benefit-cost ratios associated with the increase in the perceived satisfaction levels for local amenities.
| Model | Total Aggregated Benefits ($ millions) a | Total Costs ($ millions) | Benefit/Cost (%) |
|---|---|---|---|
| CNL | 126.0 | 695.5 | 18.1 |
| ECL | 124.4 | 695.5 | 17.9 |
a Total aggregated values are calculated using mean values for local amenities in Table 6 and are in year 2015 dollars.
© 2018 by the author. Licensee MDPI, Basel, Switzerland. This article is an open access article distributed under the terms and conditions of the Creative Commons Attribution (CC BY) license (http://creativecommons.org/licenses/by/4.0/).
Share and Cite
MDPI and ACS Style
Kim, H.N. The Economic Valuation of Change in the Quality of Rural Tourism Resources: Choice Experiment Approaches. Sustainability 2018, 10, 959. https://doi.org/10.3390/su10040959
AMA Style
Kim HN. The Economic Valuation of Change in the Quality of Rural Tourism Resources: Choice Experiment Approaches. Sustainability. 2018; 10(4):959. https://doi.org/10.3390/su10040959
Chicago/Turabian StyleKim, Hyun No. 2018. "The Economic Valuation of Change in the Quality of Rural Tourism Resources: Choice Experiment Approaches" Sustainability 10, no. 4: 959. https://doi.org/10.3390/su10040959
Note that from the first issue of 2016, this journal uses article numbers instead of page numbers. See further details here.