Article

Natural Resources Curse in the Long Run? Bolivia, Chile and Peru in the Nordic Countries’ Mirror

1
Department of Economic History, Lund University, 221 00 Lund, Sweden
2
School of Production and Competitiveness, Bolivian Catholic University “San Pablo”, Avenue 14 de Septiembre Number 2, La Paz 4807, Bolivia
3
Department of Economic History, Institutions, Policy and World Economy, University of Barcelona, 08034 Barcelona, Spain
4
Department of Geography and Economic History, Umeå University, 901 87 Umeå, Sweden
5
Department of Economics, Catholic University of Perú, Av. Universitaria 1801, San Miguel, Lima 15081, Peru
6
Department of Archaeology, Conservation and History, University of Oslo, 0851 Oslo, Norway
*
Author to whom correspondence should be addressed.
These authors contributed equally to this work.
Sustainability 2018, 10(4), 965; https://doi.org/10.3390/su10040965
Submission received: 31 January 2018 / Revised: 18 March 2018 / Accepted: 21 March 2018 / Published: 26 March 2018
(This article belongs to the Special Issue Natural Resources Economics)

Abstract

:
The new estimates of the Maddison Project show that GDP per capita ratio at purchasing power parity (ppp) between Bolivia and Finland has changed from 0.68 ca. 1850 to 0.16 in 2015; similarly, that between Chile and Norway from 0.65 to 0.28. The aim of this article is to present a review of the literature and available quantitative evidence to understand how these extreme differences became possible between countries with similarly enormous natural resource endowments. Specifically, the article seeks to: (a) identify some stylized facts that may help understand the divergence between Andean and Nordic countries; (b) identify key historical processes that explain the divergent effect of natural resource abundance in Andean and Nordic economies. In order to achieve these objectives, four topics are covered: GDPpc, population, trade and taxation. The analysis comprises three Nordic countries (Finland, Norway and Sweden) and three Andean countries (Bolivia, Chile and Peru) from the mid-Nineteenth Century to present day. The sample size, time span covered and thematic approach provide new evidence regarding previous work.

Graphical Abstract

1. Introduction

The “natural resource curse” hypothesis has been used several times to explain the poor growth performance of resource-rich countries. The hypothesis, in simple terms, considers that countries with abundant natural resource endowments could fail to achieve sustained growth. The term was coined by Auty and popularized after Sachs and Warner claimed the existence of a negative correlation between the share of natural resource exports to GDP and the economic growth rate from the 1960s to the 1980s [1,2,3]. Several causal mechanisms have been discussed to explain this correlation; for instance, the effects of natural resource exports on the appreciation of the exchange rate and a subsequent deindustrialization process, a phenomenon known as “Dutch disease” [4,5]. Another set of explanations point towards a crowding-out effect, diverting investment from tradable to non-tradable sectors [6]. It is also often argued that dependence on natural resource exports may increase the volatility of the economy, which has negative effects on human capital and investment decisions [7,8]. From a political perspective, it is highlighted that natural resource exports may increase the concentration of power into rent-seeking elites or negatively affect the quality of democratic regimes [9,10,11,12].
Interestingly, these mechanisms have been debated both in the public and academic arenas. This has been particularly intense during the last few years because of the “commodity super cycle” that took place between 2004 and 2014; for instance, see Papyrakis and Gerlagh and the updated bibliographic review in recent surveys on this topic [8,13,14,15]. Institutions like the World Bank, in opposition to Sachs’ view, pointed out that increases in international prices brought both opportunities and challenges to Latin American economies [3,16]. Similarly, it has been suggested that innovative fiscal policy could be a good instrument to take economic advantage of natural resource exploitation [17,18].
Once the boom is over, skepticism develops, and researchers are trying to identify what has been done incorrectly [15]. In spite of this, it is also necessary to take into account those theoretical criticisms to the hypothesis of the “natural resource curse”. For instance, by looking at different historical episodes, van der Ploeg stresses the existence of both positive and negative growth performances in several resource-rich countries [8]. Following this approach, Smith found a positive relation between growth and natural resources when the sample was split between OECD and non-OECD countries [19]. Boschini, Pettersson and Roine found that the negative correlation between growth and natural resources disappeared when controlling for the quality of institutions [20]. Likewise, Brunnschweiler has stressed the existence of a positive correlation between natural resource abundance (measured by the existence of natural resource capital) and long-term economic growth [21]. Regarding politics, Haber and Menaldo have identified that natural resources do not have a significant long-term effect on the regime type (i.e., a democracy or a dictatorship) [22].
These different ideas suggest that the relationship between natural resources and economic performance still is an open question that deserves further work.
The usefulness of history has been stressed before [10,23,24]. It is particularly important for identifying the paths through which some countries that were resource abundant transited to knowledge economies by taking advantage of their natural resources. This has been the case, for instance, for the United Kingdom and Germany, two coal abundant economies during the industrial revolution [25]. Wright has stressed the critical role of natural resource expansion and diversification in U.S. industrialization given the existence of forward and backward linkages, the domestic market expansion and the existence of agglomeration economies [26]. Ville, Dean and Wicken have analyzed the cases of Norway and Australia, pointing out the existence of an industrialization process based on natural resource exploitation [27]. In the case of less developed economies, Hillbom stresses the critical role played by good institutions in the positive impact that mining had on Botswana [28,29].
In this article, we compare Andean and Nordic countries from the the mid-19th Century onwards. The starting point of this comparison is based on the fact that the extreme differences existing today between both groups of countries were much lower in the mid-19th Century. This can be clearly appreciated in Table 1, which compares GDP per capita for selected years in purchasing power parity (ppp) terms. For instance, whereas the GDP per capita ratio between Bolivia and Finland is today around 0.16, it was around 0.68 in the middle of the Nineteenth Century. Likewise, it is noteworthy that Chilean GDPpcwas similar to the Finnish one in the mid-19th Century, but today is around 50%.
More importantly, it makes sense to compare Andean and Nordic countries since both groups of countries were, and are, abundant in natural resources. Thus, we seek to understand how these current big differences are possible between countries with similarly enormous natural resource endowments. In this context, we wonder why Andean countries are today among those economies that tend to depend heavily on a few natural resources. This idea can be easily proven by looking at the composition of total exports in Bolivia, Chile and Peru in 2003 and 2013, i.e., before and during the last year of the super commodity cycle. Meanwhile, Nordic countries transited from natural resource dependent to knowledge economies. It’ is important to remark that the difference in resource intensity was small at the end of the XIX Century and the first years of the XX Century. For instance, in the first decade of 1900, the share of mining in GDP was the same in Sweden and Perú (around 7%; see Table 2).
Few previous works have compared long-term development trajectories of Latin American and Nordic countries [23,32,33]. In contrast to Blomström and Meller, this article presents robust quantitative evidence for the pre-1950 period [32]. As we show here, this feature is critical, since it helps with understanding when the initial divergence took place. Moreover, instead of looking at country case studies, we try systematically to compare the two group of countries in different key determinants of long-term development: trade, fiscal policy and human capital accumulation. Likewise, since we share the idea that trade is a critical factor to understand the divergent patterns of these economies [23], we present a very long-term analysis of trade expansion and composition. We also expand the sample of Ranestad’s previous work on human capital in Norway and Chile, to include three Andean and three Nordic countries, as well as the covered period until 2015 [33]. Furthermore, our work also considers the potential role played by taxation in contributing to the different development paths.
To sum up, the goal of this paper is to present a review of the literature and available quantitative evidence to identify: (a) some stylized facts that may help understand the divergence between Andean and Nordic countries; (b) key historical processes that explain the divergent effect of natural resource abundance in Andean and Nordic economies. In the following sections we analyze data on population, gross domestic product, trade, human capital and public finances.

2. Sources and Methods

This study is based on a literature review and the use of secondary sources, some of them developed by ourselves in previous works. When available quantitative evidence is scarce, we use primary sources such as trade and fiscal yearbooks. The article combines the presentation and description of long-term series with a discussion of the existing literature.

3. Results

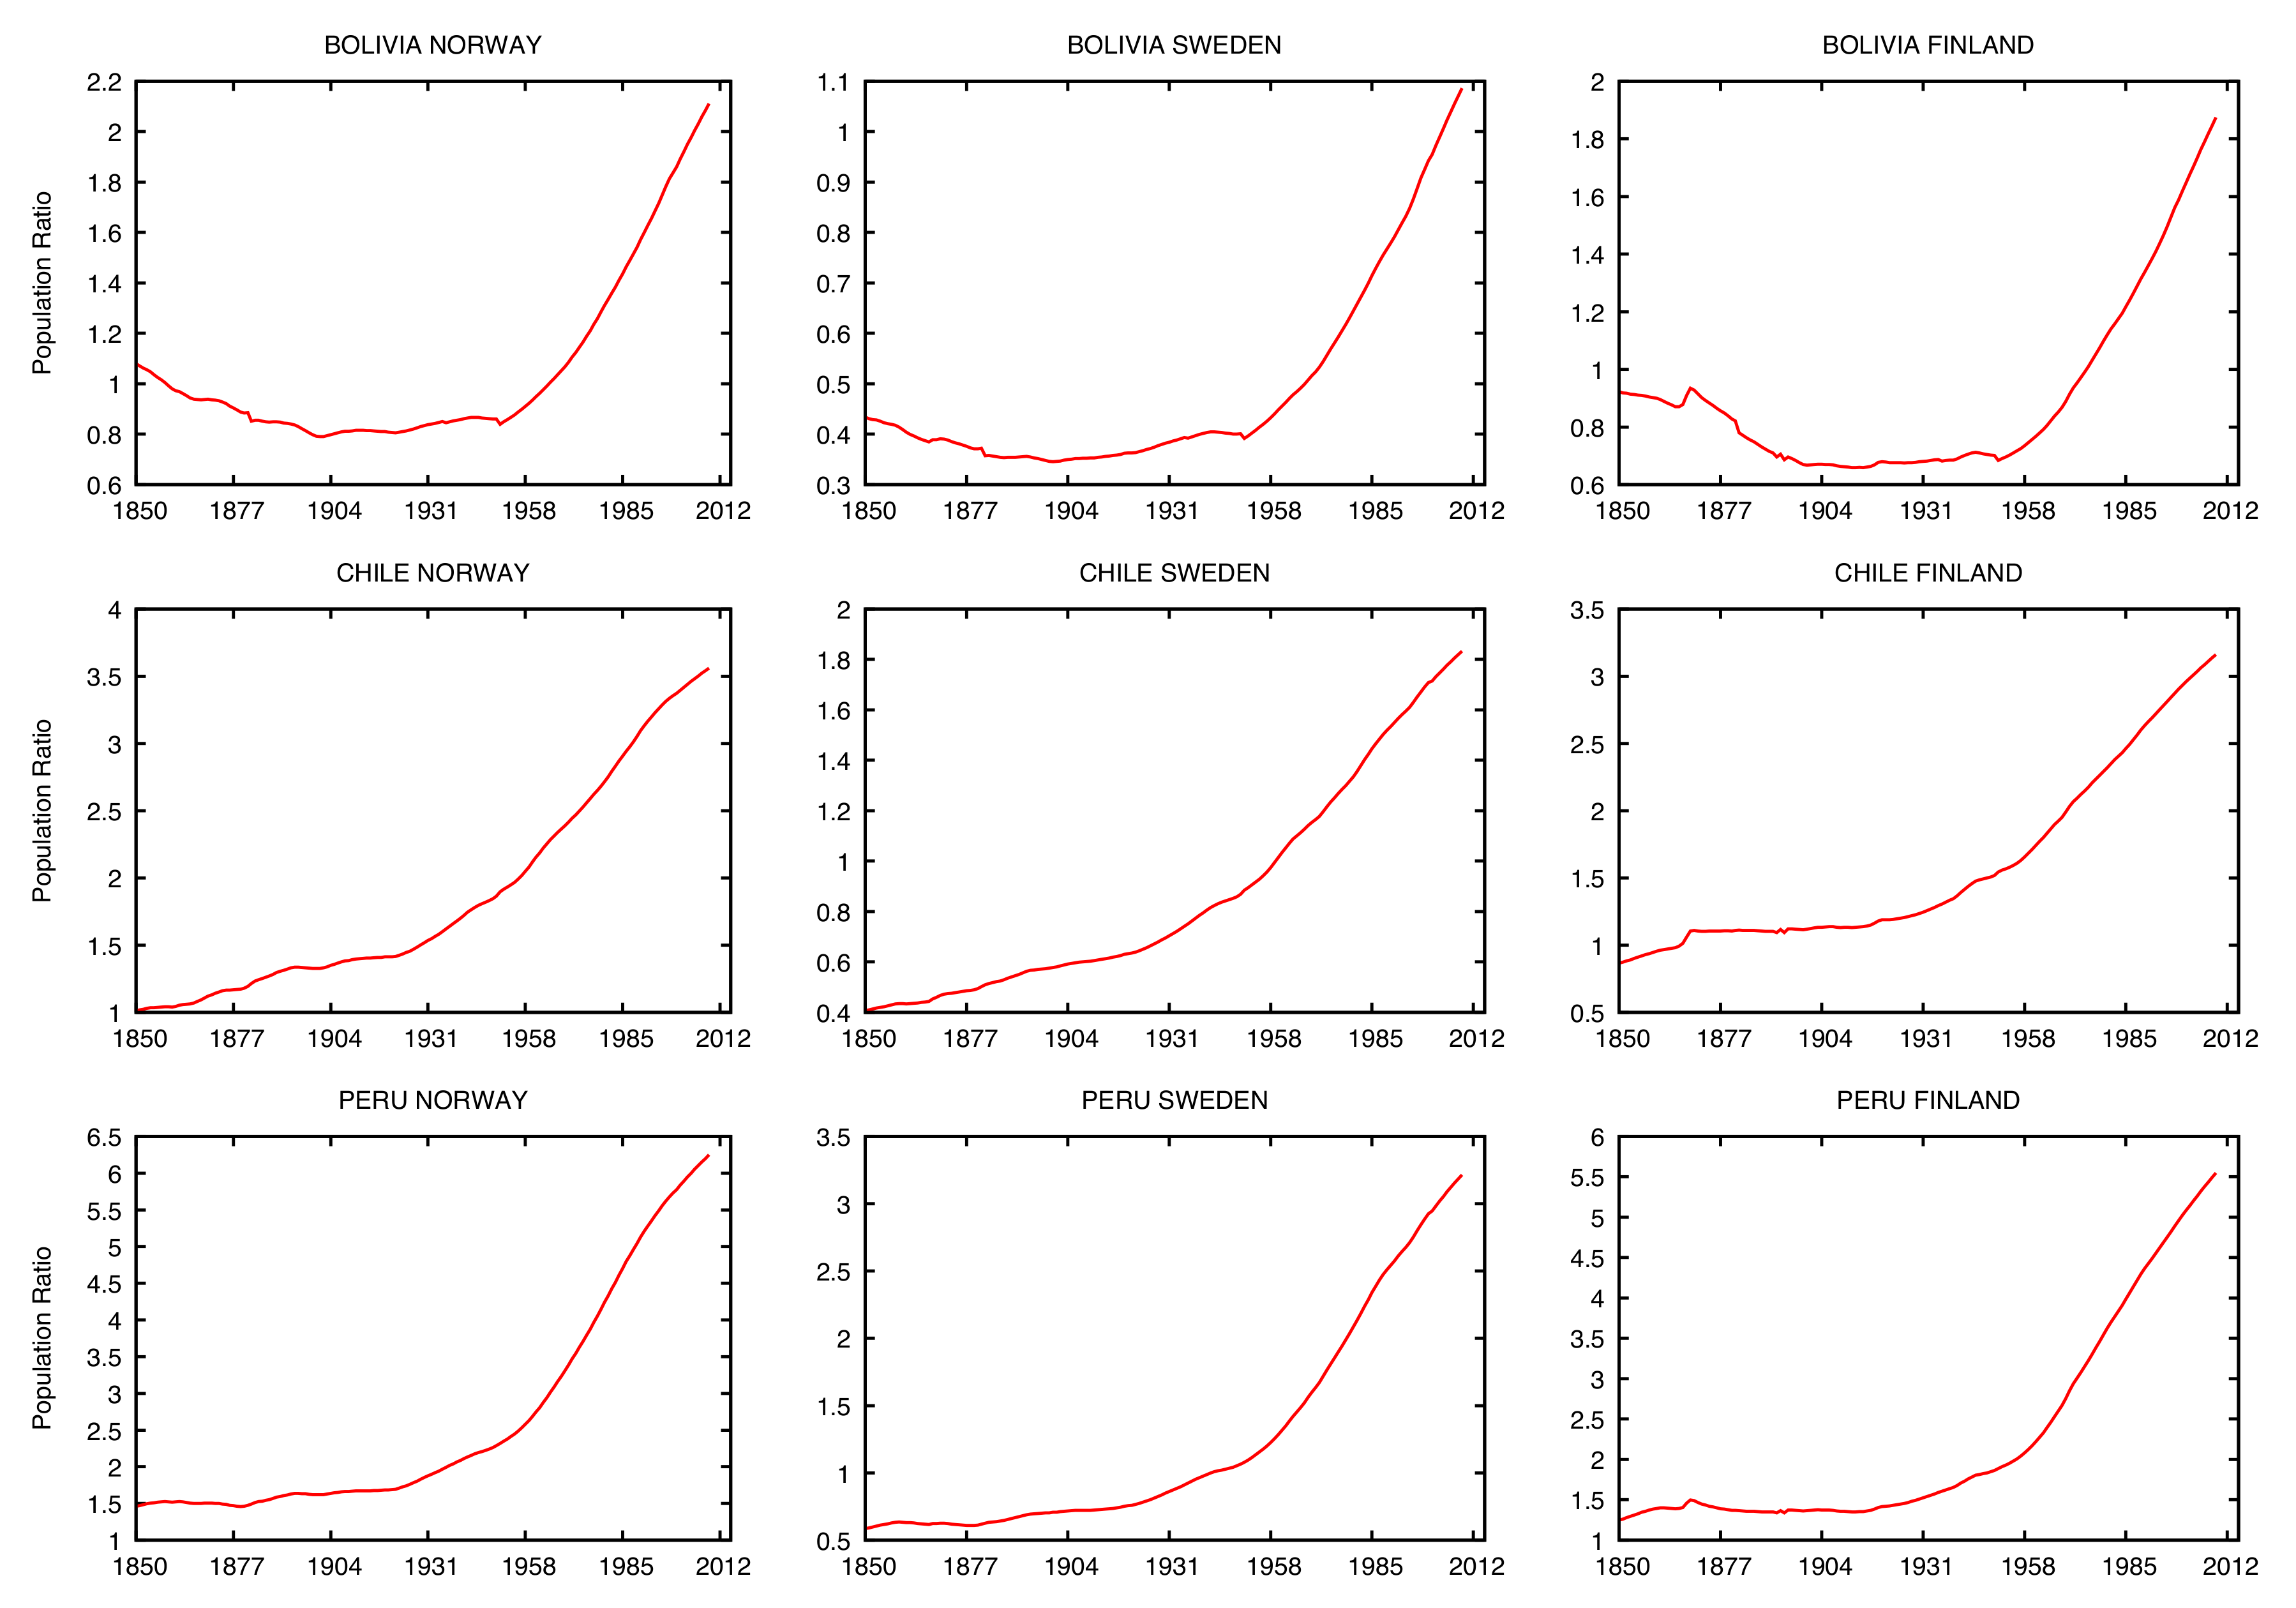
3.1. Long-Term Economic Growth

Table 3 presents average growth rates for different critical periods in world economic history. Between 1850 and 1870, no major differences appear in the economic growth rates of the two groups of countries. During the following period, the size of the economic downturn of the Peruvian economy stands out. Regarding the belle époque, it is noticeable that economic dynamism was present in both Andean and Nordic countries. During the Great War, economic crisis was persistent in Nordic countries, and economic performance in Andean countries was not homogenous. Thereafter, whereas economic growth rates were higher in Andean countries during the 1920s, the opposite was the case during the 1930s. Again, whereas economic dynamism was higher in Andean countries during the Second World War, Nordic countries presented a considerable dynamism during the second half of the 1940s. During the Golden Age, economic growth rates were higher in Nordic countries. This feature was clear between 1973 and 1990, a result that is certainly driven by the negative effects of the crisis in Latin America in the early 1980s. It was not until the recent super-cycle prices that economic growth in Andean countries became higher than in Nordic countries. At a glance, the similar growth rates in different periods between the two groups of countries is obvious. However, countries’ ability to reduce the size and the duration of economic crises is considered as important as growth explosions in the long-term trajectory of any economy [34]. Thus, in the following paragraphs, we present the main events that may allow us to understand the long-term trajectories of our economies under scrutiny.
In the Bolivian case, it has been stated that its long-term economic performance was harmed both by poor growth during the 19th Century and the existence of three severe economic crisis during the 20th Century [30]. Regarding the first period, Bolivia was among those Latin American countries that suffered the most economic impact of independence [36]. Whereas this was obtained in 1825, economic dynamism and modernization recovered slowly in the late 1850s, i.e., decades later. Moreover, silver exports regained pre-independence levels just in the 1870s, which according to Herranz-Loncán and Peres-Cajías’ estimates were not enough to pull an economy that was concentrated in agrarian activities (around 70% of total GDP) [30,37,38]. During the early 1890s, the drop in the international price of silver affected Bolivian exports and, in turn, its composition towards tin and rubber; thus, the rapid expansion of tin exports from 1904 compensated the 1890s’ crisis [39,40]. During and after the First World War, Bolivian exports concentrated on tin exports and suffered from the high instability of international prices, a fact that became particularly evident during the Great Depression, the first great crisis of the 20th Century [41]. The structural changes generated by the National Revolution of 1952 (radical agrarian reform, nationalization of big mines, higher state intervention, educational reform, universal vote) contributed initially to a severe economic crisis that was followed by one of the most important and sustained periods of economic growth [42]. This was still generated by the mining sector, but also by a continuous process of food import substitution, agricultural modernization and exploitation of oil in the east of the country [43]. This path, however, suddenly ended and was reversed by the crisis of the early 1980s, the third big crisis of the 20th Century. This drop was driven by external shocks, a severe drought and erratic macroeconomic policy [44,45]. The structural reforms of the 1990s inspired by the so-called Washington Consensus were successful in the stabilization of the economy, but less able to spur the rate of economic growth. Thus, it was not until the commodity price super cycle that the Bolivian economy recovered high economic growth rates.
The long-term evolution of the Peruvian economy has been strongly related to the evolution of natural resource exports. Towards the mid-19th Century it was guano, a natural fertilizer, that was central. The state ownership of this product and the monopoly of Peru on this commodity increased the state’s revenues and modified the relationship between the state and the Peruvian society [46,47,48,49]. It allowed a superficial modernization of the country featured by the spread of railways and telegraph lines across the country, as well as the explosion of museums, marble statues and a European way of life in the capital. Thus, far away from an economic diversification, the export boom generated what would be known later as the “Dutch Disease” [46,48]. Moreover, once the limits of the export boom were becoming evident around the mid-1870s, the country fought the “Saltpetre War” (1879–1884), which involved the loss of vast territories rich in natural resources, as well as a profound fiscal crisis. The magnitude of the crisis led to radical fiscal, monetary and structural reforms. These changes prompted a robust re-introduction of Peruvian products to the world economy towards the 1890s. In contrast to the Bolivian case, the Peruvian export basket comprised several mining and agricultural products, including sugar, cotton, wool, rubber, oil and silver [50,51,52]. This export-led growth strategy increased economic growth rates considerably, but ended abruptly during the Great Depression, whereas the contraction was milder than in other Latin American economies. Thereafter, the price recovery of different agricultural commodities, particularly during the Second World War, drove the recovery of economic dynamism. The export-led growth model continued during the 1950s and 1960s, but became increasingly criticized. This was in part due to social and demographic changes led by the expansion of public education and a sharp increase in total population (see below). Thus, during the early 1970s, an import-substitution-industrialization strategy, promoted by a new political class of reformist militaries, such as General Juan Velasco Alvarado, took place [53,54,55]. During the 1980s, the results of the new strategy in terms of diversification were not satisfactory; the country suffered high macroeconomic instability, and Maoist guerrillas appeared in the countryside. Overall, this led to a profound contraction of the economy that, as in the Bolivian case, was overcome through radical reforms inspired by the Washington Consensus. During the last few years, economic dynamism has been led again by natural resource exports.
The Chilean case could be considered the most successful of the three Andean states. Firstly, Chile achieved independence with less damage and capital loss than its neighbors [56]. After a short period of political instability during the 1820s, Chile adopted a presidential regime, and the economic dynamism was based on agricultural exports and mining resources, such as gold, silver and copper. This initial prosperous cycle ended in the 1870s because of a major fall in mineral prices and wheat demand. This crisis was “resolved” with the victory in the “Saltpeter War” (1879–1884), which meant the incorporation of huge new territories rich in minerals, particularly nitrates. Thereafter, Chile became a monopolistic producer of this product (one of the main non-metal minerals of the Second Industrial Revolution), which facilitated the acceleration of the economy and the increase of fiscal revenues [57,58,59,60,61,62]. Both processes have generated an abundant debate concerning the Chilean historiography and the effects that nitrate exploitation had on the economy, especially regarding the resource curse and the fiscal dependency originated by nitrates [57,58,61,63,64,65]. Besides this debate, the nitrate cycle is characterized by high growth rates and two deep crises, one after the First World War and a bigger and definitive one during the Great Depression, when exports of nitrates fell over 90% and total exports circa 80%. However, the recovery was fast, and the GDP per capita of 1929 was reached again in 1940. The economy post Saltpetre was characterized by state-led industrialization and another major mineral for export, namely copper. During 1950s, the Chilean economy was facing several problems related to inflation and financial instability that led to stabilization programs, such as the Klein-Sacks mission [65,66]. The 1960s are considered the best years of the industrialization process [67]. This period ended dramatically with the macro unbalances produced by the expansionary monetary policies under the socialist government of Salvador Allende and the coup d’etat of 1973. The dictatorship of Augusto Pinochet (1973–1990) implemented two liberalization programs, one during 1975–1981 and the second during 1983–1986, after the debt crisis (1982–1983) [65,66]. Throughout the dictatorship, copper continued to be the main export product, but the export basket became more diversified with other natural resources, mainly agricultural. In 1990, the authoritarian regime was replaced by a democratic system led by a center-left coalition, which maintained the main structure of the economic policy, but increased social expenditures. The new model generated the so-called “Chilean miracle”, which is featured by the existence of higher growth rates than others Latin America countries and the achievement of the highest GDP pc in the region [65,68,69].
Regarding Nordic countries, Sweden developed from being one of Europe’s poorest countries in the mid-Nineteenth Century to having one of the highest GDP per capita in the world in 1970. An exceptional growth of the Swedish economy took place from 1890–1930 with an annual GDP growth of 2.1%, and the country continued to grow even more up until the 1970s with an annual growth rate of 2.3% [70]. In the mid-19th Century, agriculture accounted for 38% of the Swedish GDP, manufacturing for 23%, transportation for 9% and other services for 28%, while the corresponding numbers in 1930s were 12%, 27%, 8%, 7% and 46% [70,71]. In the period 1890–1930, annual GDP growth was highest in the industrial sector, especially in mining, pulp and paper and the power/electric industry ([70], p. 229). Swedish industrial growth was based on domestic natural resources such as forests, iron ores, sulphide ores and rivers available for hydropower. After 100 years of high growth in GDP, with only short-term recessions after WWI and in the early 1930s, Sweden experienced a slow-down in GDP growth in the 1970s when a number of industries went into a structural crisis. Thus, in the 1980s, Sweden experienced a far-reaching structural change within its industry [72]. Another crisis emerged in 1991–1992, but the Swedish economy recovered in 1993, much thanks to a depreciation of the Swedish krona after a floating exchange rate was introduced. Export industries were the main driving force behind the recovery, which increased its share of GDP [73]. Sweden then saw a renewed productivity growth in natural resource-based industries such as the forest industry, but also within IT-based telecommunications, biotechnologies, pharmaceutical industries and services [72]. Today, Sweden is the biggest economy among the Nordic countries and is growing faster than the European Union on average (https://www.bloomberg.com/news/articles/2017-07-28/ (accessed January 28)).
In the mid-19th Century, Norway had similar GDP per capita as Sweden, but a relatively slow growth. Economic growth in this country has been based on a fairly equal income distribution. The country had practically no land nobility, Catholic Church or military caste. Nobility privileges were abolished when the country became independent from Denmark in 1814 ([74], pp. 16–17). The feudal tendencies were weak, and in the 19th Century, small private farmers owned the majority of the soil. Self-owned farming represented eighty-one percent in 1855 and ninety-five percent in 1875 ([75], p. 36). This was a particular situation in Europe [75]. In the Nineteenth Century, Norway had a large agricultural sector, which gradually reduced its share of GDP. Indeed, agriculture, timber and fish stood for 45.3% in 1865, but were reduced to 23.7% in 1910 and 4.6% in 1980. Shipping, mining, timber and timber-related industries were also important. Manufacturing industries have varied in size, but remained relatively small compared to other sectors ([75], p. 237). From around 1930, the country took a step forward and began growing faster. This growth certainly had multiple causes, but the large-scale chemical- and electro-metallurgical industries, based on the utilization of hydroelectric power, are emphasized as important. Production of aluminum, silicon, ferro-alloys, magnesium, steel, artificial fertilizer and other metals and minerals started in the early 20th Century and grew rapidly. Norway was affected negatively by the Great Depression, but not nearly as much as the Andean countries. From the mid-1940s, after the recession during WWII, an economic gap emerged. Norway stayed ahead and grew considerably more than the Andean countries. The chemical- and electro-metallurgical industries grew to become some of the cornerstones of the Norwegian economy, and it was found that it was this industry in particular that transformed Norway into a prosperous industrialized country. In the late 1970s, Norway surpassed the Western European growth average, which is largely explained by another mineral industry, namely oil and gas, which soon became critical for the Norwegian economy. Therefore, notwithstanding slow economic growth during the Nineteenth and early Twentieth Century, Norway is today one of the richest countries in the world.Productivity and income are among the highest in the world, even without the extra contribution of the country’s oil and gas sector [76].
Finland was for a long time the poorest country among the Nordic countries, and Swedish long-term growth rates were higher than the Finnish up until the 1950s [77]. However, starting on a lower income level than Sweden in 1870, Finland managed to transform itself from a predominantly primary production-based economy to a modern welfare state as the other Nordic countries, with a large service sector and with a highly competitive business sector. In 1870, agriculture amounted to 75% of the employment share (% of GDP), industry and construction to 16% and services to 9%. In 1934, the corresponding numbers were 52%, 26% and 29% ([78], pp. 143–144). After the 1870s, in particular, the manufacturing sector developed rapidly; production became diversified; and exports of manufactured goods and timber grew, especially to Russia, but also Western markets. Finland’s large forest areas have been an important factor in its development [79]. Two thirds of Finland’s total area is covered with forests and other wooded land, while other natural resources are scarce. Despite not being blessed with abundant natural resources (the Outokumpu copper mine was exhausted in the 1980s), Finland embarked on the road to industrialization using its forest sector and, like Sweden and Norway, its hydro power potential and the rural labor reserve. With a growth rate of 2.2% per annum and capita from 1860–2000, Finland surpassed most other countries in the world in terms of long-term growth ([80], p. 62). The significant periods for catching up with Western Europe were the interwar period and particularly the 1980s.
Behind the Nordic countries’ successful economic development lie complex institutional factors, not easily quantifiable, such as a high level of general trust; a historically strong presence of a social democratic party; powerful unions; a public sector in charge of systems for education and health; a general welfare state and high tax levels; and state-owned companies, not the least within the transport and the energy sector [70,74,78,80].

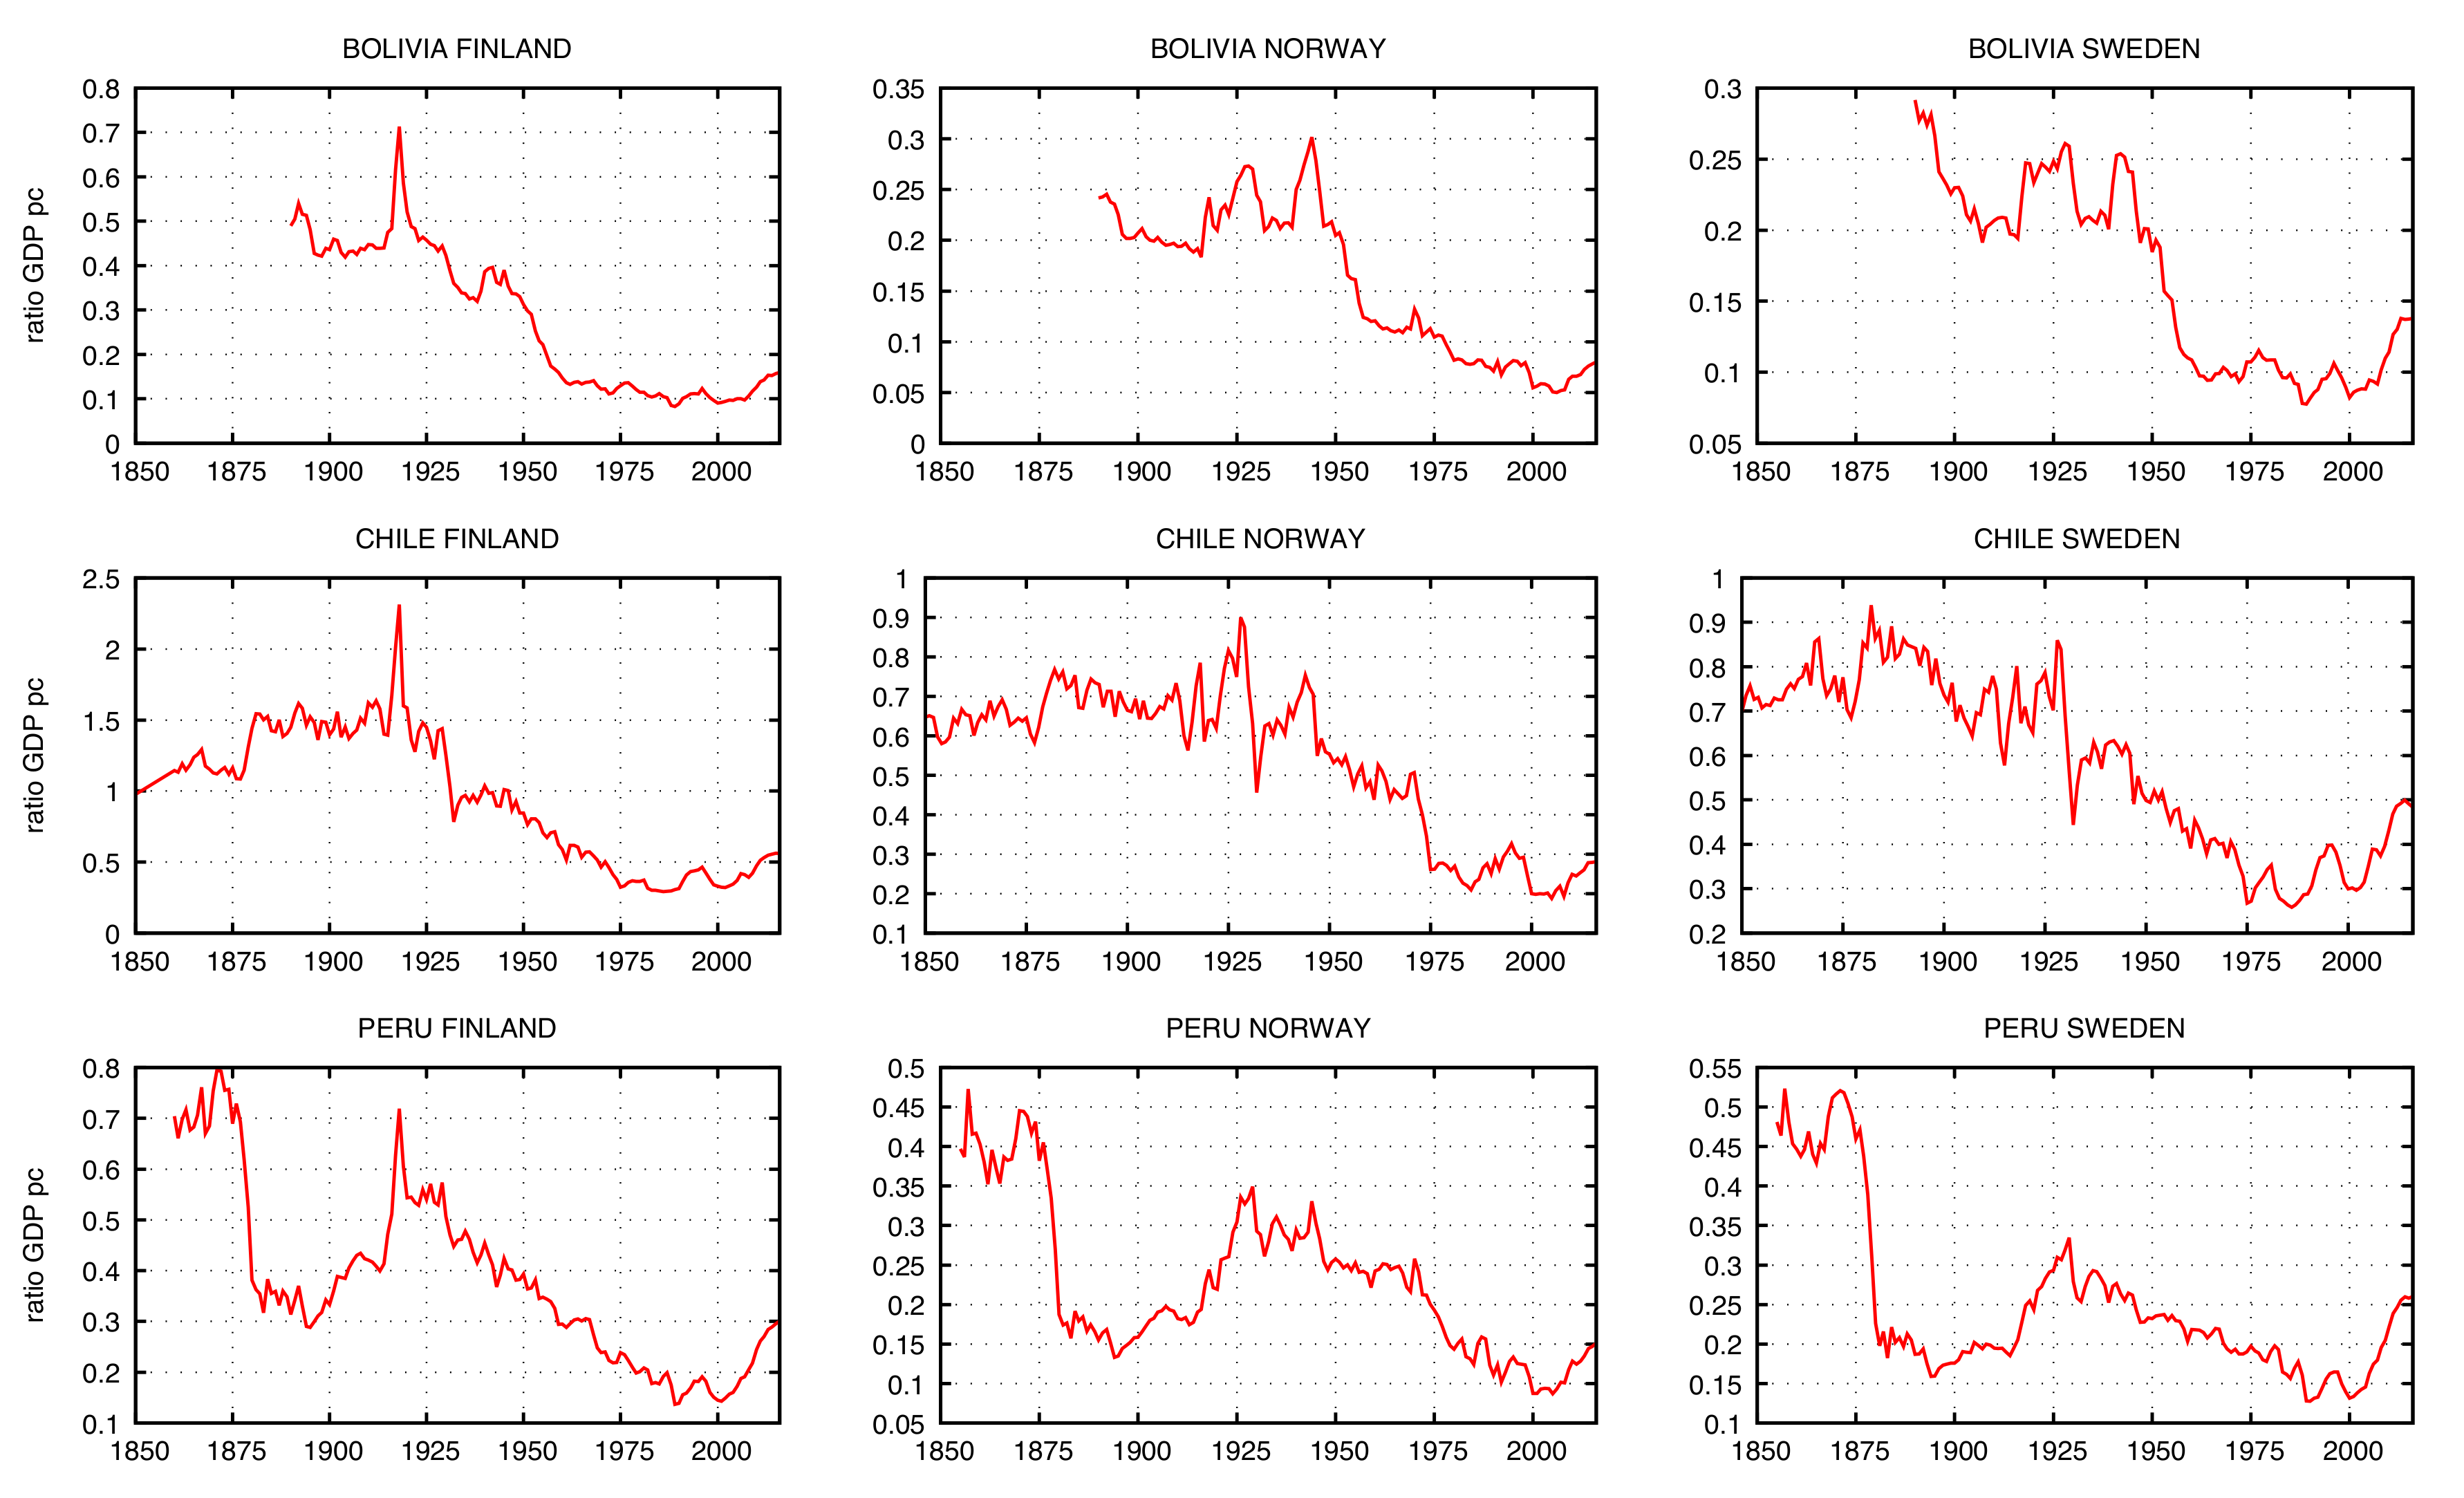
3.2. Economic Divergence

Once having reviewed the long-term trajectories of each economy, we focus on the relative distance between both groups of countries. We start by analyzing population figures, since a late demographic transition has been said to be an important explanation for the economic divergence [32]. We then turn to GDP per capita levels.
Figure 1 presents data for the population ratio between Andean and Nordic countries from the mid-19th Century to recent years. In the case of Bolivia, population grew at a lower or similar rate to the Nordic ones until the end of the 1950s. As for the Peruvian case, similar rates of population growth until the end of the 19th Century are observed; since the 1930s, Peru had much higher growth rates. Regarding Chile, higher population growth rates since the beginning of the period under analysis are noteworthy. During the 19th Century, this was in part related to the fact that Chile was a country that received migrants, whereas the Nordic countries expelled migrants [33,81,82]. For instance, according to Grytten, between 1836 and 1930, only Ireland had more migrants than Norway [83]. Population growth rate differences thereafter are certainly explained by differences in the timing of the demographic transition, particularly after the Great Depression. Therefore, a first conclusion to bear in mind is that population pressure should be considered when examining the divergence process between the two groups. However, it is also clear that the explanatory power of this variable is not homogenous throughout time and is not relevant at the same point in the three Andean countries under scrutiny.
The population hypothesis is one of the factors to be considered in the explanation of the divergence among our Latin American countries and the Nordic Region. In the aforementioned work by Blomström and Meller [32], they addressed as a key factor the delayed demographic transition in Latin America. A relevant demographic burden could threaten the gains of economic growth. This appreciation should be understood in the context of these scholars: in the 1980s and 1990s, the effects of the decreased infant mortality rate were clear, and the relation could be developed straightforwardly. Bolivia, until the 1950s, was a country with less population than the three Nordic countries analyzed in this paper. At the end of the period (2010s), its population was around 2.2- and 2-times the population of Norway and Finland.
Figure 2 presents the GDPpc ratio, which allows us to identify when Andean countries fell behind the Nordic countries. Remembering also Figure 1, we can appreciate that divergence in population growth, which is mostly a phenomenon from the second half of the 20th Century (when Blomström and Meller wrote their book), appears after the economic divergence had taken off. In terms of GDP per capita comparison, the three Latin American cases have their own histories and trends, but they share a common structural break accompanied by a change in level after the Great Depression.
In the case of Peru, the break is especially dramatic, because after more than fifty years of convergence, closing the income gap with Sweden until 0.6, it lost these gains in a few years and widened the gap with the Nordic countries until the 1980s. The prior episode of divergence during the late 1870s and early 1880s, due to the crisis of guano and the Saltpetre War, is also remarkable. Since the mid 20th Century, an erratic evolution of the Peruvian GDP and higher population growth rates led to increased economic distance with the Scandinavian countries. Divergence accelerated during the early 1970s due to pitfalls of the new economic strategy, and it was not until the turn of the century that a new sustained convergence process took place.
In Bolivia, a clear divergent pattern during the second half of the 19th Century stands out. Divergence stopped during the first third of the 20th Century, but restarted with the Great Depression. Whereas a recovery took place during the Second World War, divergence accelerated again during the 1950s because of the economic crisis in Bolivia. From the early 1960s to the late 1970s, divergence stopped, which is explained by higher GDP growth rates, as well as higher population growth rates in Bolivia. Divergence accelerated again during the early 1980s due to the debt crisis, and the ratio stayed constant at very low levels until 2005, when a new convergence process started.
In contrast to the previous experiences, the Chilean case stands out by the forging ahead process of Finland and the stabilization of the GDPpc ratio with respect to Norway and Sweden. This is significant given the higher population growth rates in the Andean country. These trends, however, changed after the Great Depression when divergence started. This accelerated during the early 1970s because of the political turmoil in Chile. Thereafter, two processes of convergence are evident: the first a short one during the first half of the 1990s and the second one at the turn of the 21st century, caused again by the relevance of natural resource exports in Chile.
Summing up, the quantitative evidence presented here stresses the existence of non-negligible differences between both groups of countries already in the mid-19th Century. It should be noticed that these differences are not evident when the previous Maddison Project is used [31]. Given that our concern is related more to trends than levels and that trend differences do not appear between both databases, we preferred to use the last database due to its methodological improvements. However, these differences were not as profound as those that exist today. If population growth in Latin America is the variable to blame, it should be noticed that its impact had a different timing in the three Andean countries analyzed. Therefore, we suggest the need to turn the analysis toward natural resources and their economic linkages. The GDPpc data show the existence of more frequent and deep economic crises in the Andean countries, as well as the relevance of the Great Depression as a breaking point in our comparison. This, in turn, highlights the need to identify the differences that emerged during the last decades of the 19th Century and the first third of the 20th Century in both groups of countries that may explain the divergent paths triggered by this external shock.

3.3. Trade Evolution and Industrial Development
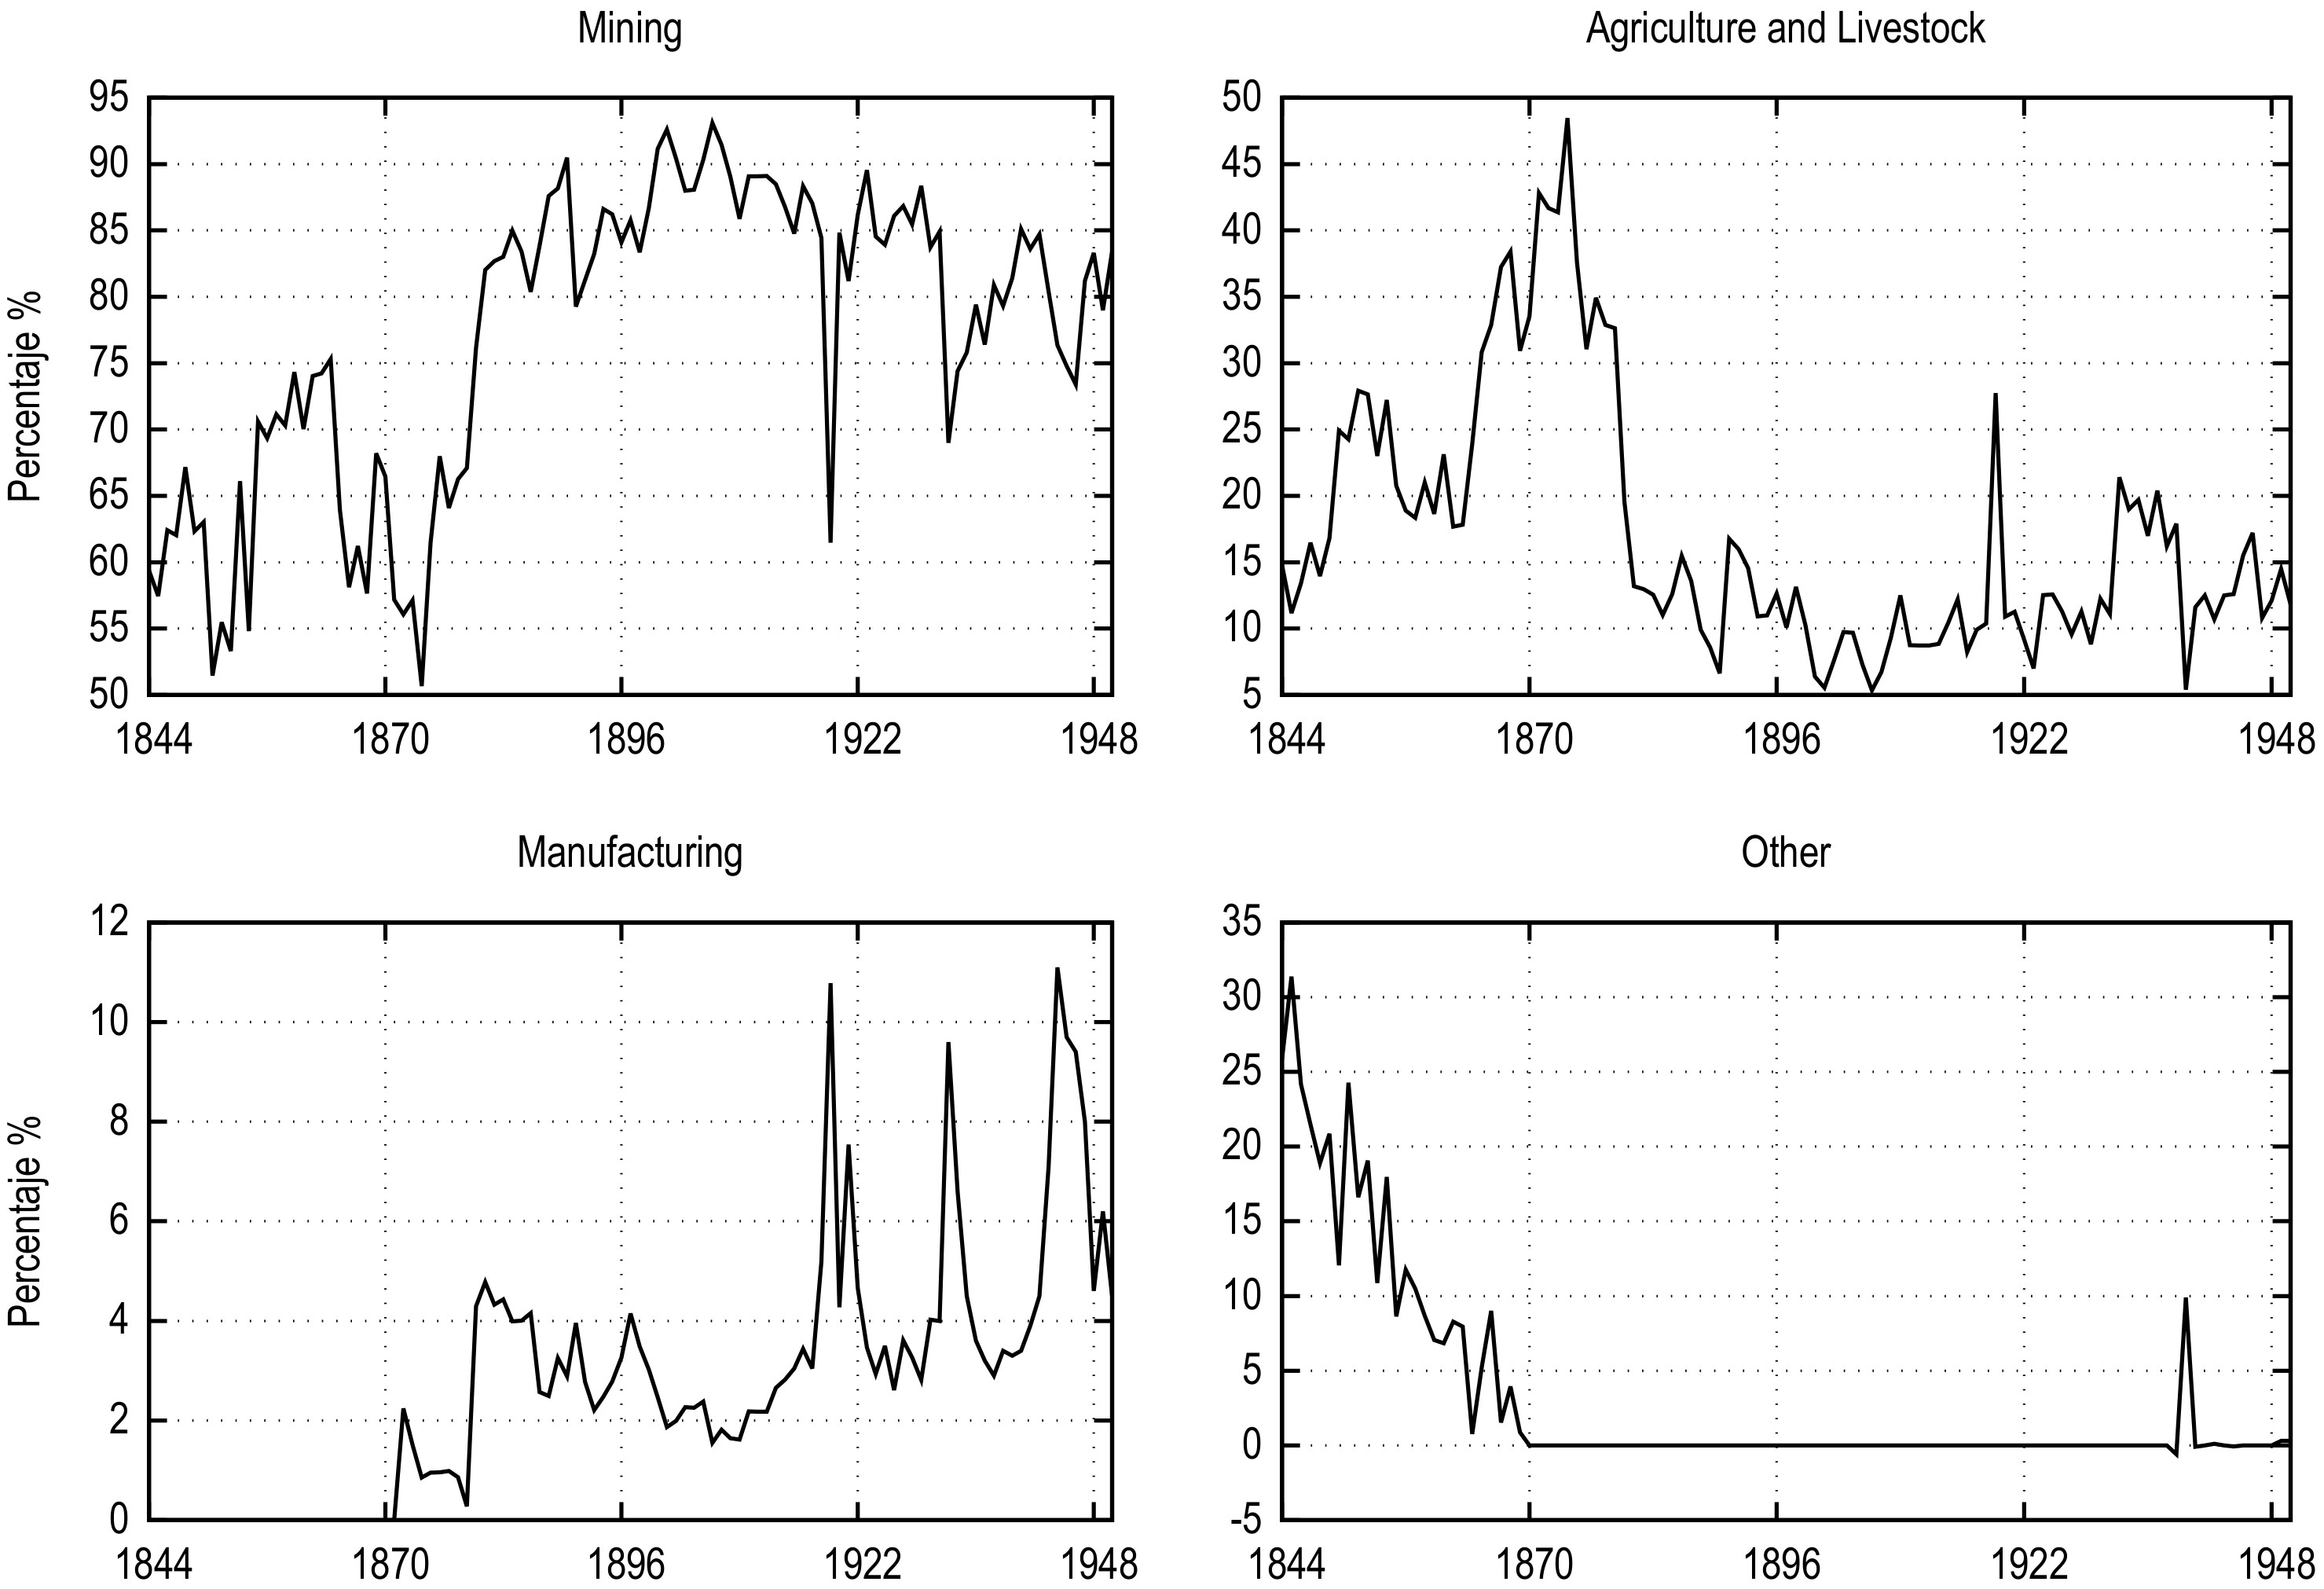
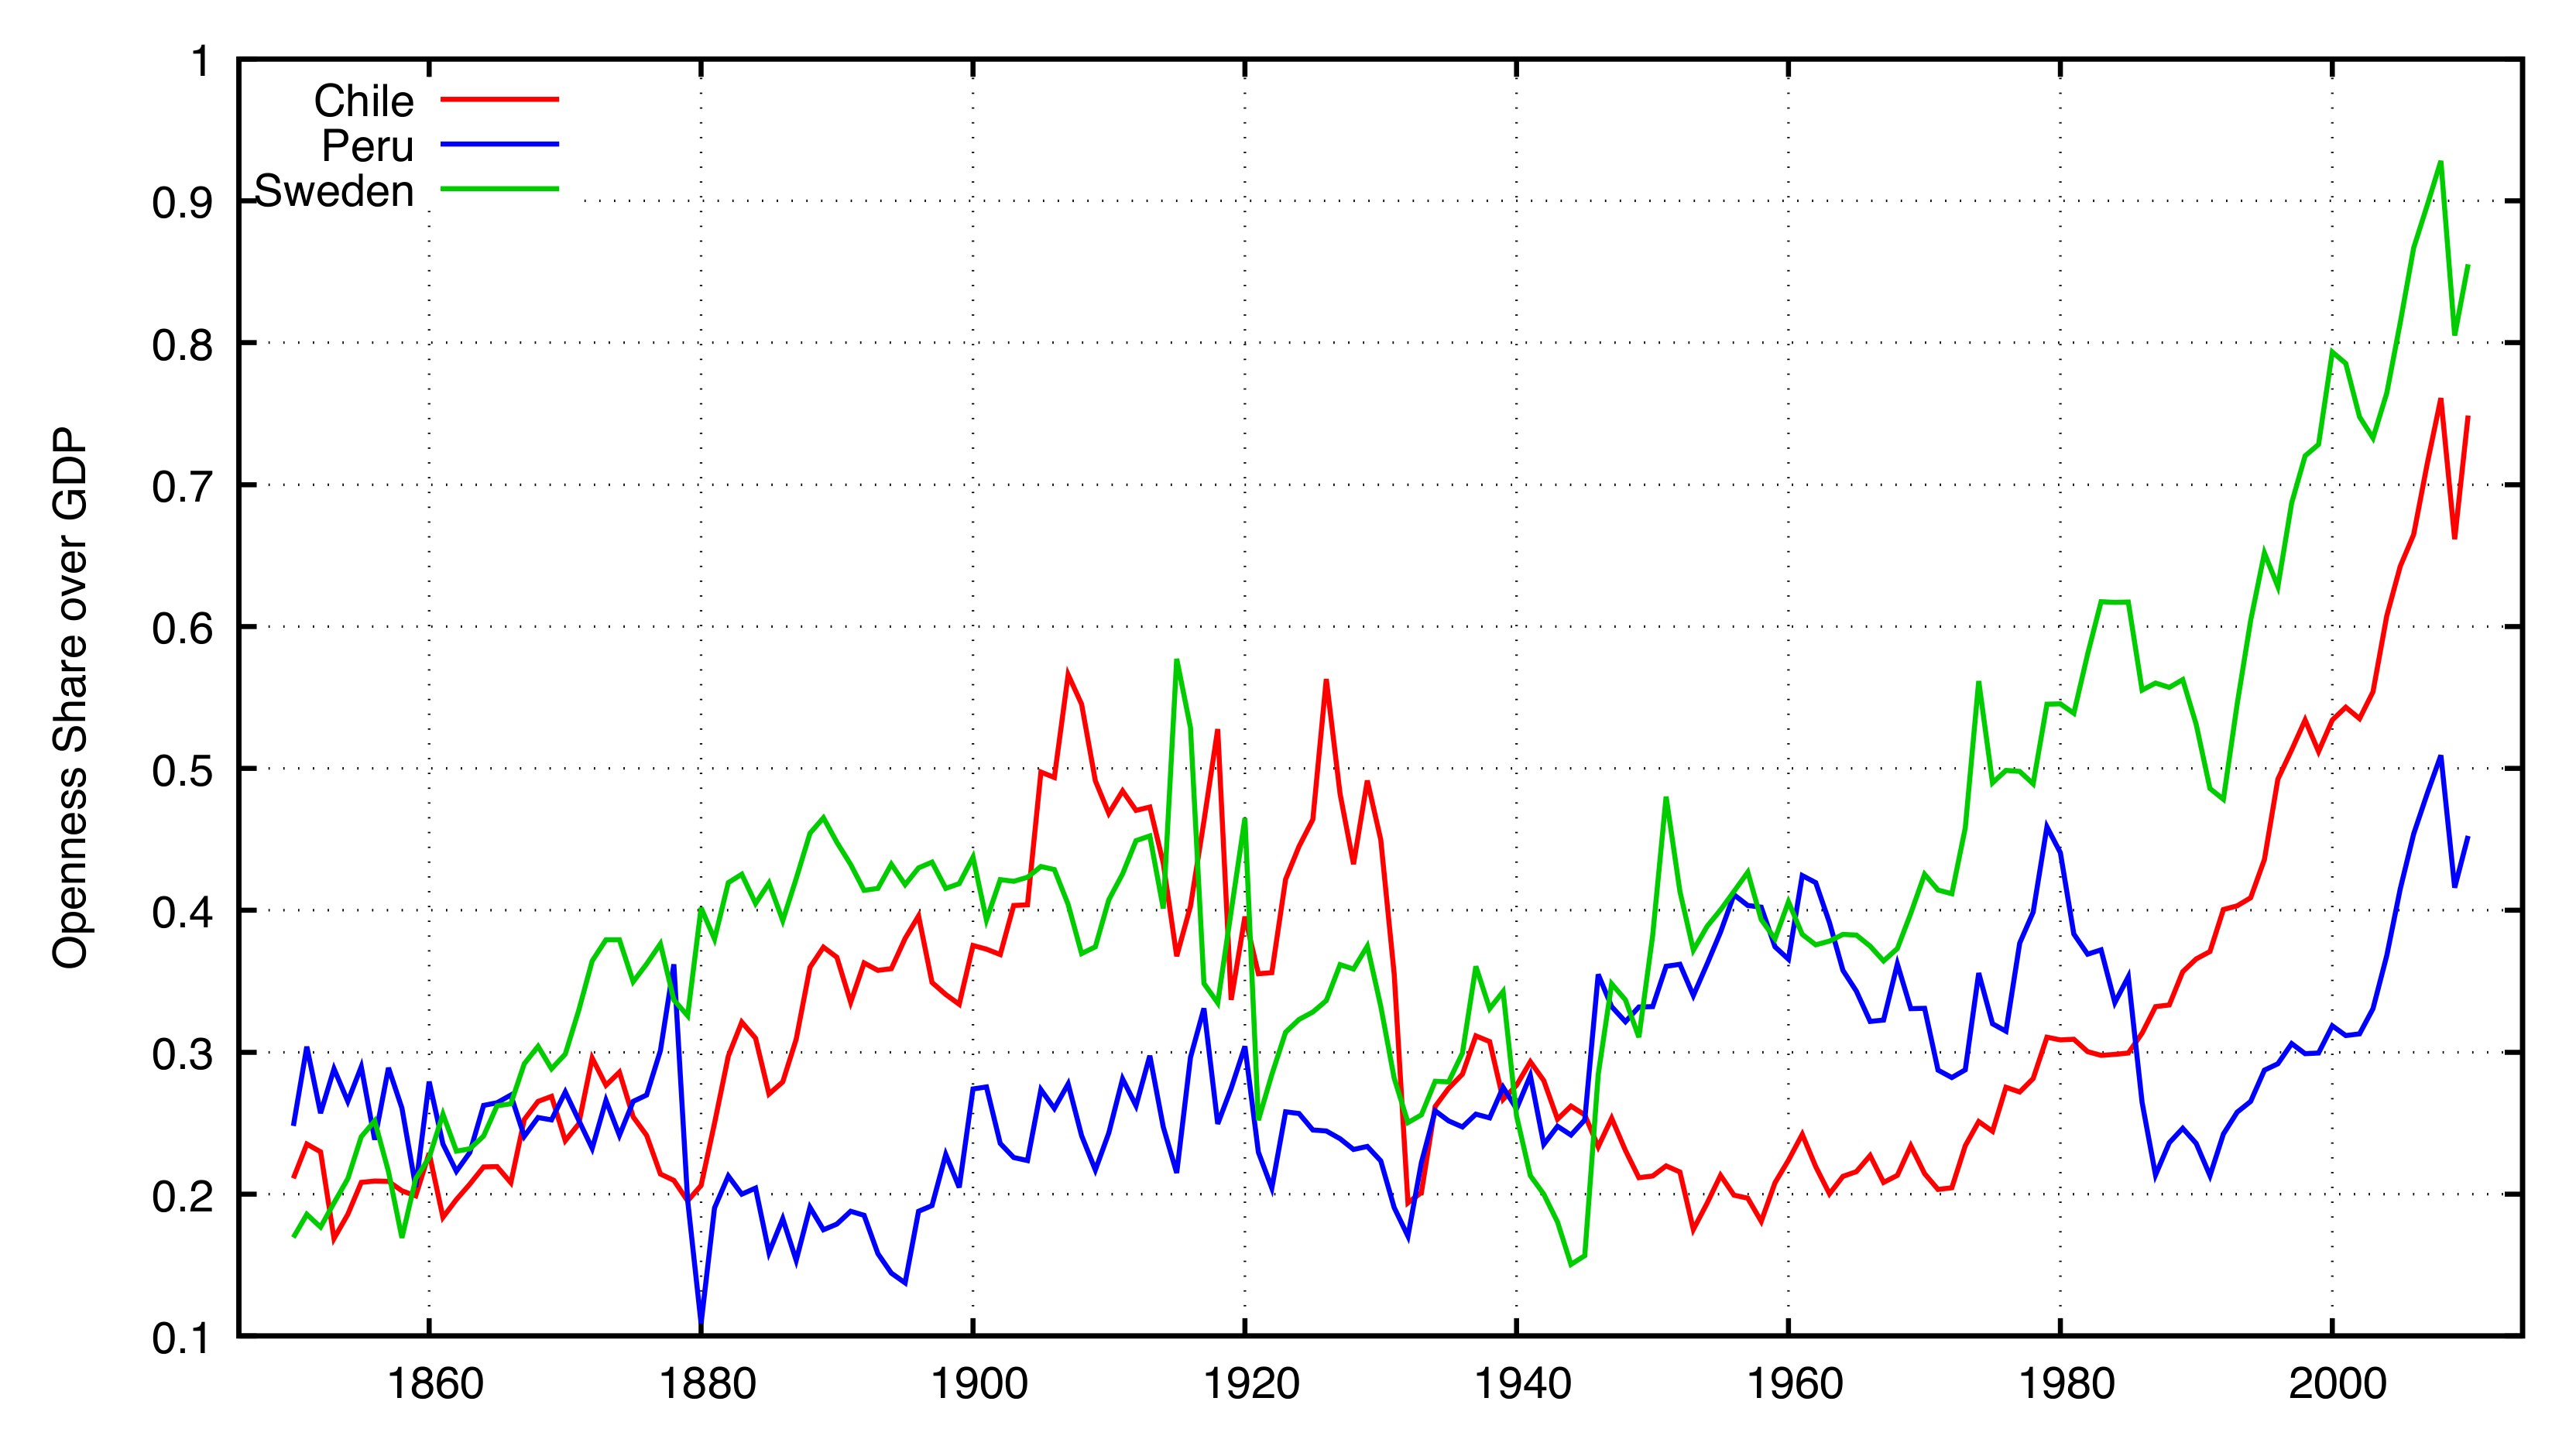
3.3.1. Trade

The existence (or not) of the natural resource curse is fundamentally linked to trade and, specifically, to international market integration. During the 19th Century, Andean countries and Scandinavian countries were taking advantage of reduced trade costs given the new technologies of the industrial revolution (railways and steamships). These peripheral regions sold their natural resources to the core economies and became part of the world market [11,72,84,85]. Here appears the Prebisch–Singer hypothesis and the adverse effects of a trade matrix exclusively or mainly based on natural resources. How different were Andean and Nordic countries in their insertion into world market? One way to measure this is the openness indicator (share of exports plus imports on GDP). Given our current available data, we present the trends for Chile, Peru and Sweden (Figure 3). Chile and Sweden had similar trends and levels until the Great Depression, whereas Peru was a bit less open, especially after the War of the Pacific. The inward-looking model adopted by Chile after the Great Depression meant a reduction in openness; meanwhile, Sweden was recovering dynamism through international trade.
The main difference about trade in Sweden, comparing its path with Andean countries, is the export basket and how the country diversified its economy from a natural resource-based one to industrial-services activities. As a counter-example, we could use the case of Chile. In Table 1 and Figure 2, we can observe until 1929 similar trends with Norway and Sweden and a higher GDP pc in relation to Finland. If we take a detailed look at the Chilean trade structure, a highly concentrated and low diversified matrix is found, with an enormous weight of mining, exposing the country to price volatility and structural changes (Figure 4). These changes occurred in the Great Depression. After a big drop in the GDP pc, Chile recovered its growth trend at the end of the 1930’s, but without any main change in the economic structure, only a replacement in the main commodity, copper becoming the main export product instead of saltpeter.
Export concentration is particularly high in Bolivia. From a long-term perspective, the transition from mineral products (mainly silver and tin) to oil and mainly natural gas stands out. This transition is verified in the relative importance of hydrocarbons in the GDP, the export basket and taxes from natural resource exploitation [86]. Moreover, in contrast to Nordic countries, the relative importance of industrial exports has been historically negligible. This is related to the late beginning of Bolivian industrialization (around the early 1920s) and the fact that the relative importance of this sector in total GDP has barely changed since the 1940s (around 15%).

3.3.2. Industry

In spite of the current trends towards services in advanced economies, the industrial sector has been crucial for development in many historical cases [11]. In this section, we summarize briefly the main traits of industry and its relation to natural resources in our six cases.
Industry has been historically weak in Peru. The trade liberalization in the 19th Century dismantled the colonial industrial establishments. At the end of the century, industry began to be reconstructed around the export sector, the activities of which were repairing furnaces, tools and pieces used for refining sugar and minerals. After the First World War, however, the growing sophistication of the technology used by the export economy ended with this incipient industry. Japanese, Spanish and Italian settlers who arrived in Peru around 1900 started a light industry of food and beverages, which grew during the 20th Century thanks to urban expansion and protectionist tariffs. In the final decades of the last century, the urban construction sector joined (cement, toilets, faucets, etc.). The first steel factory was created in 1956, and enjoyed state protection until the 1990s. At this point, the opening of the economy entailed the crisis of a large part of the industrial sector, and virtually only construction, food and clothing remained [87,88].
The foundation of the School of Engineers in 1875, during the guano boom, was a fundamental milestone in the history of Peruvian industry. However, its orientation towards mining and the Saltpeter War limited for a long time the role of this institution for manufacturing. Industrial workers were trained at the School of Arts and Crafts, established in 1864, but without great effects initially given the weakness of industry and the fiscal crisis due to the Saltpeter War. It reopened in 1905, during the government of José Pardo (which is why this school now bears the name of José Pardo Higher Technological Institute). In 1961, the training of industrial personnel was reinforced with the founding of the SENATI (National Training Service in Industrial Work). The professional aspiration of the majority of young people, who identify social progress with office work, typical of the middle classes, limited the role of these institutions.
Regarding Chile, its industrialization has been the focus of several debates. For example, the Chilean industrial GDP in the period 1880–1830 has been revisited several times and still is the cause of controversy among economic historians [59,68,89,90]. One of the consensuses achieved about this period is related to the industrial backwardness. The share of the industrial GDP in the total output was between 10 and 15% and was concentrated in consumer goods. During the First World War, an incipient industrialization was growing, in response to the locking of the international market; however, with the end of the conflict, the country resumed its dependence on foreign markets [57,58,59,61].
The state-led industrialization (also known as import substitution industrialization (ISI)) strategy has been the object of several critiques, especially for the poor economic performance during the 1950s. However, the analysis should not only look at the 1940–1973 period, but take into account the structural restrictions of the Chilean industrialization process (1870–1970) as a whole. Thus, if we keep our view just in the ISI years, we are not considering the problems faced by the Chilean economy to consolidate a diversified economy in the years prior to these policies [57,61,90]. In a long-term perspective, the ISI period could be considered a failure in GDP growth terms, but taking into account structural transformation and development, the share of industry was growing, and real wages remained matched with productivity gains [67].
In the case of Sweden, during the 1880s, iron and forestry were the dominating export sectors, and they were mainly driven by the British market. During the end of the century, iron and steel started to transform into machinery products before exports, and forestry-based exported commodities changed from being timber, to sawn wood and pulp and paper [70,91,92]. Indeed, Swedish firms became successful in exploiting the technologies of the Second Industrial Revolution from the late Nineteenth Century through engineering entrepreneurship that grew into large export-oriented corporations backed up by strong commercial banks [91,93]. The development of Swedish engineering reflected a small number of specific technical innovations introduced by Swedish inventors and entrepreneurs: the so-called ‘genius industries’, including companies like Ericsson (Opfikon, Switzerland), SKF (ball bearings, Gothenburg, Sweden), ASEA (today ABB, Zürich, Switzerland) and Alfa Laval (the separator, Lund, Sweden) [92,93,94]. At the same time, overseas experience among Swedish engineers was, like in the Norwegian case, far from uncommon between the 1880s to the 1940s [95]. Thus, the combination of export-based manufacturing industries based on refined and processed materials (e.g., pulp and paper industry, steel) and multinational engineering firms came to drive Swedish economic growth. In the 1950s, the share of manufacturing in Swedish exports was getting close to 50%, and only the United States had a higher share among the OECD countries ([92], p. 271). The engineering industry became, and still is, a strategic sector for modernizing the Swedish economy.
As in Sweden, industrialization in Finland was based on its iron and rich forest resources, and sawn timber was sold to both Russia and Western markets ([78], p. 144). An export-led growth of the sawmill industry and gradually of the pulp and paper industry took place, with several companies emerging like Kymmene AB (today UPM, Helsinki, Finland), W Gutzeit and Co Ab (today Stora Enso, Stockholm, Sweden) and A. Ahlström Oy (Alström Corp., Bronx, NY, USA), which grew into large corporations. Like in Sweden, Finland saw a growth in innovating entrepreneurship, including the Fredrik Idestam foundation of Nokia. Nokia was established in 1865 to produce pulp and paper and subsequently diversified into unrelated sectors, such as forestry (tissue), rubber and cables, and later during the 1960s into electronics [96]. Forests have been the most important natural resource for the Finish economy historically until present ([80], p. 16). Overall, Finland became efficient in exploiting opportunities in export markets and was during the catch-up phase a good adopter and copier of foreign models ([78], p. 205).
In Norway, natural resource products have represented a large share of exports. Timber and fish traditionally dominated the foreign trade ([97], p. 97). Timber accounted for the largest export industry in the late 19th Century, and after the turn of the century, timber, pulp and paper represented more than 40%. Agricultural products stood for over 30% in the late 19th Century and continued to be important export goods after the turn of the century together with fish, food and beverage products. Minerals, metals and chemicals were also important export products, especially aluminum, ferro-alloys, magnesium, steel and artificial fertilizer from the late 19th Century. Exports of mineral and metal products increased from less than six percent before 1913, to over 20% in 1930 [98]. In the 1970s, the mineral production branched out to the extraction of oil and gas, which in turn developed to become the most important economic industry. Oil and gas products have accounted for more than fifty percent of exports some years. Some years, oil and gas products have accounted for more than fifty percent of exports. It should be stressed, however, that the country developed multiple relatively big natural resource industries, as well as a large shipping industry, from an early stage, which expanded during the 20th Century. The diversified industrial structure made the country less dependent on one industry, and in turn less vulnerable than many of the Andean countries, and contributes to explaining the country’s remarkable growth.
Indeed, growth in Norway has largely been based on linkages between industries and specializations within natural resource sectors. Development has been characterized by industries naturally encouraging one another. One of the cornerstones of the Norwegian economy in the 20th Century, before oil and gas, was the large-scale chemical- and electro-metallurgical industry, which branched out of the mining sector. This new industry was largely based on large foreign investments, notably Swedish, British and North American [99]. Total foreign capital in Norwegian industry represented 38.8% in 1909 and 80.3% in mineral and metal extraction ([99], p. 36). Important companies, such as Elektrokemisk and Norsk Hydro, were established with Swedish capital (Wallenberg) and normally employed hundreds of workers ([99], p. 34). A key point here is that it seems like multinational companies have been more integrated in the Norwegian economy (and Nordic economies more widely) than in the Andean economies and that Nordic countries have benefited more from foreign investments than Andean countries [32,99]. It is reasonable to believe that differences in ‘absorptive capacity’, which in turn can be related to discrepancies in knowledge development, contribute to explaining such differences [33]. The ‘knowledge gap’ between the Nordic and the Andean countries is further discussed in the next section.

3.4. A Knowledge Gap

Industrial development in the Nordic countries has relied heavily on the transfer of technology from abroad. Innovation has involved the transfer of equipment, machinery, working methods, techniques, etc., from other countries, and adapting and further developing them according to local conditions. Transfer of technology, notably from large industrial powers, is often stressed as key for small ‘catching-up economies’ of the Industrial Revolution ([100], p. 34). An open and flexible attitude towards new ideas and knowledge development and measures to enable transfer and absorb knowledge have a long history in these countries. Copper and silver mining in Norway, which developed in the 18th Century, was based on German expertise. Kristine Bruland shows that the advance of the textile industry in the mid-19th Century involved multifaceted technology transfers from Britain in collaboration with local workers [100]. Similarly, the development of the workshop industry from the 1840s was a result of “…training and education, access to information on foreign technical advances and the ability to use information” ([100], p. 73). In his analysis of traveling Swedish engineers from 1880–1930, Per-Olof Grönberg finds that learning experiences from abroad were highly valued by Swedish firms [95]. This ‘outward-looking’ and open position persisted. In Norway, large-scale mining from the late 19th Century and the important oil and gas industry largely developed based on the adoption of foreign extraction techniques [99].
The importance of international knowledge transfer in the Swedish interwar copper industry is also clearly demonstrated by Bergquist and Lindmark in their study of the Swedish company Boliden [101]. In exploring the strategies adopted by this firm in constructing its large copper smelter in the 1920s, they find the Swedish industrialists, who had worked in the early careers as engineers at corporations in the U.S., went back overseas to access knowledge through their established networks. In developing a metallurgical process for Boliden’s copper smelter, both in-house R&D and transfer of knowledge from U.S. copper companies became embodied in its smelter technologies.
In line with this evidence, Kristin Ranestad hypothesizes that the diverging paths of the Nordic the Andean countries is partly explained by differences in knowledge development. She analyzes and compares two of the ‘natural resource-intensive economies’ countries that are considered here, namely Chile and Norway [33,102]. They have been closely similar in industrial structure and geophysical conditions, and they had similar growth during the 19th and early Twentieth Century; yet, they have had different development trajectories thereafter. Her thesis contributes to the debate about how and why some economies based on natural resource activities have been more dynamic and innovative than others by indicating contributing factors of key differences in one natural resource sector both countries developed, namely mining. Initiatives were made in both places to develop and accumulate knowledge, notably through the establishment of domestic and foreign mining enterprises, formal mining education, industrial societies, technical journals, travel scholarships and research centers. However, more knowledge was developed and accumulated in Norway than in Chile, which indicates that there was a knowledge gap between the two countries. Mining instructions were similar, but there were striking differences when it came to: (1) the number of graduates; (2) the number of travel arrangements for practical learning; and (3) organized geological mapping and ore surveys. These differences contribute to explaining the emerging gap of the two sectors, which in turn may be linked to the role of the state. In Norway, the state was much more active in supporting knowledge development through funding of basic and technical education, scholarships and the National Geological Survey. In Chile, these key knowledge organizations were given lower priority by political decision-makers.
In wider terms, differences in literacy rates and levels of basic and technical education in the 19th and 20th Century between the Nordic countries and the Andean countries indicate a higher degree of knowledge development in the former than in the latter. Indeed, Norway started early with a national literacy program. Campaigns to improve the reading and writing skills of the Norwegian population have roots back to the 17th Century ([103], p. 271). The Church encouraged reading through religious texts from early on, and the first school of law in Denmark-Norway was introduced in 1731. The oldest primary school in the Nordic countries opened in Bergen in 1740 and was financed by the Cross Church. During the 19th, the government gradually increased public funds to education [97]. From 1827, all children in the country between seven and fourteen years old were to receive teaching in reading, writing and some calculation for at least three months a year ([104], pp. 242–243). In 1837, 86.4% of the children in the appropriate age obtained instruction. In 1860, a law, which established a school system with regular school for all during seven years, was introduced ([104], pp. 242–244). The share of literate people in Norway was very high from early on compared to other European countries. Fritz Hodne finds that in 1873, around 87% were able to write and read and 99% were able to read ([104], p. 250). Other sources show that by the 1890s, the literacy estimate rate was near 100%. According to Carlo Cipolla, more than 70% of the adult population was literate by 1850, and Norway became one of the countries with the highest literacy in Europe ([105], p. 113).
Literacy among the Swedes was also comparatively high from a European perspective already before the mid-19th Century, much due to the Swedish Church efforts from the 18th Century to control the Swedes’ ability (including the impoverished population) to read religious text. Literacy was reinforced by the Elementary School Reform of 1842 ([70], pp. 75–76). In Finland, in 1880, only around 10% of the population was able to both write and read. Then, the situation changed considerably. In 1920, 58% of the population could both write and read ([78], p. 148). In the 20th Century, Finland came to heavily invest in education, training and technological and industrial R&D, especially during the second half of the Twentieth Century [78,106].
In contrast, there is an agreement among scholars that education and literacy were very poor in the Latin American region during the 19th Century [107]. Likewise, despite some improvements during the 20th Century, it has been suggested that these changes were not enough in terms of the quantity and equity of public spending and not outstanding from an international perspective [108,109]. In the Chilean case, for instance, it was only in 1920, more than a century after independence, that compulsory primary education was introduced. As late as the 1950s, approximately 9% of the school age population never attended school; 30% of those who entered the first grade abandoned school within the first two years; and only 28.6% of the school age population completed their primary education. In 1960, only about 20% of a given age cohort entered secondary education. Moreover, only one half, or fewer, of the high school graduates succeeded in passing the final high school exam ([110], pp. 305–306). A large share of the population in Chile was illiterate up until recent decades. In 1865, only 18% of the population was literate, which increased to 30.3% in 1885 [111,112]. In 1950, 19.8% of the population was still illiterate ([32], p. 7). A similar pattern is evident in the Peruvian case: according to official statistics, illiteracy was 81% in 1876, 79% in 1902 and still 39% in 1961. Children between six and 14 who attended school were 29% in 1902 and 35% in 1940. As for the Bolivian case, it should be noted that in spite of radical political changes and the continuous increase of public spending in education from the late 1930s, full literacy and full primary attendance was achieved just at the turn of the 21st Century [113].

3.5. Fiscal Policy

Another possible explanation for the divergence between Nordic and Andean countries is the role of the public sector. Today, the Nordic countries are known for having high levels of public involvement in their economies. For instance, the Norwegian public sector manages the country’s oil wealth, and Scandinavians enjoy encompassing welfare states that provide for their needs in studying, keeping healthy, parenting and aging. Were the Nordic states active in economic development already early in our period? Could this contribute to explaining the different outcomes in the six countries?
The literature has indeed identified the public sector as a driver of economic growth in Scandinavia, already in the late 19th Century. The Swedish case can serve as an example: according to Schön, the state took on a prominent role in investment in physical infrastructure (railways, telegraph, electrification) and in education [114]. Similar patterns have been found in the Norwegian and Finnish economies. In the case of Chile, there is a debate about the destination of nitrate rents and how the resource boom was managed. There was a noticeable investment in infrastructure, but extremely concentrated [60].
Public investment, of course, needs public resources. The Nordic countries have high tax-to-GDP ratios to fund their extensive public services, a trait whose historical roots can be traced quite a way back. Figure 5 shows tax revenues as a share of GDP for our six countries. Even though some of the series are not complete, some general facts can be appreciated. First, the levels in Andean and Scandinavian countries lied quite close to each other at our point of departure. Chile is seen together with Norway, Finland and Sweden with a tax revenue ratio between 5 and 10% of GDP, which was the standard for Western countries at the time. Bolivia and Peru were slightly less able to obtain public revenues, but the difference was not large. Today, however, Scandinavian countries provide their public sectors with incomes corresponding to 40–45% of GDP, whereas the corresponding number in the Andean countries is near 20%. The difference between both groups is now very acute, although tax ratios have decreased in the Nordic countries in recent times, while the opposite evolution has occurred in Bolivia, Chile and Peru.
When did this divergence appear? The earliest signs seem to show around World War I, which prompted increases in the tax revenue in Norway and Sweden, whereas the Chilean ratio decreased. The image of the two groups of countries is not clear, however, until the 1930s–1940s. At this point, the Nordic tax revenue levels had taken off intensely. Our American countries, however, showed a lower and more erratic evolution of their fiscal capacity.
Changes in the tax structure could be a driver of the increase in tax revenue levels. The introduction of modern forms of taxation implied a diversification of the tax base, which would have allowed obtaining more public revenues and, in turn, funding public investment. The literature has identified the occurrence of several tax transitions along the path of economic development [115,116]. In the late 19th Century, public revenues in many countries were heavily based on taxes on external trade: these were relatively easy to administer and also the place where some economic surplus was found [117]. Gradually, new forms of taxation came to be and grew in importance: modern personal income taxes were introduced in some countries in the late 19th or early 20th Century, but were not big sources of revenue until World War I or much later [118,119]. Within indirect taxation, the general development was the decrease in the role of customs and export taxes and the corresponding increase in internal taxation, mostly of the general type: turnover or, eventually, value-added taxes.
The tax history of Scandinavia has identified these countries as early modernizers. They introduced personal income taxes near the turn of the 20th Century, and these soon provided high levels of tax revenue. The Nordic countries were also determined users of heavy consumption taxes in the second half of the 20th Century (value-added taxes with comparatively high rates and few exceptions). These, together with social contributions, were the fiscal bases of active welfare states [120,121]. Bolivia, Chile and Peru (like Latin America in general) have been more late in enacting income taxes, which still today represent very low shares of their GDPs and public budgets [122]. Fiscal capacity remained limited [123]. Value-added taxes were introduced in the region during the 1970s, allowing an increase in revenue at a time of tariff reduction (Bolivia 1973, Chile 1974, Peru 1976).
Differences in tax to GDP ratios, as well as differences in tax transitions can be explained by economic political and administrative factors. Firstly, higher levels of economic development provide the surplus from which public revenue can obtain its resources. It is no coincidence that in the 1930s we see Nordic countries forging ahead from the Andean one, who were heavily affected by the Great Depression (Figure 2). However, the story does not end with the size of the economy. Political channels are also potentially important. Lindert has signaled democracy as a determinant for increased social spending; and the corresponding revenue needs [121]. Aidt and Jensen examined the expansion of income taxes in Western countries, also finding that the extension of the franchise tended to favor this development [124]. Together with a prolonged democratic experience, Nordic countries also have a history of significant local autonomy (including in fiscal management), which is a differential trait with respect to Latin America.
The impact of democratic institutions may, however, be highly intertwined with inequality levels. Sokoloff and Zolt pointed out that, within the Americas, regions with higher inequality developed tax systems with lower revenues and in turn lower social spending [125]. Scandinavian countries display today the lowest levels of inequality in comparative terms, but whether this was likewise in the long 19th Century remains to be clearly established. Roine and Waldenström showed that top income concentration in Sweden was similarly high at the onset of the 20th Century as in other Western countries; although it decreased intensely thereafter [126]. The literature has, in any case, remarked the importance of the structure of land property, with small freeholders in Scandinavia having a political voice early in the 20th Century [71,114,127].
Administrative considerations should also be taken into account. All taxes are not similarly easy to collect, and the context to which they are applied makes a difference [128,129]. In this context, two elements are critical: literacy/numeracy and the business structure. Concerning the first, basic numeracy skills are needed for an income tax system where people are asked to file their own returns and self-assess their incomes and tax payments. Several works point towards Scandinavia having high levels of numeracy already at the beginning of our period, which would have made the administration of an income tax system feasible [130,131] (remember as well the references about high literacy in the previous subsection). Business size is another determinant of tax collection and has been acknowledged as such in modern times [132,133]. The business structure conditions as well the potential for the formation of powerful pressure groups, which might position themselves against high taxes.

4. Conclusions

The development path comparison of our group of countries of the periphery stresses several stylized facts. First of all, the analysis of GDPpc estimates suggests that, besides the existence of non-negligible differences during the 19th Century, Nordic and Andean countries started a systematic divergent process during the Great Depression. The economic gap between the two groups widened during the 1950s–1980s (the exact time being different in each Andean country) because of both political and economic instability in Andean countries. The recent “super-cycle prices” have allowed some convergence, but the GDP pc of Andean countries is, in the best case, 50% of the GDPpc of Nordic countries.
It should be stressed, however, that in order to quantify sustainable development, mainstream measures such as GDP pc have become criticized. Facing these challenges, since the 1990s, there is constant work on green and sustainable national accounts. One of the most spread of these measures is genuine savings (GS), which account for net savings, natural resource depletion, environmental damage (using CO 2 emission as a proxy), human capital formation and total factor productivity gains. There are some advances regarding two of the countries of our study; in the case of Sweden, GS estimations are available since 1850 and in the case of Chile since 1900 [134,135]. The incorporation into the analysis of resource intensity measures could also improve our understanding due to fact decoupling: the capacity of the digital economy to reduce the use of materials is going to have an impact on countries depending on natural resources [136]. In this context, further research should focus on the reconstruction of green national accounts for the rest of the countries studied in this paper. This new evidence should help to test if the timing of divergence persists with measures where sustainability is more present than in the GDP pc, as well as to analyze how much natural resource depletion has become useful investments (fixed and human capital).
The paper has also tried to identify the reasons for the divergence process between Andean and Nordic countries. Whereas population growth may partially explain this economic gap, other economic factors are certainly at play. One of these factors is trade. On the one hand, the integration of the two groups of countries into the world economy has been different: Nordic countries have been systematically open to international trade, and Andean countries have followed different openness/closure trends. On the other hand, the persistence of natural resource exports in Andean countries and a diversification process towards more complex products in Nordic countries stand out. In the first case, if some diversification happened, it was within the same activity (i.e., from nitrates to copper mining; or from tin to oil) or between activities of low value added (from raw minerals to agricultural products). In contrast, Nordic countries were able to introduce industrial products to global markets already at the turn of the 20th Century.
We believe that more work is needed in the study of the export baskets’ composition, the country export diversification and how their evolution (or path dependence) is behind the divergence between Andean and Nordic countries. This last point is related to the old theory, but totally “alive”, about the evolution of the terms of trade (and its volatility) in the long run and its impact on growth. Although the “super-cycle prices” have challenged this hypothesis, the downward trend in oil prices and commodities in the last few years have stressed the importance of how countries are integrated to the world economy. Another key factor that explains the existence of different patterns between countries is their access to distant markets. In that sense, those countries specializing in natural resource exports that were closer to the U.K. (or, generally speaking, industrializing economies) could benefit more in the long run [137].
The different nature of integration is certainly related to differences in the industrialization process. Indeed, during the late 19th and early 20th century, while the so-called light industries, such as food and beverages, started to be widespread in Andean countries, Second Industrial Revolution technologies were developed in Nordic countries. In the paper, we have stressed the existence of critical differences between Nordic and Andean countries in their ability to adopt frontier technologies. This ability or social capability is again at the debate forefront in a time when the adoption of “frontier technologies” should allow great productivity increases in developing economies [138]. Indeed, the existence of an “innovation paradox” is stressed where, despite the existence of a vast potential of technological adoption, developing countries invest little in innovation because of the lack of critical complementarities for innovation [139].
One of these complementarities has been critically explored in the paper: knowledge accumulation. Indeed, we have stressed the existence of a knowledge gap (defined as a difference in the countries’ ability to adopt and use foreign knowledge) between the countries under scrutiny. The origins of this gap could be traced back to the 17th and 18th Century, when literacy was strongly promoted in Nordic countries. Nevertheless, this gap widened during the late 19th and early 20th century, when the stock of native engineers increased sharply in these countries. The availability of this skilled labor was critical in the adoption of frontier knowledge, as well as in the increase of local innovation.
The understanding of this knowledge gap still takes part in ongoing research. However, it is certainly important to analyze the existence of a different institutional framework in both groups of countries. During the 17th and 18th centuries, this could be related to differences in values/informal institutions: people had (or not) to be able to read and discuss God’s word. Thereafter, the role of the state in the economy, as well as the state capacity to tax played a fundamental role. Indeed, our study has shown the existence of a clear divergent path in the tax to GDP ratio that started during the First World War and widened during the 1930s and 1940s. This gap was, in turn, related to the Nordic states’ ability to diversify their tax structure towards more modern forms of taxation.
Further work needs to explored more in the analysis and comparison of the tax revenue structure in Andean and Nordic countries. Particularly, the literature has signaled that where the public sector enjoys a boom of revenues from expanding commodity exports, incentives to develop fiscal capacity might be lower [140]. This could in turn affect the emergence of a “fiscal contract” between state and citizens, where tax revenue (and especially direct taxes) would make governments more prone to provide valued public goods in exchange [141]. It is therefore necessary to establish the levels of fiscal dependency from natural resources across the economies under study and how it might have affected tax transitions [123]. Did the Nordic countries have lower levels of dependency and, therefore, higher incentives to look for alternative ways of raising revenue; or were modern taxes more feasible on other grounds? While the literature has provided national tax history accounts, a comparative approach will shed light on the divergence in fiscal terms and the role played for the different paths towards economic development. We suggest that the details of the tax transitions could be intertwined with the levels of fiscal dependency from natural resources.
Summarizing, the current extreme income differences between Nordic and Andean countries has not been constant. The role of natural resources regarding this feature has been highlighted throughout the article, and new questions have been raised. We believe that more historical research around these questions could provide useful insights for developing countries with abundant natural resource endowments.

Acknowledgments

This work is funded by Vetenskapsrådet (The Swedish Research council), Project “Sustainable Development, Fiscal Policy and Natural Resources Management. Bolivia, Chile and Peru in the Nordic countries’ mirror”, Reference: 2016-05721.

Author Contributions

Ducoing and Peres-Cajías were the main contributors, writing the Introduction, gathering the data and interpreting the results. Badia-Miró collaborated on the natural resource curse literature and the data for the six countries. Bergquist wrote the majority of the Swedish and Finish sections. Contreras collaborated with the analysis of the Peruvian economy. Ranestad was involved with the Norwegian economic history and the country comparisons. Torregrosa wrote the parts related to the fiscal aspects.

Conflicts of Interest

The authors declare no conflict of interest.

Appendix A

Sources: Finland from Flora, Kraus, and Pfenning, (1987) and Flora (1983) with GDP from Hjerppe and Kopi-jyvaä (1996), OECD Statistics since 1965 [79,142]. Norway from Statistics Norway (1948) [98] until 1946, Flora (1983) [142], OECD Statistics since 1965, with GDP from Grytten (2004) [143]. Sweden from Henrekson and Stenkula (2015) [144]. Bolivia from Peres-Cajías (2014), since 2011 from CEPALSTAT [145]. Chile from Díaz et al. (2010) Díaz, Lüders and Wagner (2016), since 1990 from CEPALSTAT [68]. Peru from Portocarrero S., Beltrán B., and Romero P., (1992), since 1990 from CEPALSTAT [146]. Notes: total revenue for Latin American countries, tax revenue for Scandinavia. Central Government in Latin America, General Government in Scandinavia.

References

  1. Auty, R.M. Sustaining development in mineral economies: The resource curse thesis. Resour. Policy 1993, 20, 77–78. [Google Scholar]
  2. Sachs, J.D.; Warner, A.M. Natural resource abundance and economic growth. HIID Work. Pap. 1995. [Google Scholar] [CrossRef]
  3. Sachs, J.D.; Warner, A.M. The curse of natural resources. Eur. Econ. Rev. 2001, 45, 827–838. [Google Scholar] [CrossRef]
  4. Gylfason, T. Natural resources, education, and economic development. Eur. Econ. Rev. 2001, 45, 847–859. [Google Scholar] [CrossRef]
  5. Gylfason, T. The International Economics of Natural Resources and Growth; CESifo Working Paper Series No. 1994; CESifo: Munich, Germany, 11 June 2007. [Google Scholar]
  6. Auty, R.M. Natural resource endowment, the state and development strategy. J. Int. Dev. 1997, 9, 651–663. [Google Scholar] [CrossRef]
  7. Blattman, C.; Hwang, J.; Williamson, J.G. Winners and losers in the commodity lottery: The impact of terms of trade growth and volatility in the Periphery 1870–1939. J. Dev. Econ. 2007, 82, 156–179. [Google Scholar] [CrossRef]
  8. Van Der Ploeg, F.; Venables, A.J. Harnessing Windfall Revenues: Optimal Policies for Resource-Rich Developing Economies. Econ. J. 2011, 121, 1–30. [Google Scholar] [CrossRef]
  9. Rozenwurcel, G.; Katz, S. La economía política de los recursos naturales en América del Sur. Rev. Integr. Comer. 2012, 35, 19–36. [Google Scholar]
  10. Willebald, H.; Badia-Miró, M.; Pinilla, V. Introduction: Natural resources and economic development. What can we learn from history? In Natural Resources and Economic Growth: Learning from History; Badia-Miró, M., Pinilla, V., Willebald, H., Eds.; Economic History, Routledge: Abingdon, UK, 2015. [Google Scholar]
  11. Williamson, J.G. Industrial Catching up in the Poor Periphery 1870–1975. CEPR Discuss. Pap. 2011, 16809. [Google Scholar] [CrossRef]
  12. Collier, P.; Hoeffler, A. Resource Rents, Governance, and Conflict. J. Confl. Resolut. 2005, 49, 625–633. [Google Scholar] [CrossRef]
  13. Papyrakis, E.; Gerlagh, R. The resource curse hypothesis and its transmission channels. J. Comp. Econ. 2004, 32, 181–193. [Google Scholar] [CrossRef]
  14. Frankel, J.A. The Natural Resource Curse: A Survey; NBER Working Paper No. 15836; National Bureau of Economic Research: Cambridge, MA, USA, 2010. [Google Scholar] [CrossRef]
  15. Venables, A.J. Using Natural Resources for Development: Why Has It Proven So Difficult? J. Econ. Perspect. 2016, 30, 161–184. [Google Scholar] [CrossRef]
  16. Sinnott, E.; Nash, J.; Torre, A.D. America and the Caribbean beyond Booms and Busts? World Bank Publications: Washington, DC, USA, 2010; p. 100. [Google Scholar]
  17. Hujo, K.; McClanahan, S. Financing Social Policy: Mobilizing Resources for Social Development; Palgrave Macmillan: Basingstoke, UK, 2009; p. 379. [Google Scholar]
  18. Mosley, P. Fiscal Policy and the Natural Resources Curse: How to Escape from the Poverty Trap; Palgrave: New York, NY, USA, 2017; p. 246. [Google Scholar]
  19. Smith, B. The resource curse exorcised: Evidence from a panel of countries. J. Dev. Econ. 2015, 116, 57–73. [Google Scholar] [CrossRef]
  20. Boschini, A.D.; Pettersson, J.; Roine, J. The Resource Curse and its Potential Reversal. World Dev. 2013, 43, 19–41. [Google Scholar] [CrossRef]
  21. Brunnschweiler, C.N.; Bulte, E.H. The resource curse revisited and revised: A tale of paradoxes and red herrings. J. Environ. Econ. Manag. 2008, 55, 248–264. [Google Scholar] [CrossRef]
  22. Haber, S.S.; Menaldo, V. Do Natural Resources Fuel Authoritarianism? A Reappraisal of the Resource Curse. Am. Political Sci. Rev. 2011, 105, 1–26. [Google Scholar] [CrossRef]
  23. De Ferranti, D.; Perry, G.; Lederman, D.; Maloney, W. From Natural Resources to the Knowledge Economy: Trade and Job Quality; World Bank: Washington, DC, USA, 2002. [Google Scholar]
  24. Stijns, J.P.C. Natural resource abundance and economic growth revisited. Resour. Policy 2005, 30, 107–130. [Google Scholar] [CrossRef]
  25. Wrigley, E.A. Energy and the Industrial Revolution; Cambridge University Press: Cambridge, UK, 2010. [Google Scholar]
  26. Wright, G. The USA as a Case Study in Resource-Based Development. In Natural Resources and Economic Growth: Learning from History; Badia-Miró, M., Pinilla, V., Willebald, H., Eds.; Routledge: Abingdon, UK, 2015. [Google Scholar]
  27. Ville, S.; Dean, P.; Wicken, O. Dynamic Natural Resource Paths of Economic Development in Australia and Norway since 1950. 2018, in press. [Google Scholar]
  28. Hillbom, E. Cattle, diamonds and institutions: Main drivers of Botswana’s economic development, 1850 to present. J. Int. Dev. 2014, 26, 155–176. [Google Scholar] [CrossRef]
  29. Hillbom, E. Botswana: Caught in a natural trap. In Natural Resources and Economic Growth: Learning from History; Badia-Miró, M., Pinilla, V., Willebald, H., Eds.; Routledge: Abingdon, UK, 2015. [Google Scholar]
  30. Herranz-Loncán, A.; Peres-Cajías, J.A.J. Tracing the reversal of fortune in the Americas: Bolivian GDP per capita since the mid-nineteenth Century. Cliometrica 2015, 10, 99–128. [Google Scholar] [CrossRef]
  31. Bolt, J.; van Zanden, J.L. The Maddison Project: Collaborative research on historical national accounts. Econ. Hist. Rev. 2014, 67, 627–651. [Google Scholar] [CrossRef]
  32. Blomström, M.; Meller, P. Diverging Paths: Comparing a Century of Scandinavian and Latin American Economic Development; Inter-American Development Bank: Washington, DC, USA, 1991; p. 276. [Google Scholar]
  33. Ranestad, K. The mining sectors in Chile and Norway, ca. 1870–1940: The development of a knowledge gap. Innov. Dev. 2017, 8, 1–19. [Google Scholar] [CrossRef]
  34. Broadberry, S.; Wallis, J.J. Growing, Shrinking, and Long Run Economic Performance: Historical Perspectives on Economic Development; NBER Working Paper No. 23343; National Bureau of Economic Research: Cambridge, MA, USA, 2017. [Google Scholar]
  35. Bolt, J.; Inklaar, R.; de Jong, H.; van Zanden, J.L. Maddison Project Database, Version 2018. Rebasing ‘Maddison’: New Income Comparisons and the Shape of Long-Run Economic Development; University of Groningen: Groningen, The Netherlands, 2018. [Google Scholar]
  36. De la Escosura, L. When did Latin America fall behind? In The Decline of Latin American Economies: Growth, Institutions, and Crises. NBER-Conference Report; University of Chicago Press: Chicago, IL, USA, 2009. [Google Scholar]
  37. Klein, H.S. A Concise History of Bolivia; Cambridge University Press: Cambridge, UK; New York, NY, USA, 2011; Volume 2, p. 360. [Google Scholar]
  38. Mitre, A. Los Patriarcas de la Plata: Estructura Socioeconómica de la Mineria Boliviana en el Siglo XIX; Instituto de Estudios Peruanos: Lima, Peru, 1981; p. 229. [Google Scholar]
  39. Contreras, M. Tecnología Moderna en los Andes: Minería e Ingeniería en Bolivia en el Siglo XX; Biblioteca Minera Boliviana: La Paz, Bolivia, 1994. [Google Scholar]
  40. Mitre, A. Bajo un Cielo de Estaño: Fulgor y ocaso del Metal en Bolivia; Asociaciòn Nacional de Mineros Medianos: La Paz, Bolivia, 1993; Volume 6, p. 307. [Google Scholar]
  41. Peres-Cajías, J.A.; Carreras-Marín, A. The Bolivian Export Sector, 1870–1950. In Latin America’s First Export Era Revisited; Kuntz, S., Ed.; Palgrave: London, UK, 2017; Chapter 3. [Google Scholar]
  42. Grindle, M.; Domingo, P. Proclaiming Revolution: Bolivia in Comparative Perspective; Institute of Latin American Studies: Cambridge, MA, USA; London, UK, 2003; Volume 10, p. 424. [Google Scholar]
  43. Sandoval, C.D.; Sandoval, A.V.; del Rio, M.A.; Sandoval, F.; Mertens, C.; Parada, C. Santa Cruz: Economía y Poder, 1952–1993; Pieb: La Paz, Bolivia, 2003; p. 199. [Google Scholar]
  44. Morales, J.A.; Sachs, J.D. Bolivia’s economic crisis. In Developing Country Debt and Economic Performance, Country Studies—Argentina, Bolivia, Brazil, Mexico; The University of Chicago Press: Chicago, IL, USA, 1990; pp. 157–268. [Google Scholar]
  45. Morales, J.A.; La Torre, G. Inflación, Estabilización y Crecimiento: La Experiencia Boliviana de 1982–1993; Universidad Catòlica Boliviana, Instituto de Investigaciones Socio-Econòmicas: La Paz, Bolivia, 1995; Volume 1, p. 495. [Google Scholar]
  46. Hunt, S.J. Guano y crecimiento en el Perú del siglo XIX. In HISLA: Revista Latinoamericana de la Historia Económica y Social; University of Michigan: Ann Arbor, MI, USA, 1984. [Google Scholar]
  47. Mathew, W.M. The House of Gibbs and the Peruvian Guano Monopoly; Royal Historical Society: London, UK, 1981; p. 281. [Google Scholar]
  48. Tantaleàn Arbulù, J. La Gobernabilidad y el Leviatàn Guanero: Desarrollo, Crisis y Guerra con Chile; IEP, Instituto de Estudios Peruanos: Jesús María, Peru, 2011; p. 448. [Google Scholar]
  49. Levin, J.V. Las Economías de Exportación: Esquema de su Desarrollo en la Perspectiva Histórica; UTEHA: México D.F., México, 1964. [Google Scholar]
  50. Cardenas, E.; Ocampo, J.A.; Thorp, R. An Economic History of Twentieth-Century Latin America, Volume 1: The Export Age: The Latin American Economies in the Late Nineteenth and Early Twentieth Centuries; St. Antony’s Series; Palgrave MacMillan: Basingstoke, UK, 2000. [Google Scholar]
  51. Contreras, C. La Economía pùblica en el Perú despuès del Guano y del Salitre: Crisis Fiscal y èlites Econòmicas Durante su Primer Siglo Independiente; Banco Central de Reserva del Perú: Lima, Peru, 2012; p. 478. [Google Scholar]
  52. Thorp, R.; Bertram, G. Peru, 1890–1977: Growth and Policy in an Open Economy; Columbia Essays on Modern Writers, Columbia University Press: New York City, NY, USA, 1978. [Google Scholar]
  53. Cotler, J. Clases, Estado y Nación en el Perú; Instituto de Estudios Peruanos: Jesús María, Peru, 1978; p. 407. [Google Scholar]
  54. Lowenthal, A.F. The Peruvian Experiment: Continuity and Change under Military Rule; Princeton University Press: Princeton, NJ, USA, 1975; p. 500. [Google Scholar]
  55. Sheahan, J. Searching for a Better Society: The Peruvian Economy from 1950; Pennsylvania State University Press: University Park, PA, USA, 1999; pp. xi, 211. [Google Scholar]
  56. Bulmer-Thomas, V. The Economic History of Latin America since Independence; Cambrige University Press: Cambrige, UK, 2003; p. 506. [Google Scholar]
  57. Badia-Miró, M.; Ducoing, C.C. The long run development of Chile and the Natural Resources curse. Linkages, Policy and Growth 1850–1950. In Natural Resources and Economic Growth: Learning from History; Badia-Miró, M., Pinilla, V., Willebald, H., Eds.; Routledge: London, UK, 2015; pp. 204–225. [Google Scholar]
  58. Badia-Miró, M.; Díaz-Bahamonde, J. The Impact of Nitrates on the Chilean Economy, 1880–1930. In The First Export Era Revisited; Springer International Publishing: Cham, Switzerland, 2017; pp. 151–188. [Google Scholar]
  59. Badia-Miró, M.; Ducoing, C. El PIB industrial de Chile durante el ciclo del salitre, 1880–1930. Rev. Urug. Historia Econ. 2013, III, 11–32. [Google Scholar]
  60. Badia-Miró, M.; Yáñez, C. Localisation of Industry in Chile, 1895–1967: Mining Cycles and State Policy. Aust. Econ. Hist. Rev. 2015, 55, 256–276. [Google Scholar] [CrossRef]
  61. Palma, G. Trying to ‘tax and spend’ oneself out of the ‘Dutch Disease’: The Chilean Economy from the War of the Pacific to the Great Depression. In An Economic History of Twentieth-Century Latin America, Volume 1: The Export Age: The Latin American Economies in the Late Nineteenth and Early Twentieth Centuries; St. Antony’s Series; Palgrave MacMillan: Basingstoke, UK, 2000. [Google Scholar]
  62. Sicotte, R.; Vizcarra, C.; Wandschneider, K. The fiscal impact of the War of the Pacific. Cliometrica 2008, 3, 97–121. [Google Scholar] [CrossRef]
  63. Lüders, R.; Wagner, G. Nitrate export collapse and the great depression: Trigger or Chance? Cuad. Econ. 2003, 40, 796–802. [Google Scholar] [CrossRef]
  64. Lüders, R.; Wagner, G. Export Tariff, Welfare and Public Finance: Nitrates from 1880 to 1930; Documentos de Trabajo 241; Instituto de Economia, Pontificia Universidad Católica de Chile: Santiago, Chile, 2003. [Google Scholar]
  65. Sunkel, O. El Presente Como Historia: Dos Siglos de Cambio y Frustración en Chile; Catalonia: Santiago, Chile, 2011; p. 319. [Google Scholar]
  66. Meller, P. Un Siglo de Economía Política Chilena (1890–1990); CEPLAN: Vitacura, Chile, 1996. [Google Scholar]
  67. Ffrenc-Davis, R.; Muñoz, Ó.; Benavente, J.M.; Crespi, G. The Industrialization of Chile during Protectionism, 1940-82. In An Economic History of Twentieth-Century Latin America; Cardenas, E., Ocampo, J.A., Thorp, R., Eds.; Palgrave: New York, NY, USA, 2000; Volume 3, Chapter 5; pp. 114–153. [Google Scholar]
  68. Díaz, J.; Lüders, R.; Wagner, G. La República en Cifras, 2010; Technical Report; Universidad Católica: Santiago, Chile, 2010. [Google Scholar]
  69. Ffrench-Davis, R. Challenges for the Chilean economy under cyclical shocks, 1999–2016. J. Post Keynes. Econ. 2017, 40, 61–74. [Google Scholar] [CrossRef]
  70. Schön, L. En Modern Svensk Ekonomisk Historia: Tillväxt och Omvandling under två Sekel; SNS förlag: Stockholm, Sweden, 2012. [Google Scholar]
  71. Schön, L. Sweden’s Road to Modernity: An Economic History; SNS förlag: Stockholm, Sweden, 2010; pp. 1–494. [Google Scholar]
  72. Schön, L. Sweden—Economic Growth and Structural Change, 1800–2000; Lund Univerdity: Lund, Sweden, 2007. [Google Scholar]
  73. Jonung, L.; Kiander, J.; Vartia, P. The Great Financial Crisis in Finland and Sweden: The Nordic Experience of Financial Liberalization; Edward Elgar: Cheltenham, UK, 2009; p. 337. [Google Scholar]
  74. Hodne, F.; Grytten, O.H. Norsk økonomi i det nittende århundre; Fagbokforlaget: Bergen, Norway, 2000; p. 318s. [Google Scholar]
  75. Bergh, T.; Hanisch, T.; Lange, E.; Pharo, H. Norge fra U-Land Til I-Land: Vekst og Utviklingslinjer 1830–1980; Gyldendal: Copenhagen, Denmark, 1983. [Google Scholar]
  76. Fagerberg, J. Innovation, Path Dependency and Policy: The Norwegian Case; Oxford University Press: Oxford, UK; New York, NY, USA, 2009. [Google Scholar]
  77. Lindmark, M.; Vikström, P. Growth and structural change in Sweden and a story of convergence Finland, 1870–1990: A story of convergence. Scand. Econ. Hist. Rev. 2003, 51, 46–74. [Google Scholar] [CrossRef]
  78. Fellman, S. Growth and investment: Finnish Capitalism, 1850–2005. In Creating Nordic Capitalism: The Business History of a Competitive Periphery; Iversen, M., Thue, L., Eds.; Palgrave Macmillan: Basingstoke, UK, 2008; pp. 139–198. [Google Scholar]
  79. Hjerppe, R.; Kopi-jyvä. Finland’s Historical National Accounts 1860–1994: Calculation Methods and Statistical Tables; University of Jyväskylä: Jyväskylä, Finland, 1996. [Google Scholar]
  80. Ojala, J. The Road to Prosperity: An Economic History of Finland; Finnish Literature Society: Helsinki, Finland, 2006. [Google Scholar]
  81. Collier, S.; Sater, W.F. A History of Chile, 1808–2002; Cambridge University Press: Cambridge, UK, 2004; p. 454. [Google Scholar]
  82. Mamalakis, M.J. Historical Statistics of Chile. Demography and Labour Force; Greenwood Press: Westport, CT, USA, 1980; Volume 2, p. 420. [Google Scholar]
  83. Grytten, O.H. Why was the great depression not so great in the Nordic countries?: Economic policy and unemployment. J. Eur. Econ. Hist. 2009, 37, 369–403. [Google Scholar]
  84. Gómez-Galvarriato, A.; Williamson, J.G. Was It Prices, Productivity or Policy? Latin American Industrialisation after 1870. J. Lat. Am. Stud. 2009, 41, 663–694. [Google Scholar] [CrossRef]
  85. Barbier, E.B. Scarcity and Frontiers: How Economies Have Developed through Natural Resource Exploitation; Cambridge University Press: New York, NY, USA, 2011. [Google Scholar]
  86. Klein, H.S.; Peres-Cajías, J.A. Bolivian Oil and Natural Gas under State and Private Control, 1910–2010. Boliv. Stud. J. 2014, 20. [Google Scholar] [CrossRef]
  87. Abugattás, L. Estabilización Macro Económica, Reforma Estructural y Comportamiento Industrial: La Experiencia Peruana; CEPAL: Vitacura, Chile, 1988. [Google Scholar]
  88. Tello, M. Organización Industrial, Características de la Industria y Política Comercial en el Perú: 1971–1985; Documentos de Trabajo, 73; Dpto. de Economía, Pontifica Universidad Católica del Perú: Lima, Perú, 1988. [Google Scholar]
  89. Muñoz Gomá, Ó. Crecimiento Industrial de Chile: 1914–965; Instituto de Economía y Planificación: Santiago, Chile, 1968; p. 232. [Google Scholar]
  90. Palma, J.G. From an Export-led to an Import-Substituting Economy: Chile 1914-39; Palgrave: Basingstoke, UK, 2000; Volume 3. [Google Scholar]
  91. Jörberg, L. En översikt över den Svenska Ekonomiska Utvecklingen 1870–1979; Ekonomisk-Historiska Institution: Lund, Sweden, 1979. [Google Scholar]
  92. Edquist, C.; Lundvall, B. Comparing the Danish and Swedish systems of innovation. In National Innovation Systems; Nelson, R., Ed.; Oxford University Press: Oxford, UK, 1993; pp. 265–298. [Google Scholar]
  93. Sjögren, H. Welfare capitalism. The Swedish economy 1850–2005. In Creating Nordic Capitalism. The Business History of a Competitive Periphery; Fellman, S., Iversen, M., Sjögren, H., Tue, L., Eds.; Palgrave: Basingstoke, UK, 2008; pp. 1850–2005. [Google Scholar]
  94. Lobell, H.; Schön, L.; Krantz, O. Swedish Historical National Accounts, 1800–2000: Principles and Implications of a New Generation. Scand. Econ. Hist. Rev. 2008, 56, 142–159. [Google Scholar] [CrossRef]
  95. Grönberg, P.O. Learning and Returning: Return Migration of Swedish Engineers from the United States, 1880–1940. Ph.D Thesis, Historical Studies, Umeå University, Umeå, Sweden, 2003. [Google Scholar]
  96. Ojala, J.; Karonen, P. Business: Rooted in social capital over the centuries. In The Road to Prosperity. An Economic History of Finland; Ojala, J., Eloranta, J., Javala, J., Eds.; Finnish Literature Society: Helsinki, Finland, 2006. [Google Scholar]
  97. Hodne, F.; Grytten, O.H. Norsk ·okonomi i det tyvende århundre; Fagbokforl: Sentrum, Oslo, Norway, 2002. [Google Scholar]
  98. Norges Officielle Statistikk. Nasjonalregnskap, 1900–1929; Aschehoug: Oslo, Norway, 1933. [Google Scholar]
  99. Stonehill, A. Foreign Ownership in Norwegian Enterprises; John Wiley and Sons, Inc.: Hoboken, NJ, USA, 1966; Number 2; pp. 15–17. [Google Scholar]
  100. Bruland, K. Norsk mekanisk verkstedindustri og teknologioverføring 1840–1900. In Teknologi i Virksomhet: Verkstedindustri i Norge etter 1840; Lange, E., Ed.; Ad Notam forlag: Oslo, Norway, 1989. [Google Scholar]
  101. Bergquist, A.K.; Lindmark, M. Sustainability and Shared Value in the Interwar Swedish Copper Industry. Bus. Hist. Rev. 2016, 90, 197–225. [Google Scholar] [CrossRef]
  102. Ranestad, K. Multinational mining companies, employment and knowledge transfer: Chile and Norway from ca. 1870 to 1940. Bus. Hist. 2017, 1–25. [Google Scholar] [CrossRef]
  103. Bruland, K. Kunnskapsinstitusjoner og skandinavisk industrialisering—Nasjonalbiblioteket. Demokr. Konserv. 2006. [Google Scholar]
  104. Hodne, F. Norges økonomiske Historie 1815–1970; Cappelen: Oslo, Norway, 1981; p. 617. [Google Scholar]
  105. Cippola, C.M. Literacy and Development in the West; Penguin: London, UK, 1969. [Google Scholar]
  106. Maliranta, M.; Asplund, R. Training and Hiring Strategies to Improve Firm Performance; ETLA: Helsinki, Finland, 2007. [Google Scholar]
  107. Engerman, S.; Mariscal, E.; Sokoloff, K. The evolution of schooling institutions in the Americas, 1800–1925. In Human Capital and Institutions: A Long Run View; David, E., Frank, L., Kenneth, S., Eds.; Cambridge University Press: Cambridge, UK, 2009. [Google Scholar]
  108. Go, S.; Lindert, P. The uneven rise of american public schools to 1850. J. Econ. Hist. 2010, 80, 1–26. [Google Scholar] [CrossRef]
  109. Frankema, E. The expansion of mass education in twentieth Century latin america: A global comparative perspective. Rev. Historia Econ. J. Iber. Lat. Am. Econ. Hist. 2009, 27, 359–396. [Google Scholar] [CrossRef]
  110. Blitz, R. Some Observation Concerning the Chilean Educational System and its Relation to Economic Growth. In Education and Economic Development; Anderson, C., Bowman, M., Eds.; Aldine Publishing Company: Chicago, IL, USA, 1965. [Google Scholar]
  111. Engerman, S.; Sokoloff, K. The Evolution of Suffrage in the New World: A Preliminary Examination; Hoover Press: Stanford, CA, USA, 2001. [Google Scholar]
  112. Engerman, S.L.; Sokoloff, K.L. Economic Development in the Americas since 1500—Endowments and Institutions; Cambridge University Press: New York, NY, USA, 2012. [Google Scholar]
  113. Peres-Cajías, J.A. The Expansion of Public Spending and Mass Education in Bolivia: Did the 1952 Revolution Represent a Permanent Shock? In Has Latin American Inequality Changed Direction? Springer International Publishing: Cham, Switzerland, 2017; pp. 195–218. [Google Scholar]
  114. Schön, L. The Rise of the Fiscal State in Sweden 1800–1914. In Paying for the Liberal State. The Rise of Public Finance in Nineteenth-Century Europe; Cambridge University Press: Cambridge, UK, 2010. [Google Scholar]
  115. Hinrichs, H.H. A General Theory of Tax Structure Change during Economic Development; Law Sch. Harvard University: Cambridge, MA, USA, 1966; p. 154. [Google Scholar]
  116. Burgess, R.; Stern, N.H. Taxation and development. J. Econ. Lit. 1993, 31, 762–830. [Google Scholar]
  117. Cardoso, J.L.; Lains, P. Paying For the Liberal State: The Rise of Public Finance in Nineteenth-Century Europe; Cambridge University Press: Cambridge, UK, 2010; pp. 1–310. [Google Scholar]
  118. Scheve, K.F.; Stasavage, D. Taxing the Rich: A History of Fiscal Fairness in the United States and Europe; Princeton University Press: Princeton, NJ, USA, 2016; p. 266. [Google Scholar]
  119. Steinmo, S. The evolution of policy ideas: Tax policy in the 20 th Century. Br. J. Politics Int. Relat. 2003, 5, 206–236. [Google Scholar] [CrossRef]
  120. Steinmo, S. Taxation and Democracy: Swedish, British, and American Approaches to Financing the Modern State; Yale University Press: New Haven, CT, USA, 1993; p. 216. [Google Scholar]
  121. Lindert, M. Growing Public: Social Spending and Economic Growth Since the Eighteenth Century; Cambridge University Press: New York, NY, USA, 2004; pp. 203–206. [Google Scholar]
  122. Bird, R.; Zolt, E. Redistribution via taxation: The limited role of the personal income tax in developing countries. UCLA Law Rev. 2005, 52, 1627–1695. [Google Scholar]
  123. Peres-Cajias, J.A. Public Finances and Natural Resources in Bolivia, 1883–2010. Is there a fiscal curse? In Natural Resources and Economic Growth: Learning from History; Badia-Miró, M., Pinilla, V., Willebald, H., Eds.; Routledge: Abingdon, UK, 2015. [Google Scholar]
  124. Aidt, T.S.; Jensen, P.S. The taxman tools up: An event history study of the introduction of the personal income tax. J. Public Econ. 2009, 93, 160–175. [Google Scholar] [CrossRef]
  125. Sokoloff, K.L.; Zolt, E.M. Inequality and Taxation: Evidence from the Americas on How Inequality May Influence Tax Institutions. Tax Law Rev. 2005, 59, 167. [Google Scholar]
  126. Roine, J.; Waldenström, D. The evolution of top incomes in an egalitarian society: Sweden, 1903–2004. J. Public Econ. 2008, 92, 366–387. [Google Scholar] [CrossRef]
  127. Baldwin, P. The Politics of Social Solidarity: Class bases of the European Welfare States; Cambridge University Press: Cambridge, UK, 1990; p. 353. [Google Scholar]
  128. Kenny, L.W.; Winer, S.L. Tax systems in the world: An empirical investigation into the importance of tax bases, administration costs, scale and political regime. Int. Tax Public Financ. 2006, 13, 181–215. [Google Scholar] [CrossRef]
  129. Riezman, R.; Slemrod, J. Tariffs and collection costs. Rev. World Econ. 1987, 123, 545–549. [Google Scholar] [CrossRef]
  130. Sandbérg, L.G. The Case of the Impoverished Sophisticate: Human Capital and Swedish Economic Growth before World War I. J. Econ. Hist. 1979, 39, 225–241. [Google Scholar] [CrossRef]
  131. A’Hearn, B.; Baten, J.; Crayen, D. Quantifying quantitative literacy: Age heaping and the history of human capital. J. Econ. Hist. 2009, 69, 783–808. [Google Scholar] [CrossRef]
  132. Kleven, H.J.; Kreiner, C.T.; Saez, E. Why Can Modern Governments Tax So Much? An Agency Model of Firms as Fiscal Intermediaries. Economica 2016, 83, 219–246. [Google Scholar] [CrossRef]
  133. Goode, R. Lessons from Seven Decades of Income Taxation. In Options for Tax Reform; Goode, R., Ed.; Brookings Institution: Washington, DC, USA, 1984. [Google Scholar]
  134. Blum, M.; Ducoing, C.; McLaughlin, E. A Sustainable Century? Genuine Savings in Developing and Developed Countries, 1900–2000. In National Wealth What Is Missing, Why It Matters; Hamilton, K., Hepburn, C., Eds.; Oxford University Press: Oxford, UK, 2017; Chapter 5. [Google Scholar]
  135. Lindmark, M.; Acar, S. Sustainability in the making? A historical estimate of Swedish sustainable and unsustainable development 1850–2000. Ecol. Econ. 2013, 86, 176–187. [Google Scholar] [CrossRef]
  136. Bithas, K.; Kalimeris, P. Unmasking decoupling: Redefining the Resource Intensity of the Economy. Sci. Total Environ. 2018, 619-620, 338–351. [Google Scholar] [CrossRef] [PubMed]
  137. Liu, D.; Meissner, C.M. Market potential and the rise of US productivity leadership. J. Int. Econ. 2015, 96, 72–87. [Google Scholar] [CrossRef]
  138. Abramovitz, M. Catching up, forging ahead, and falling behind. J. Econ. Hist. 1986, 46, 385–406. [Google Scholar] [CrossRef]
  139. Cirera, X.; Maloney, W.F. The Innovation Paradox: Developing-Country Capabilities and the Unrealized Promise of Technological Catch-up; World Bank Publications: Washington, DC, USA, 2017. [Google Scholar]
  140. Ross, M. The political economy of the resource curse. World Politics 1999, 51, 297–322. [Google Scholar] [CrossRef]
  141. Anthonsen, M.; Löfgren, Å.; Nilsson, K.; Westerlund, J. Effects of rent dependency on quality of government. Econ. Gov. 2012, 13, 145–168. [Google Scholar] [CrossRef]
  142. Flora, P.; Kraus, F.; Pfenning, W. State, Economy, and Society in Western Europe 1815–1975. A Data Handbook in Two Volumes; Campus Verlag: Frankfurt, Germany, 1987. [Google Scholar]
  143. Grytten, O.H. The Gross Domestic Product for Norway 1830–2003; Norges Bank: Oslo, Norway, 2009. [Google Scholar]
  144. Henrekson, M.; Stenkula, M. Swedish Taxation: Developments since 1862; Springer: Berlin, Germany, 2015; pp. 1–334. [Google Scholar]
  145. Peres-Cajías, J. Bolivian Public Finances, 1882–2010. The Challenge to make social spending Sustainable. Rev. Hist. Econ. J. Iber. Lat. Am. Econ. Hist. 2014, 51, 297–322. [Google Scholar] [CrossRef]
  146. Portocarrero, S.; Beltrán, B.; Romero, P. Compendio Estadístico del Perú; Universidad del Pacìfico, Centro de Investigacion: Lima, Peru, 1992. [Google Scholar]
Figure 1. Population ratio. Ratio between Andean and Nordic countries, 1850–2010.
Sustainability 10 00965 g001
Figure 2. GDP per capita in Geary–Khamis Dollars. Ratio between Andean and Nordic countries. 1850–2010.
Sustainability 10 00965 g002
Figure 3. Openness (exports + imports as a share of the GDP). Chile, Peru and Sweden, 1850–2010.
Sustainability 10 00965 g003
Figure 4. Chilean exports, percentage of total exports. 1850–1950.
Sustainability 10 00965 g004
Figure 5. Tax revenues as a share of GDP, 1850–2010 (%). Sources: see Appendix A.
Sustainability 10 00965 g005
Table 1. GDP per capita, selected years.
1850187018901913195019702010
Bolivia640 7351006162717594805
Chile10111379217436174399681118,075
Peru725933471916204834399309
Finland1035123815012293520814,41638,074
Norway1562209530405250794713,33372,578
Sweden1446180725204825881618,13342,043
Sources: Bolivia, [30]. The rest of the countries from [31].
Table 2. Mining as the share of GDP. Selected years.
1900191319291950197019902010
Bolivia5%8%16%15%12%11.217.3%
Chile18%19%22%12%7%8%11%
Perú7%11%18%12%12%13%
Norway 1%12.5%19%
Sweden7%9%5%8%9%5%
Sources: see text.
Table 3. GDP per capita growth rates. Selected periods. Own estimations in the base Maddison Project [35].
BoliviaChilePeruNorwaySwedenFinland
1850–1870 3.12.32.82.21.2
1870–1890 3.8–3.61.31.82.1
1890–19131.92.94.62.22.92.8
1913–19192.51.04.70.70.6–0.5
1919–19293.24.34.93.03.95.7
1929–19392.03.63.43.33.64.2
1939–19502.23.22.73.63.43.0
1950–19733.13.85.23.94.04.6
1973–19900.53.01.33.31.53.0
1990–20033.45.34.23.32.32.9
2003–20104.44.76.12.22.73.4

