Identification and Prioritisation of Risk Factors in R&D Projects Based on an R&D Process Model


1
Department of Systems Management Engineering, Sungkyunkwan University, 2066, Seobu-ro, Jangan-gu, Suwon-si, Gyeonggi-do 16419, Korea
2
Department of Industrial Engineering, School of Engineering, Ajou University, Woncheon-dong, Yeongtong-gu, Suwon-si, Gyeonggi-do 16499, Korea
3
Department of Industrial & Systems Engineering, School of Engineering, Dongguk University, 30, Pil-dong-ro, Chung-gu, Seoul 04620, Korea
*
Author to whom correspondence should be addressed.
Sustainability 2018, 10(4), 972; https://doi.org/10.3390/su10040972
Submission received: 5 March 2018
/
Revised: 19 March 2018
/
Accepted: 24 March 2018
/
Published: 27 March 2018
(This article belongs to the Section Sustainable Urban and Rural Development)
Abstract
:Although the importance of risk management and failure management has been emphasized in many organizations for sustainable development, most of the related studies have dealt with manufacturing or service processes, rather than R&D processes. Since R&D projects have high uncertainty in schedule and the quality of output, more attention should be paid to manage the risks of R&D activities. Thus, this paper proposes a systemic approach to performing R&D failure and risk management in the R&D process. To these ends, failure mode and effect analysis (FMEA) is employed, and is modified to meet the specific features of R&D activities with a stage-gate model that can identify the failure modes in each stage of the R&D process model. In addition, a process to prioritize the risks of R&D failure is suggested to support a decision-making process in R&D management, by applying the decision-making trial and evaluation laboratory (DEMATEL). The proposed approach is applied to a case of R&D process of a software development company, in order to illustrate its validity. This paper can help R&D managers to identify and cope with the risks in the R&D process by employing a systematic method.
1. Introduction
The contemporary intensified competitive environment renders innovation capability a key success factor for companies to enhance profitability and growth. Many previous studies have presented empirical evidence of the relationship between market-specific performance and firm innovation [1,2]. Thus, R&D projects for developing innovative products and processes are crucial for firms to achieve high performance. However, one of the major difficulties in R&D projects is the uncertainty in managing technology and markets, which reduces the possibility of success in product development and sales [3]. Many empirical studies show that the success rate of new product development (NPD) projects is still low [4,5]. Since innovation mostly requires a new way of developing products and/or implementing processes, uncertainty is inevitably involved in R&D projects. Moreover, fast technology change and diverse customer demands make the R&D process more complex and uncertain [6]. Such high uncertainty increases R&D risks, causing many failures in R&D projects [7]. In particular, diverse types of innovation, such as sustaining innovation and disruptive innovation have different degrees of uncertainty that may result in failures of R&D projects [8,9]. Therefore, managing R&D risks across all of the processes is critical to elevating the level of success rates [10].
Since firms should be agile to survive in the turbulent business environment, they must monitor the changing situations of technology and markets. In particular, technology plans as well as manufacturing plans should be modified, when considering the uncertainty in the process of technology development and production. Thus, risk management is important in the whole business cycle to cope with various risk factors that might cause serious damage to current and future businesses. Risk management can be defined as a systematic approach that identifies, assesses, and prioritizes risks, followed by planning of resources that minimises, monitors and controls the probability and impact of undesirable events [11]. Since the concepts and practices of risk management have widely prevailed in many fields, such as management, finance and insurance, the R&D and engineering disciplines should also apply risk management both theoretically and practically. The main purpose of risk management in R&D management is to advance the success rate of an R&D project by supporting a decision-making process, while minimizing R&D uncertainty. For this, various approaches, such as concurrent engineering and quality function deployment, have been suggested to reduce R&D uncertainty, by collecting valuable information [12,13]. In addition, adopting managerial flexibility in the R&D project can introduce new products to market in a minimal level of disruption, as technologies and markets change rapidly [14,15].
However, the important problem in risk management of R&D projects is the difficulties in identifying and prioritizing R&D risks, because most of the R&D ideas are fuzzy, and the project management of R&D is largely poorly organized, forcing the waste of time and cost. In addition, most existing studies focus on applying qualitative approaches to identify and measure R&D risk factors. Such research sometimes fails to consider the unique characteristics of R&D projects that include the multiple stages of the R&D process, and ill-defined ideas in the early stage of projects. Most importantly, since most of the studies recognize markets and businesses as major determinants of the outcomes of new product development projects, technology-oriented risks can be underestimated in evaluating the risk factors. Even though such risks are extremely important in the R&D process, most researchers focus on the cost and time perspectives, rather than on technological factors. Thus, a systematic approach to identifying the risk factors and prioritizing them should be suggested and implemented in the practical field of R&D project management. Therefore, the objectives of this paper are to propose a conceptual model of a structured process to define R&D failure modes, and to analyse their effect. For this, the stage-gate model that is often applied in R&D project management is considered to reflect the characteristics of the R&D process in R&D risk management. The model enables risk factors to be derived in all important activities without a bias to market and businesses, including earlier stages, such as idea generation and technology development. Furthermore, this paper employs quantitative methods, such as Failure Mode and Effect Analysis (FMEA) and Decision Making Trial and Evaluation (DEMATEL), to prioritize the risk factors identified, by considering the stage-gate model.
This paper is structured as follows. Section 2 reviews related studies on R&D risk management, as well as important methods (FMEA and DEMATEL) for quantitative analysis. Section 3 then proposes a new framework for R&D risk management, and explains the detailed process to identify and prioritize the R&D risk factors. Section 4 illustrates the proposed approach through the example of a software development project, and then Section 5 discusses the limitations of this paper and the directions for future study.
2. Background
2.1. R&D Risk Management
Since risk can occur in many different disciplines, such as economy, management, and human life, the definition of risk also varies according to the perspectives of risk management. In economic theory, risk can be defined as circumstances where probabilities for a decision-making can be assigned to potential outcomes [16]. In the view of decision theory, risk refers to situations in which a decision maker should make a decision under the condition of known probability, because decision theory is concerned with calculating the consequences of uncertain decision. In innovation theory, it can be regarded as a driver that enables the most durable and valuable inventions to be devised, because they normally come from a desire to either remove or exploit risks. For example, in financial markets, some of the innovations have been designed to help investors to protect themselves against risk; but other innovations aim at providing ways of exploiting risk for higher returns. In particular, disruptive innovation can trigger a new paradigm for the development of technology and markets under the situation of risk that existing products are obsolete; and, a variety of new designs are devised to be chosen as a dominant design. From the perspectives of project management, risk can be considered to be an uncertain event or condition that has a positive or negative impact on the objectives of projects [17,18]. However, most practitioners still think that risk is potentially harmful to project performance. Thus, risk management should successfully identify and control the threats in project management.
Since risk management is a general concept in the discipline of management, many empirical papers have dealt with various issues of R&D risk management. Most research on R&D risk management has been conducted to manage the uncertainty of R&D activities, focusing on an NPD process. Uncertainty in R&D management can be defined as the unpredictability of the business and technology environment, and an incapability to forecast the impacts of environmental change and the results of a choice [18]. Several researchers have insisted that methods for risk management can improve the success rate of R&D projects. Salomo et al. [19] found that project risk planning in NPD projects could significantly improve performance, by examining the effects of business planning on project performance. Mu et al. [20] showed that the strategies of risk management on risk factors that are related to technology, organization, and marketing affect the performance of NPD projects. Raz et al. [8] presented the results of an empirical study that risk management can be applied to enhance the performance of higher-risk projects, emphasizing that it is strongly associated with project success.
Various methodologies for R&D risk management have been developed to increase the success rates of projects. Browning et al. [21] suggested a new methodology that quantifies a risk value to identify, assess, monitor, and control the identified risks during performing a project, just concentrating on technical risks. Lefley [22] reviewed various state-of-the-art techniques in identifying and assessing innovative R&D project risk. Cooper [23] proposed the use of a knowledge management system that captured practitioner experience to reduce R&D risks. In addition, Keizer et al. [5] suggested a risk reference framework to diagnose the risks in technological breakthrough projects, and concluded that formal risk assessment can enhance the success of breakthrough innovation projects. Ogawa and Piller [24] proposed a new market research method that was called “collective customer commitment”, which was integrating the opinions of customers into the innovation process, in order to meet customer needs. Gidel et al. [25] developed a decision-making framework for risk management from the cognitive science perspective. However, Wang et al. [26] maintained that existing research in R&D risk management was struggling from a lack of research on linking operational risk management of R&D projects with corporate strategies, and providing a systematic process for risk identification, assessment, response planning, and control.
2.2. Failure Mode and Effect Analysis (FMEA)
Since FMEA was first suggested by NASA in 1963 to meet reliability requirements, it has been actively utilized as a key tool for analysing system safety and the reliability of products and processes [27]. FMEA is regarded as a pro-active engineering quality method for identifying and handling the weak points in the early phase of developing products and implementing processes [28]. Thus, it enables the investigation of potential reliability issues in the whole cycle of projects, allowing for managers to take action to solve identified problems, mitigating the effect of possible failure modes. This method can examine each component to explore potential failures, by applying three indexes: the probability of failure occurrence (O), the impact or severity of the failure (S), and the capacity to detect failure before it occurs (D). Multiplying the three indexes can be used to prioritize the failure modes, enabling them to be focused on in risk management.
Since FMEA has been broadly considered to be a risk assessment tool to enhance the analysis of quality, international quality organizations, such as the International Organization for Standardization (ISO), use this technique as a powerful analysis in the ISO-9000 series [29]. The scope of applications has been extended into many industries, including the aviation, automotive, machinery, semiconductor, and medical industries. Onodera [30] examined approximately 100 FMEA applications in various industries in Japan, and showed that this technique is being actively applied in many areas. Many studies have dealt with the applications of FMEA to a specific reliability problem. Hsu et al. [31] suggested a method that uses this technique to analyse the risks of components in compliance with the EU RoHS directive in the quality control stage. Pickard et al. [32] proposed an integrated model that combined multiple failure modes into a single one, to investigate a system that simultaneously considers various failure modes. Recently, FMEA has often been coupled with other methods to improve its applicability in risk management. The Taguchi method plays a complementary role in performing failure detection and the optimization of parameters to minimize failure [33]. In addition, Chang et al. [29] integrated grey relational analysis with FMEA to investigate the relationships between the components in a system, while Bowles and Pelaez [34] used a fuzzy logic-based approach to improve the FMEA by extensively evaluating S, O, and D, and their relative weight.
Although FMEA is a widely utilized technique for risk analysis, several shortcomings have been pointed out by many researchers. Spreafico et al. [35] summarized four main problems, investigating academic articles and industrial reports: applicability, cause-effect, risk analysis, and problem-solving issues. First, in the perspective of applicability, FMEA is regarded as a time-consuming approach and its results are mostly subjective when analysers have different levels of expertise. The second shortcoming is the cause-effect category that mainly includes the difficulty in distinguishing the types of failures and their topology. In addition, the risk analysis issues concern ambiguous definitions about risk factors during risk evaluation and the lack of specific criteria of the risk. Finally, the problem-solving category refers to the limitation in the ability to support the decision making by quantifying the feasible results. In this paper, the integration of FMEA with stage-gate model and DEMATEL can solve the aforementioned limitations. First, the systematic approach that extracts the failure modes with the stage-gate model can provide the time reduction and objectivity because the failure modes can be easily derived in each stage. In addition, the risk factors can be clearly defined and analysed with a low level of domain expertise. The DEMATEL is employed to quantify the effect of causes of failure and consider the direct relationship between failure modes and causes of failure. Thus, it can help the analysers make a decision on risk management in a quantitative way.
2.3. Decision Making Trial and Evaluation Laboratory (DEMATEL)
DEMATEL is a representative method to design and analyse structural models of casual relationships between complex factors [36]. This technique can facilitate an understanding of the complex structure of a specific problem under consideration, and identifying relationships between factors in a form of hierarchical structure [37]. Thus, it has been utilised in many circumstances, including marketing strategies, manufacturing systems, and group decision making [38]. DEMATEL was applied to explore complex relationships, construct an impact-relation map, and moreover, obtain the impacts of each element over others. This approach is mostly applied to support a decision-making process, assisting analysers in prioritizing alternatives, and deriving important factors for analysis. For example, DEMATEL is employed for evaluating key success factors, analysing risk factors in outsourcing, selecting knowledge management strategies, and investigating the relationships among organizations. For this, the original version of DEMATEL is modified to elevate the performance of analysis. An extension of DEMATEL that combines fuzzy theory and DEMATEL is proposed to evaluate the factors of service quality [39], and Back-Propagation Neural Network (BPNN) is applied to calculate the inter-relationship between quality factors with the method [40]. In particular, Wei et al. [41] proposed a structural equation model that was modified by DEMATEL technique as the causal model of Web-advertising effects. Although many studies emphasized a lot of advantages of DEMATEL in analysing the complex relationships and the impact of factors, several shortcomings should be discussed for the relevant use of the methodology. First, it cannot deal with uncertain situation and lack of information to investigate the causes and effects. Since the relationship between objects should be evaluated by analysers, the approach is very subjective and is vulnerable to the uncertainty of relationships. In addition, the methodology can hardly analyse ambiguous values around a given discrete value. Thus, although several studies have proposed the use of fuzzy methods in applying DEMATEL, most of them suffer from limitations of mapping a membership function [42]. This paper utilizes the quantified value from FMEA in evaluating the relationships between failure modes and causes of failure in the process of DEMATEL. Moreover, since the purpose of the proposed approach is to prioritise the risk factors, mapping a membership function in a fuzzy-based DEMATEL is not necessary for this research. Thus, this paper intends to solve the weaknesses of DEMATEL by integrating it with FMEA.
The procedure of applying the DEMATEL technique can be summarised by the following four steps. First, the initial direct-relation matrix is used to calculate an average perception matrix. If we have n criteria, we should evaluate the degree how the criterion i affects the criterion j. The degree has the value from 0 to 3 through the pairwise comparisons between criteria. The second step is to normalize the average perception matrix. The A of Equation (1) is a matrix before normalization, and X means a normalized direct-relation matrix. The aij of Equation (2) is the degree to which a factor i affects the other factor j. The third step is to derive the total relation matrix by applying Equation (3). In the final step, four indices of D, R, D + R, D-R are calculated in order to examine the importance of the factor by using Equations (4)–(6).
3. The Proposed Method for R&D Risk Management
3.1. Overall Framework
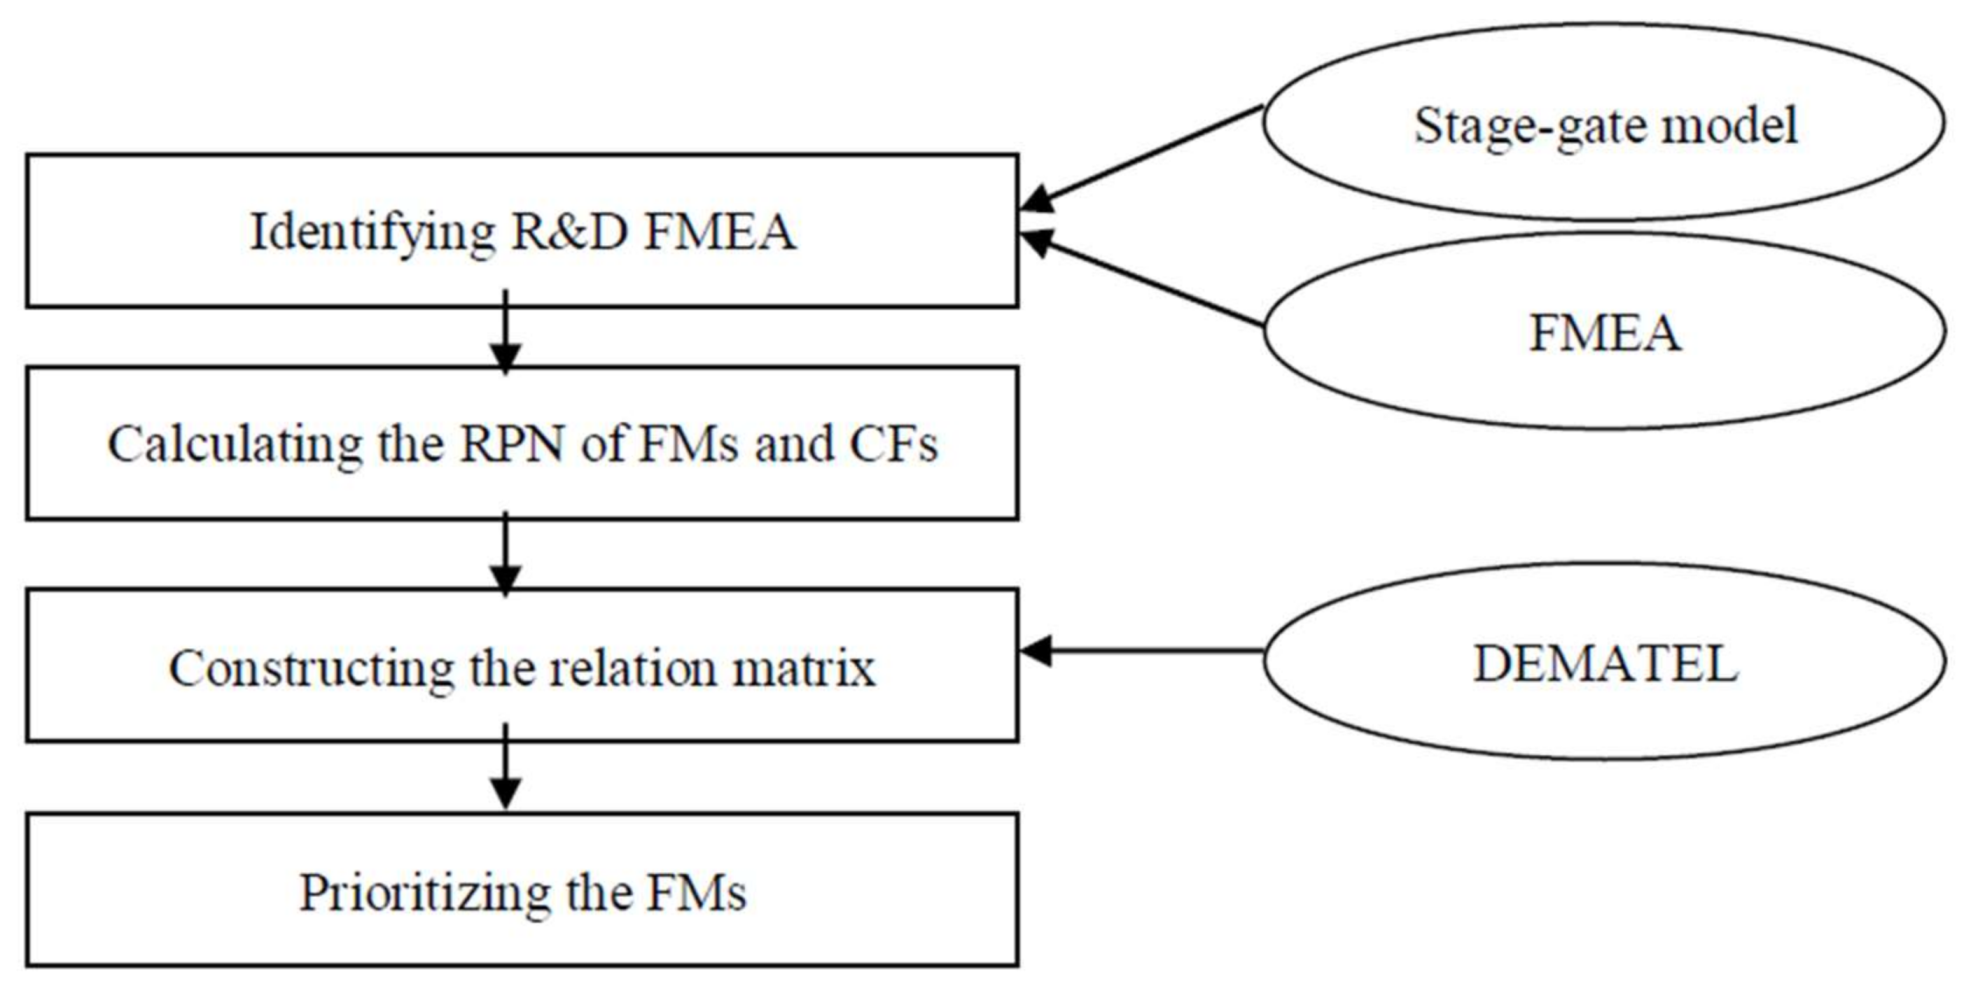
Since the level of risks in R&D activities is relatively higher than in other types of projects, such as production and service development, and the results of R&D projects affect the profits of companies more critically than do routine activities in companies, the R&D risks should be carefully and properly managed in a systematic manner. Thus, this paper first applies the stage-gate model to identify the significant factors of R&D risks. The stage-gate model has been widely used to efficiently control product development processes with multiple stages and gates. In addition, each stage consists of specific activities that are supposed to be performed within that stage. Therefore, the model can be useful to understand the R&D process, and identify failure modes (FMs) and cause factors (CFs) in the process. Since the usefulness of FMEA to investigate a variety of risks in project management has been demonstrated, it can be employed to analyse R&D risks. Thus, two approaches—the stage-gate model and FMEA—are applied to identify and analyse the risk factors in the first step together. Then, FMs and CFs in the R&D process are defined and are evaluated with the typical ranking rule, in order to analyse which factors are critical in the management of an R&D project. Consequently, the risk priority number (RPN) of pairs of FMs and CFs can be calculated to rank the listed risks in the R&D process. In the third step, the relation matrix of FMs and CFs is constructed by considering the RPN of FMs and CFs, and the relationship among FMs as well as CFs, applying the DEMATEL that is usually utilized to examine the impacts of factors. Finally, the CFs in R&D projects can be prioritized from the relation matrix. Figure 1 presents the overall process of the proposed R&D risk management.
The proposed approach can be distinguished from the traditional FMEA that has been normally applied in risk management. First, the RPN of FMs in the traditional FMEA method fails to reflect the influence of risks in a whole system. In this paper, the DEMATEL methodology is employed to investigate the impacts of risks in the R&D process, analysing the relations of causes and effects. Thus, the combination of FMEA and DEMATEL methodologies can provide more accurate information on the priority of risks in R&D management, by considering their influence. In terms of identifying the FMs, the stage-gate model can provide a systematic outlet to extract FMs and CFs of R&D. Most of the existing FMEA approaches examine a whole system to identify FMs and CFs without a structured framework. Instead, this approach decomposes an R&D process into several stages, in order to facilitate the identification of FMs and CFs in R&D risk management. Table 1 compares the characteristics of the proposed approach and traditional FMEA.
3.2. Step 1: Identifying the Risk Factors of R&D Projects
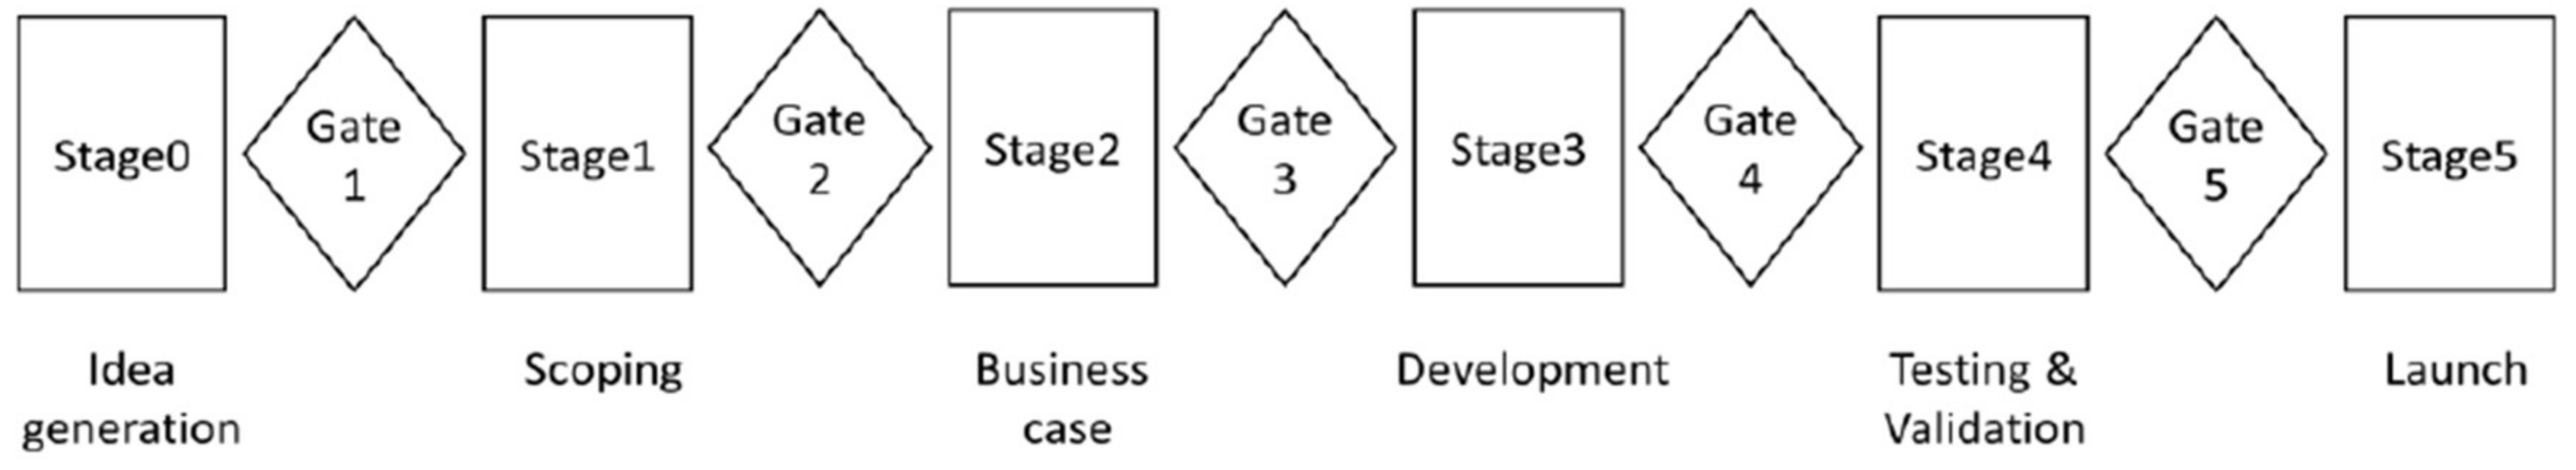
Since R&D projects have unique characteristics of R&D activities, they should be carefully managed in a different way from ordinary projects, such as software development and construction. Traditional techniques of project management do not show high performance in R&D management, because they normally deal with well-defined processes of general projects that have clear objectives and constraints on time and budgets. Thus, Cooper [43] proposed the stage-gate model shown in Figure 2 for new product development, insisting that leading companies successfully implemented the model to develop new products. The model consists of multiple stages and gates to make a decision on whether a project should be killed or go. In particular, the main factors of this model are various stages, such as idea generation (stage 0), scoping (stage 1), business case (stage 2), development (stage 3), testing & validation (stage 4), and launch (stage 5). The gates that are positioned between stages play a critical role in deciding whether a project can proceed through the next stage or not. Thus, each project should be evaluated by several criteria that are defined to measure the value of projects in each gate. The classic model has been adapted to reflect specific situations with modified models such as a three-stages technology development process and agile stage gate model [6,44]. In particular, a lot of firms have introduced modified versions of the stage-gate model to deal with technology development projects where the deliverable is not a new product [6]. However, the technology development projects are increasingly rare, showing the dramatic shift of R&D portfolio to smaller, shorter-term projects in an open innovation era. Thus, in this paper, the original stage-gate model is utilized to investigate the risk factors in R&D risk management because new product development projects are a main task in the R&D project management of firms. In addition, since new process development stages can be covered in stage 3 (development), this paper does not modify the original model to perform the risk analysis for R&D projects.
Many studies in project management, when investigating the reasons for successes and failures, have proposed success factors, as well as failure factors. From the perspective of risk management, the identification of failure factors is straightforward to the success of projects. Although several papers deal with risk management in R&D activities, little attention has been paid to identifying failure factors in R&D management. Thus, the list of failures in R&D processes can be generated by a literature survey on general project management, as well as on R&D project management. Then, each failure mode is enumerated by reasonable causes that lead to such failures in R&D activities. Since the list of failure modes and causes needs to be structured, the stage-gate model is employed to provide a frame for in-depth analysis. Thus, the failure modes and causes of the failures in the R&D process are listed, referring to each stage and gate of the model. For example, in the Stage 0 (idea), two failure modes, including ‘unclear ideas’ and ‘wrong ideas’, can affect the success of R&D projects. These can occur due to three possible causes—‘discrepancy with corporate strategy’, ‘low competence’, and ‘insufficient R&D resources’. In the stage 1 (primary assessment), in which the ideas screened in stage 0 are evaluated in brief, the failure mode ‘wrong assessment’ can be caused by ‘market assessment error’, ‘technology assessment error’, and ‘financial assessment error’. Failure modes and causes in each stage are, respectively, identified by considering their interrelationship based on the literature survey. Table 2 shows the FMEA of the R&D process based on the original stage-gate model. The generic lists of failure modes and causes of failure in each stage can be modified according to a specific situation of companies. Since there are so many types of R&D projects and processes, this paper intends to suggest a standard model to identify risk factors. If a firm has lighter versions of stage-gate model to handle less complex and better-defined projects, the list can be simpler by deleting or integrating some failure modes and causes of failure.
3.3. Step 2: Calculating the RPN of FMs and CFs
After identifying the list of FMs and CFs in each stage of the R&D process, nine FMs and 25 CFs are drawn, matching each factor of FMs with CFs. The combinations of FMs and CFs are presented by investigating the relations of the two factors, when considering the characteristics of stages. Since their list is already constructed from the stage-gate model, the matching relations between FMs and CFs can be easily analysed. In each stage, the numbers of FMs and CFs are multiplied, and the total number of combinations can be derived by summing the number of cases in each stage. Consequently, the number of combinations of FMs and CFs becomes 32. Then, all of the combinations should be evaluated to prioritize the importance of potential risks. Since all the R&D projects have different stakeholders and situations, each pair of FMs and CFs should be evaluated with the values of severity (S), occurrence (O), and detection (D) in terms of R&D risks, reflecting the characteristics of a specific project.
In the process of evaluation, the first factor is the severity of the R&D risk. Since an R&D failure can be associated with a core process or peripheral process, all of the failures in a whole project do not have the same severity. The severity of a failure in an R&D project needs to be evaluated by considering the impacts on product designs, costs, schedule, and so on. In particular, such sub-factors are identified to measure the level of severity in R&D projects. If a failure occurs in a core process, and the range of impact is broad over the R&D process, the results of the failure can be severe. In addition, when the failure is interdependent with other failures and resides in a bottleneck, it produces negative impacts on the performance of R&D projects. The second factor is the occurrence of a failure. Basically, the main criterion of occurrence can be described as frequency, because the frequency of failure can be easily understood and measured. However, the repeatability of failure might be more important in risk management. In terms of occurrence, if a failure consistently reoccurs in the R&D process, the impact will be harsh in creating an excellent result of R&D activities. Moreover, the impact of a failure at one time, without repeat, might be enormous. Finally, detection can be evaluated by considering the difficulty of detection, the difficulty of proactive inspection and the possibility of systematic detection. If a failure can be difficult to detect in the process, the level of risks is higher than for easily detected failures. In addition, if a manager or researcher cannot proactively detect a failure, its impact can be large. In contrast, a systematic detection can mitigate the level of R&D risks because it enables the easy detection of risks. Table 3 presents the description of sub-factors of three factors. Table 4 shows a typical way to decide a specific level that a pair of FM and CF has in each factor of severity, occurrence, and detection.
In general, the RPN is calculated by multiplying the values of severity, occurrence, and detection. The scorer should be careful in evaluating the value in each factor, because multiplying the values of three factors can generate a larger difference than summing the values. The generic process of the traditional FMEA approach can be identically applied to the proposed process.
3.4. Step 3: Constructing the Relation Matrix
In order to derive critical factors for R&D risk management, causes of failure in R&D projects should be prioritized. DEMATEL provides high performance to extract the influential factors, analysing the relation between causes and results. In the process of applying DEMATEL, the relation matrix needs to be constructed by utilizing the matrix of FMs and CFs. Two relation matrices—the direct-relation matrix and the total relation matrix—are subsequently generated according to the procedure of DEMATEL. First, in terms of the direct-relation matrix, an asymmetric matrix is normally constructed that has causes in the rows, and results in the columns. Since the FMEA can provide two elements of FMs and CFs, the direct-relation matrix of DEMATEL can be easily constructed, ascribing FMs and CFs to results and causes, respectively. Basically, in the general DEMATEL technique, each element has a score among three points (strong relationship), two points (normal relationship), one point (weak relationship), and zero point (no relationship), according to the degree of cause-result relationships. However, in the proposed approach, the RPN value plays a role of measuring the relationships in a quantitative manner with the specific indices of severity, occurrence, and detection. Each row and each column of the direct relation matrix is summed, obtaining the maximum value of the summed rows and columns. Then, the matrix can be normalized by applying Equations (1) and (2), to obtain a normalized relative matrix that indicates the degree of influence of CFs on FMs. Based on this matrix, the total relation matrix is derived by applying Equation (3).
3.5. Step 4: Prioritizing the CFs and FMs
Four indices of DEMATEL are important to analyse the impacts of CFs. Among those indices, the degree of causes (D) and the results (R) are utilized as basic indices, because the other indices (D + R and D-R) can be calculated by computing these first two indices. While the D index means the level of effects that a CF in the R&D process gives to FMs, the R index can be described as an index that can measure the degree to which an FM received the effects from CFs. The importance of CFs and FMs is calculated by summing the D and R indices, regardless of the causes and results, indicating their influence. The degree of cause-result that is calculated by computing D-R shows whether CFs and FMs are causes or results in the relationship between CFs and FMs. If the value of D-R is positively high, then the CFs become important causes. Based on the values, the CFs are prioritized as critical factors that might harm the R&D activities in a project.
This paper constructs two types of direct-relation matrix to analyse the impacts of CFs and FMs. First, the degree of relations between CFs and FMs is inserted at the corresponding cell in the initial direct-relation matrix, letting all the other cells have zero values. Thus, the relations between CFs, as well as those between FMs, are excluded, in order to focus on the analysis of the impact of CFs on FMs. In addition, the impact of FMs on CFs should not be considered in constructing the initial direct-relation matrix, because the FMs are the results of CFs that cause the failure of R&D projects. From another perspective, the initial direct-relation matrix needs to be developed by additionally reflecting the relations among CFs as well as FMs, because the impact of CFs should be accurately calculated. Thus, such cause-result relations among CFs, and FMs are evaluated by the scoring scheme of the traditional DEMATEL approach, ranging from 3 points to 0 point. Since the scales of RPN and DEMATEL are different, they should be normalized to construct the total relation matrix, making each value range between 0 and 1. Thus, after making two types of initial direct-relation matrix, the CFs are prioritized to derive critical factors in each type of matrix. Then, the results are compared to decide the better approach in drawing the impactful factors for the risk management of R&D projects.
4. Illustration
4.1. Case Description
The types of R&D projects vary according to the characteristics and the contexts of projects, including basic research, applied research, and development projects. Although all of the R&D projects are important to the competency of companies, an R&D project that has high risk in the process can be relevant to illustrate the proposed approach. Thus, this paper selected a representative R&D project that develops a new patent analysis system in a software industry by a Korean company. This project aims to implement a full-fledged system that applies a neural network method to visualize patents and to explore patent vacuums, providing new opportunities for disruptive innovation. Since the idea of system development was newly generated in the system area, the R&D process for this project had to be fully implemented from idea generation to market introduction that the stage-gate model normally covers. The proposed standard list of FMs and CFs can be applied to this case because the system development project does not require new technology development. Although a tailored model for R&D risk analysis can be utilized to consider specific project types, such as technology development and very small development for a minor product change, the standard model is appropriate to investigate this case. The project was performed over about two years from 2014 to 2015 by various experts, namely software engineers, research consultants, and data miners. Although the project was terminated, this research collected the details and data of the project through an interview to analyse the risks of the R&D project.
4.2. RPN of the R&D Process
A software development project has several types of risks, and causes of the risks to perform the development of new software. Since this paper proposes a generic framework of the risks and causes with FMs and CFs, this case is investigated by utilizing the predefined FMs and CFs that are shown in Table 2. Although the generic form of FMs and CFs can be modified according to the unique characteristics of each project, this research applies the generic form for illustration, because it can appropriately explain the project. Table 5 shows the RPN of each pair of FMs and CFs, presenting the values of severity, occurrence, and detection. The values of severity, occurrence, and detection are subsequently given by referring to the typical rankings of FMs and CFs, ranging from 1 point to 10 points. For example, if a pair of FMs and CFs has hazardous severity, 10 points in the evaluation of the S factor should be marked. After the evaluation on S, O, and D of all the pairs is complete, RPNs are calculated by multiplying the values of the three factors. Consequently, the pair of FM9 and CF23 has the highest RPN value (384); and, in contrast, the combination of FM4 and CF11 has the lowest RPN value (48). Thus, the risk that ‘selling error’ causes failure of marketing is superficially most serious in the R&D process of this project, whereas the ‘operation definition error’ that causes inaccurate investigation is not significant. Since most innovation process models emphasize the linkage among the detailed processes, the relationships between each stage of the R&D processes should be considered to derive critical risk factors. For example, the chain-linked model that Kline and Rosenberg [45] suggested has main chains, their feedbacks, and linkages between main chains and research activities/knowledge. Thus, the RPN value should be elaborated to prioritize the important risks, by considering the influential relationships between CFs and FMs.
4.3. Relation Matrix of CFs and FMs
This paper constructs two types of relation matrix of CF and FM. First, the basic version of the initial direct-relation matrix uses one part of the four parts of the matrix. The structure of the matrix has four parts, because both the column and the row have groups of CF and FM, yielding four parts, i.e., CF-CF, CF-FM, FM-CF, and FM-FM. The first version of the matrix has significant values of RPN in the CF-FM part, whereas other parts have 0 values in all of the cells. The second version of the direct-relation matrix has significant values in three parts among all parts of the matrix. Since the relation of CF-CF and FM-FM can affect the analysis on the R&D risks, the values of relation in two parts are included in the matrix. However, the FM-CF part is exempted for the analysis of relation, because FM is the result of CF, and it is always affected by the CF. Thus, with the two types of the direct-relation matrix, the CFs can be differently prioritized, when considering different perspectives of risk analysis. Based on Table 5, the R&D process has nine FMs and 25 CFs, thus enabling the formation of a 34x34 initial relation matrix, as shown in Table 6. This table shows the basic version of the matrix can be derived by just using the CF-FM part. The second version of initial relation matrix utilizes the three parts of the matrix, including the CF-CF, CF-FM, and FM-FM parts. Then, the basic version of initial direct-relation matrix was normalized by the Equation (2) and total relation matrix can be generated by the Equation (3) shown in Table 7.
4.4. Prioritizing R&D Risks
Table 8 shows the results that are derived by applying the DEMATEL to the analysis of R&D risks. The D, R, D + R, and D-R values of the matrix are calculated by applying Equations (5) and (6). The D + R values enable analysts to find important CFs that highly affect FMs, or are affected by other CFs or FMs. D-R values can provide information on which CFs or FMs affect or are affected, as well as to what degree they influence the others. In the analysis of the first type of direct-relation matrix where the one-way relation from CFs to FMs is just considered, the value of D + R and D-R in all the cases of CFs is definitely identical, because the relation that CFs received from other CFs and FMs is not analysed. In this case, the CF 25 (results monitoring error), CF 2 (low competence), and CF1 (discrepancy with corporate strategy) are included in the top three ranks in both D + R and D-R. In contrast, the CF 11 (operation definition error), CF 10 (technological feasibility test error), and CF 18 (production equipment acquisition error) have low values of D + R and D-R, because the CFs have low value of RPN, and little influence on FMs.
In terms of the second type of direct-relation matrix that considers all the possible relations of CF-CF, CF-FM, and FM-FM, the final results are totally different from the first analysis. The CF4 (market assessment error), CF2 (low competence), and CF3 (insufficient R&D resources) are highly ranked causes of failure, because those CFs have enormous influence on the failure of R&D projects. In this software development project, the product is very sensitive to markets, and various types of R&D resources should be spent, because the software for patent analysis requires a broad spectrum of knowledge on technology, as well as software. Therefore, they are more important than other causes of failure, making analysers deal with the factors very carefully. In contrast, CF24 (market launch error), CF23 (selling error), and CF22 (production error) have negative values of D-R index, because those CFs normally received influences from other CFs. In other words, while the errors on market launch, selling, and production have some impact on FMs, they are strongly affected by other influential CFs, such as production trial errors, market testing errors, and operation and launch plan errors. Interestingly, the CFs have high values of D + R and the lowest values (even negative values) of D-R. Thus, the results show that those three CFs are important in the R&D process of the software development, whereas they are most affected by other CFs.
5. Discussions & Implications
The previous studies that utilize FMEA to analyse the managerial risks generally only consider the directional relation of CFs and FMs. However, this simple approach fails to reflect the complex relation of R&D risks, because a generic R&D process has multiple stages from idea generation to market launch, and each activity in the stages is sometimes strongly associated with other activities. From the results of analyses that employed two different initial relation matrices, the influential CFs that are derived from the second type of direct-relation matrix are more realistic and practical, than those from the first type of matrix. Market assessment error, low competence, and insufficient R&D resources that are derived from the second approach seem to be fundamental factors that should be carefully dealt with in R&D risk management. However, in terms of ‘results monitoring errors’, ‘low competence’, and ‘discrepancy with corporate strategy’ from the first matrix, those factors need to be considered the first-order risk factors that have high values of influence based on the direct relationship with FMs. Thus, the two types of risk factors should be differently tackled according to the objectives of risk management.
This paper suggests the use of the stage-gate model to investigate the R&D risk management. Thus, although the CF itself is critical to manage R&D risks, important stages should be highlighted to focus on the R&D process. In the aforementioned case, most of the influential CFs are included in the stages of idea generation and primary assessment. In contrast, the CFs that belong to the stage of full production & market launch are mostly dependent on other CFs, show low impacts to FMs, having low values of D-R. In the case of the software development project, the risks in two stages (idea generation and primary assessment) should be carefully managed for successful completion of the project. Since R&D projects have unique characteristics according to the type of projects, different stages among all of the six stages can be highlighted and controlled in each project.
In terms of the selection of the initial relation matrix, two types of the matrix were considered to prioritize the causes of failure. The first type that reflects the one-way relation from CFs to FMs has a value larger than 0 in each cell. On the other hand, the second type can have negative value, which means that a CF receives influence from other CFs, even if the CF has positive value of D + R, the index for measuring the importance of CFs. The differences are caused by utilizing the different approaches to examining the relations between CFs and FMs. The first type does not consider the relation of CF-CF and FM-FM. Thus, the D-R value of CFs is always positive, because the CFs just influence FMs, without receiving impacts from FMs. However, since the second type of matrix adds the relations of CF-CF and FM-FM in the relation matrix, the D-F value of CFs is calculated by using both RPN and the relation among CFs. From the perspective of the use of the matrix, the first type of matrix can be utilized for the purpose of considering the basic relation, because the RPN that is used to construct the matrix is a fundamental index to investigate the R&D risks. The second type can be applied to reflect the relations between the CFs. Thus, it can be regarded as an advanced approach that includes the relations among CFs, as well as the RPN (relations from CFs to FMs). Thus, according to the purpose of the analysis of risk management, one out of the two types of matrix can be selected.
In order to apply the proposed approach in practice, several managerial implications should be considered. First, the failure modes can be modified to customize the risk factors, by considering the unique characteristics and situations of R&D projects. Since there can be a large number of risk factors and the types of R&D projects are various, risk factors need to be appropriately defined and selected. For example, the stage-gate model also has two main different types, namely NPD and NTD (new technology development); and, the constitution of stages and gates differs according to the type. Thus, the risk factors can be differently identified in different stages, because this approach is based on the stage-gate model. Second, in terms of the selection of an initial relation matrix in the DEMATEL step, analysers can consider two options of the matrix. While the basic matrix for initial relations focuses on the direct relations between the failure modes and causes of failure, the advanced matrix can be used to investigate the sophisticated influences of risk factors, by adding the relations between CFs and CFs, as well as FMs and FMs. Although the utilization of the advanced matrix is theoretically recommendable, practitioners can favour the basic matrix that is easy to understand and apply to fields. Thus, analysers should conclude which type of initial relation matrix needs to be chosen in their projects, considering various aspects of time, costs, and human resources. Finally, the risk analysis can be conducted in ex ante or ex post manner, because such analysis aims at evaluating the importance of risk factors prospectively or retrospectively. Although risks are identified and managed in advance, the results of risk analysis without historical data can be inaccurate. Thus, in order to perform risk management correctly, experience in conducting R&D projects and investigating R&D risks should be involved in the process of risk analysis. The priority of risk factors in a specific project can be utilized to forecast the importance of potential risks that might occur in a future R&D project. Therefore, after a project is completed, managers need to compile the results of risk analysis, enabling the anticipation of critical risk factors in future projects.
6. Conclusions
Although most of the actual costs in the life cycle of products are allocated in the latter phase of the cycle, such as production and marketing, they are fixed in the earlier phase, such as ideation and R&D fulfilment. Thus, successful control of R&D risk improves the profitability of products, while mitigating the failure rate of R&D projects. This paper suggested a systematic approach to prioritize the factors to manage R&D risks. For this, the two main techniques of the FMEA and DEMATEL are applied to analyse the influence of risk factors that are derived from the stage-gate model. The proposed approach can enhance the process of R&D risk management, because it can perform the risk analysis of an R&D project in a systematic manner, instead of depending on the experience and the intuition of managers. In particular, this research contributes to the literature of R&D risk management by presenting an approach to identifying the risk factors of R&D projects, based on the stage-gate model. Even though there are many risk factors in a broad spectrum of R&D projects, the stage-gate model enables this paper to systematically organize the list of failure modes and causes of failure.
This paper does have several limitations. First, this research did not provide a process to integrate the results of this approach in a decision-making process. In fact, the priority of risk factors helps managers to make a decision to devise a strategy in R&D risk management. However, this paper focuses on proposing an approach to analysing and evaluating the influence of risk factors. Second, since this research proposes a generic framework to investigate the R&D risks, the list of FMs and CFs are too general to reflect specific cases. Although the suggested list is proper to the selected case for illustration, it can be modified to analyse various project types. Thus, the standard model needs to be customized to each project, in order to accurately explain the characteristics of diverse projects, such as technology development and product improvement. Finally, when the RPN in the FMEA is calculated to investigate the importance of risks, the pairs of FM and CF are derived by analysers, when considering the possible sets of the pairs. However, since all of the CFs can hypothetically affect all of the FMs, the comprehensive relations between FMs and CFs can be included for the risk analysis. Thus, future research can be conducted to deal with the limitations of this research. At the application level, an approach to applying the proposed method to a decision-making process can be performed. In addition, the process can be improved by enriching the list and relation of FMs and CFs from the perspective of methodology.
Acknowledgments
This work was supported by the research program of Dongguk University, 2016 and the National Research Foundation of Korea Grant funded by the Korean Government (NRF-2017R1D1A1A09000758).
Author Contributions
J.S. designed the study, outlined the methodology, performed data anlaysis, and wrote the manuscript. S.L. analysed the data, interpreted the results, and wrote the manuscript. B.Y. implemented the research, designed the study, outlined the methodology, and helped draft the paper. All authors have read and approved the final manuscript.
Conflicts of Interest
The authors declare no conflict of interest.
References
- Bernstein, S. Does going public affect innovation? J. Financ. 2015, 4, 1365–1403. [Google Scholar] [CrossRef]
- Faleye, O.; Kovacs, T.; Venkateswaran, A. Do better-connected CEOs innovate more. J. Financ. Quant. 2014, 49, 1201–1225. [Google Scholar] [CrossRef]
- Chronéer, D.; Bergquist, B. Managerial complexity in process industrial R&D projects: A Swedish study. Proj. Manag. J. 2012, 43, 21–36. [Google Scholar]
- Griffin, A. PDMA Research on New Product Development Practices: Updating trends and benchmarking best practices. J. Prod. Innov. Manag. 1997, 14, 429–458. [Google Scholar] [CrossRef]
- Keizer, J.A.; Vos, J.-P.; Halman, J.I.M. Risks in new product development: Devising a reference tool. R D Manag. 2005, 35, 297–309. [Google Scholar] [CrossRef]
- Cooper, R.G. Managing technology development projects. Res. Technol. Manag. 2006, 49, 23–31. [Google Scholar] [CrossRef]
- Wang, J.; Yang, C. Flexibility planning for managing R&D projects under risk. Int. J. Prod. Econ. 2012, 135, 823–831. [Google Scholar]
- Raz, T.; Shenhar, A.J.; Dvir, D. Risk management, project success, and technological uncertainty. R D Manag. 2002, 32, 101–109. [Google Scholar] [CrossRef]
- Lee, J.; Veloso, F.M.; Hounshell, D.A.; Rubin, E.S. Forcing technological change: A case of automobile emissions control technology development in the US. Technovation 2010, 30, 249–264. [Google Scholar] [CrossRef]
- Pisano, G.P. Can science be a business? Lessons from biotech. Harv. Bus. Rev. 2006, 84, 114–125. [Google Scholar] [PubMed]
- Smith, P.G.; Merritt, G.M. Proactive Risk Management: Controlling Uncertainty in Product Development; Productivity Press: New York, NY, USA, 2002. [Google Scholar]
- Prasad, B. Concurrent Engineering Fundamentals: Integrated Product and Process Organization; Prentice-Hall: Upper Saddle River, NJ, USA, 1996. [Google Scholar]
- Hauser, J.R.; Clausing, D. The house of quality. Harv. Bus. Rev. 1998, 66, 63–73. [Google Scholar]
- Verganti, R. Planned flexibility: Linking anticipation and reaction in product development projects. J. Prod. Innov. Manag. 1999, 16, 363–376. [Google Scholar] [CrossRef]
- Thomke, S.; Reinertsen, D. Agile product development: Managing development flexibility in uncertain environments. Calif. Manag. Rev. 1998, 41, 8–30. [Google Scholar] [CrossRef]
- Knight, F.H. Risk, Uncertainty and Profit; Houghton Mifflin Company: Boston, MA, USA, 1921. [Google Scholar]
- Teller, J.; Kock, A.; Gemünden, H. Risk management in project portfolios Is more than managing project risks: A contingency perspective on risk management. Proj. Manag. J. 2014, 45, 67–80. [Google Scholar] [CrossRef]
- Perminova, O.; Gustafsson, M.; Wikstrom, K. Defining uncertainty in projects—A new perspective. Int. J. Proj. Manag. 2008, 26, 73–79. [Google Scholar] [CrossRef]
- Salomo, S.; Weise, J.; Gemunden, H.G. NPD planning activities and innovation performance: The mediating role of process management and the moderating effect of product innovativeness. J. Prod. Innov. Manag. 2007, 24, 285–302. [Google Scholar] [CrossRef]
- Mu, J.; Peng, G.; MacLachlan, D.L. Effect of risk management strategy on NPD performance. Technovation 2009, 29, 170–180. [Google Scholar] [CrossRef]
- Browning, T.R.; Deyst, J.J.; Eppinger, S.D.; Whitney, D.E. Adding value in product development by creating information and reducing risk. IEEE Trans. Eng. Manag. 2002, 49, 443–458. [Google Scholar] [CrossRef]
- Lefley, F. Approaches to risk and uncertainty in the appraisal of new technology capital projects. Int. J. Prod. Econ. 1997, 53, 21–33. [Google Scholar] [CrossRef]
- Cooper, L.P. A research agenda to reduce risk in new product development through knowledge management: A practitioner perspective. J. Eng. Technol. Manag. 2003, 20, 117–140. [Google Scholar] [CrossRef]
- Ogawa, S.; Piller, F.T. Reducing the risks of new product development. MIT Sloan Manag. Rev. 2006, 47, 65–71. [Google Scholar]
- Gidel, T.; Gautier, R.; Duchamp, R. Decision-making framework methodology: An original approach to project risk management in new product design. J. Eng. Des. 2005, 16, 1–23. [Google Scholar] [CrossRef]
- Wang, J.; Lin, W.; Huang, Y. A performance-oriented risk management framework for innovative R&D projects. Technovation 2010, 30, 601–611. [Google Scholar]
- Ebeling, C. An Introduction to Reliability and Maintainability Engineering; Tata McGraw-Hill: New York, NY, USA, 2001. [Google Scholar]
- Plaza, I.; Ubé, M.; Medrano, C.; Blesa, A. Application of the Philosophy of Quality in the Digital Electronic Matter. In Proceedings of the International Conference on Engineering Education, Valencia, Spain, 21–25 July 2003. [Google Scholar]
- Chang, K.; Chang, Y.; Tsai, I. Enhancing FMEA assessment by integrating grey relational analysis and the decision making trial and evaluation laboratory approach. Eng. Fail. Anal. 2013, 31, 211–224. [Google Scholar] [CrossRef]
- Onodera, K. Effective techniques of FMEA at each life-cycle stage. In Proceedings of the Annual Reliability and Maintainability Symposium, Piscataway, PA, USA, 13–16 January 1997; pp. 50–56. [Google Scholar]
- Hsu, C.W.; Hu, A.H.; Wu, W.C. Using FMEA and FAHP to Risk Evaluation of Green Components. In Proceedings of the 2008 IEEE International Symposium on Electronics and the Environment, San Francisco, CA, USA, 19–22 May 2008; pp. 19–21. [Google Scholar]
- Pickard, K.; Müller, P.; Bertsche, B. Multiple Failure Mode and Effects Analysis—An Approach to Risk Assessment of Multiple Failures with FMEA. In Proceedings of the Reliability and Maintainability Symposium, Alexandria, VA, USA, 24–27 January 2005. [Google Scholar]
- Mariajayaprakash, A.; Senthilvelan, T. Failure detection and optimization of sugar mill boiler using FMEA and Taguchi method. Eng. Fail. Anal. 2013, 30, 17–26. [Google Scholar] [CrossRef]
- Bowles, J.B.; Pelaez, C.E. Fuzzy logic prioritization of failures in a system failure mode, effects and criticality analysis. Reliab. Eng. Syst. Saf. 1995, 50, 203–213. [Google Scholar] [CrossRef]
- Spreafico, C.; Russo, D.; Rizzi, C. A state-of-the-art review of FMEA/FMECA including patents. Comput. Sci. Rev. 2017, 25, 19–28. [Google Scholar] [CrossRef]
- Wu, W.; Lee, Y. Developing global managers’ competencies using the fuzzy DEMATEL method. Expert Syst. Appl. 2007, 32, 499–507. [Google Scholar] [CrossRef]
- Tzeng, G.-H.; Chiang, C.-H.; Li, C.-W. Evaluating intertwined effects in elearning programs: A novel hybrid MCDM model based on factor analysis and DEMATEL. Expert Syst. Appl. 2007, 32, 1028–1044. [Google Scholar] [CrossRef]
- Liou, J.J.H.; Yen, L.; Tzeng, G.H. Building an effective safety management system for airlines. J. Air Transp. Manag. 2008, 14, 20–26. [Google Scholar] [CrossRef]
- Tseng, M.-L. A causal and effect decision making model of service quality expectation using grey-fuzzy DEMATEL approach. Expert Syst. Appl. 2009, 36, 7738–7748. [Google Scholar] [CrossRef]
- Hu, A.H.; Hsu, C.; Kuo, T.; Wu, W. A risk evaluation of green components to hazardous substance using FMEA and FAHP. Expert Syst. Appl. 2009, 36, 7142–7147. [Google Scholar] [CrossRef]
- Wei, P.L.; Huang, J.H.; Tzeng, G.H. Causal modeling of web-advertising effects by improving SEM based on DEMATEL technique. Int. J. Inf. Technol. Decis. Mak. 2010, 9, 799–829. [Google Scholar] [CrossRef]
- Bai, C.; Sarkis, J. A grey-based DEMATEL model for evaluating business process management critical success factors. Int. J. Prod. Econ. 2013, 146, 281–292. [Google Scholar] [CrossRef]
- Cooper, R.G. Stage-gate systems: A new tool for managing new products. Bus. Horiz. 1990, 33, 44–54. [Google Scholar] [CrossRef]
- Cooper, R.G.; Sommer, A.F. Agile-Stage-Gate: New idea-to-launch method for manufactured new products is faster, more responsive. Ind. Mark. Manag. 2016, 59, 167–180. [Google Scholar] [CrossRef]
- Kline, S.J.; Rosenberg, N. An Overview of Innovation. In The Positive Sum Strategy: Harnessing Technology for Economic Growth; Landau, R., Rosenberg, N., Eds.; National Academy Press: Washington, DC, USA, 1986; pp. 275–305. [Google Scholar]
Figure 1.
Overall process of research.

Figure 2.
Stage-gate model proposed by Cooper [43].
Figure 2.
Stage-gate model proposed by Cooper [43].


Table 1.
Comparison of the proposed approach and traditional Failure Mode and Effect Analysis (FMEA).
Table 1.
Comparison of the proposed approach and traditional Failure Mode and Effect Analysis (FMEA).
| Type of Approach | Proposed Approach | Traditional FMEA |
|---|---|---|
| Prioritization of risk factors | Impact of risk | RPN (Severity, Occurrence, Detection) |
| Identification of FMs | Applications of Stage-gate model | A whole system |
| Methodology | FMEA and DEMATEL | FMEA |
Table 2.
FMEA of the R&D process.
| No. | Stage | Gate | Failure Mode | Causes of Failure |
|---|---|---|---|---|
| 1 | Stage 0: Idea | Gate 1: Initial screen | FM1: Unclear ideas FM2: Wrong ideas | CF1: Discrepancy with corporate strategy CF2: Low competence CF3: Insufficient R&D resources |
| 2 | Stage 1: Primary assessment | Gate 2: Second screen | FM3: Wrong assessment | CF4: Market assessment error CF5: Technology assessment error CF6: Financial assessment error |
| 3 | Stage 2: Detailed investigation | Gate 3: Decision on business cases | FM4: Inaccurate investigation | CF7: Customer analysis error CF8: Competitor analysis error CF9: Value proposition definition error CF10: Technological feasibility test error CF11: Operation definition error |
| 4 | Stage 3: Development | Gate 4: Post development review | FM5: Failure of development | CF12: Rapid prototyping error CF13: Customer feedback error CF14: Prototype development error CF15: In-house testing error CF16: Operation process development error |
| 5 | Stage 4: Testing & Validation | Gate 5: Pre-commercialization decision | FM6: Wrong testing FM7: Wrong validation | CF17: Customer field trials error CF18: Production equipment acquisition error CF19: Production trials error CF20: Market testing error CF21: Operations and launch plan error |
| 6 | Stage 5: Full production & Market launch | Post-implementation review | FM8: Failure of production FM9: Failure of marketing | CF22: Production error CF23: Selling error CF24: Market launch error CF25: Results monitoring error |
Table 3.
Factors for risk priority.
| Factors | Sub-Factors | Description |
|---|---|---|
| Severity | Core | How much is a failure of a process critical? |
| Range | How broad is the affected range? | |
| Interdependency | How closely is a failure related with other processes? | |
| Bottleneck | How possibly is a process a bottleneck? | |
| Occurrence | Frequency | How frequently does a failure occur? |
| Repeatability | How repeatedly does a failure occur? | |
| Singularity | Does the R&D project fail if a single failure occurs? | |
| Detection | Difficulty in detection | How difficult is the detection of a failure? |
| Difficulty in proactive inspection | How can a failure be inspected proactively? | |
| Systematic detection | Does a systematic approach detect a failure? |
Table 4.
Typical rankings of failure mode measures.
| Level | S | O | D |
|---|---|---|---|
| 1 | No | Almost never | Almost certain |
| 2 | Very slight | Remote | Very high |
| 3 | Slight | Very slight | High |
| 4 | Minor | Slight | Moderate high |
| 5 | Moderate | Low | Medium |
| 6 | Significant | Medium | Low |
| 7 | Major | Moderately high | Slight |
| 8 | Extreme | High | Very slight |
| 9 | Serious | Very high | Remote |
| 10 | Hazardous | Almost certain | Almost impossible |
Table 5.
Risk priority number (RPN) of R&D process.
| No. | Failure Mode | Cause of Failure | Severity | Occurrence | Detection | RPN |
|---|---|---|---|---|---|---|
| 1 | FM1 | CF1 | 7 | 4 | 7 | 196 |
| 2 | FM1 | CF2 | 6 | 5 | 6 | 180 |
| 3 | FM1 | CF3 | 3 | 6 | 6 | 108 |
| 4 | FM2 | CF1 | 6 | 6 | 6 | 216 |
| 5 | FM2 | CF2 | 8 | 6 | 6 | 288 |
| 6 | FM2 | CF3 | 5 | 5 | 5 | 125 |
| 7 | FM3 | CF4 | 7 | 3 | 6 | 126 |
| 8 | FM3 | CF5 | 6 | 3 | 7 | 126 |
| 9 | FM3 | CF6 | 5 | 3 | 5 | 75 |
| 10 | FM4 | CF7 | 8 | 6 | 6 | 288 |
| 11 | FM4 | CF8 | 7 | 6 | 8 | 336 |
| 12 | FM4 | CF9 | 4 | 4 | 5 | 80 |
| 13 | FM4 | CF10 | 4 | 4 | 4 | 64 |
| 14 | FM4 | CF11 | 3 | 4 | 4 | 48 |
| 15 | FM5 | CF12 | 8 | 4 | 5 | 160 |
| 16 | FM5 | CF13 | 9 | 5 | 6 | 270 |
| 17 | FM5 | CF14 | 6 | 4 | 4 | 96 |
| 18 | FM5 | CF15 | 5 | 4 | 4 | 80 |
| 19 | FM5 | CF16 | 7 | 5 | 5 | 175 |
| 20 | FM6 | CF17 | 7 | 5 | 4 | 140 |
| 21 | FM6 | CF18 | 5 | 4 | 4 | 80 |
| 22 | FM6 | CF19 | 6 | 4 | 5 | 120 |
| 23 | FM6 | CF20 | 7 | 4 | 5 | 140 |
| 24 | FM7 | CF17 | 8 | 6 | 5 | 240 |
| 25 | FM7 | CF19 | 6 | 5 | 5 | 150 |
| 26 | FM7 | CF20 | 6 | 5 | 6 | 180 |
| 27 | FM7 | CF21 | 7 | 5 | 6 | 210 |
| 28 | FM8 | CF22 | 8 | 8 | 5 | 320 |
| 29 | FM8 | CF25 | 7 | 8 | 6 | 336 |
| 30 | FM9 | CF23 | 8 | 8 | 6 | 384 |
| 31 | FM9 | CF24 | 7 | 5 | 7 | 245 |
| 32 | FM9 | CF25 | 8 | 7 | 6 | 336 |
Table 6.
Basic version of initial direct-relation matrix X of the R&D process.
| Matrix X | CF1 | CF2 | CF3 | … | CF25 | FM1 | FM2 | FM3 | FM4 | FM5 | FM6 | FM7 | FM8 | FM9 |
|---|---|---|---|---|---|---|---|---|---|---|---|---|---|---|
| CF1 | 0 | 196 | 216 | 0 | 0 | 0 | 0 | 0 | 0 | 0 | ||||
| CF2 | 180 | 288 | 0 | 0 | 0 | 0 | 0 | 0 | 0 | |||||
| CF3 | 108 | 125 | 0 | 0 | 0 | 0 | 0 | 0 | 0 | |||||
| CF4 | 0 | 0 | 126 | 0 | 0 | 0 | 0 | 0 | 0 | |||||
| CF5 | 0 | 0 | 126 | 0 | 0 | 0 | 0 | 0 | 0 | |||||
| CF6 | 0 | 0 | 75 | 0 | 0 | 0 | 0 | 0 | 0 | |||||
| CF7 | 0 | 0 | 0 | 288 | 0 | 0 | 0 | 0 | 0 | |||||
| CF8 | 0 | 0 | 0 | 336 | 0 | 0 | 0 | 0 | 0 | |||||
| CF9 | 0 | 0 | 0 | 80 | 0 | 0 | 0 | 0 | 0 | |||||
| CF10 | 0 | 0 | 0 | 64 | 0 | 0 | 0 | 0 | 0 | |||||
| CF11 | 0 | 0 | 0 | 48 | 0 | 0 | 0 | 0 | 0 | |||||
| CF12 | 0 | 0 | 0 | 0 | 160 | 0 | 0 | 0 | 0 | |||||
| CF13 | 0 | 0 | 0 | 0 | 270 | 0 | 0 | 0 | 0 | |||||
| CF14 | 0 | 0 | 0 | 0 | 96 | 0 | 0 | 0 | 0 | |||||
| CF15 | 0 | 0 | 0 | 0 | 80 | 0 | 0 | 0 | 0 | |||||
| CF16 | 0 | 0 | 0 | 0 | 175 | 0 | 0 | 0 | 0 | |||||
| CF17 | 0 | 0 | 0 | 0 | 0 | 140 | 240 | 0 | 0 | |||||
| CF18 | 0 | 0 | 0 | 0 | 0 | 80 | 0 | 0 | 0 | |||||
| CF19 | 0 | 0 | 0 | 0 | 0 | 120 | 150 | 0 | 0 | |||||
| CF20 | 0 | 0 | 0 | 0 | 0 | 140 | 180 | 0 | 0 | |||||
| CF21 | 0 | 0 | 0 | 0 | 0 | 0 | 210 | 0 | 0 | |||||
| CF22 | 0 | 0 | 0 | 0 | 0 | 0 | 0 | 320 | 0 | |||||
| CF23 | 0 | 0 | 0 | 0 | 0 | 0 | 0 | 0 | 384 | |||||
| CF24 | 0 | 0 | 0 | 0 | 0 | 0 | 0 | 0 | 245 | |||||
| CF25 | 0 | 0 | 0 | 0 | 0 | 0 | 0 | 336 | 336 | |||||
| FM1 | 0 | 0 | ||||||||||||
| FM2 | ||||||||||||||
| … | ||||||||||||||
| FM9 | ||||||||||||||
Table 7.
Total relation matrix X.
| Matrix X | CF1 | CF2 | CF3 | … | CF25 | FM1 | FM2 | FM3 | FM4 | FM5 | FM6 | FM7 | FM8 | FM9 |
|---|---|---|---|---|---|---|---|---|---|---|---|---|---|---|
| CF1 | 0 | 0.29 | 0.32 | 0 | 0 | 0 | 0 | 0 | 0 | 0 | ||||
| CF2 | 0.27 | 0.43 | 0 | 0 | 0 | 0 | 0 | 0 | 0 | |||||
| CF3 | 0.16 | 0.19 | 0 | 0 | 0 | 0 | 0 | 0 | 0 | |||||
| CF4 | 0 | 0 | 0.19 | 0 | 0 | 0 | 0 | 0 | 0 | |||||
| CF5 | 0 | 0 | 0.19 | 0 | 0 | 0 | 0 | 0 | 0 | |||||
| CF6 | 0 | 0 | 0.11 | 0 | 0 | 0 | 0 | 0 | 0 | |||||
| CF7 | 0 | 0 | 0 | 0.43 | 0 | 0 | 0 | 0 | 0 | |||||
| CF8 | 0 | 0 | 0 | 0.50 | 0 | 0 | 0 | 0 | 0 | |||||
| CF9 | 0 | 0 | 0 | 0.12 | 0 | 0 | 0 | 0 | 0 | |||||
| CF10 | 0 | 0 | 0 | 0.10 | 0 | 0 | 0 | 0 | 0 | |||||
| CF11 | 0 | 0 | 0 | 0.07 | 0 | 0 | 0 | 0 | 0 | |||||
| CF12 | 0 | 0 | 0 | 0 | 0.24 | 0 | 0 | 0 | 0 | |||||
| CF13 | 0 | 0 | 0 | 0 | 0.40 | 0 | 0 | 0 | 0 | |||||
| CF14 | 0 | 0 | 0 | 0 | 0.14 | 0 | 0 | 0 | 0 | |||||
| CF15 | 0 | 0 | 0 | 0 | 0.12 | 0 | 0 | 0 | 0 | |||||
| CF16 | 0 | 0 | 0 | 0 | 0.26 | 0 | 0 | 0 | 0 | |||||
| CF17 | 0 | 0 | 0 | 0 | 0 | 0.21 | 0.36 | 0 | 0 | |||||
| CF18 | 0 | 0 | 0 | 0 | 0 | 0.12 | 0 | 0 | 0 | |||||
| CF19 | 0 | 0 | 0 | 0 | 0 | 0.18 | 0.22 | 0 | 0 | |||||
| CF20 | 0 | 0 | 0 | 0 | 0 | 0.21 | 0.27 | 0 | 0 | |||||
| CF21 | 0 | 0 | 0 | 0 | 0 | 0 | 0.31 | 0 | 0 | |||||
| CF22 | 0 | 0 | 0 | 0 | 0 | 0 | 0 | 0.48 | 0 | |||||
| CF23 | 0 | 0 | 0 | 0 | 0 | 0 | 0 | 0 | 0.57 | |||||
| CF24 | 0 | 0 | 0 | 0 | 0 | 0 | 0 | 0 | 0.36 | |||||
| CF25 | 0 | 0 | 0 | 0 | 0 | 0 | 0 | 0.50 | 0.50 | |||||
| FM1 | 0 | 0 | ||||||||||||
| FM2 | ||||||||||||||
| … | ||||||||||||||
| FM9 | ||||||||||||||
Table 8.
Prioritization of cause factors (CFs) of R&D Process.
| No. | Analysis Based on the Initial Relation Matrix 1 | Analysis Based on the Initial Relation Matrix 2 | ||||||
|---|---|---|---|---|---|---|---|---|
| D | R | D + R | D-R | D | R | D + R | D-R | |
| CF1 | 0.61 | 0 | 0.61 | 0.61 | 2.96 | 1.03 | 3.99 | 1.93 |
| CF2 | 0.70 | 0 | 0.70 | 0.70 | 31.91 | 0.70 | 32.62 | 31.22 |
| CF3 | 0.35 | 0 | 0.35 | 0.35 | 20.72 | 1.12 | 21.85 | 19.60 |
| CF4 | 0.19 | 0 | 0.19 | 0.19 | 34.65 | 3.37 | 38.01 | 31.28 |
| CF5 | 0.19 | 0 | 0.19 | 0.19 | 12.64 | 0.00 | 12.64 | 12.64 |
| CF6 | 0.11 | 0 | 0.11 | 0.11 | 14.88 | 1.44 | 16.32 | 13.45 |
| CF7 | 0.43 | 0 | 0.43 | 0.43 | 16.82 | 2.89 | 19.71 | 13.94 |
| CF8 | 0.50 | 0 | 0.50 | 0.50 | 13.55 | 2.89 | 16.44 | 10.66 |
| CF9 | 0.12 | 0 | 0.12 | 0.12 | 2.47 | 2.11 | 4.58 | 0.36 |
| CF10 | 0.10 | 0 | 0.10 | 0.10 | 8.74 | 0.66 | 9.40 | 8.08 |
| CF11 | 0.07 | 0 | 0.07 | 0.07 | 4.59 | 0.00 | 4.59 | 4.59 |
| CF12 | 0.24 | 0 | 0.24 | 0.24 | 3.89 | 1.99 | 5.88 | 1.91 |
| CF13 | 0.40 | 0 | 0.40 | 0.40 | 5.47 | 3.99 | 9.46 | 1.49 |
| CF14 | 0.14 | 0 | 0.14 | 0.14 | 2.09 | 3.96 | 6.05 | −1.87 |
| CF15 | 0.12 | 0 | 0.12 | 0.12 | 2.14 | 1.26 | 3.40 | 0.88 |
| CF16 | 0.26 | 0 | 0.26 | 0.26 | 2.48 | 1.55 | 4.04 | 0.93 |
| CF17 | 0.57 | 0 | 0.57 | 0.57 | 2.81 | 7.28 | 10.09 | −4.47 |
| CF18 | 0.12 | 0 | 0.12 | 0.12 | 3.15 | 3.56 | 6.71 | −0.40 |
| CF19 | 0.40 | 0 | 0.40 | 0.40 | 3.38 | 5.38 | 8.76 | −2.00 |
| CF20 | 0.48 | 0 | 0.48 | 0.48 | 3.05 | 4.35 | 7.40 | −1.30 |
| CF21 | 0.31 | 0 | 0.31 | 0.31 | 2.11 | 5.50 | 7.61 | −3.40 |
| CF22 | 0.48 | 0 | 0.48 | 0.48 | 0.48 | 13.50 | 13.98 | −13.02 |
| CF23 | 0.57 | 0 | 0.57 | 0.57 | 0.57 | 16.92 | 17.49 | −16.35 |
| CF24 | 0.36 | 0 | 0.36 | 0.36 | 0.36 | 22.90 | 23.26 | −22.54 |
| CF25 | 1.00 | 0 | 1.00 | 1.00 | 1.00 | 3.01 | 4.03 | −2.03 |
© 2018 by the authors. Licensee MDPI, Basel, Switzerland. This article is an open access article distributed under the terms and conditions of the Creative Commons Attribution (CC BY) license (http://creativecommons.org/licenses/by/4.0/).
Share and Cite
MDPI and ACS Style
Shin, J.; Lee, S.; Yoon, B. Identification and Prioritisation of Risk Factors in R&D Projects Based on an R&D Process Model. Sustainability 2018, 10, 972. https://doi.org/10.3390/su10040972
AMA Style
Shin J, Lee S, Yoon B. Identification and Prioritisation of Risk Factors in R&D Projects Based on an R&D Process Model. Sustainability. 2018; 10(4):972. https://doi.org/10.3390/su10040972
Chicago/Turabian StyleShin, Junseok, Sungjoo Lee, and Byungun Yoon. 2018. "Identification and Prioritisation of Risk Factors in R&D Projects Based on an R&D Process Model" Sustainability 10, no. 4: 972. https://doi.org/10.3390/su10040972
Note that from the first issue of 2016, this journal uses article numbers instead of page numbers. See further details here.