Measurement and Prediction of Regional Tourism Sustainability: An Analysis of the Yangtze River Economic Zone, China

Business School, Sichuan University, Chengdu 610065, China
*
Author to whom correspondence should be addressed.
Sustainability 2018, 10(5), 1321; https://doi.org/10.3390/su10051321
Submission received: 5 April 2018
/
Revised: 20 April 2018
/
Accepted: 21 April 2018
/
Published: 24 April 2018
(This article belongs to the Special Issue Employment and Income Growth from Sustainable Tourism)
Abstract
:In view of sustainable development of tourism, this paper firstly constructs a more comprehensive and scientific index system from the economical/societal/resource-related/environmental aspects of tourism and evaluates the sustainable and comprehensive development level of tourism in 11 provinces and cities of the Yangtze River economic zone by using the weighted TOPSIS (The Technique for Order Preference by Similarity to an Ideal Solution ) method; secondly, it analyzes the coupling coordination evolution relationship between tourism and the economy/society/resources/environment in different provinces and cities of the Yangtze river economic zone based on the coupling coordination model from the spatio-temporal dimension; and finally, it predicts the coupling coordination degree of the provinces and cities in the region in the next few years by the grey model (1,1) and puts forward some countermeasures and suggestions. According to the study, this method provides an effective reference to the study on the sustainable development of tourism and is very significant for learning the sustainable development of regional tourism and establishing specific and scientific countermeasures for improvement.
1. Introduction
Since the middle of the 20th century, the world has faced severe challenges due to the problems of resource depletion, environmental degradation, unemployment crisis, and the spread of poverty. The United Nations Development Summit held in September 2015 formally adopted the agreement “Transforming our world: The 2030 agenda for sustainable development”, embracing the three dimensions of sustainability—economic, social and environmental—and aiming to end global poverty and building a life of dignity for all [1]. The concept of tourism sustainability is an extension of the idea of sustainable development in tourism. The World Tourism Organization (WTO, Madrid, Spain) considers Sustainable development as a way that meets the needs of stakeholders such as tourists, tourism, the environment, and local communities while taking full account of current and future economic, social, and environmental impacts [2]. To further the concept of the sustainable development of tourism, it is necessary to analyze the sustainable development of regional tourism effectively by evaluating the sustainability of existing practices and initiatives, and to explore the sustainable development of regional tourism, so as to promote the coordinated development of tourism in all directions. Therefore, the purpose of this paper is to construct a model which can effectively evaluate the sustainable development of tourism, so as to analyze the sustainable development of regional tourism and the relationship of coupling coordination. These analyses are helpful to understand the current situation of tourism development and also provide suggestions for future sustainable development. The remainder of this article is organized as follows. Section 2 is the literature review; Section 3 introduces the study areas and data source; Section 4 presents the study methods, including the construction of the index system for tourism sustainability development (TSI), the evaluation method, and the weighting method of the index system. Next, the results and discussion are elaborated in Section 5. Then, the Suggested Countermeasures of the regional tourism sustainability development are put forward in Section 6 and finally, this paper gives its conclusions and future prospects in Section 7.
2. Literature Review
In recent decades, many studies have focused on evaluating tourism sustainability development. Great efforts have been exerted to study tourism sustainability at the rural community, local/urban, regional, national, and international scales (as shown in Table 1). Moreover, it was stated that “sustainability principles refer to the environmental, economic, and socio-cultural aspects of tourism development, and a suitable balance must be established between these three dimensions to guarantee its long-term sustainability” [3]. One can see that the concept of sustainable tourism refers to three fundamental dimensions: economic growth, environmental sustainability, and social equity. Once sustainable tourism has been defined together with identifying the need to develop sustainable tourism at the destination level, some indicators/system of indicators to monitor sustainable tourism have emerged [4]. Characterizing the actual state of things or the phenomena and analyzing their development and changes is a major advantage of indicators of sustainable development [5]. Indicators of tourism sustainability can provide the necessary information to better understand the impact of tourism on the cultural and natural environment of the destination. It is not easy to determine the indexes that can accurately reflect the relationship between tourism, nature, society, culture, and environment, but the relevant international organizations, experts, and scholars have been devoted to the study of tourism sustainable indexes for a long time and achieved certain results. The three-dimensional index framework of society, economy, and environment proposed by the World Tourism Organization (WTO, Madrid, Spain) has been widely used [6]. The European Commission (EU, Brussels, Belgium) has selected 27 core indicators and 40 optional indicators to constitute the European Tourism Indicators System (ETIS) from four aspects of destination management, sociocultural influence, economic value, and environmental pressure [7]. Although Tudorache and Simon [4] have analyzed the difficulties and challenges encountered in ETIS applications, considered the particularities of their destinations and the needs of stakeholders, and then incorporated additional indicators, the system is only applicable in the EU. Economic cooperation and development organization (OECD, Paris, France) is given priority to the economy and combined with the social culture and environmental perspective to build the index system of tourism competitiveness [8]. On this basis, the researchers have made different attempts. Choi and Sirakaya [9] believe that the realization of the goal of sustainable tourism development depends to a large extent on the social-political constitution and power distribution; the progress of transportation, information, and communication technology has a great impact on the development of modern tourism, so the political, technical, and cultural should be taken as an independent dimension. Castellani and Sala [10] constructed an index system from three dimensions: socio-economic, tourism, and the natural and cultural heritage. Budruk and Philips [11] pointed out that community indicators can link the quality of life to broader social goals, especially for the resolution of conflicts among stakeholders such as residents, tourists, organizations, and so forth. The evaluation system of sustainable tourism development proposed by Zhou included four factors: tourism resources and environment, economic and social benefits, market influence and tourism auxiliary conditions, which can better reflect the content of sustainable tourism development in the region [12]. Luo [13] studied the sustainable development strategy of ecotourism from the following aspects: resource conditions, industry basis, socio-economic conditions, natural environmental conditions, and location conditions, all of which focused on providing guidance and reference for the development of tourism resources.
The problems of measurement and monitoring are the major unresolved issues in sustainable development due to “difficulties stemming from the ill-defined nature of the concept” of sustainable development [28]. Many scholars have carried out extensive and in-depth research on this issue and qualitative and quantitative methods have been used in a number of studies. Qualitative analysis mainly focuses on the process, path, and origin causes of tourism sustainability development [29,30,31,32]; quantitative research chiefly includes the synthetic evaluation of tourism sustainability capacity [14,17,33], the analysis of factors affecting sustainable development [34], and the coupling and coordination relationship between tourism development and ecological environment [18,20,21,23,25,35,36]. Although the previous research mainly focuses on single cities or provinces, the research of cross-provincial comparison and large basin coordination analysis based on a macro scale are still insufficient. In addition, the research focuses on the analysis of cross-sectional data or within a short-term development period, and are lacking in the prediction of future coordination relationships between tourism and the economy, society, resources, and/or environment.
Standardizing, weighting, and aggregating usually constitute the basic processes of tourism sustainability development assessment. The weighting methods, which are the critical step of evaluation, can be mainly divided into two categories. One is the subjective method, which determines the weight coefficient of each indicator by comprehensive consulting the score, for example, the analytic hierarchy process (AHP) [16,33] and the Delphi method [37]. This method possibly tends to exaggerate or reduce the effects of certain indicators and easily leads to reflecting the relationships among indicators inaccurately. The other is the objective method, which determines the weight of each index based on the internal relationship and degree of variation among the different indicators, can effectively avoid the deviation of human factors, and includes methods such as the principal component analysis (PCA) [24,35], the entropy method [17,18,20,21], and TOPSIS [25]. Previous research methods have played different roles in sustainability measurement, but they have some deficiencies. Analytic hierarchy process (AHP), Delphi method and other subjective weighting methods are widely used, but the objectivity is poor; Principal component analysis (PCA) will inevitably lead to the loss of information when extracting principal components quickly, and the loss of information is positively correlated with the number of indicators. Gray correlation analysis method and cluster analysis method are mainly used in the later classification of AHP or PCA in comprehensive evaluation [38]. Their independence is poor, and there are obvious deficiencies in determining the index weight. The weighted TOPSIS method is essentially an improvement over the traditional TOPSIS method, which the weights of the evaluation indicators are determined by the combined weighting method, then the ranking of the evaluation objects is determined by using the technique for sequencing by approximate ideal solution. It can not only objectively reflect the importance of a certain index in the index system, but can also reflect the change of index weight with time, so it is more suitable for measuring the sustainability of tourism.
To quantitatively evaluate and analyze the level of tourism sustainability development for revealing and predicting the sustainable and coordinated development of tourism, this paper comprehensively considers the influencing factors of tourism to the economy, the society, resources, and the environment for constructing index system; it carries out quantitative study on the sustainable development of tourism in 11 provinces and cities of the Yangtze River economic zone from the two dimensions of time and space by weighted TOPSIS method and coupling coordination theory model; it forecasts the coordinated development of provinces and cities in the next few years with the help of the grey GM (1,1) model; and it provides reference for strengthening the competitiveness and improving the sustainability capacity.
3. The Study Areas and Data
3.1. Study Areas
The Yangtze River economic zone spans the three major regions in China, with a total area of about 2.05 million km2 and composed of 11 provinces and cities in Shanghai, Jiangsu, Zhejiang, Anhui, Jiangxi, Hunan, Hubei, Chongqing, Sichuan, Yunnan, and Guizhou (as shown in Figure 1). As an important strategic region of China’s economic development, the 11 provinces and cities of the Yangtze River economic zone have rich and distinctive tourism resources and a good industrial integration foundation. Its population, regional GDP, and the third industrial output value are more than 40% of the country and it has become one of China’s strongest economic development strengths: the largest role of strategic support. The Yangtze river economic zone is rich in natural and cultural tourism resources; by the end of 2015, the World Heritages, National Nature Reserves, and National Scenic Areas accounted for 44% of the national total; the national forest parks, national wetland parks, national historical and cultural cities, and the national key cultural relic protection units account for 42%, 48%, 41%, and 36% of the national total, respectively [19]. The Yangtze River economic zone has experienced many years of development and construction, the traditional way of economic development has not fundamentally changed and the situation of the ecological environment is still grim. Therefore, taking the 11 provinces and cities along the economic zone of the Yangtze River economic zone in China as the research object is of great significance to optimize the structure of the regional tourism industry and promote the sustainable development of regional tourism.
3.2. Data Source
As required by the index system, the data in this study mainly comes from the China Tourism Statistical Yearbook (2007–2016) [39], the China Statistical Yearbook (2007–2016) [40], the China Statistical Yearbook on Environment (2007–2016) [41] and the provincial statistical yearbook of the 11 provinces or cities. The data of some indicators is converted from the raw data through the computation formula. The data sources of the indicators are shown in Appendix A.
4. Study Methods
4.1. Construction and Analysis of Index System
Seeking the positive and negative factors of the sustainable development of regional tourism will help to play a positive role in the sustainable development and clear the obstacles in the development process. There are extremely complex interactions in the process of the tourism economy, the social development, and the resource environment evolution. The development of the tourism economy and society can realize the rational and intensive utilization of natural resources, but it may also cause environmental degradation in turn. The fragile environment and scarce resources will not only affect the image of tourism destinations to varying degrees but also restrict the development of the tourism economy and society after the destruction of the resource and environment systems. Objectively, there are various contradictions and interactions among the tourism economy, society, resources, and environment. The complex system composed of the tourism economy, society, resources, and environment can be defined as a coupling system and the harmonious coupling relationship is the foundation of sustainable tourism development. As a result, this paper draws on the existing research results [4,12,17,18,20,21,22,25,26,27,33,35,36,42,43,44] and combined with the tourism development of China’s Yangtze River economic zone, develops a comprehensive index system composed of 4 criteria, 8 aspects, and 33 indicators, as shown in Table 2.
In this index system, the object layer of regional tourism sustainable development is divided into four rule layers: the economy, society, resources, and environment. The evaluation index (index layer) is constructed under each rule layer according to the requirements of these aspects of development, and the evaluation factor is set for each index layer. The logic of the index selection is as follows:
The sustainable performance of the tourism economy can not only achieve economic growth at present but also needs to achieve the sustainable tourism production and economic growth in the future. Tourism economy covers all kinds of economic factors that have taken place in the development of regional tourism. It is the inclusion of all economic strategies, economic behaviors, and economic abilities. Its function is to optimize the economic structure on the basis of ensuring the carrying capacity of natural resources and ecological environment so that the regional tourism can maintain a higher economic benefit for a long time. The factors of the tourism economy include the economic benefit and economic influence. The economic benefit is the benefit gained in tourism economic activities under the rational utilization of resources and environmental protection; the economic impact refers to the contribution of the tourism economy to the output value of the tertiary industry and to the gross national product in the region, as well as the additional energy consumption for the economic development.
The sustainable development of the tourism society needs talents with professional knowledge and management ability to provide high-quality services for tourists, and the tourism traffic routes can be rationally planned and arranged to enhance the attractiveness of regional tourism. Social impact refers to the social labor and transport infrastructure conditions that can support the development of tourist destinations. Therefore, the social impact indicators need to include factors that measure the regional human support and accessibility.
The resource reserve is the material basis for the development of the tourism industry and the abundant tourism resources can provide continuous power for the sustainable development of tourism. Tourism resources include auxiliary industry resources of regional tourism and market conditions (resources of scenic and tourists) needed for the development of the tourism industry. Therefore, the indicators of resource reserves need to cover the content that can reflect the size of the regional tourism market and reception capacity.
The sustainable development of the ecological environment provides a good foundation and basis for the development of the tourism industry and is the fundamental guarantee for the sustainable development of tourism. The unreasonable development of tourism resources and ecological pollution will reduce the environmental carrying capacity and further restrict the development of the tourism industry. In the development of the tourism industry, it is necessary to be concerned about the impact on the ecological environment in order to implement reasonable measures to improve and prevent the deterioration of the ecological environment. Thus, the eco-environmental indicators need to include the content of the environmental status and the ecological governance.
4.2. Summary of the Model
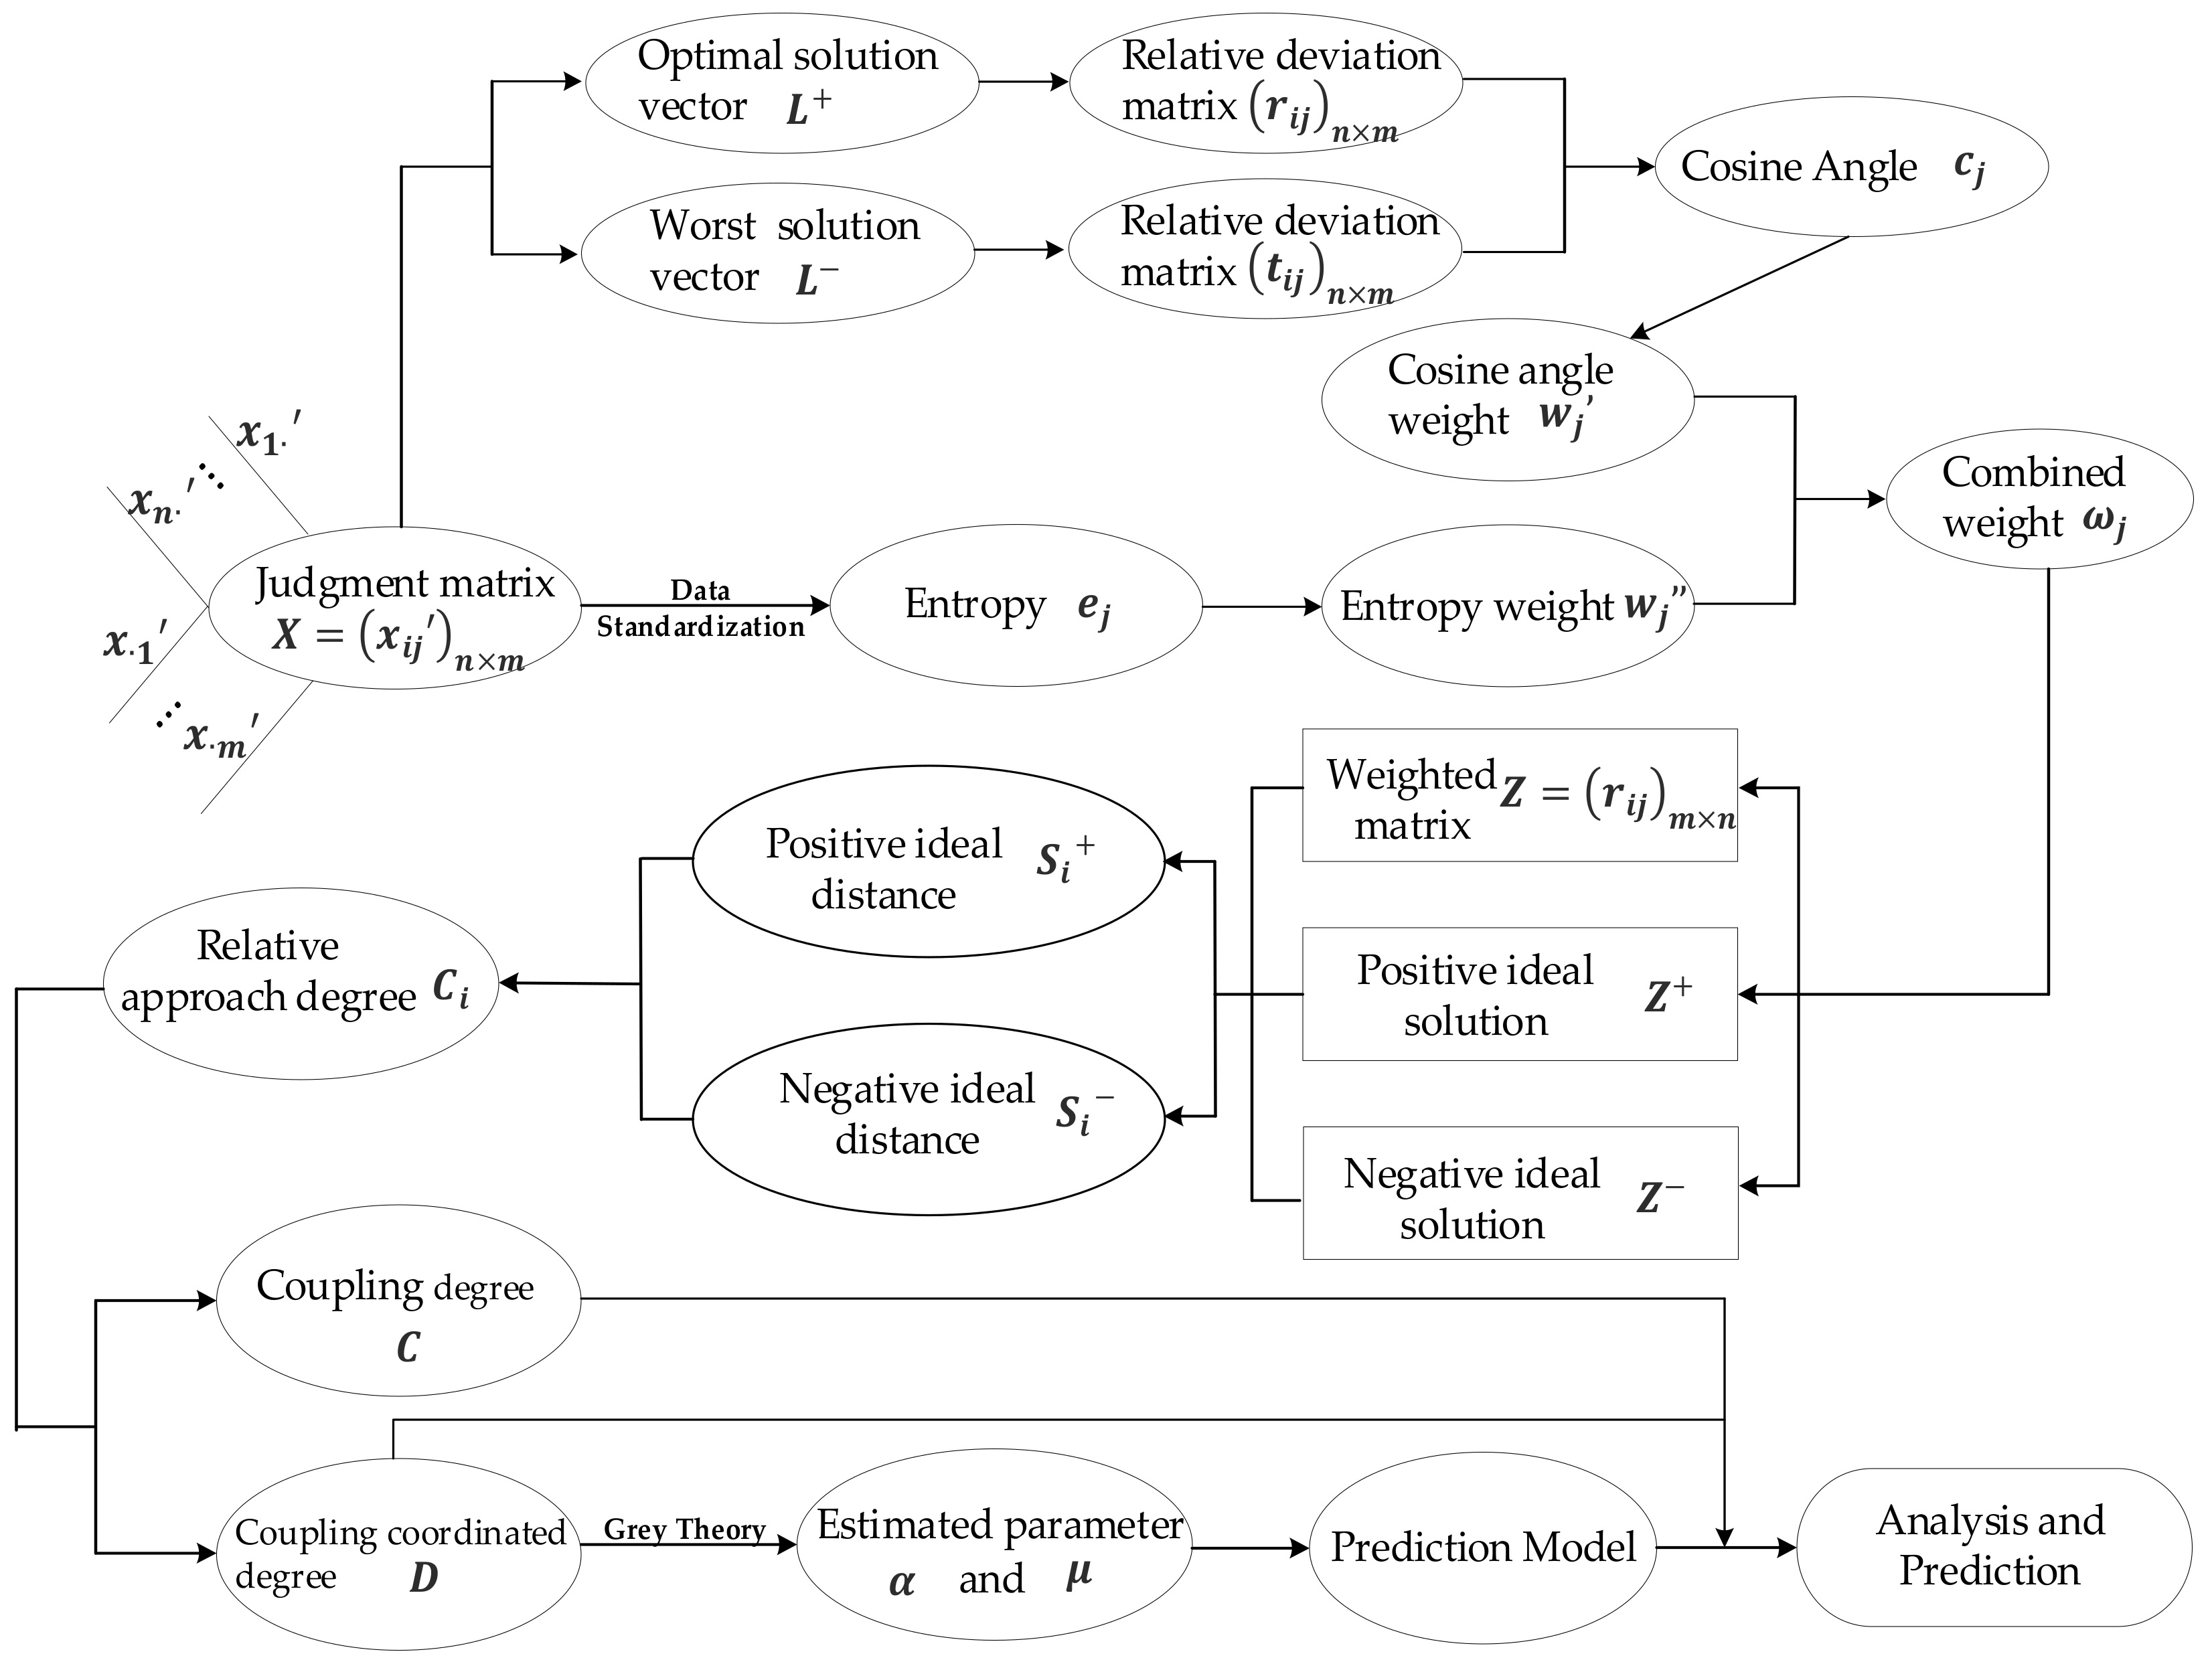
Based on the objective weighting method, TOPSIS method, the coupling coordination theory and grey theory, this paper constructs model for measuring and forecasting the sustainable development capability of tourism, the logic of the measurement and prediction is shown in Figure 2. In this model, the objective weighting method is a comprehensive use of the cosine angle weight and entropy method to give objective weight to each measure index; the TOPSIS method is used to obtain the comprehensive development of the regional tourism sustainable development capacity (comprehensive degree) based on the distance between the weighted normalized index value of each research object (provinces and cities) and the ideal solution; the coupling coordination model is used to measure the coupling and the coordination relationship of the sustainable development of the four subsystems: economy, society, resources, and environment; and the grey GM (1,1) model is used to predict the coordinated development of tourism in the next few years.
In Figure 2, – represent the raw data of the tourism sustainability of each province and city.
4.3. Solving Steps of the Model
According to the measurement model above (Figure 2), the specific analytical steps are as follows.
4.3.1. Determination of the Index Weight
The cosine included angle value, also known as the similarity, can objectively characterize the degree of deviation of each index value distribution, thus better reflecting the relative importance of each index. The entropy method is an objective method to determine the weight according to the variation degree of each index. In order to make the weight of the index more objective and reasonable, the entropy method is introduced to modify the weight obtained by the cosine angle value so as to eliminate the influence of subjective factors to the maximum extent, so that the analysis results are more practical. The steps for determining the weight are as follows:
(1) Determination of the cosine angle weight
The optimal value and the worst value of the evaluation index are obtained based on the index original data , where and represent the positive and negative effect index respectively, n is the number of evaluation objects, and m is the number of indicators.
By computing the relative deviation matrix of each evaluation scheme to the optimal solution vector and to the worst solution vector , the cosine angle and the weight of each index can be determined.
where represents the deviation degree of the absolute difference between and the optimal value relative to the extreme deviation of the index; represents the deviation degree of the absolute difference between and the worst value relative to the extreme deviation of the index; reflects the influence of the deviation between the evaluation object and the optimal solution vector and the worst solution vector on the weight of the evaluation object.
(2) Determination of the entropy weight
This paper relies on the raw data of the measurement index of each province and city to establish the initial measurement matrix . In order to eliminate the difference of the selected indexes in the quantity and size, the collected raw data of indexes need to be standardized to obtain the standardized matrix .
In accordance with the definition of entropy, the entropy value and entropy weight of the jth principal component factor are
In the equation, the original expression of should be . When = 0, is meaningless [23], so the initial expression should be revised to Equation (6).
(3) Determination of the optimal combination weight
According to the principle of minimum information discrimination, the optimal combination weight is determined by Lagrange multiplier method.
4.3.2. Calculation of the Sustainable Development Degree
The Technique for Order Preference by Similarity to an Ideal Solution (“TOPSIS” for short), which is the one from the group of MCDM (multiple-criteria decision-making) methods [45], was first proposed by Hwang and Yoon in 1981 [46]. TOPSIS is usually utilized in definite schemes of system engineering to analyze the objective decision [27]. The core concept: the optimal scheme should be the closest to the positive ideal scheme and the farthest from the negative ideal scheme. This method may sequence several measurable objects by following steps:
- (1)
- Establishing the weighted standardized matrix to determine the positive ideal solution and negative ideal solution .In the equation, is the entropy weight of the jth principal component factor and is the score of the jth principal component of the ith measured object.In the equation, is the positive index of the jth index and is the jth inverse index.
- (2)
- Computing the distance of each province and city to the positive ideal point and to the negative ideal point to obtain the relative approach of each province and city to the ideal objective to demonstrate the sustainable degree of tourism for each province and city.A larger Ci stands for a stronger sustainable tourism capacity of the area and vice versa.
4.3.3. Calculation of the Coupling Coordination Degree for Sustainable Development
From the perspective of systems theory, the sustainable development of regional tourism is a complex system of the economy, society, resources, and environment, which is highly complex, uncertain and multi-leveled. There are multiple correlations between the various elements that form the system, which promote and restrict each other and co-evolve. Coupling refers to two or more systems and motion forms that influence each other through a variety of interactions [23]. In general, the interaction degree of these systems or factors is expressed by the coupling degree. Coordination means that two or more systems or factors work together and are in a harmonious and sustainable relationship.
Referring to the capacity coupling coefficient model in physics, the coupling degree model of multi-system (or element) interaction is generalized as follows:
Since the sustainable development of regional tourism includes four subsystems: the economy, society, resources, and environment, then n = 4 and the degree of system coupling C is calculated as
The coupling degree cannot reflect the level of coordinated development, so the coupling coordination degree is introduced to measure the interaction degree of the coupling coordination between subsystems.
where , , , and are the development level of the tourism economy, society, resources, and environment subsystems respectively; T is the comprehensive development value of the coordinated development of each subsystem. , , , and are undetermined coefficients. In view of the overall strategy of “ecological priority and green development” advocated by the “Outline for the Development Plan of the Yangtze River Economic zone” [47] promulgated by China and the special geographic location of the Yangtze River Basin, and referring to the relevant study [22,36], then .
4.3.4. Prediction of Sustainable Development
The Grey prediction method is an effective method to predict a system with uncertain factors which has the advantages of small sample demand, high prediction accuracy, simple calculation, and convenient inspection [18]. The principle is to identify the different degree of the development trend between the system factors and to generate the original data to find the law of the system, generate a strong regular data sequence, and then to establish the corresponding differential equation model so as to predict the future development trend of things. The calculation steps are as follows:
- (1)
- Assuming that the original time series has n observations and the original sequence is accumulated by the formula to generate a new sequence , the corresponding differential equation of the GM (1,1) model iswhere is the gray number of development and is the gray number of endogenous control.
- (2)
- Assuming that is the estimated parameter vector, then can be obtained by the least square method, where , the cumulative sequence prediction model can be obtained by solving the differential equation.
Generally, when , it can be used for medium and long-term prediction; when , it can be used for short-term predictions [25].
In order to improve the prediction accuracy of the model, the residual error test and the posterior error test are needed. The residual difference and the relative error value q of are calculated by using Equation (19):
Assume that and are the mean and variance of the residual respectively; and are the mean and variance of residual , then the variance ratio and small error probability are obtained. Finally, the grey model needs to be tested for accuracy and the test criteria are shown in Table 4.
5. Results and Discussion
5.1. Analysis for the Comprehensive Sustainable Development Level of Tourism
The comprehensive sustainable development degrees for regional tourism in the Yangtze River economic zone are calculated by the method of weighted TOPSIS (see Table 5).
Overall, the comprehensive sustainable development level of tourism in the 11 provinces and cities in the Yangtze River economic zone from 2006 to 2015 is generally not high, and with the progress of the years, the degree values of the comprehensive development are fluctuant. According to the value of the comprehensive development degree, the provinces and cities in the region can be divided into three categories. The first category (0.5–0.7) is Jiangsu and Zhejiang with the ideal comprehensive sustainable development capacity. The second category (0.4–0.5) includes Shanghai and Sichuan, with a high comprehensive capacity for sustainable development. Among them, the comprehensive evaluation index of Shanghai showed a declining trend. With the ecological environment and tourism economy advantages, Sichuan maintained a steady and high level of comprehensive development. The third category (0.3–0.4) includes Anhui, Jiangxi, Hunan, Hubei, Yunnan, and Chongqing. Their comprehensive sustainable development is at a moderate level and maintains a certain degree of increase. The fourth category (<0.3), including only Guizhou, has long been at a low level of overall sustainable development capacity with a small increase as the year progressed.
In order to visually and clearly compare the development statuses of the tourism economy/society/resources/environment of each province and city in the Yangtze River economic zone, this paper calculates the average value of the development degree of the tourism subsystem of each province and city from 2006 to 2015 and visualizes them (see Figure 3). Compared with other provinces and cities of tourism in various aspects, Shanghai, Jiangsu, and Zhejiang have a high level of tourism development which mainly depends on their geographical advantage in the Yangtze river delta in the east, the coastal zone of foreign trade ports with rich tourism resources, relatively sound economic structure, scientific management of ecological environment and the reasonable improvement thereof. Guizhou is located in the middle and upper reaches of the Yangtze river basin, at a geographical disadvantage by being remotely inland in southwest China, has scarce tourism industry resources, and low social development, which leads to its sustainable tourism development being at a low level for a long time. The differences of other provinces in all aspects of tourism development are not obvious, basically in the middle and low level of development.
5.2. Spatial-Temporal Analysis of Tourism Sustainable Coupling Coordination
The coupling coordination degrees for regional tourism in the Yangtze River economic zone are calculated by the analysis model method (see Table 6), in order to reflect more clearly the trend of the coupling coordination development in terms of time evolution. Based on the data in Table 5, we generate the diagram of the evolution trend as shown in Figure 4. From the point of view of time evolution, the coordination degree of the regional tourism economy/society/resources/environment coupling along the Yangtze River economic zone from 2006 to 2015 is mainly to maintain stability. The rise in fluctuation generally develops in the direction of benign coordination, but there is a relatively downward trend in the individual provinces and regions. Among them, Jiangsu and Zhejiang have maintained a high degree of coupling coordination (0.6–0.8), indicating that the coordination and development of the two provinces can be maintained in a good situation. Shanghai, Hunan, Hubei, and Sichuan have remained barely coordinated or in a nearly unbalanced situation during this decade, which also shows that the sustainable development of tourism in these four provinces has been in a period of transition from the unbalanced to benign in recent years. Anhui and Chongqing have made leaps and bounds in the past decade, and their coupling coordination has risen to a higher level, Specifically, the sustainable development of Anhui’s tourism increased from an approaching imbalance (0.264) in 2006 to a moderate imbalance (0.482) in 2015, achieving two levels of leapfrogging; Chongqing’s development progress is the most obvious, which rose from a high balance (0.092) in 2006 to a slight imbalance (0.328) in 2015, also achieved two levels of leap. Guizhou, which has the lowest coupling coordination degree, is changing its status of high balance gradually after years of development. From 2006 to 2008, the coordination and coordination values of Yunnan declined continuously, but an improvement started in 2009 and dropped again in 2014. There is also a state of development instability in the Jiangxi province. For these two provinces, comprehensive measures are urgently needed to optimize the coordination of the tourism development in all aspects in order to prevent further deterioration.
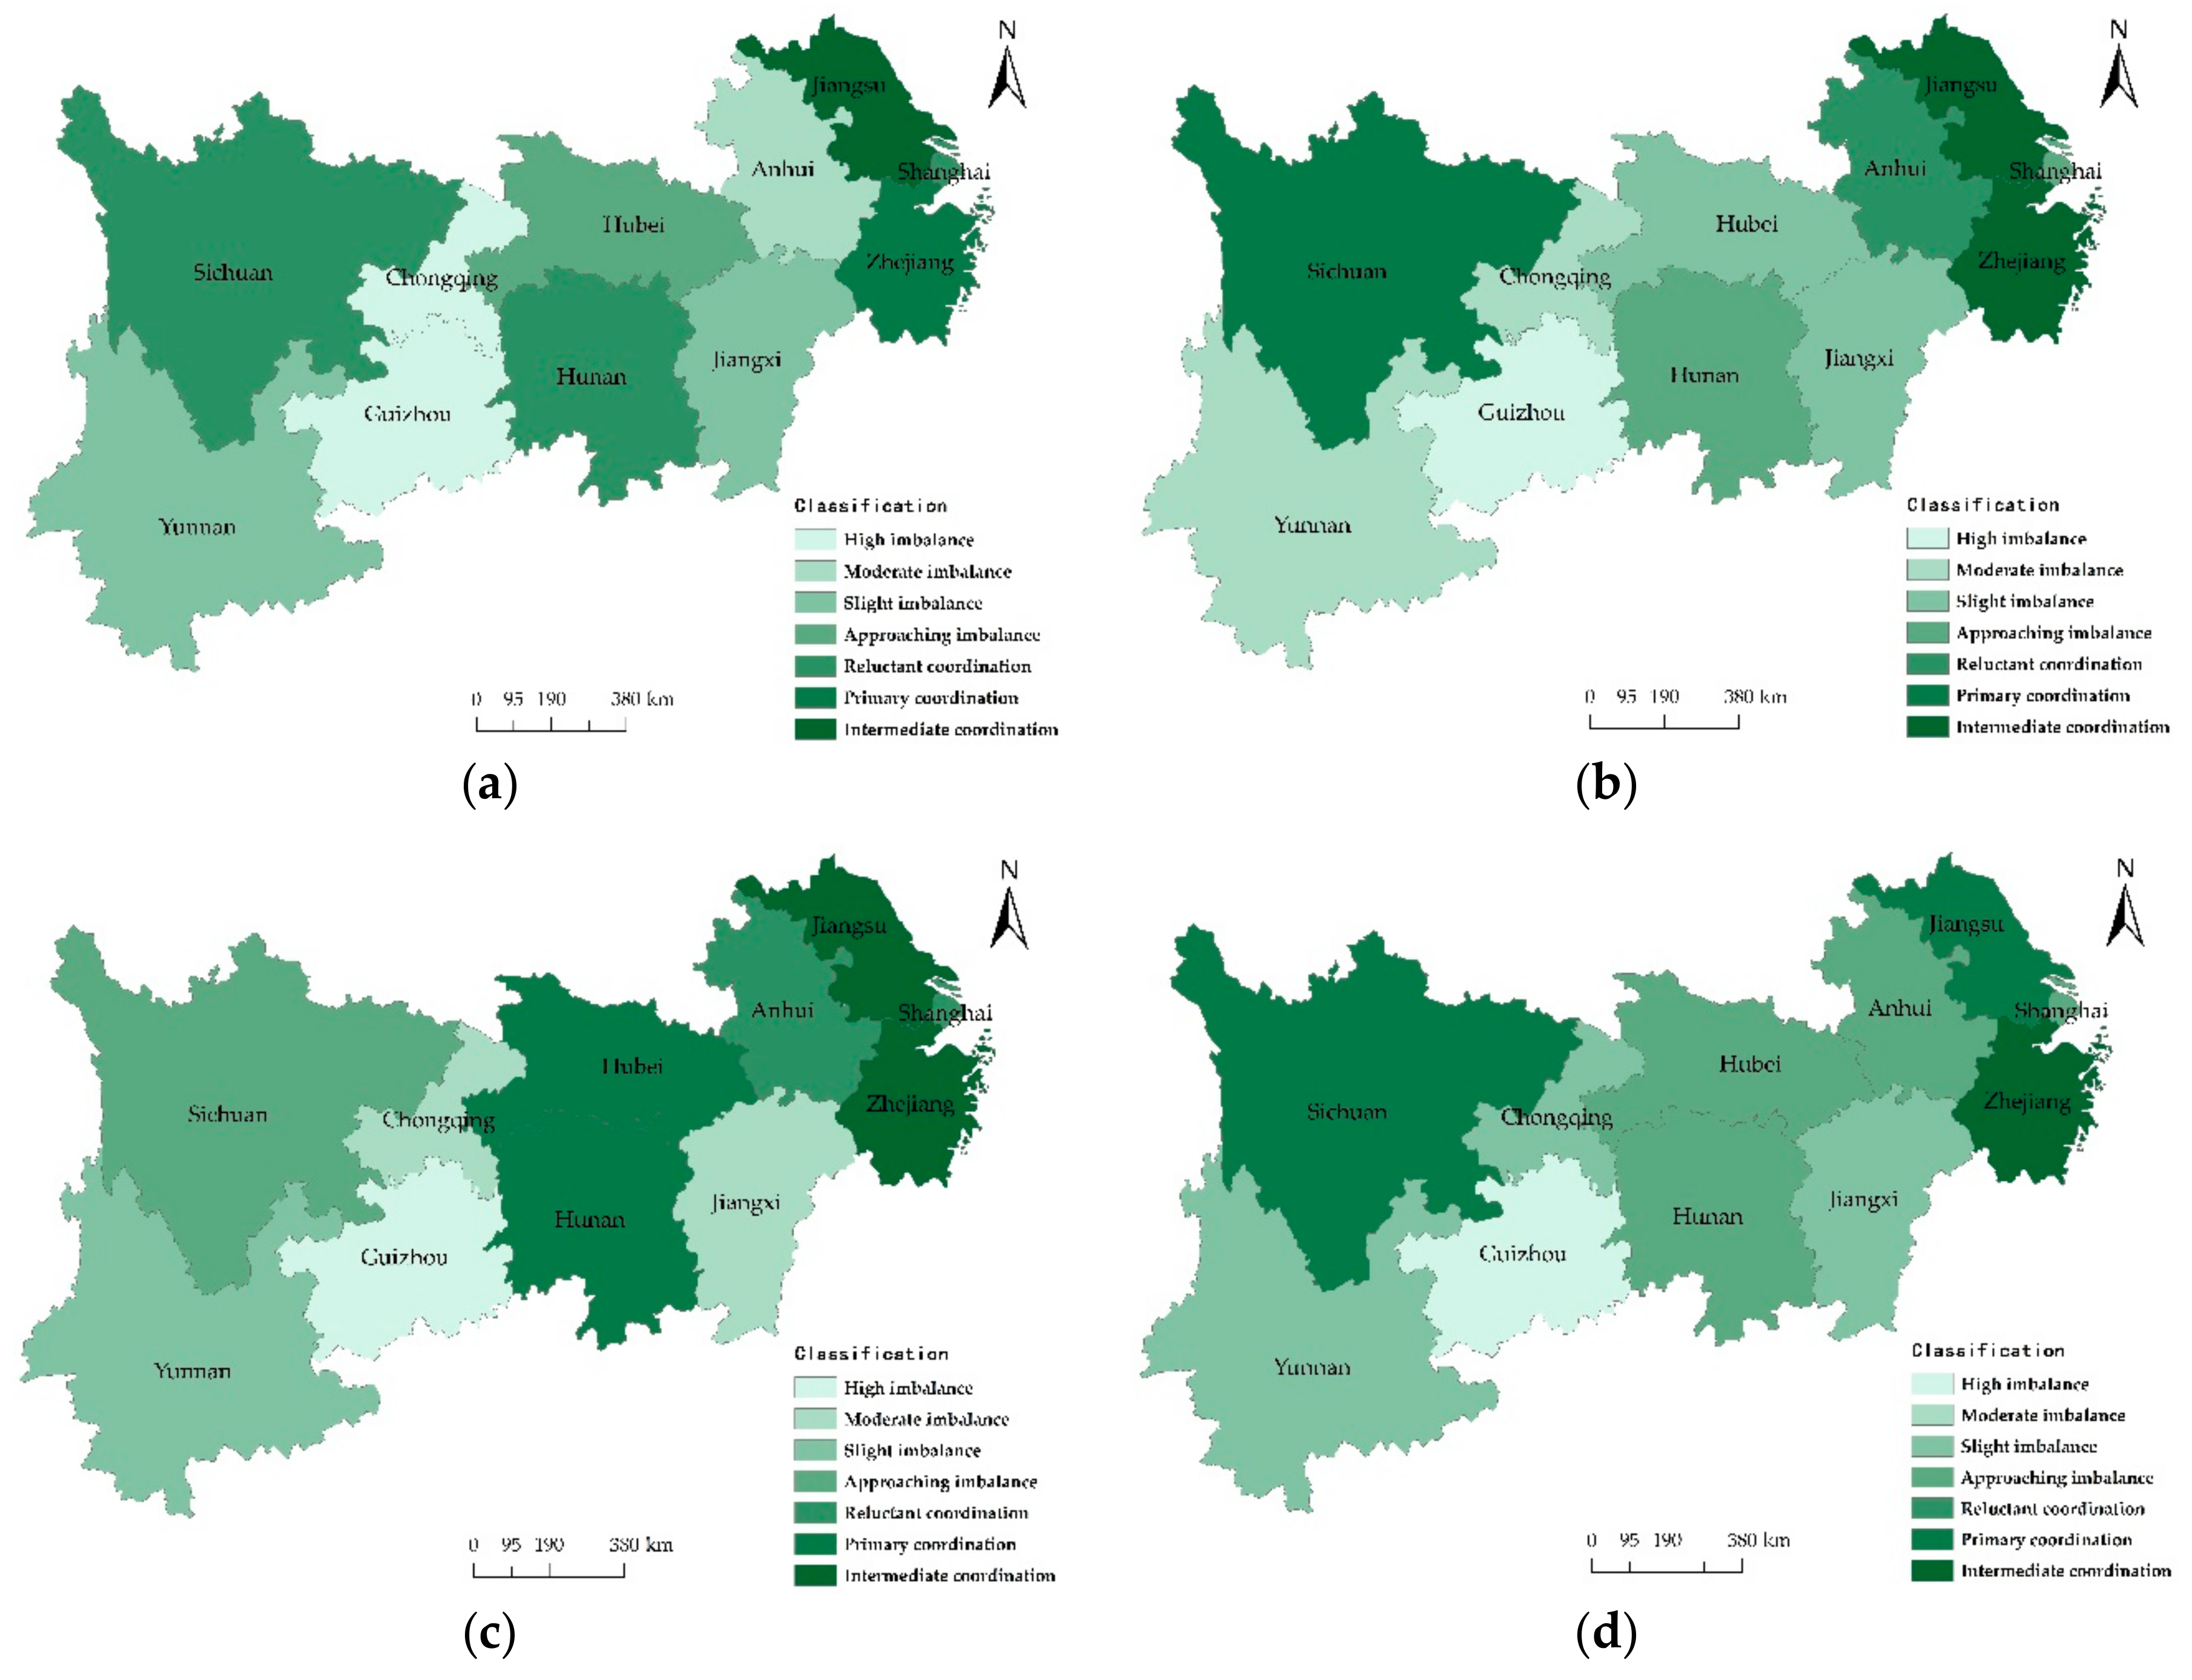
To further analyze the dynamic changes of the coupling coordination degrees of each province in the Yangtze River economic zone, ArcGIS 10.2 (Esri, Redlands, CA, USA) was adopted to visually show the results in 2006 and 2015, shown as Figure 5. The lower reaches of the Yangtze River (Yangtze River Delta) rely on natural geographical advantages (eastern coastal ports), close exchanges with foreign countries, with highly mature pattern of the tourism industry and extensive tourism market. Therefore, the coordinated development of tourism coupling in Zhejiang, Jiangsu, and Shanghai have maintained a high level in the past 10 years (0.4–0.8). The coupled development of the middle and upper reaches of the Yangtze River in the past 10 years has been further improved, but the effect is not obvious. For the middle and upper reaches, in the case of a general low degree of coupling coordination of tourism development, the Sichuan tourism development coupling coordination degree can still maintain a status of reluctant coordination (0.5–0.6), which is closely related to rich tourism resources and high-quality ecological environment, benefits from rational resource development, beautiful natural scenery, and the complete tourism industry chain. Moreover, under the background of concentrated poverty elimination and tourism-oriented poverty elimination of China, Sichuan implements and enforces support policies of the Chinese government to keep the overall sustainability of tourism much higher than that of other areas in middle and upper reaches.
5.3. Prediction of Tourism Sustainable Coupling Coordinated Development
To further grasp the future development trend of sustainable coupling coordination in the tourism of the Yangtze River economic zone, the sustainable coupling coordination degrees of tourism in the 11 provinces and cities in the Yangtze River economic zone from 2006 to 2015 are analyzed through the DPS 7.05 (A statistical analysis software developed in China). Then the GM (1,1) prediction models of the coupling coordination degree of provinces and cities are obtained (as shown in Table 7). In all expressions of the prediction model, the estimated parameter , which indicates that they can be used for medium and long-term prediction. The Small error possibility and Posterior error ratio means that the model can achieve an excellent level of accuracy, fully meeting the requirements of prediction.
As can be seen from Table 7, the sustainable development of the provinces and cities in the Yangtze River economic zone in the next three years (2016–2018) will roughly continue the change characteristics of 2006–2015. In addition to the certain decline of the coupling coordination degrees of Shanghai, Jiangsu, and Hunan, other provinces and cities will show a slight upward trend. Among them, Zhejiang will transition from intermediate coordination (0.7–0.8) to high coordination (0.8–1.0); Chongqing will gradually leap to the status of reluctant coordination (0.5–0.6) in the next three years; Guizhou will gradually get rid of its high imbalance (0–0.2) and upgrade itself to moderate imbalance (0.2–0.3); The coordinated development of tourism coupling in Anhui, Hubei, and Yunnan will also achieve qualitative changes. Overall, the sustainable coupling and coordination development of the Yangtze River economic zone will be improved in the next three years, but the speed of the coupling evolution and coordination development is quite slow. It still takes a long time for the whole region to achieve coordinated development, which requires provinces and cities to break through their own leading restrictive factors in the future developments and to realize the adjustment of economic structure, the governance of ecological environment, and the rational development of the tourism industry.
6. Suggested Countermeasures
Given the different spatial distribution of the sustainable development of tourism in the Yangtze River economic zone and the reality of the low level of sustainable development in the middle and upper reaches of the region, taking the road of sustainable development is an inevitable choice for China, in front of whom there is still a long way to go to achieve this goal. The following countermeasures are proposed in this paper:
- (1)
- For the provinces and cities in the middle and upper reaches where the resources and environment are highly restricted, on the one hand, it is necessary to change the strategy of economic development, pay attention to the quality and connotation of economic development, rely on technological innovation to reduce the dependence of economic development on resources, create a development model of a circular, low carbon economy and green consumption, and then strive to build a resource-saving and environment-friendly society. On the other hand, it is essential to use the advantages of capital and technology for strengthening the ecological restoration and environmental pollution control as well as to constantly strengthen public awareness of the environmental protection and the implementation of an environmental responsibility system.
- (2)
- For the provinces and cities with good ecological endowment and low environmental pollution, on the premise of protecting the existing ecological environment, it is important to promote the optimization and upgrading of the structure of the tourism industry and accelerate the development of the tourism economy. Specific reference can be made to the following measures:
- (a)
- Depth exploration of its own characteristics and differentiation of tourism resources, accurate positioning of the market, and strengthening regional tourism cooperation and then creating a double win situation.
- (b)
- Deepening the reform and innovation of the management system and related policies, the construction of tourist pioneer areas and demonstration areas, and the innovation and cultivation of new growth points of the tourism economy.
- (c)
- Expanding cooperation channels, promoting the cross-border integration of tourism industry and related industries, vigorously develop new tourism modes (such as eco-tourism, rural tourism, low-carbon tourism), strengthening the development of a globalization of tourism and the benign coupling and coordinated development of tourism economy/society/resources/environment.
7. Conclusions and Future Prospects
Based on the tourism statistics of each province in the Yangtze River economic zone from 2006 to 2015, this paper makes an empirical study on the sustainable development of tourism in each province by weighted TOPSIS, coupling coordination model, and grey GM (1,1) model, and draws the following conclusions:
- (1)
- In general, the comprehensive sustainable development level of tourism in the Yangtze River economic zone from 2006 to 2015 is generally not high, and with the progress of the years, the degree of the comprehensive development is fluctuant.
- (2)
- From the point of view of time evolution, the coordination degree of the regional tourism economy/society/resources/environment coupling along the Yangtze River economic zone from 2006 to 2015 is mainly to maintain stability. The rise in fluctuation generally develops in the direction of benign coordination, but there is a relatively downward trend in the individual provinces and regions, and each provinces or cities need to break through the weak links according to its own situation and achieve coordinated development in all aspects.
- (3)
- Overall, the sustainable coupling and coordination development of the Yangtze River economic zone will be improved in the next three years, but the speed of the coupling evolution and coordination development is quite slow. It still takes a long time for the whole region to achieve coordinated development, which requires provinces and cities to take into account all aspects of coordination in the future planning and to realize the adjustment of economic structure, the governance of ecological environment, and the rational development of the tourism industry.
The main contributions of this paper are as follows:
- (1)
- Based on the existing literatures and considering the factors (economic, social, resource, and environment) related to the sustainable development of regional tourism, this paper constructs a comprehensive evaluation index system of sustainable development, which provides a reliable reference for the objective research and comprehensive analysis of the sustainable development of regional tourism.
- (2)
- Based on the theory of system theory, the coupling coordination degree model can objectively assess the coordinated development level of regional tourism in various aspects of tourism during a specific time period and analyze the change trends of coupling coordination degrees in space and time. The results of this model have higher reference value, this paper conducts a quantitative research on the coordination and development of tourism economy/society/resource/environment coupling and coordination in the Yangtze River economic zone by weighted TOPSIS and the coupled coordination model, which breaks through the limitations of previous research on a single province or city and the deficiency of coupling relationship between two subsystems.
- (3)
- The forecast of the sustainable tourism coordination in the future of the economic zone of the Yangtze River Basin by using the gray GM (1,1) model will not only help to understand the coupling coordination development relationship and regional differences in the Yangtze River economic zone, but also provide a decision-making basis for regional economic structure adjustment, ecological environment protection, and tourism industry developments in the future.
There are still some limitations in this study. The core idea of sustainable development is the sustainability, coordination, and fairness of development. This study focuses only on the sustainability and coordination of the sustainable tourism development and lacks research on the fairness of sustainable development, such as the distribution of interests and conflicts with stakeholders (tourism enterprises, destination government management, community residents, tourists). In addition, the regional tourism sustainable development index system is a system of that is multi-leveled, multi-directional, and multi-structured. Due to the limitations of data acquisition, this paper mainly considers indicators (economy, society, resource, and environment) that can be measured, without considering other factors affecting sustainable development (such as institutional and cultural factors). These problems need to be further analyzed and discussed in the future.
Author Contributions
The study was designed by Canmian Liu in collaboration with all co-authors. Data was collected by Ruyun Zhang and Min Wang. The first and final drafts were written by Canmian Liu. The defects of the draft were critiqued by Canmian Liu. The results were analyzed by Canmian Liu. The research and key elements of the models were reviewed by Jing Xu. The writing work of corresponding parts and the major revisions of this paper were completed by Canmian Liu.
Acknowledgments
This research is funded by the National Nature Science Foundation of China (71601134), the 2017 Social science “thirteen five” plan annual projects in Sichuan Province (SC17TJ010), and the Foundation of Sichuan University (skyb201709).
Conflicts of Interest
The authors declare no conflict of interest.
Appendix A

Table A1.
The Sustainable Development Measurement Index System of tourism.
| Index Factors | Unit | Data Source |
|---|---|---|
| C11 a Foreign exchange earnings from international tourism | Million dollars | PSY |
| C12 a Earnings from domestic tourism | 100 million yuan | PSY |
| C13 a Revenue of scenic spots | 100 million yuan | CTSY |
| C14 a Revenue of star hotels | 100 million yuan | CTSY |
| C15 a Revenue of travel agencies | 100 million yuan | CTSY |
| C16 a Average stay of tourists | Day | CTSY |
| C21 b Energy consumption of per ten thousand Yuan GDP | Tons of standard coal/10,000 yuan | PSY |
| C22 b Contribution rate of tourism to GDP | % | PSY |
| C23 b Contribution rate of tourism to the tertiary industry | % | PSY |
| C31 a Employees of travel agencies | Person | CTSY |
| C32 a Employees of star hotels | Person | CTSY |
| C33 a Amount of tourism schools and colleges | School | CTSY |
| C34 a Amount of students at tourism schools and colleges | Person | CTSY |
| C41 a Number of public vehicles under operation | Unit | CSY |
| C42 a Total length under operation | Km | CSY |
| C43 a Passenger turnover | 100 million passenger-km | CSY |
| C51 a Per capita park green area | Square meter | CSY |
| C52 a Area of nature reserves | 10,000 hectares | CSYE |
| C53 a Amount of domestic tourists | 100 million person-times | PSY |
| C54 a Amount of international tourists | 10,000 person-times | PSY |
| C61 a Amount of travel agencies | Unit | CTSY |
| C62 a Amount of star hotels | Unit | CTSY |
| C63 a Average room occupancy rate | % | CTSY |
| C71 a Total emission volume of SO2 | Ton | CSYE |
| C72 a Forest coverage rate | % | CSYE |
| C73 a Green coverage of completed area | % | CSY |
| C81 a Number of industrial waste gas treatment facilities | Set | CSYE |
| C82 b Sewage treatment rate | % | CSYE |
| C83 a Treatment rate of consumption wastes | % | CSY |
| C84 b Ratio of industrial solid wastes utilized | % | CSYE |
Note: a = data for these indicators can be directly obtained; b = data for these indicators need to be calculated; CTSY = “China Tourism Statistical Yearbook, 2007–2016” [38]; CSY = “China Statistical Yearbook, 2007–2016” [39]; CSYE = “China Statistical Yearbook on Environment, 2007–2016” [40]. PSY = data from provincial statistical yearbook (11 provinces or cities).
References
- Ding, L.; Shao, Z.F.; Zhang, H.C.; Xu, C.; Wu, D.W. A Comprehensive Evaluation of Urban Sustainable Development in China Based on the TOPSIS-Entropy Method. Sustainability 2016, 8, 746. [Google Scholar] [CrossRef]
- World Tourism Organization (WTO). Guide for Local Authorities on Developing Sustainable Tourism; World Tourism Organization: Madrid, Spain, 1998. [Google Scholar]
- World Tourism Organization (UNWTO). United Nations Environmental Programme (UNEP). Making Tourism More Sustainable: A Guide for Policy-Makers; World Tourism Organization: Madrid, Spain, 2005. [Google Scholar]
- Tudorache, D.M.; Simon, D.; Frent, C.; Mărioara, M.P. Difficulties and Challenges in Applying the European Tourism Indicators System (ETIS) for Sustainable Tourist Destinations: The Case of Braşov County in the Romanian Carpathians. Sustainability 2017, 9, 1879. [Google Scholar] [CrossRef]
- Torres-Delgado, A.; Saarinen, J. Using indicators to assess sustainable tourism development: A review. Tour. Geogr. 2014, 16, 31–47. [Google Scholar] [CrossRef]
- World Tourism Organization (WTO). Indicators of Sustainable Development for Tourism Destinations: A Guidebook; World Tourism Organization: Madrid, Spain, 2004. [Google Scholar]
- European-Commission-Eurostat. Methodological Work on Measuring the Sustainable Development of Tourism. Part 2: Manual on Sustainable Development Indicators of Tourism [EB/OL]. Available online: http://en.Youscribe.com/catalogue/reports-and-theses/leisure-and-hobbies/travel-guides/methodological-work-on-measuring-the-sustainable-development-of-1281564 (accessed on 26 April 2016).
- Dupeyras, A.; Maccallum, N. Indicators for Measuring Competitiveness in Tourism: A Guidance Document; OECD Publishing: Paris, France, 2013. [Google Scholar]
- Choi, H.C.; Sirakaya, E. Sustainability indicators for managing community tourism. Tour. Manag. 2006, 27, 1274–1289. [Google Scholar] [CrossRef]
- Castellanies, V.; Sala, S. Sustainable performance index for tourism policy development. Tour. Manag. 2010, 31, 871–880. [Google Scholar] [CrossRef]
- Budruk, M.; Philips, R. Quality-of-life Community Indicators for Parks, Recreation and Tourism Management; Springer Netherlands: Berlin, Germany, 2011. [Google Scholar]
- Zhou, Z.H. The Evaluation on Tourism Sustainable Development in Changsha-Zhuzhou-Xiangtan Urban Agglomeration. Chin. Agric. Sci. Bull. 2012, 28, 140–145. [Google Scholar]
- Luo, Y.L. Potential Evaluation on Eco-Tourism Resources and Sustainable Development Strategy in Henan Province. Chin. J. Agric. Resour. Reg. Plan. 2016, 37, 40–47. [Google Scholar]
- Martín, J.M.M.; Fernández, J.A.S.; Martín, J.A.R.; Aguilera, J.D.J. Assessment of the Tourism’s Potential as a Sustainable Development Instrument in Terms of Annual Stability: Application to Spanish Rural Destinations in Process of Consolidation. Sustainability 2017, 9, 1692. [Google Scholar] [CrossRef]
- Liu, J.J.; Nijkamp, P.; Huang, X.X.; Lin, D. Urban livability and tourism development in China: Analysis of sustainable development by means of spatial panel data. Habitat Int. 2017, 68, 99–107. [Google Scholar] [CrossRef]
- Lee, T.H.; Hsieh, H.P. Indicators of sustainable tourism: A case study from a Taiwan’s wetland. Ecol. Indic. 2016, 67, 779–783. [Google Scholar] [CrossRef]
- Ding, L.; Wu, X.G.; Wang, L.H.; Zhang, J.H. A study on the sustainable development evaluation of water tourism. Geogr. Res. 2015, 34, 578–586. [Google Scholar]
- He, H. Analysis and Forecast of Coupling Coordination Development among the Tourism Industry—Regional Economy-Ecological Environment in Hanzhong. J. Anhui Agric. 2017, 45, 165–170. [Google Scholar]
- Hao, J.L.; Lin, S.L.; Wang, L. Spatial-Temporal Pattern Change of Inbound Tourism Economic in Yangtze River Economic Belt: Based on ESDA&GWR. Resour. Environ. Yangtze Basin 2017, 26, 1498–1507. [Google Scholar]
- Hu, Z.P.; Huang, X.X.; Fu, C.; Yu, D.J. The Quantitative Comparison and Evolutionary Analysis on Interactive Coupling among Tourism, Urbanization and Ecological Environment in Poyang Lake Area. Resour. Environ. Yangtze Basin 2015, 24, 2012–2020. [Google Scholar]
- Zhou, C.; Feng, X.G.; Tang, R. Analysis and Forecast of Coupling Coordination Development among the Regional Economy-Ecological Environment-Tourism Industry—A Case Study of Provinces along the Yangtze Economic Zone. Econ. Geogr. 2016, 36, 186–193. [Google Scholar]
- Xiang, L. A Study on the Spatial and Temporal Differentiation of Tourism Industry-Urbanization-Ecological Environment Coordination in Yangtze River Economic Zone. Ecol. Econ. 2017, 33, 115–120. [Google Scholar]
- Zheng, Q.X.; Kuang, Y.Q.; Huang, N.S. Coordinated Development between Urban Tourism Economy and Transport in the Pearl River Delta, China. Sustainability 2016, 8, 1338. [Google Scholar] [CrossRef]
- Li, F.; Wan, N.Q.; Shi, B.L.; Liu, X.M.; Guo, Z.J. The vulnerability measure of tourism industry based on the perspective of “environment-structure” integration: A case study of 31 provinces in mainland China. Geogr. Res. 2014, 33, 569–581. [Google Scholar]
- Zhang, G.H.; Liu, Z.Z.; Wang, X.Y. Analysis and forecast of coupling degree between tourism-oriented development and eco-environment in coastal region of China. Ecol. Environ. Sci. 2013, 22, 792–800. [Google Scholar]
- Fu, Y.X.; Hu, B.; Wang, Y. Research on Spatial-temporal Evolution of Tourism Competitiveness in 31 Provinces of China. Econ. Geogr. 2012, 32, 144–149. [Google Scholar]
- Ding, J.J.; Zhu, Q.H. Study on Spatial-temporal Differences of Development Potential of Regional Tourism Industry in China. Tour. Tribune 2012, 27, 52–61. [Google Scholar]
- Butler, R.W. Sustainable tourism: A state-of-the art review. Tour. Geogr. 2007, 1, 7–25. [Google Scholar] [CrossRef]
- García-Rosell, J.-C.; Mäkinen, J. An integrative framework for sustainability evaluation in tourism: Applying the framework to tourism product development in Finnish Lapland. J. Sustain. Tour. 2013, 21, 394–416. [Google Scholar] [CrossRef]
- Begum, H.; Er, A.C.; Alam, A.S.A.F.; Sahazali, N. Tourist’s Perceptions towards the Role of Stakeholders in Sustainable Tourism. Proc.-Soc. Behav. Sci. 2014, 144, 313–321. [Google Scholar] [CrossRef]
- Lu, D.; Liu, Y.D.; Lai, L.A.; Yang, L. Awe: An Important Emotional Experience in Sustainable Tourism. Sustainability 2017, 9, 2189. [Google Scholar] [CrossRef]
- Qian, J.W.; Shen, H.W.; Law, R. Research in Sustainable Tourism: A Longitudinal Study of Articles between 2008 and 2017. Sustainability 2018, 10, 590. [Google Scholar] [CrossRef]
- Zhang, M. Evaluation of Sustainable Development of Tourist Attractions Based on AHP. Stat. Decis. 2013, 16, 52–54. [Google Scholar]
- Sidali, K.L.; Huber, D.; Schamel, G. Long-Term Sustainable Development of Tourism in South Tyrol: An Analysis of Tourists’ Perception. Sustainability 2017, 9, 1791. [Google Scholar] [CrossRef]
- Zhong, X.; Liu, Y.H. Coupled Coordination Degree of Tourism-Economy-Ecological System in Guangdong Province. Trop. Geogr. 2012, 32, 568–574. [Google Scholar]
- Li, Y.Z.; Xu, K.; Wang, K. Analysis of Tourism-Economy-Environment Coupling and Coordination in Shandong Province. Areal Res. Dev. 2016, 35, 99–103, 109. [Google Scholar]
- Mónica, G.M.; Tomás, G.N.; Silvia, A.D. A combined ANP-Delphi approach to evaluate sustainable tourism. Environ. Impact Assess. Rev. 2012, 34, 41–50. [Google Scholar]
- Liu, X.H.; Ji, G.; Sun, Y.H. Comprehensive Evaluation and Research on County Economic Development Differences in Contiguous Destitute Areas—Exemplified by Western Areas of Hunan Province. Econ. Geogr. 2013, 33, 35–39. [Google Scholar]
- National Tourism Administration of the People’s Republic of China. China Tourism Statistical Yearbook; China Tourism Press: Beijing, China, 2007–2016.
- State Statistics Bureau. China Statistical Yearbook; China Statistics Press: Beijing, China, 2007–2016.
- State Statistics Bureau. China Statistical Yearbook on Environment; China Statistics Press: Beijing, China, 2007–2016.
- Lozano-Oyola, M.; Blancas, F.J.; González, M. Sustainable tourism indicators as planning tools in cultural destinations. Ecol. Indic. 2012, 18, 659–675. [Google Scholar] [CrossRef]
- Zhou, F.X. Evaluation of Sustainable Utilization of Ecotourism Resources: A Case Study of Hunan Province. Stat. Decis. 2014, 9, 68–71. [Google Scholar]
- Du, Y. The Measurement and Evaluation of the Tourism Industry Development Potential-As an Example of Hunan Province. Econ. Geogr. 2014, 34, 176–181. [Google Scholar]
- Mardani, A.; Jusoh, A.; Zavadskas, E.K.; Khalifah, Z.; Nor, K.M. Application of multiple-criteria decision-making techniques and approaches to evaluating of service quality: A systematic review of the literature. J. Bus. Econ. Manag. 2015, 16, 1034–1068. [Google Scholar] [CrossRef]
- Hwang, C.L.; Yoon, K. Multiple Attribute Decision Making; Springer: Berlin/Heidelberg, Germany, 1981. [Google Scholar]
- Ecological Environmental Protection Planning in the Economic Belt of the Yangtze River. Ministry of Environmental Protection of the People’s Republic of China. Available online: http://www.zhb.gov.cn/gkml/hbb/qt/201707/t20170718_418074.htm (accessed on 5 April 2018).
Figure 1.
The location of the Yangtze River Economic Zone, China.

Figure 2.
The logic map of the model.

Figure 3.
The comparison of the average development degree of the regional tourism economy/social/ resource/environment from 2006 to 2015.
Figure 3.
The comparison of the average development degree of the regional tourism economy/social/ resource/environment from 2006 to 2015.

Figure 4.
The coupling coordination development trend of regional tourism.

Figure 5.
The spatiotemporal variation of coupling coordination between the sustainable development of tourism in the Yangtze River economic zone (2006–2015). (a) 2006; (b) 2009; (c) 2012; (d) 2015.
Figure 5.
The spatiotemporal variation of coupling coordination between the sustainable development of tourism in the Yangtze River economic zone (2006–2015). (a) 2006; (b) 2009; (c) 2012; (d) 2015.

Table 1.
The studies of tourism sustainable development at different scales.
| Study Scale | Literature |
|---|---|
| Rural Community | Choi et al. [9], Budruk et al. [11], Martín et al. [14] |
| Local/Urban | Zhou et al. [12], Luo et al. [13], Liu et al. [15], Lee et al. [16], Ding et al. [17], He et al. [18] |
| Regional | Hao et al. [19], Hu et al. [20], Zhou et al. [21], Xiang et al. [22], Zheng et al. [23] |
| National | Li et al. [24], Zhang et al. [25], Fu et al. [26], Ding et al. [27] |
| International | Tudorache et al. [4], WTO [6], EU [7], Dupeyras et al. [8] |
Table 2.
The Sustainable Development Measurement Index System of Tourism (TSI).
| Object Layer | Rule Layer | Index Layer | Index Factor Layer | References |
|---|---|---|---|---|
| Sustainable Capacity of Regional Tourism | Economic development (B1) | Economic benefits (C1) | C11 Foreign exchange earnings from international tourism | [18,20,21,22,25,26,27,35,36,43,44] |
| C12 Earnings from domestic tourism | [18,20,21,22,26,27,36,44] | |||
| C13 Revenue of scenic spots | [21] *, [22] * | |||
| C14 Revenue of star hotels | [12] *, [21] *, [25], [36] *, [42] * | |||
| C15 Revenue of travel agencies | [21] *, [22] *, [25], | |||
| C16 Average stay of tourists | [8,18,31,43] | |||
| Economic impact (C2) | C21 Energy consumption per ten thousand Yuan GDP | [22] | ||
| C22 Contribution rate of tourism to GDP | [18,20,33] | |||
| C23 Contribution rate of tourism to the tertiary industry | [20,36] | |||
| Social impact (B2) | Human support (C3) | C31 Employees of travel agencies | [21] *, [26], [42] * | |
| C32 Employees of star hotels | [26] *, [36] *, [43] * | |||
| C33 Amount of tourism schools and colleges | [21] | |||
| C34 Amount of students at tourism schools and colleges | [21,22,25,27,44] | |||
| Accessibility (C4) | C41 Number of public vehicles under operation | [12] *, [33] *, [43], [45] * | ||
| C42 Total length under operation | [12] *, [27] *, [33] *, [43], [44] * | |||
| C43 Passenger turnover | [42] | |||
| Resource reserve (B3) | Market size (C5) | C51 Per capita park green area | [21,22,35,36,43] | |
| C52 Area of nature reserves | [21] | |||
| C53 Amount of domestic tourists | [18,20,21,22,25,26,27,35,36,44], [42] * | |||
| C54 Amount of international tourists | [18,20,21,22,25,26,27,35,36,43,44], [42] *, | |||
| Reception capacity (C6) | C61 Amount of travel agencies | [18,21,22,25,26,27,35,44] | ||
| C62 Amount of star hotels | [18,21,22,25,26,27,35,44] | |||
| C63 Average room occupancy rate | [12] *, [26] | |||
| Ecological environment (B4) | Environmental Status (C7) | C71 Total emission volume of SO2 | [12,18,36], [35] * | |
| C72 Forest coverage rate | [11,20,22] | |||
| C73 Green coverage of completed area | [18,20,35] | |||
| Ecological Management (C8) | C81 Number of industrial waste gas treatment facilities | [21] *, [22] * | ||
| C82 Sewage treatment rate | [12,18,20,21,22,36,42] | |||
| C83 Treatment rate of consumption wastes | [12,18,21,36] | |||
| C84 Ratio of industrial solid wastes utilized | [12,18,20,21,22,36,42] |
Note: * represents a similar indicator.
Table 3.
The discriminating standard of the coupling coordination degree.
| Range | Scoring Standard | Classification |
|---|---|---|
| Coordinated development (acceptable) | High coordination | |
| Intermediate coordination | ||
| Primary coordination | ||
| Transitional development | Reluctant coordination | |
| Approaching imbalance | ||
| Imbalanced development (unacceptable) | Slight imbalance | |
| Moderate imbalance | ||
| High imbalance |
Table 4.
The accuracy test grade of the Grey forecasting model.
| Accuracy Grade | Small Error Possibility P | Posterior Error Ratio C |
|---|---|---|
| Good | 0.95 | 0.35 |
| Qualified | 0.80 | 0.50 |
| Barely | 0.70 | 0.65 |
| Unqualified | 0.70 | 0.65 |
Table 5.
The comprehensive sustainable development degrees of regional tourism.
| Region | 2006 | 2007 | 2008 | 2009 | 2010 | 2011 | 2012 | 2013 | 2014 | 2015 |
|---|---|---|---|---|---|---|---|---|---|---|
| Shanghai | 0.545 | 0.507 | 0.493 | 0.472 | 0.484 | 0.434 | 0.444 | 0.415 | 0.439 | 0.436 |
| Jiangsu | 0.640 | 0.640 | 0.611 | 0.620 | 0.586 | 0.598 | 0.587 | 0.586 | 0.597 | 0.631 |
| Zhejiang | 0.623 | 0.603 | 0.636 | 0.636 | 0.663 | 0.650 | 0.632 | 0.645 | 0.650 | 0.665 |
| Anhui | 0.296 | 0.355 | 0.367 | 0.393 | 0.390 | 0.393 | 0.422 | 0.427 | 0.428 | 0.456 |
| Jiangxi | 0.299 | 0.309 | 0.382 | 0.385 | 0.387 | 0.337 | 0.348 | 0.354 | 0.340 | 0.369 |
| Hunan | 0.359 | 0.354 | 0.382 | 0.368 | 0.383 | 0.381 | 0.384 | 0.390 | 0.396 | 0.432 |
| Hubei | 0.340 | 0.338 | 0.366 | 0.350 | 0.369 | 0.343 | 0.346 | 0.372 | 0.377 | 0.388 |
| Chongqing | 0.264 | 0.316 | 0.298 | 0.341 | 0.385 | 0.379 | 0.387 | 0.410 | 0.388 | 0.402 |
| Sichuan | 0.467 | 0.479 | 0.439 | 0.464 | 0.435 | 0.452 | 0.464 | 0.448 | 0.428 | 0.443 |
| Yunnan | 0.373 | 0.366 | 0.345 | 0.398 | 0.388 | 0.370 | 0.396 | 0.419 | 0.391 | 0.414 |
| Guizhou | 0.270 | 0.237 | 0.252 | 0.241 | 0.274 | 0.277 | 0.302 | 0.284 | 0.299 | 0.295 |
Table 6.
The coupling coordination degrees of regional tourism from 2006 to 2015.
| Region | 2006 | 2007 | 2008 | 2009 | 2010 | 2011 | 2012 | 2013 | 2014 | 2015 |
|---|---|---|---|---|---|---|---|---|---|---|
| Shanghai | 0.515 | 0.474 | 0.458 | 0.453 | 0.533 | 0.434 | 0.440 | 0.414 | 0.416 | 0.450 |
| Jiangsu | 0.790 | 0.794 | 0.774 | 0.740 | 0.654 | 0.598 | 0.699 | 0.654 | 0.522 | 0.678 |
| Zhejiang | 0.674 | 0.639 | 0.675 | 0.666 | 0.773 | 0.650 | 0.723 | 0.718 | 0.730 | 0.777 |
| Anhui | 0.264 | 0.287 | 0.244 | 0.482 | 0.523 | 0.393 | 0.447 | 0.421 | 0.417 | 0.482 |
| Jiangxi | 0.321 | 0.205 | 0.315 | 0.337 | 0.326 | 0.337 | 0.172 | 0.191 | 0.247 | 0.331 |
| Hunan | 0.509 | 0.529 | 0.574 | 0.454 | 0.445 | 0.381 | 0.543 | 0.407 | 0.457 | 0.440 |
| Hubei | 0.416 | 0.403 | 0.465 | 0.366 | 0.528 | 0.343 | 0.514 | 0.438 | 0.511 | 0.454 |
| Chongqing | 0.092 | 0.042 | 0.123 | 0.128 | 0.209 | 0.379 | 0.249 | 0.346 | 0.324 | 0.328 |
| Sichuan | 0.567 | 0.610 | 0.472 | 0.561 | 0.386 | 0.452 | 0.408 | 0.380 | 0.435 | 0.610 |
| Yunnan | 0.372 | 0.252 | 0.147 | 0.095 | 0.290 | 0.370 | 0.350 | 0.505 | 0.491 | 0.337 |
| Guizhou | 0.027 | 0.023 | 0.036 | 0.029 | 0.048 | 0.277 | 0.045 | 0.121 | 0.154 | 0.176 |
Table 7.
Forecast of the tourism coupling coordination degrees in the Yangtze River economic zone.
| Region | C | P | Predictive Model Expression | Forecast Year | ||||
|---|---|---|---|---|---|---|---|---|
| 2016 | 2017 | 2018 | ||||||
| Shanghai | 0.159111 | 0.072281 | 0.4973 | 0.8889 | 0.4275 | 0.4274 | 0.4285 | |
| Jiangsu | 0.026459 | 0.027229 | 0.2222 | 1.0000 | 0.5918 | 0.5905 | 0.5925 | |
| Zhejiang | 0.188072 | 0.102964 | 0.5084 | 0.8889 | 0.7757 | 0.8014 | 0.8295 | |
| Anhui | 0.087739 | 0.071079 | 0.2393 | 1.0000 | 0.4773 | 0.5112 | 0.5485 | |
| Jiangxi | 0.158659 | 0.314587 | 0.2270 | 1.0000 | 0.2250 | 0.2615 | 0.3061 | |
| Hunan | –0.014283 | 0.043328 | 0.5526 | 0.7778 | 0.3592 | 0.3422 | 0.3263 | |
| Hubei | –0.095911 | 0.005496 | 0.1040 | 1.0000 | 0.4876 | 0.4963 | 0.5051 | |
| Chongqing | 0.009501 | 0.055262 | 0.4225 | 1.0000 | 0.3388 | 0.4193 | 0.5136 | |
| Sichuan | 0.094849 | 0.204398 | 0.6250 | 0.7778 | 0.3978 | 0.4235 | 0.4582 | |
| Yunnan | 0.194595 | 0.307578 | 0.5482 | 0.7778 | 0.4906 | 0.5622 | 0.6441 | |
| Guizhou | 0.120803 | 0.088441 | 0.3325 | 1.0000 | 0.1370 | 0.1759 | 0.2232 | |
© 2018 by the authors. Licensee MDPI, Basel, Switzerland. This article is an open access article distributed under the terms and conditions of the Creative Commons Attribution (CC BY) license (http://creativecommons.org/licenses/by/4.0/).
Share and Cite
MDPI and ACS Style
Liu, C.; Zhang, R.; Wang, M.; Xu, J. Measurement and Prediction of Regional Tourism Sustainability: An Analysis of the Yangtze River Economic Zone, China. Sustainability 2018, 10, 1321. https://doi.org/10.3390/su10051321
AMA Style
Liu C, Zhang R, Wang M, Xu J. Measurement and Prediction of Regional Tourism Sustainability: An Analysis of the Yangtze River Economic Zone, China. Sustainability. 2018; 10(5):1321. https://doi.org/10.3390/su10051321
Chicago/Turabian StyleLiu, Canmian, Ruyun Zhang, Min Wang, and Jing Xu. 2018. "Measurement and Prediction of Regional Tourism Sustainability: An Analysis of the Yangtze River Economic Zone, China" Sustainability 10, no. 5: 1321. https://doi.org/10.3390/su10051321
Note that from the first issue of 2016, this journal uses article numbers instead of page numbers. See further details here.