1. Introduction
Resource-based cities are cities where the leading industries are mainly involved in exploiting and processing natural resources such as minerals, oil, and forests. Since the main function includes exploiting and processing resources and producing basic raw materials, an obvious dependence on resource-based industries is the most notable feature of resource-based cities, especially in China, as there is a strong orientation toward industrial policy. Therefore, the proportion of secondary industries is generally between 50% and 90% of the economic composition [
1], revealing potential environmental pollution, which is contrary to sustainable development. According to the National Sustainable Development Plan of Resource-based Cities (2013–2020), there are 262 resource cities in China. Among them, 126 are prefecture-level cities and account for 43.6% of all prefecture cities in China. While 65.65% of these cities have reached a period of development and maturity, only 8.78% have completed their transformation [
2]. Therefore, to achieve overall sustainable development and enhance the value creation capacity of all aspects, such as economy, society, and environment, China must focus on the resource-based cities that have yet to complete their transformation; that is, they still rely on resources to ensure the full realization of their industrial value chain transformation. As China’s economy is driven by the “two-wheel drive” between the government and the market, industrial policy will have an important impact on the transformation of resource-based cities through the rapid construction of an innovation system [
3]. This paper mainly discusses the characteristics and functions of the optimization path, that is, the combination of value links and the configuration of an industrial value chain under different industrial policies.
Currently, 53.82% of China’s resource-based cities have entered a stage of maturity, while 25.57% have entered a stage of recession, facing the dilemma of resource exhaustion [
4]. Backward infrastructure, poor social services, population loss [
5], and deterioration of the ecological environment are also main problems. All of these can be summed up as urban entropy, which is the phenomenon to be detected and prevented in order to achieve urban sustainability [
6]. Thus, there is an insufficient capacity of sustainable development and limited ability of social and environmental value creation. These problems may be due to lack of exports [
7], driving out of human resources [
8], reduced investment in education, and more powerful rent-seeking [
9] caused by the resource curse. However, recent studies have shown that the resource curse is not obvious in emerging resource-based cities [
10], as resource-based industries can drive other industries to create employment and push education development to make up for the lack of human resources [
11]. That is to say, the optimal allocation of the industrial value chain through reasonable industrial policy can promote the sustainable development of resource-based cities. Nevertheless, there are some differences between industrial policies across different periods and regions [
12,
13,
14,
15]. However, from the perspective of the value chain, the purpose of these policies is to improve the value creation capacity of the three aspects of economy, society, and environment by improving the local industry value chain to achieve sustainable development.
The core idea of value chain theory is to gradually form value that customers want or need by creating value in a series of product value activities under the value chain analysis [
16,
17,
18]. In fact, outside of the enterprise, an enterprise that bears social responsibility well usually has better long-term operation [
19,
20]. Therefore, creating more social value, thus promoting the development of local clusters [
21] and integrating environmental management strategies into all aspects of the value chain [
22], is beneficial to value chain analysis and value creation. In addition, the value chain can also be used to analyze environmental policy and resource allocation [
23]. To sum up, the theory and idea of value chain were feasible for this comparative study.
Value chain theory has been widely applied in enterprise value, industrial value, and the ecological economy in recent years. The scope of the related research usually refers to the deconstruction of the value chain and the analysis of various industries and their production processes. The organic cotton [
24], natural gas [
25], iron and steel [
26], bio-coal [
27], chestnut [
28], cellulose ethanol [
29], and forest [
30] industries were included in the scope. In general, their research contents refer to an analysis of the value chain structure and value added process, key factors that influence the addition of value and proposal of policy recommendations. For example, the value chain analysis of Chinese biomass power generation has been carried out to explore its potential uses and the main problems to be faced [
31]. Jaligot et al. clarified the value chain structure, main influencing factors, and value added process of informal links in the process of resource recycling [
32]. In addition, analysis of a value chain comparison [
33] and value chain analysis of a cooperative research and development (R & D) model of small and medium-sized enterprises [
34] have also been carried out.
Regarding the research method, in general, qualitative analysis sets up value chain models based on theoretical analysis. According to the different areas of research, the structure of value chain models is also different. For example, some research has divided the value chain of industries into upstream, middle, and downstream [
24], while others have deconstructed it according to the product life cycle [
25]. The value chain operation reference (VCOR) model is also a practical reference for the process of building a value chain model. It analyzes value chains through the strategic, tactical, and operational levels [
35]. The system dynamics model has also been used to show the related factors and mechanism of action of the value chain [
32]. In quantitative research, the most basic and universal method is to calculate value and value increments in every link of the value chain [
24,
25]. Based on these calculations, some studies have applied more targeted or more accurate calculations or evaluation methods, such as break-even analysis, sensitivity analysis [
26], and evaluation of environmental value by adding carbon footprint [
28]. Furthermore, the integer programming model has been applied to solve the forest value chain integration strategy [
30], while material flow analysis has been applied to clarify the main value substances and the transfer process of the iron ore value chain [
26]. In summary, value chain theory has been widely applied and its theoretical model has diversified. All of this can be combined for research questions to innovate and adjust the classical value chain model and select appropriate research methods to carry out empirical research.
Therefore, value chain analysis can be carried out to establish a comprehensive value chain model considering the economic, social, and environmental value produced by industries. Then, quantification and evaluation can be carried out to provide references for the optimization model of value chain in China’s resource-based cities.
2. Materials and Methods
We established the theoretical model according to the strategies and status of China’s resource-based cities. Then, we conducted an analysis of each optimization path. Finally, we proposed an empirical method, that is, grey relational analysis and the corresponding evaluation index system.
2.1. Theoretical Models
The key to the transformation of China’s resource-based cities is to promote sustainable development of the local economy and the living standards of local residents, thus increasing social value. Furthermore, ecological environmental protection, that is, creating environmental value, must also be considered. Therefore, the relevant decision-making requires the proper management of ecological and land use through project priority setting [
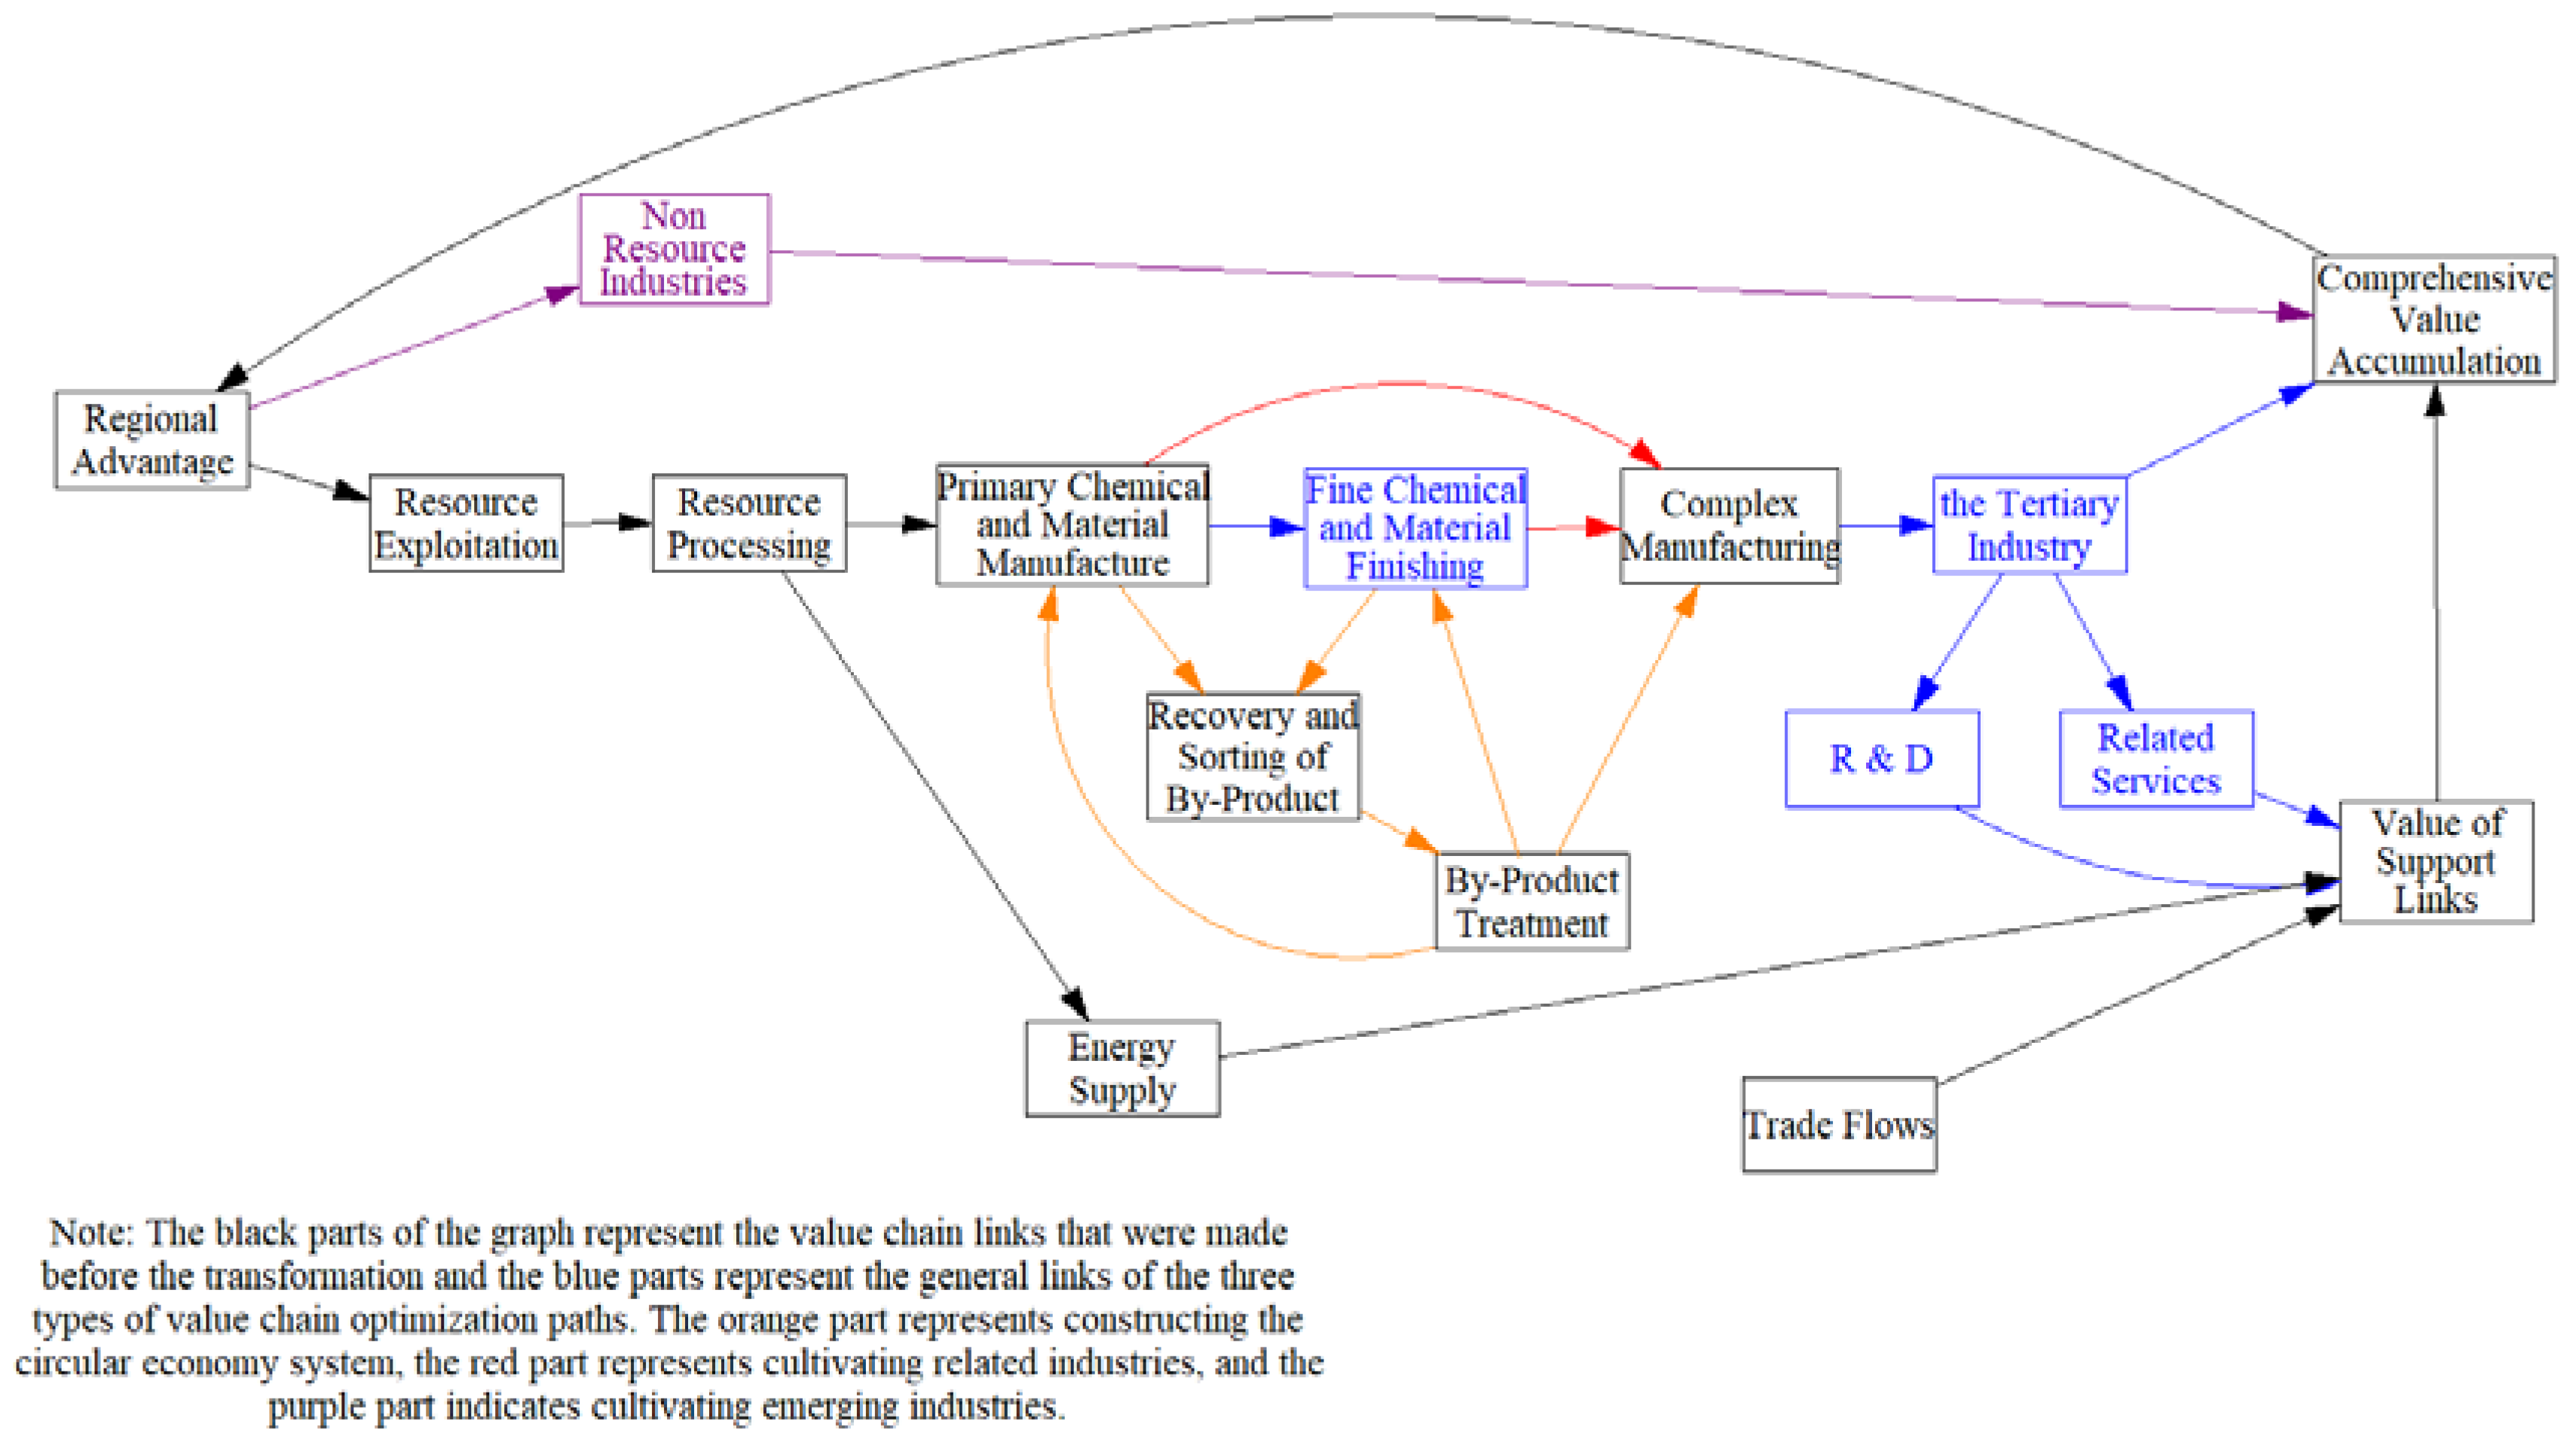
36]. In order to balance the aspects of economic, social, and environmental value, China’s resource-based cities generally optimize the industrial value chain structure by adjusting industrial structures. This process includes horizontal and vertical extension of the value chain as well as strengthening coordination between various links of the chain, reducing redundant links, and enhancing the value creation capacity of the whole chain. The above process of value chain adjustment and allocation can be divided into three main optimization paths: constructing a circular economy system, cultivating related industries, and cultivating emerging industries. Vensim (Ventana Systems, Inc., Massachusetts, MA, USA) software was used to establish the value chain configuration model of China’s resource-based cities, as shown in
Figure 1.
Constructing a circular economy system in China’s resource-based cities is generally limited to strengthening the material cycle between local leading industries and reducing the loss of material and energy. A closed loop cycle in the whole regional value chain cannot yet be reached. Therefore, a circular economy system is generally constructed by adding supporting links such as byproduct recovery, sorting, and treatment into the process of chemical and material manufacturing with different precision. For instance, enterprises that are capable of processing byproducts can be added and intermediary agencies and information platforms can be built. Thus, waste can be reduced and the value creation capacity of the value chain can be enhanced, while improving employment and pollution. On the one hand, cultivating related industries relies on extending the value chain, which is rooted in the market demand caused by existing industries. On the other hand, cities actively undertake regional industrial transfer, that is, achieve expansion and transition of the value chain based on local endowments, and gradually achieve the high end of the value chain in the process of leading industry transition. For example, relying on resource exploitation and the development of equipment manufacturing, they can then gradually turn to non–resource-based high-end equipment manufacturing. The most significant difference between cultivating related industries and cultivating emerging industries is that emerging industries are new, based on local endowments such as tourism, as they are not associated with local industries. This path aims to realize the overall replacement of value chain links and finally transform cities into non–resource-based cities and achieve sustainable development.
Adopting three types of value chain optimization paths simultaneously can obviously guarantee comprehensiveness of the transformation. However, limited by resource allocation constraints, different resource-based cities have a bias toward the value chain optimization path, thus their transformation effect should be different. Characteristics of all kinds of value chain optimization paths can be found, and a powerful reference for the transformation of resource-based cities can be presented by evaluating and comparing different resource-based cities.
2.2. Evaluation Methods
Since the characteristics and configuration methods of the three types of value chain optimization path have been clarified, an evaluation of the value creation capacity of the economy, society, and environment should be carried out. After comparing the results, the characteristics of the three types of optimization path were identified. Furthermore, by observing the relation of value creation and the comprehensive comparative advantage of industries, the relationship between the source of the comparative advantage and its value creation capacity may be found.
The evaluation methods of urban ecology and sustainable development of cities mainly include input-output analysis, life cycle analysis, ecological footprint analysis, cost-benefit analysis, etc. [
37]. However, most of these evaluation methods are usually conducted on a certain aspect of the environment or economy; comprehensive evaluation that takes the economy, society, and environment into account is limited. For this research, a more advantageous optimization model actually had better overall evaluation results under the various evaluation indicators. That is to say, if the optimal evaluation value is selected to form a reference vector under each index, the distance between the evaluation vector of the most advantageous and the reference vector will be the smallest. Grey relational analysis is the only evaluation method in line with this idea. The basic idea of grey relational analysis is to determine the connections between different sequences according to the geometric shape of the sequence curve. By transforming the observed values of the discrete behavior of the system factors into piecewise continuous broken lines through linear interpolation, the model of measuring relational degree can be constructed according to the geometric features based on the broken lines [
38]. Grey relational analysis was initially proposed by Deng Julong [
39], and it can handle both incomplete and imprecise information, especially in situations where there is insufficient data and the sample distribution pattern is unknown [
40]. In recent years, grey relational analysis has been widely used in various fields of evaluation, such as corporate social responsibility of airlines [
41], financial performance of shipping companies [
42], green supply chain management [
43], and so on. Related research has shown that this evaluation method is scientific and has wide applicability to the evaluation problem. The calculation steps are as follows.
2.2.1. Data Normalization
Assuming that there are m evaluation objects and n evaluation indicators, the original data matrix will be . In order to make various indicators of different properties comparable, it is necessary to normalize the original data to make it dimensionless. Set normal matrix as and use the min-max normalization method
For negative indicators, the smaller, the better. Therefore, the formula for the standardization of this type of indicator is as follows:
while the positive indicators are calculated as:
The normalized data are the real numbers in the interval [0, 1]. The larger the value, the more approximate it is to the optimal value.
2.2.2. Weight of Indicators
We adopted a combination of subjective and objective weighting methods, that is, the Delphi method and entropy weight, to determine weight synthetically. The Delphi method determines weight through multiple rounds of expert scoring, and the mean value of scoring can be used as the subjective weight
if the variance of score is not more than 0.005. The entropy weight method determines weight according to the difference range of each index value, which can avoid the subjectivity of empowerment [
44]. Set the objective weight vector as
, and the calculation process is as follows.
The entropy of the jth evaluation indicator was defined as:
where
. Defining that when
,
. Entropy weight of jth, that is,
can be calculated by Equation (4) as follows:
Then, the objective weight vector is , , and , . Finally, the total weight vector is .
2.2.3. Grey Relational Degree
Select the optimal indicator in each column of the normal matrix as the reference vector:
. Set the grey correlation coefficient as
,
is the distinguishing coefficient and can be determined according to the degree of correlation between sequences. The smaller the value, the bigger the difference between the correlation coefficient. In general,
.
Let the correlation coefficient matrix
, then multiply
by the weight vector
to get the grey relational degree vector
:
2.2.4. Comprehensive Comparative Advantage
According to the comprehensive analysis of the above calculation results, the characteristics of the three types of paths could be found. For the relationship between the industrial comparative advantage and the effect of value chain optimization, we compared another indicator, the comprehensive comparative advantage (CCA), with the grey relational degree. If there are similar rules in the ranking of the two kinds of evaluation values, it is possible that there is a certain relationship between the optimization of the industrial value chain and the industrial comparative advantage, and further verification of their relevance is necessary. Otherwise, the reason for the phenomenon is that there is no relationship between the optimization of the industrial value chain, and the industrial comparative advantage should be analyzed. CCA is calculated based on calculating the comparative advantages of the important industries separately, then summing them up. The calculation formula is:
represents the percentage of main business income due to industry i in China, and
is the percentage of main business income due to industry i in city j. Industries to be calculated need to be determined according to the specific research.
2.3. Evaluation Index System
China’s national circular economy evaluation index is widely used, but the index system lacks evaluation of social and economic development [
45]. In addition, some scholars have also evaluated the sustainable development of cities, such as the ecological city and the green city, and established the related evaluation index system [
46,
47,
48]. The indicators above provided a reference for this study but had some shortcomings in comprehensiveness and pertinence. Based on the situation in China in recent years [
49] and the investigation of the strategy and effect of the transformation of resource-based cities, the evaluation index system was set up. The system was divided into three levels. The criteria level consisted of the dimensions of economic, social, and environmental values. The domain level contained nine comprehensive indicators, and the index level contained 22 indicators, as shown in
Table 1. For the calculation formula and its attributes, please see
Appendix Table A1.
The purpose of industrial value chain optimization is to promote the transformation of resource-based cities. Therefore, the level of economic development is the most intuitive indicator. Furthermore, optimization of the economic structure and economic development capacity is also valuable. The level of economic development is mainly based on macroeconomic data. The key to the optimization of economic structure is the decline in the proportion of industries occupying the low end of the value chain and enhancing export capacity. Economic development capacity considers the fiscal, profit, and technological levels. Industrial value chains that are at a high level of optimization can provide cities with better employment and living standards. Therefore, that financial input can concentrate more on the expenditure proportion of science, education, culture, and public health (SECH) and the attractiveness of the city is relatively high. Additionally, energy consumption, sewage, waste disposal, and other environmental problems can be improved.
2.4. Empirical Objects
A total of 53.39% of China’s resource-based cities are coal-based cities [
50]. Therefore, this paper used the coal resource—based cities of Yulin, Pingdingshan, and Linfen as the empirical objects to reduce the uncertainty factors. The industrial value chain of these cities is dominated by coal and its related industries. In addition, the industrial value chain optimization path of these cities is similar to that of this paper and there was a little overlap among them.
Yulin is located in the northern part of Shaanxi Province. The industry structure of Yulin is based on coal and its fine processing. Yulin has had a series of achievements in the mode of industrial integration and circular economy, for example, the world’s first 10,000-ton aromatic hydrocarbon processing by coal, the world’s first experiment in mixing coal and petroleum, and an experiment on the industrialization of pulverized coal dry distillation. All of these realized the full utilization and recycling of resources [
51]. The related research also proved that the economic development of the concentrated area of heavy industry in Yulin is highly technical [
52]. Thus, the value chain optimization path of Yulin corresponds to constructing a circular economy system. Pingdingshan is located in the middle of Henan Province. The mechanization and informatization levels of the coal industry are constantly improving, and the proportion of non-coal industries, especially the equipment industry, is constantly increasing, and reached 71.9% at the end of 2015. Furthermore, new material industries, including polyurethane and air bag silk, have shown remarkable development [
53]. Therefore, the value chain optimization path of Pingdingshan corresponds to cultivating related industries. Linfen is located in the southern part of Shanxi Province. The significant characteristic of Linfen is its preferable development of tourism. In addition, it has aimed at and gradually formed a new industrial system dominated by new energy vehicles, soft drinks, and other emerging industries [
54]. Therefore, the path of value chain optimization in Linfen corresponds to cultivating emerging industries.
After the Chinese economy entered the adjustment period and the new normal, the comprehensive transformation of resource-based cities began in 2012, and its effect was gradually obvious from 2013. Therefore, the data from 2013 to 2016 were chosen and analyzed. The data were from the Chinese Statistical Yearbook, the Shaanxi Statistical Yearbook, the Henan Statistical Yearbook, the Shanxi Statistical Yearbook, and the statistical yearbooks and communiques of the three cities in the corresponding years.
3. Results and Discussion
After processing the related data into the formulas above, the results and analysis are as follows.
3.1. Weights of Indicators
We first used the Delphi method to obtain subjective weight. To improve the purpose of the evaluation, the weight interval of the criteria and domain level were set up before the expert scoring, as shown in
Table 2.
Through two rounds of expert scoring, the variance of all weights was reduced to below 0.05, and the mean value was used as the subjective weight. The objective weights were then calculated according to Equations (3) and (4). The final weights were calculated as shown in
Table 3.
Results show that indicators with higher weights included per capita GDP, income proportion of mining industry, proportion of value-added of tertiary industries, rate of industrial solid wastes utilized, and energy consumption per unit GDP. These results indicate that the key indicators are focused on economic development level, economic structure optimization, and environmental value.
3.2. Comprehensive Results
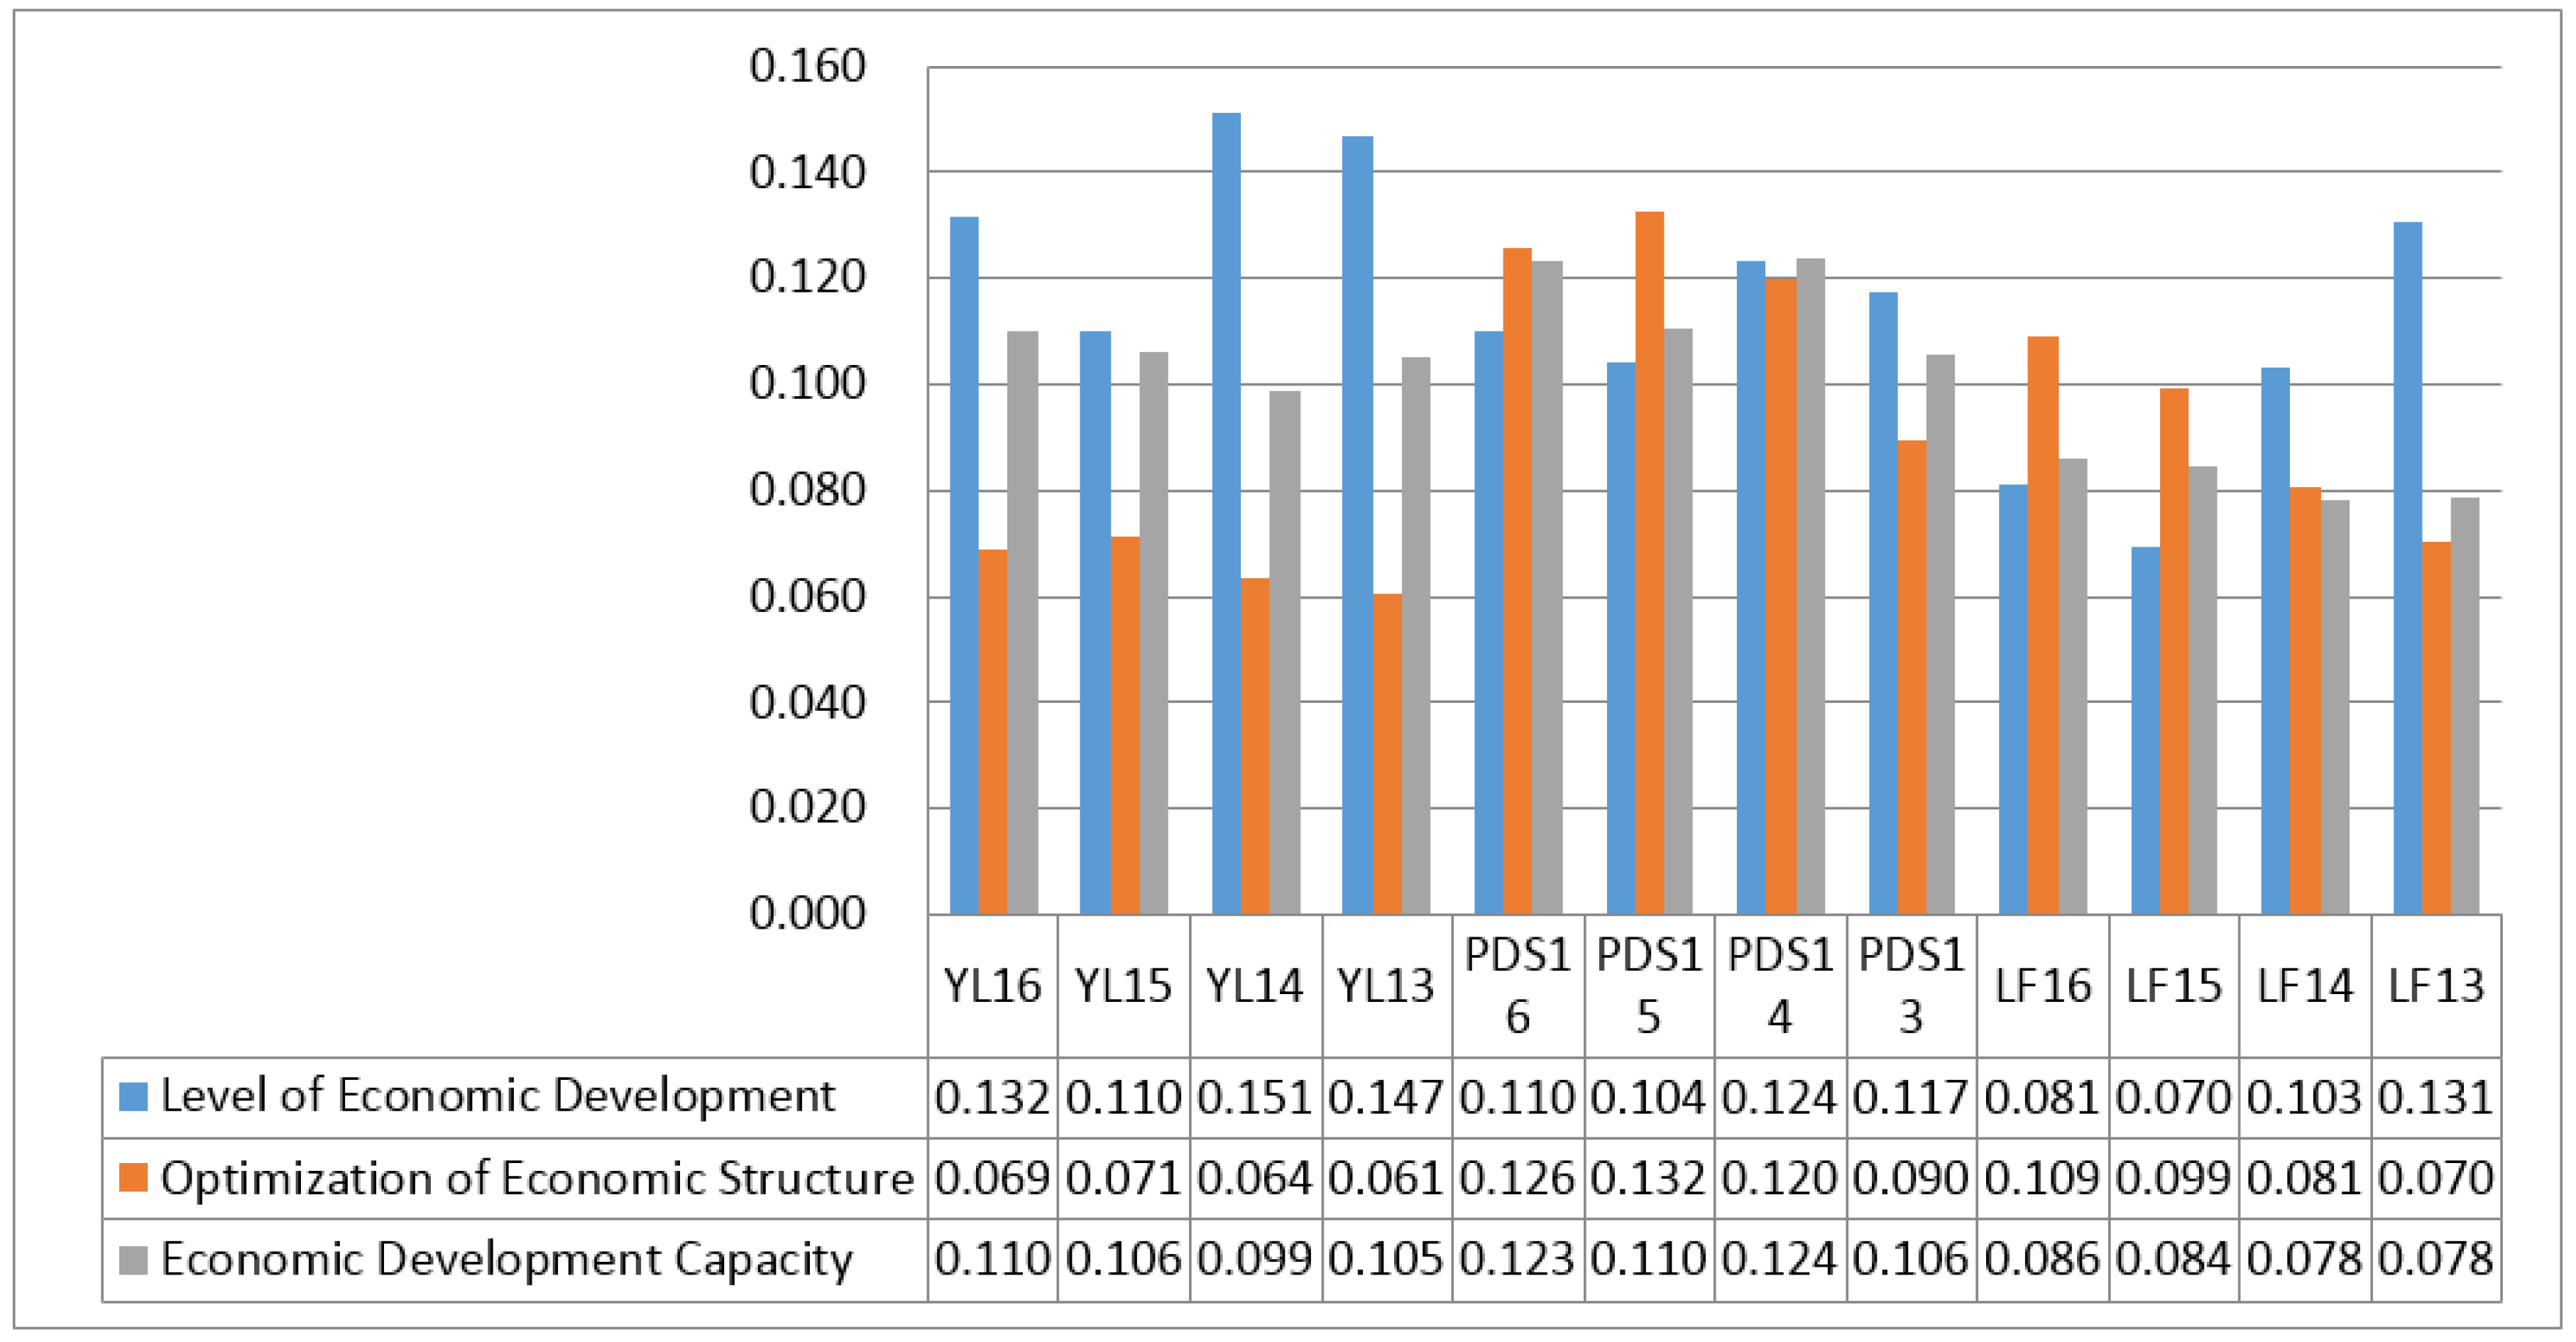
Results of Yulin, Pingdingshan, and Linfen from 2013 to 2016 were calculated according to Equations (5) and (6), as shown in
Figure 2.
The results show that Pingdingshan had the highest comprehensive evaluation value, followed by Yulin, and the lowest was Linfen. Pingdingshan had relatively obvious advantages in terms of economic value and environmental value; however, it was not outstanding in terms of social value. Yulin’s three types of value evaluation were all at an average level, while Linfen had an undesirable evaluation of economic and environmental value. From the perspective of trend, the evaluation value of Pingdingshan increased year by year, while it fluctuated in Yulin, and the change in Linfen was not obvious. The evaluation results of the three types of values in each city fluctuated in the study period. The above evaluation results show that cultivating related industries had the most significant positive influence on the early stage of the transformation of resource-based cities in China, while the effect of emerging industries was the least significant. Regardless of which industrial value chain optimization path was adopted, the result had a certain degree of fluctuation, and the construction of a circular economy system brought the greatest fluctuation. The advantages, disadvantages, and types of action of the three types of value chain optimization paths needed to be analyzed in detail from the economic, social, and environmental aspects.
3.3. Effects and Trends of Economic Value Optimization
The evaluation results of economic value are shown in
Table 4 and
Figure 3.
Yulin had a significant advantage in the level of economic development. Its economic development capacity was relatively fine and improved in the research period. However, the optimization of economic structure was the least obvious and no obvious improvement was shown. Due to the relatively singular industrial structure before the transformation, China’s resource-based cities constructed a circular economy system by cultivating resource processing enterprises and promoting cooperation among them to improve the utilization of resources. These measures were under policy orientation and were difficult to promote for extension of the industrial value chain. Thus, diversification of imports and exports was restricted and there was no obvious effect on the optimization of the economic structure. At the same time, however, the deep development of resources had been strengthened due to the circular and cascading utilization of resources. As a result, there was a relatively high level of economic development. Furthermore, favorable levels of financial self-sufficiency, profit margin, and employed people in tertiary industries ensured a promising economic development capacity.
The economic development of Pingdingshan was lower than Yulin but more stable. This was benefited by the industrial diversification brought by cultivating related industries, which the fine evaluation value of the economic structure optimization and development capacity proved. Based on traditional industries’ accumulation of technology and the new demand for related industries, R & D capability was greatly stimulated, so the number of patent applications had a significant advantage and the low-end mining industry dropped obviously. Cultivating related industries had advantages in the allocation of resources such as labor, technology, and capital at the early stage of transformation. Thus R & D, social consumption, and export in various fields increased. In comparison, although the path of cultivating emerging industries was beneficial to long-term transformation, emerging industries were limited in the early stage, while traditional industries were not optimized and upgraded through the circular economy. Therefore, there was a decline in economic development and a limitation of development capacity. However, economic structure improved year by year.
3.4. Effects and Trends of Social Value Optimization
The industrial value chain was adjusted fiercely and lacked fluency and stability in operation at the early stage of constructing the circular economy system. Thus, employment declined and was at a low level in Yulin. However, attention was paid to each link of resource utilization, and more links of R & D and income growth points were excavated. Therefore, the living standards of people was fine and grew obviously, and social development capacity was at a high level. Cultivating related industries promoted labor transfer when industries were adjusting, thus employment stability was ensured. Economic development caused by extension of the industrial value chain improved living standards. However, the long-term development expectations of residents decreased as there were no industries with outstanding advantages. Therefore, population outflow in Pingdingshan was more serious. Cultivating emerging industries could remedy the instability of employment and population outflow through diversification and providing more jobs. By comparing number and trend, it was found that at the early stage of transformation, constructing a circular economy system faced the stress of unemployment, but obviously improved the living standards of residents and had a fine social development capacity, though its trend is worthy of further observation. Advantages in employment and social development of cultivating emerging industries are also worth paying attention to. Regardless of the optimization path, it could ensure steady improvement of the living standards of residents.
3.5. Effects and Trends of Environmental Value Optimization
The evaluation results of environmental value are shown in
Table 6 and
Figure 5.
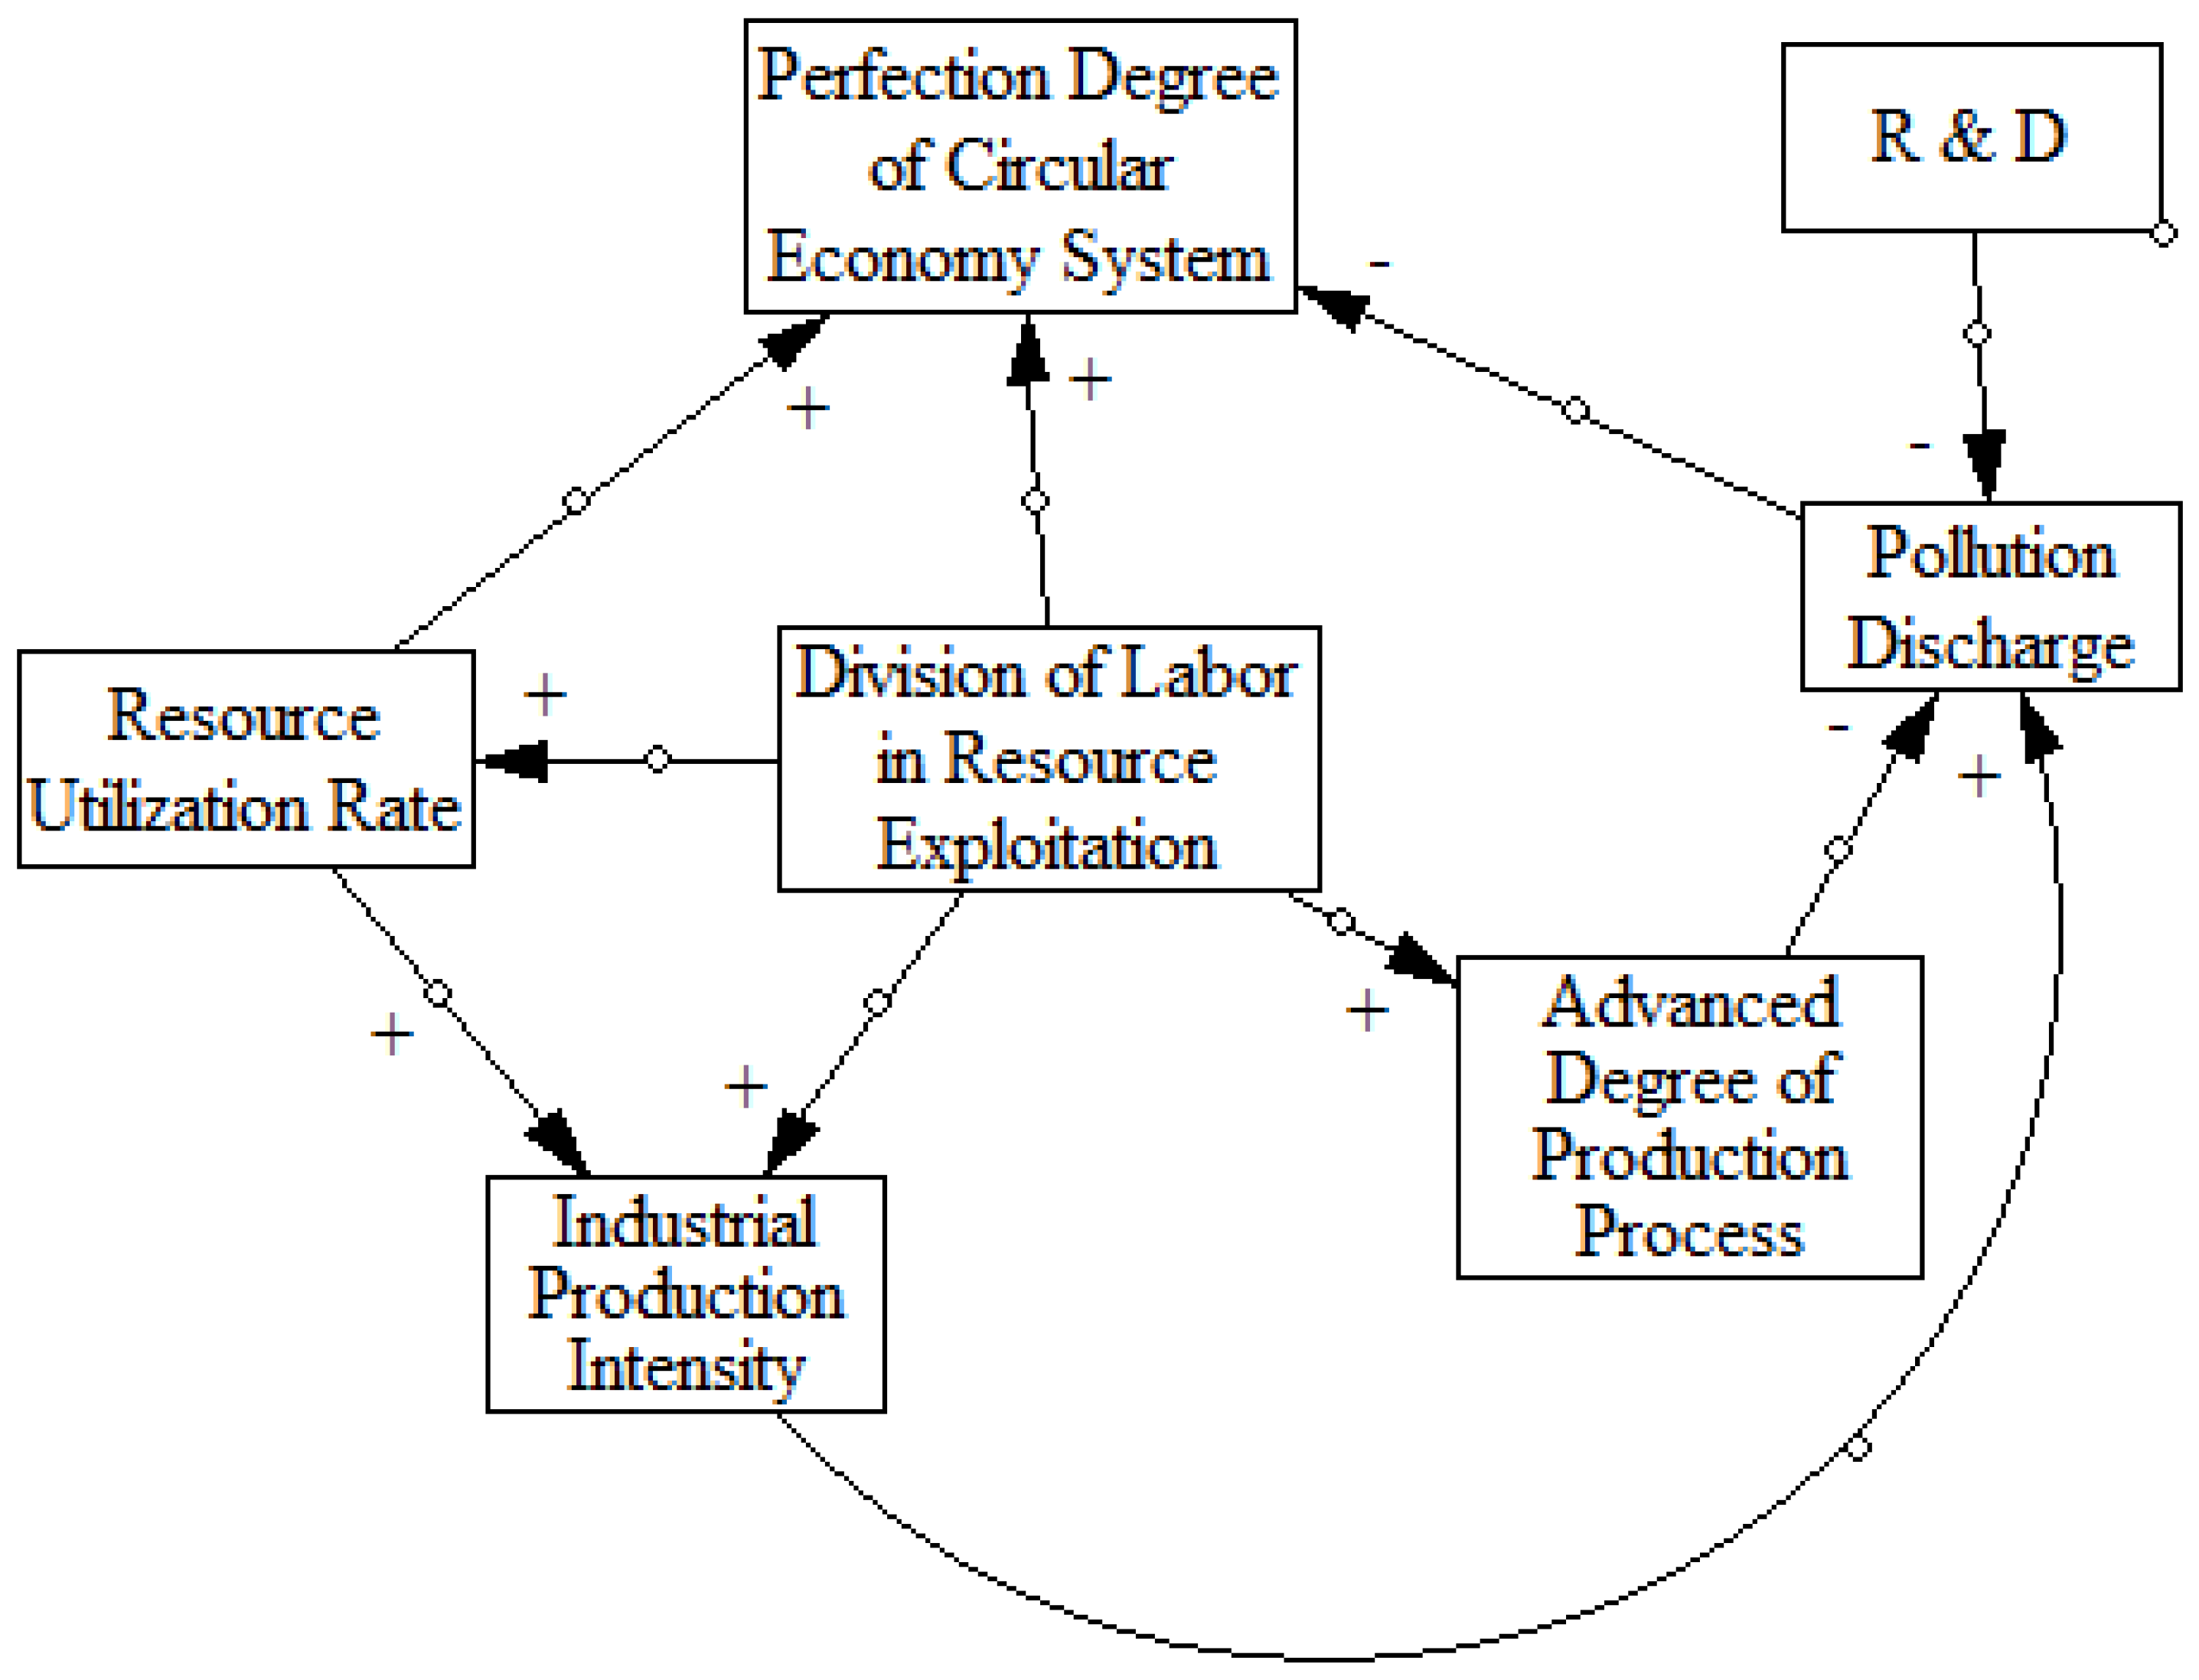
By analyzing the results, we found that the results of cultivating emerging industries that may create the most environmental value were the lowest. In contrast, we found that regardless of the path of constructing the circular economy system or cultivating related industries, the production mode and industrial configuration of traditional industries with serious pollution were adjusted, thus optimizing environmental value creation capability. Linfen did not focus on optimizing traditional resource-based industries, so the city still maintained a high level of energy consumption and pollution. In addition, a complete transfer of the industrial center cannot be realized in the short term, thus Linfen had the worst environmental evaluation results. This deficiency could be optimized by the other two paths. From the results, Yulin and Pingdingshan had better performance in pollution treatment and energy consumption than Linfen, especially in energy consumption. Construction of the circular economy system in Yulin was at the early stage, so it did not show the capacity of creating environmental value. This was determined by the composition and mechanism of its environmental value creation, as shown in
Figure 6.
R & D, innovation, development of enterprises, and creation of environmental value are necessary for a circular economy system. New enterprises are necessary for this process. However, new enterprises may have a large amount of pollutant discharge at the early stage due to limited technical capacity and a lack of synergy with the circular economy system. Therefore, the overall value creation capacity of the circular economy system is limited. With better cooperation of internal links and continuous innovation, the positive effects of a circular economy system will be more obvious. Furthermore, changes in ecosystem structure caused by the adjustment of industrial structure is also an important reason for a decline in environmental value [
55].
3.6. Relationship between Industrial Comparative Advantage and Value Chain Optimization
The mining, resource processing, and equipment manufacturing industries were selected as the calculating objects of the comparative advantage of CCA. Results of CCA and the grey relational degree of the three cities are shown in
Table 7.
It was found that the grey relational degree (D) of Pingdingshan ranked in the front while CCA ranked behind. Linfen was the opposite, and the results for Yulin were moderate. There was no obvious correlation between CCA and D or CCA and economic value (EV). That is, having industrial comparative advantage did not mean a resource-based city in China could create more value, as the industrial advantages such as Linfen’s resulted from the scale of industries. Once it costs more in the aspects of society and environment, the evaluation results will be at a low level. Conversely, if we promote social and environmental value creation by extending the industrial value chain, as in Pingdingshan, even if the industrial comparative advantages are still at a low level, the comprehensive value creation capacity will be enhanced. According to related research, industrial comparative advantage usually comes from industrial symbiosis [
56], market competitiveness and human resource advantages [
57], degree of industrial ecology [
58], and industrial agglomeration [
59]. Policy adjustment also has a significant impact on the accumulation of comparative advantage [
60]. Through transformation, all of the above aspects of China’s resource-based cities improved, which was proven by the D results. However, the sources of industrial comparative advantage were still resource endowment and industrial scale, which had not been transformed. Various kinds of optimization paths of the value chain enhance value creation capacity by adding and adjusting links of value creation rather than improving industrial comparative advantages. Therefore, upgrading the level of industries remains to be improved.
3.7. Brief Summary
The effects of the three types of industrial value chain optimization paths on value creation are summarized in
Table 8.
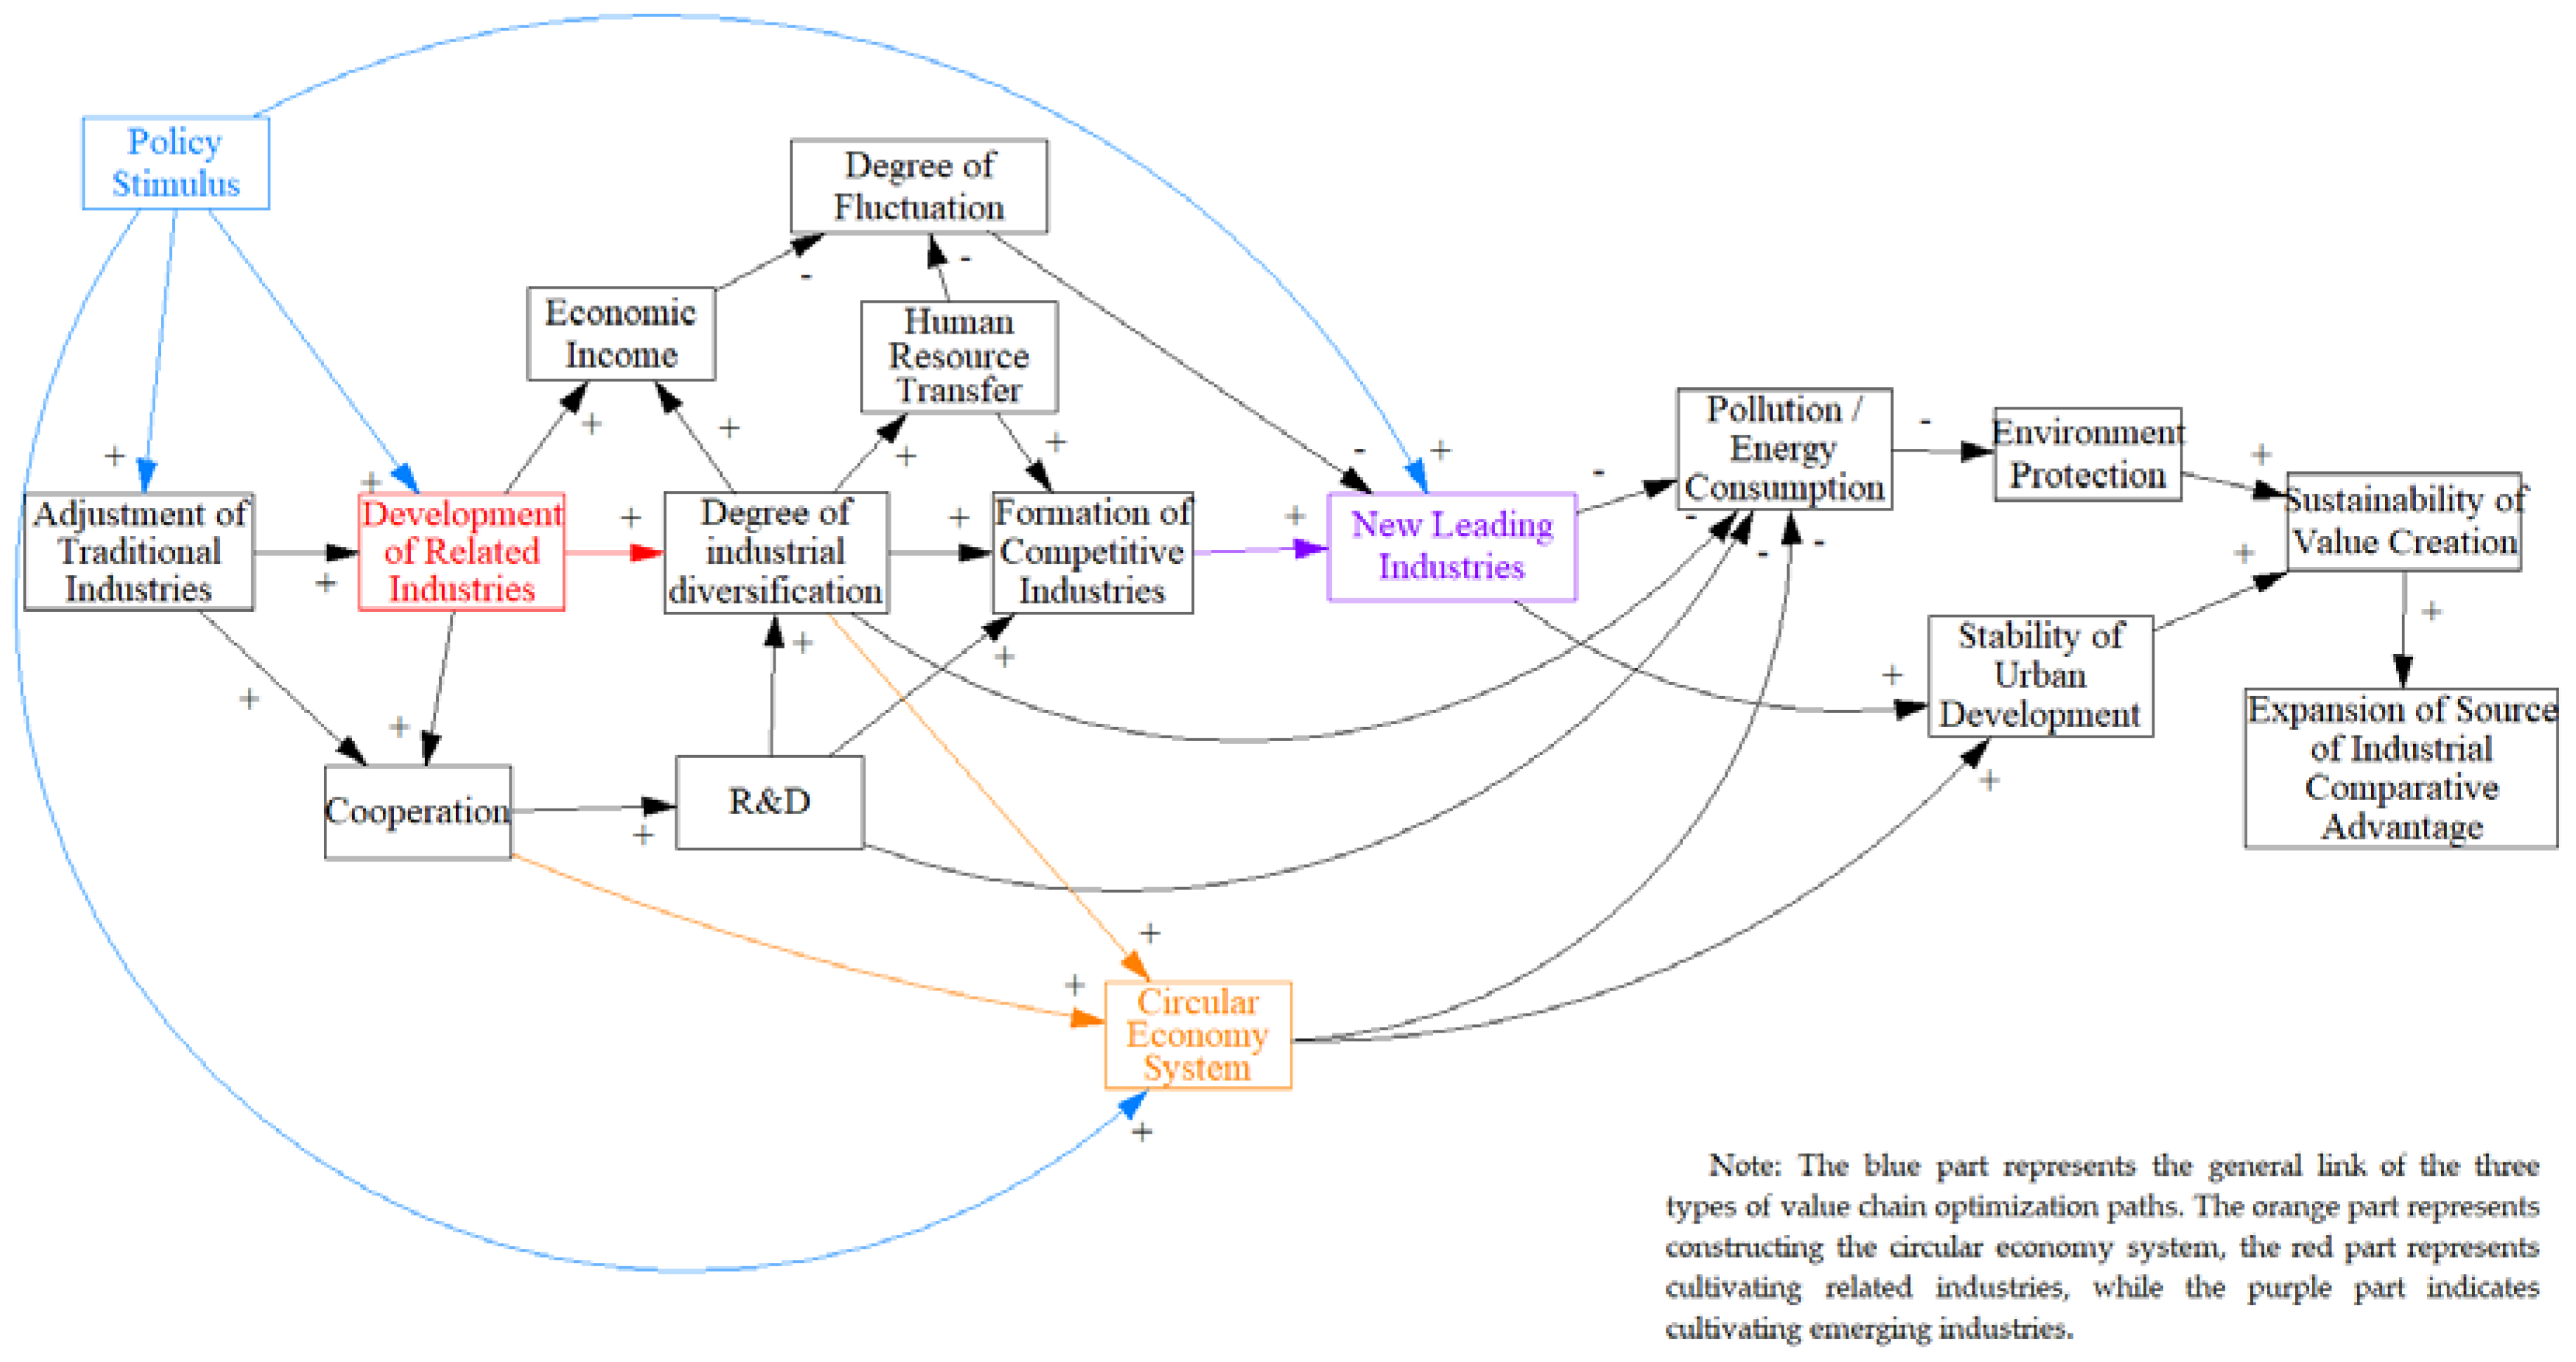
We can see that the main advantages of constructing a circular economy system lie in the high levels of economic development, people’s living standards, social development capacity, and promising environmental value creation capacity. However, it needs to experience the fluctuation period caused by industrial adjustment. Industrial structure had no obvious improvement and value optimization was not stable in the short term. The main advantages of cultivating related industries include sustained and stable economic returns and employment level, the most significant economic restructuring development capacity, and excellent environmental value creation. However, population outflow restrained social development and a long-term plan was necessary to strengthen the pertinence of resource allocation. As cultivating emerging industries is a long-term process, it improved economic value the least but was steady. Furthermore, it improved people’s living standards and social development capacity. Due to leading links of the industrial value chain not being transferred and insufficient adjustment to traditional industries, it had a low-level environmental value. However, it had the most significant industrial comparative advantages. Regardless of the industrial value chain optimization path, the source of industrial comparative advantages was not optimized. By integrating the above analysis into the transformation process of China’s resource-based cities, a system dynamics causality diagram can be created, as shown in
Figure 7.
4. Conclusions
We established an optimization path model of the industrial value chain in China’s resource-based cities by using value chain and system dynamics theories. Next, three important paths were proposed. By establishing an index system consisting of the effects of economic, social, and environmental value optimization, we used grey relational analysis to complete the empirical research using the comparative objects of Yulin, Pingdingshan, and Linfen in China.
According to the results, the following conclusions can be drawn. First, the three important optimization paths were constructing a circular economy system, cultivating related industries, and cultivating emerging industries. Limited to resource allocation, different cities focused on different paths. Second, the three types of paths had different advantages and disadvantages. Constructing a circular economy system may be suitable for cities that will still rely on resource-based industries for a period of time; however, the unpredictable trends in the short term should be paid attention to. Cultivating related industries had the most significant value creation capacity in the short term, so it can be considered as a mode for stability in short times or transition periods. However, this path will not contribute to the formation of leading and advantageous industries. Low-level value creation capacity of cultivating emerging industries indicated that essential measures should be adopted to ensure stability during the period of forming new leading and advantageous industries. Finally, there was no obvious relationship between industrial comparative advantages and value creation capacity. That is, the optimization of value creation capacity resulted from the adjustment of value chain links rather than the enhancement of industrial comparative advantages. This phenomenon means that the value creation capacity created by transformation was not the source of industrial comparative advantages. To sum up, China’s resource-based cities should focus on a circular economy system and emerging industries in the long term, while realizing extension of the industrial value chain by cultivating related industries in the short term to enhance the stability of transformation and achieve a fine transition.
Future studies should include more time series data in empirical analyses to reflect the dynamics of industries better or add data from earlier years to explore the differences of industrial base between the comparison objects. The evaluation index system can be adjusted according to different stages of transformation. Finally, the internal mechanism of the three types of optimization paths, especially their capacity of coping with different development environments and scenarios, should be analyzed.


