GIS Assessment of Mass Tourism Anthropization in Sensitive Coastal Environments: Application to a Case Study in the Mar Menor Area


Department of Civil Engineering, Technical University of Cartagena, 30203 Cartagena, Spain
Sustainability 2018, 10(5), 1344; https://doi.org/10.3390/su10051344
Submission received: 23 March 2018
/
Revised: 22 April 2018
/
Accepted: 24 April 2018
/
Published: 26 April 2018
(This article belongs to the Special Issue Sustainable Tourism in Sensitive Environments: Mountains, Islands, Coastal and Polar Regions)
Abstract
:On the Mediterranean coast, the tourism activity which has developed since the 1950s has become a mass tourism industry in recent decades, cohabitating with natural spaces of high environmental value. These sensitive areas are thus subjected to a varied catalog of anthropizing actions (urbanization of the natural soil, modification of the dune balances by the construction of port infrastructures, alteration of marine ecosystems by recreational activities, etc.). All these inter-related elements are often difficult to analyze in a comprehensive way because of their diffuse nature. This paper proposes a methodology based on GIS analysis for the evaluation of diffuse anthropization associated to tourism in sensitive coastal environments. By using different indicators of territorial transformation, a complete method is proposed to establish the index of diffuse anthropization of a territory. This methodology, which is easily applicable in a generalized manner in different cases for developed countries, will be applied in the Mar Menor, a coastal lagoon area in the Mediterranean that has been suffering from mass tourism during recent decades. The results will show the important impact of several actions linked to tourism and the worrying inertia that the current trend can cause in the lagoon’s ecosystem.
1. Introduction
Coastal territories are currently a common attraction for sun and beach tourism. With the appearance in the 1950s of the phenomenon of mass tourism, coastal areas of developed countries in Europe and America began a process of intense urbanization of their territory [1]. In this context, we can find a varied catalog of examples of transformations of natural areas of great environmental value, such as natural beaches [2], dune cords [3] or coastal lagoons [4].
These transformations are not usually limited to specific events, but are usually part of a set of interlaced impacts derived from tourism activity and resulting in a more complex impact on the environment [5]. This phenomenon is usually analyzed under the prism of the global anthropization of a territory [6,7]. The concept of anthropization is not easy to evaluate [8], or even to approach [9], in areas of certain territorial or environmental complexity. It is a phenomenon that can be classified as diffuse in many cases in which there is no clear source for the existing problems, or where this origin is actually a consequence of many factors [10]. In addition, we often find that these factors of origin have some interrelation among them or feed directly on each other [11]. This problem is rather common in coastal areas affected by intense tourist activity. In these areas, for example, impacts associated with the urban transformation of natural soil, the construction of port infrastructures that alter the sedimentary dynamics of the beaches, the generation of discharges and waste to the sea, the development of recreational activities that affect the marine fauna and flora, etc. can be easily found [12,13]. All such elements cannot be easily assessed, although with the right tools their individual impact on the territory can be measured globally in an objective way.
Various approaches can be found in the scientific literature which have aimed at evaluating anthropization in sensitive environments. One such approach that is frequently used to quantify this phenomenon involves the analysis of ecosystem services [14]. This approach can even be valued numerically from an economic perspective (e.g., [15]). Nevertheless, it should be noted that this approach barely represents the physical reality of the phenomenon of anthropization, thus limiting its scope. Another common approach is the segmented and unidisciplinary analysis of indicators. In this field, it is easy to find good examples of biological [16], chemical [17], geological [18] or even medical indicators (e.g., [19]). However, all these methods, in isolation, fail to successfully explain multidisciplinary phenomena such as the global impact of mass tourism in coastal territories. For that reason, an approach that is currently gaining more and more weight in this field is the spatial analysis through the evaluation of land-use and land-cover change [20,21]. Even so, it is difficult to analyze multidisciplinary phenomena in areas of diffuse anthropization, which means that comprehensive methodologies able to simplify complex issues are still required.
In this context, the implementation of integrated indicators using GIS tools can be a very interesting technique for the assessment of these complex environments which are suffering from diffuse anthropization processes [22]. Remarkable methodologies have been implemented for the analysis of other diffuse phenomena in diverse areas such as sandy beaches [23]; coastal lagoons [24]; flood risk areas [25]; soils with heavy metal contamination [26]; heritage areas submitted to new tourism phenomena [27]; rural areas under groundwater scarcity conditions [28]; forest groundwater aquifers [29]; etc. In addition, it should be noted that GIS is a very useful diagnostic tool for environmental and territorial decision-making processes. Good examples can be observed for controversial topics such as landfill siting [30]; onshore wind farm site selection [31]; implementation of geohazards countermeasures [32]; groundwater quality determination [33]; diagnosis of seismic vulnerability of cities [34]; city patterns of growth in urban planning [35]; etc.
The development of GIS indicators allows to measure quantitatively and objectively over time very heterogeneous issues such as the territorial transformation of natural areas; the increase of tourist activity in the territory; or the appearance of new infrastructures and elements that may suppose an alteration to the equilibrium of the ecosystems. By analyzing the process in a sufficiently broad time frame, not only can the quality of each element be analyzed in a qualitative way, but also all these impacts may be quantified individually in homogeneous units to generate an aggregate ratio of the overall process of anthropization. In this sense, a methodology based on GIS indicators is proposed for the evaluation of sensitive coastal environments subjected to processes of diffuse anthropization.
For the evaluation of the proposed methodology, the Mar Menor Mediterranean lagoon and its adjoining coastal area have been chosen as a case study. Coastal lagoons, which are often linked to the interaction of tourist activity, involve complex management due to the varied environmental issues that they usually suffer from (clear examples can be found around the world [36,37,38]). This whole area is very illustrative as an analysis case study because it also contains the traditional coastal environments affected by tourism development and other singular areas such as marine reserves, ancient dune strings or natural parks. It is therefore a territory that contains the vast majority of the existing issues in sensitive coastal areas affected by tourist activity.
In this context, different GIS indicators will be utilized to assess the current state, as well as the impact, of the different elements in the lagoon and its adjacent coastal area in relation to tourism in the last 60 years. An index of global anthropization of the lagoon associated to tourism activities will be elaborated based on the proposed methodology. This will help territorial and environmental planners to diagnose its current state and to evaluate the future trend inertia of this complex coastal environment.
2. Materials and Methods
The proposed methodology is presented here in a general way in three phases: diagnosis of issues, prioritization and transformation of these into dimensionless GIS indicators, and aggregate generation of the diffuse anthropization index of the territory analyzed. It is an open methodology that does not require the use of specific GIS tools and does not pose local constraints. Each of these phases is developed in detail below.
2.1. Phase 1: Diagnosis of Issues in the Selected Area
First, it is necessary to carry out a prior task of qualitative prospection of the environment with a standardized analytical approach. This will allow a recognizable cause-and-effect mechanism of anthropization to be established. For that purpose, any of the well-known usual procedures (DPSIR; Ecosystem Services framework such as MEA, TEEB or CICES; Ostrom’s multi-level nested framework for socioecological systems [39]; etc.) can be valid, provided they are adapted to the idiosyncrasy of the area in question. It is important that the list of actions Aj selected to assess the whole process is representative of the set of anthropization problems Pi existing in the territory analyzed. It should also be borne in mind for the selection of issues that the problems derived from this process must be subsequently modeled by means of GIS indicators. In this sense, transformations due to different actions diagnosed and their territorial impacts must be able to be modeled as follows in Equations (1)–(3):
with Pi being the anthropization problems emulated into Aj actions among the set of possible An actions through the diagnosis process in different areas of the territory analyzed. Ti and Ui are global territorial measurable trends modeled in these areas through fi and hi functions, respectively, with the former submitted to transformation inertia of Ai and the latter one not.
Interrelated actions can be included but they must not have a direct correlation (one would then be overweighing a specific problem). Few actions may not be able to realistically analyze the global problem, while many actions could cause the study to lose the real perspective in the numerical field and may introduce a possible high degree of correlation between them. An adequate number of parameters to be analyzed for normal cases could range, for example, between 3 and 6 elements, depending on the complexity of the analyzed environment.
2.2. Phase 2: Prioritization and Transformation of Actions into Dimensionless GIS Indicators
The actions diagnosed in Phase 1 have to be hierarchized with objective parameters. It is important to correctly rank the importance of the different actions to generate a realistic index. For the elaboration of the different weights, objective criteria of the social and scientific perception can be taken into account. For this, different surveys, interviews or alternative methods derived from Phase 1 can be elaborated among all the stakeholders in the social case, or representative experts in the scientific disciplines that are likely to be involved in the analyzed territory.
The implementation of partial indicators must be realistic and correctly model the work carried out in the previous stage. The indicators must be able to provide homogeneous, reliable and sustained data over time for a time frame that is significant for the problems analyzed. It must also be adimensionalized to be aggregated in a global index of anthropization and comparable with other environments with similar problems. It is important to bear in mind that the greater the weight assigned to a partial indicator, the better defined and more detailed it should be. The format of partial indices (Equation (4)) and weighting coefficients (Equation (5)) are as follows:
with δ being the partial indicator i of n elements evaluated during k years for a dimensionless territorial concept [T (transformation area)/U (reference area)], emulating j anthropization actions, and λ being the weighting coefficient i for this indicator.
2.3. Phase 3: Generation of the Diffuse Anthropization Index of a Sensitive Coastal Territory
The final step is the generation of the diffuse anthropization index of a sensitive coastal territory through the aggregation (weighted according to the criteria of Phase 2) of the indicators resulting from Phase 1. To calculate this aggregate index, each one of the indicators of Phase 2 must be calculated individually. These transformation indicators must be calculated in a comparative way between two dates prior to and after the anthropization process in a period that is sufficiently significant to provide georeferenced data that can be analyzed. Periods of less than 10 or 15 years are not recommended, since conjunctural and non-structural data could be introduced in the transformation trends. For short periods to guarantee credible results, they would have to respond to very specific and accelerated problems, which is not the objective of this analysis focused on complex phenomena of diffuse anthropization.
Once the partial indicators of the actions have been calculated individually, they must be added in a weighted way in the global index as follows in Equations (6) and (7):
where Π is the aggregated index of diffuse anthropization of a territory, and z the summation of n partial GIS indicators δ weighted with n coefficients λ. As indicated in the previous section, weighting coefficients must be obtained objectively. Thus, each value of coefficient λ may for example be the result of a statistical relationship F between the value granted in phase 1 for its action and the average valuation λm of the selected actions.
The dimensionless character of the GIS partial indicators thus allows to “mix” phenomena of a different nature for a territory z. The analysis of this index of global anthropization can provide multiple applications for the evaluation of sensitive coastal areas subjected to processes of diffuse anthropization. For example, the severity of the whole process of anthropization in this territory z can therefore be compared to other x or y territories with similar contexts. Future scenarios can also be proposed through a trend analysis based on the evolution of the historical data of this global index. Of course, it is important to maintain a minimum number of cautions. On the one hand, we should pay attention to avoid mixing negative and positive effects. The indicators must be either all clearly positive or all clearly negative (it is more reasonable for them to all be negative). The concept of “clearly negative or positive effect” may not always be easy to interpret and may even be debatable in some cases. On the other hand, this sum of values must always be considered by the user from a critical perspective towards the phenomenon to be studied. Although the parameters are dimensionless and may model very different phenomena, it is important that they analyze proportionate actions. In this sense, there should not be large numerical differences between them (for example, it does not make sense to add a partial indicator whose values can oscillate in physical reality between 0.001 and 0.01 with another whose values usually go from 0.1 to 1). As an approximation, it is recommended that the values to add have ranges of variation that do not differ between them by more than 30–40% (it must be also borne in mind that the weighting coefficients can never serve to correct intrinsic imbalances of this nature between the indicators). The whole of the process can be observed in a summarized way in the following scheme (Figure 1).
3. Results
3.1. Description of the Case Study
The coastal territory of the Mar Menor has been chosen as a case study to apply the proposed methodology (see Supplementary Materials). The Mar Menor is a salt-water lagoon in the Spanish Mediterranean with an area of 170 km2 and a depth ranging from 3 to 6 m. The whole of the lagoon and its adjoining territory represent a total coastal perimeter of 70 km with a high influx of tourism activity since the middle of the 1950s [40]. The lagoon is separated from the Mediterranean Sea by an ancient dune string 20 km long, called “La Manga”. This area (now highly urbanized) allows the communication of both seas through five natural canals, called “golas”, currently widened for maritime navigation. It is a territory of high environmental value due to its marine reserves, ancient dune beds, natural parks in salt flats with a singular ecosystem, long natural beaches, etc. Nevertheless, this environment has undergone a long process of global transformation due to this tourist activity in recent decades. This tourism, initially quite orderly from the mid-1950s, became increasingly popular from the 1980s, and nowadays it is mass tourism [41].
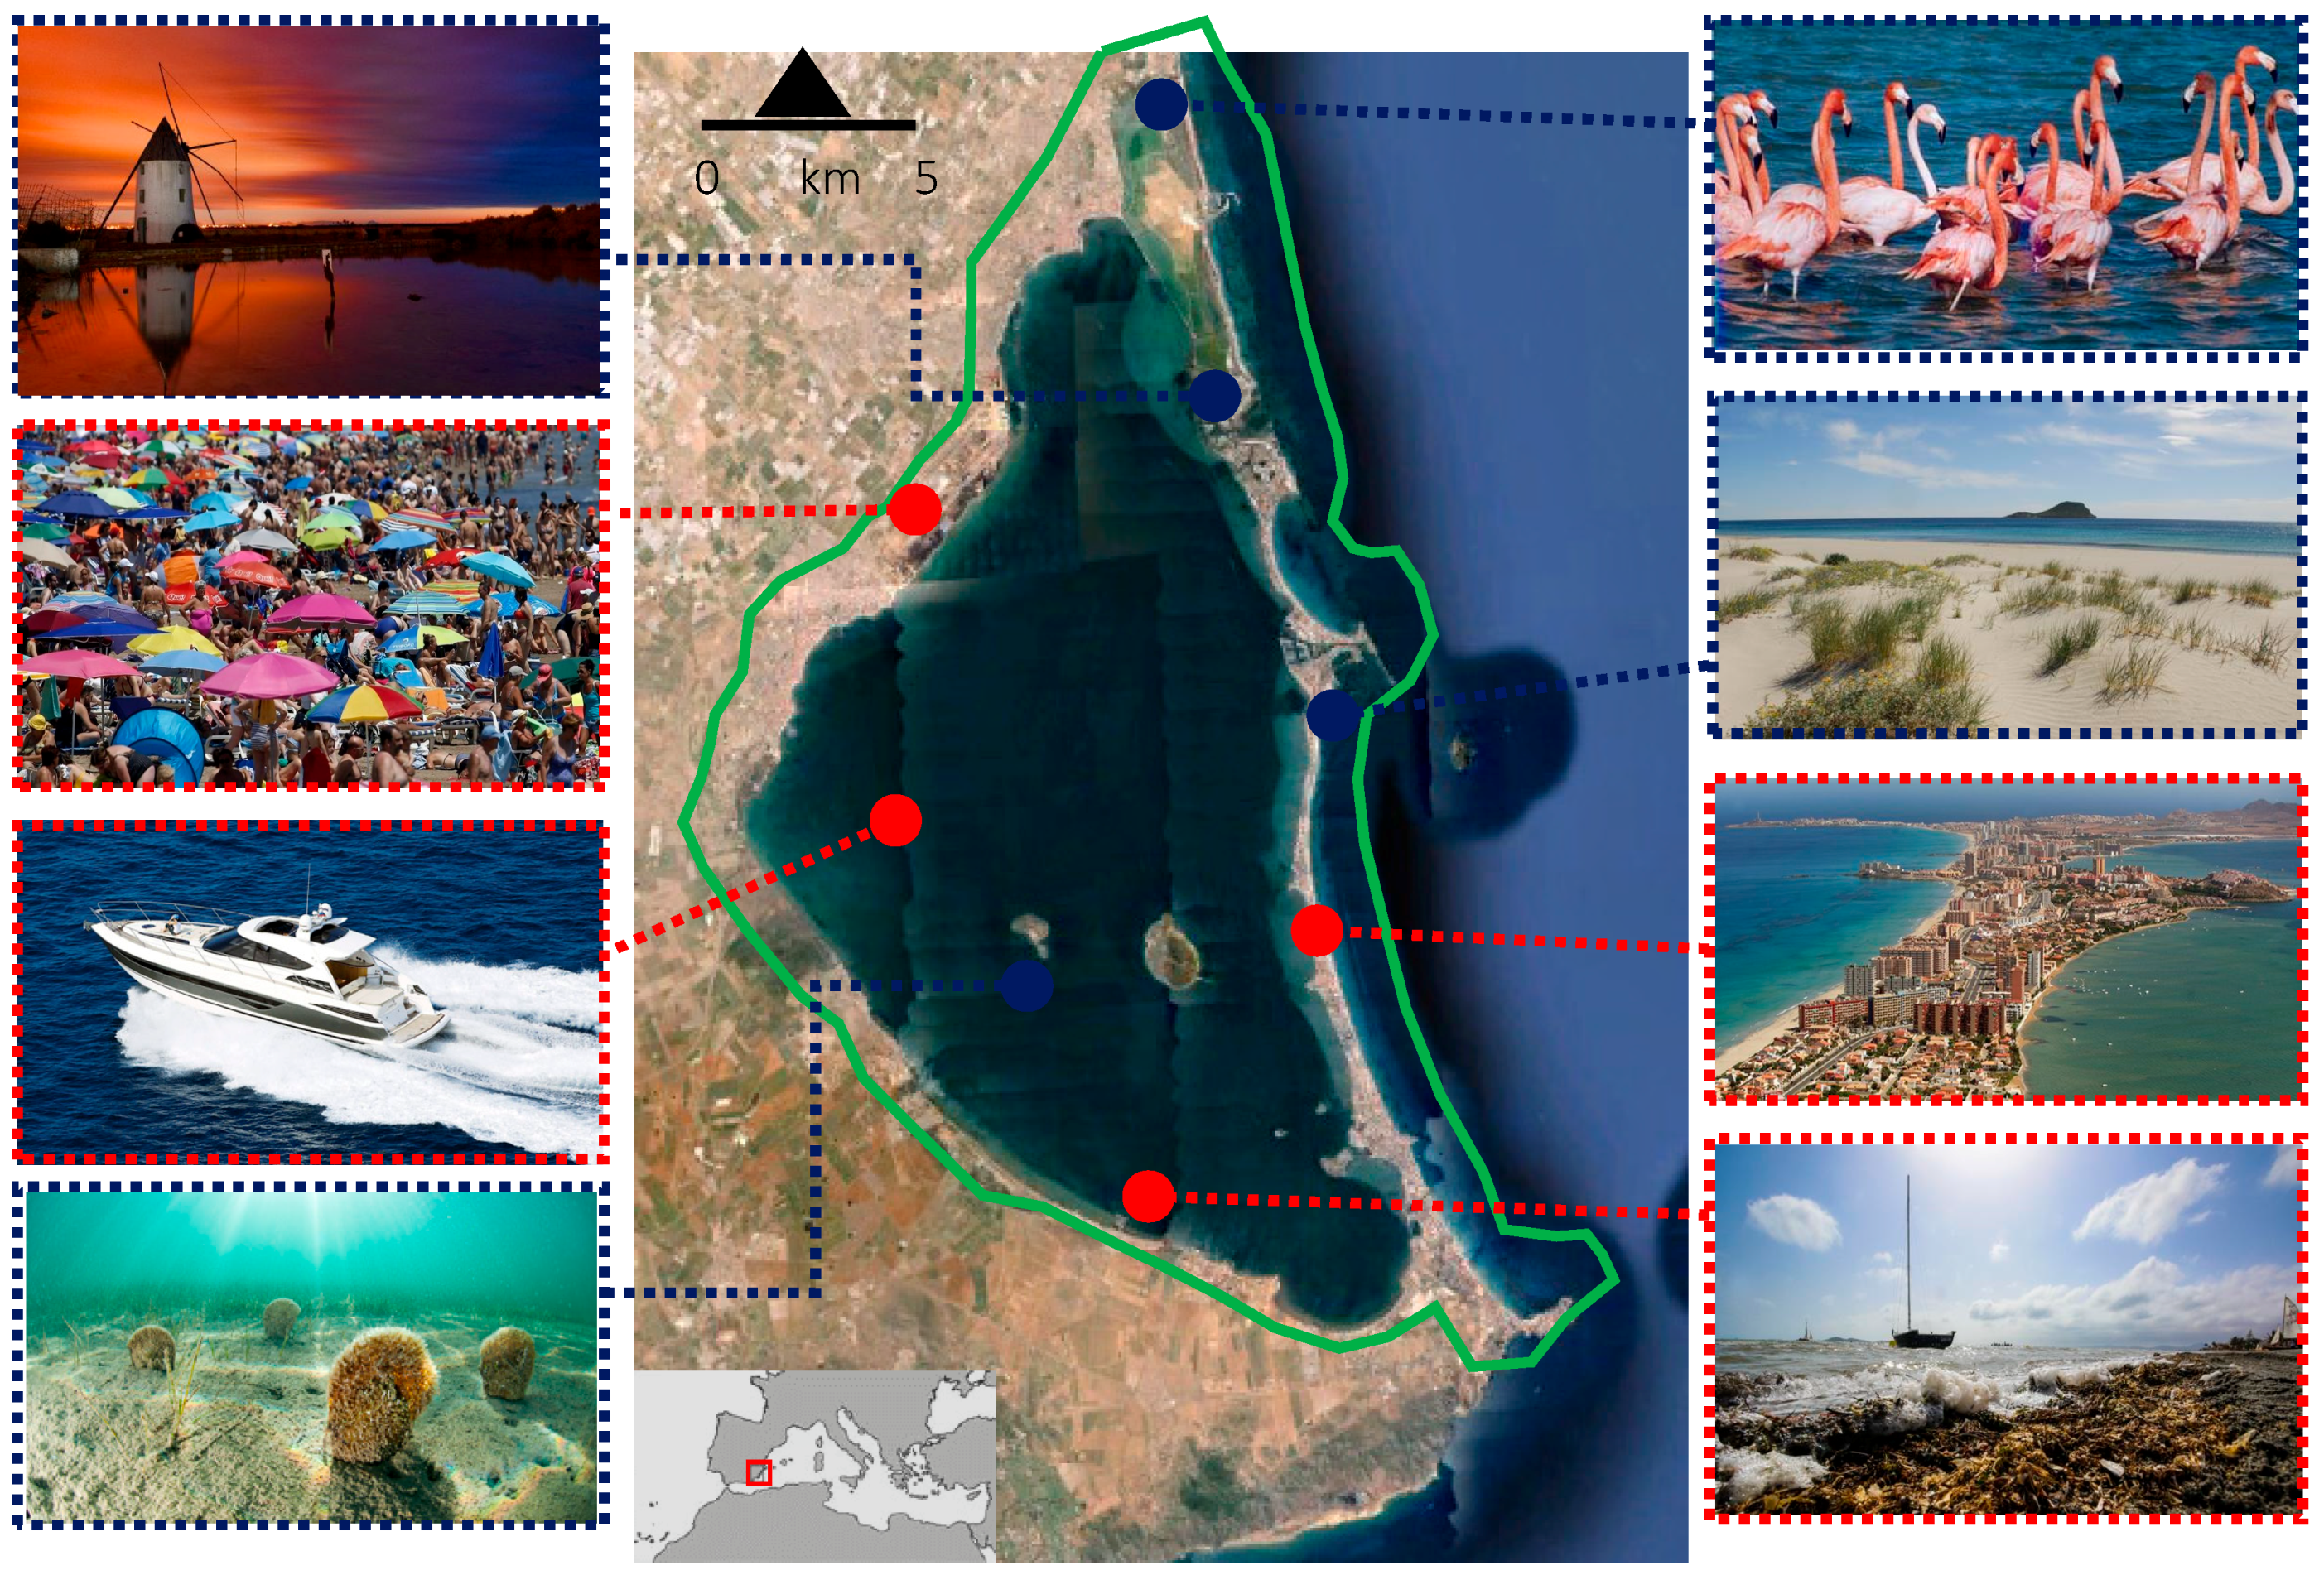
The urban transformation of the coastal perimeter with numerous hotels and second homes, the development of infrastructures such as roads and airports, the construction of ports on old natural beaches, or the proliferation of nautical activities in the marine and terrestrial environment form a set of effects whose global impact is difficult to measure (Figure 2). In this sense, the exposed methodology will be implemented to obtain an aggregate index of anthropization in this environment because of the tourist activity during the last 60 years.
3.2. Implementation of the Methodology
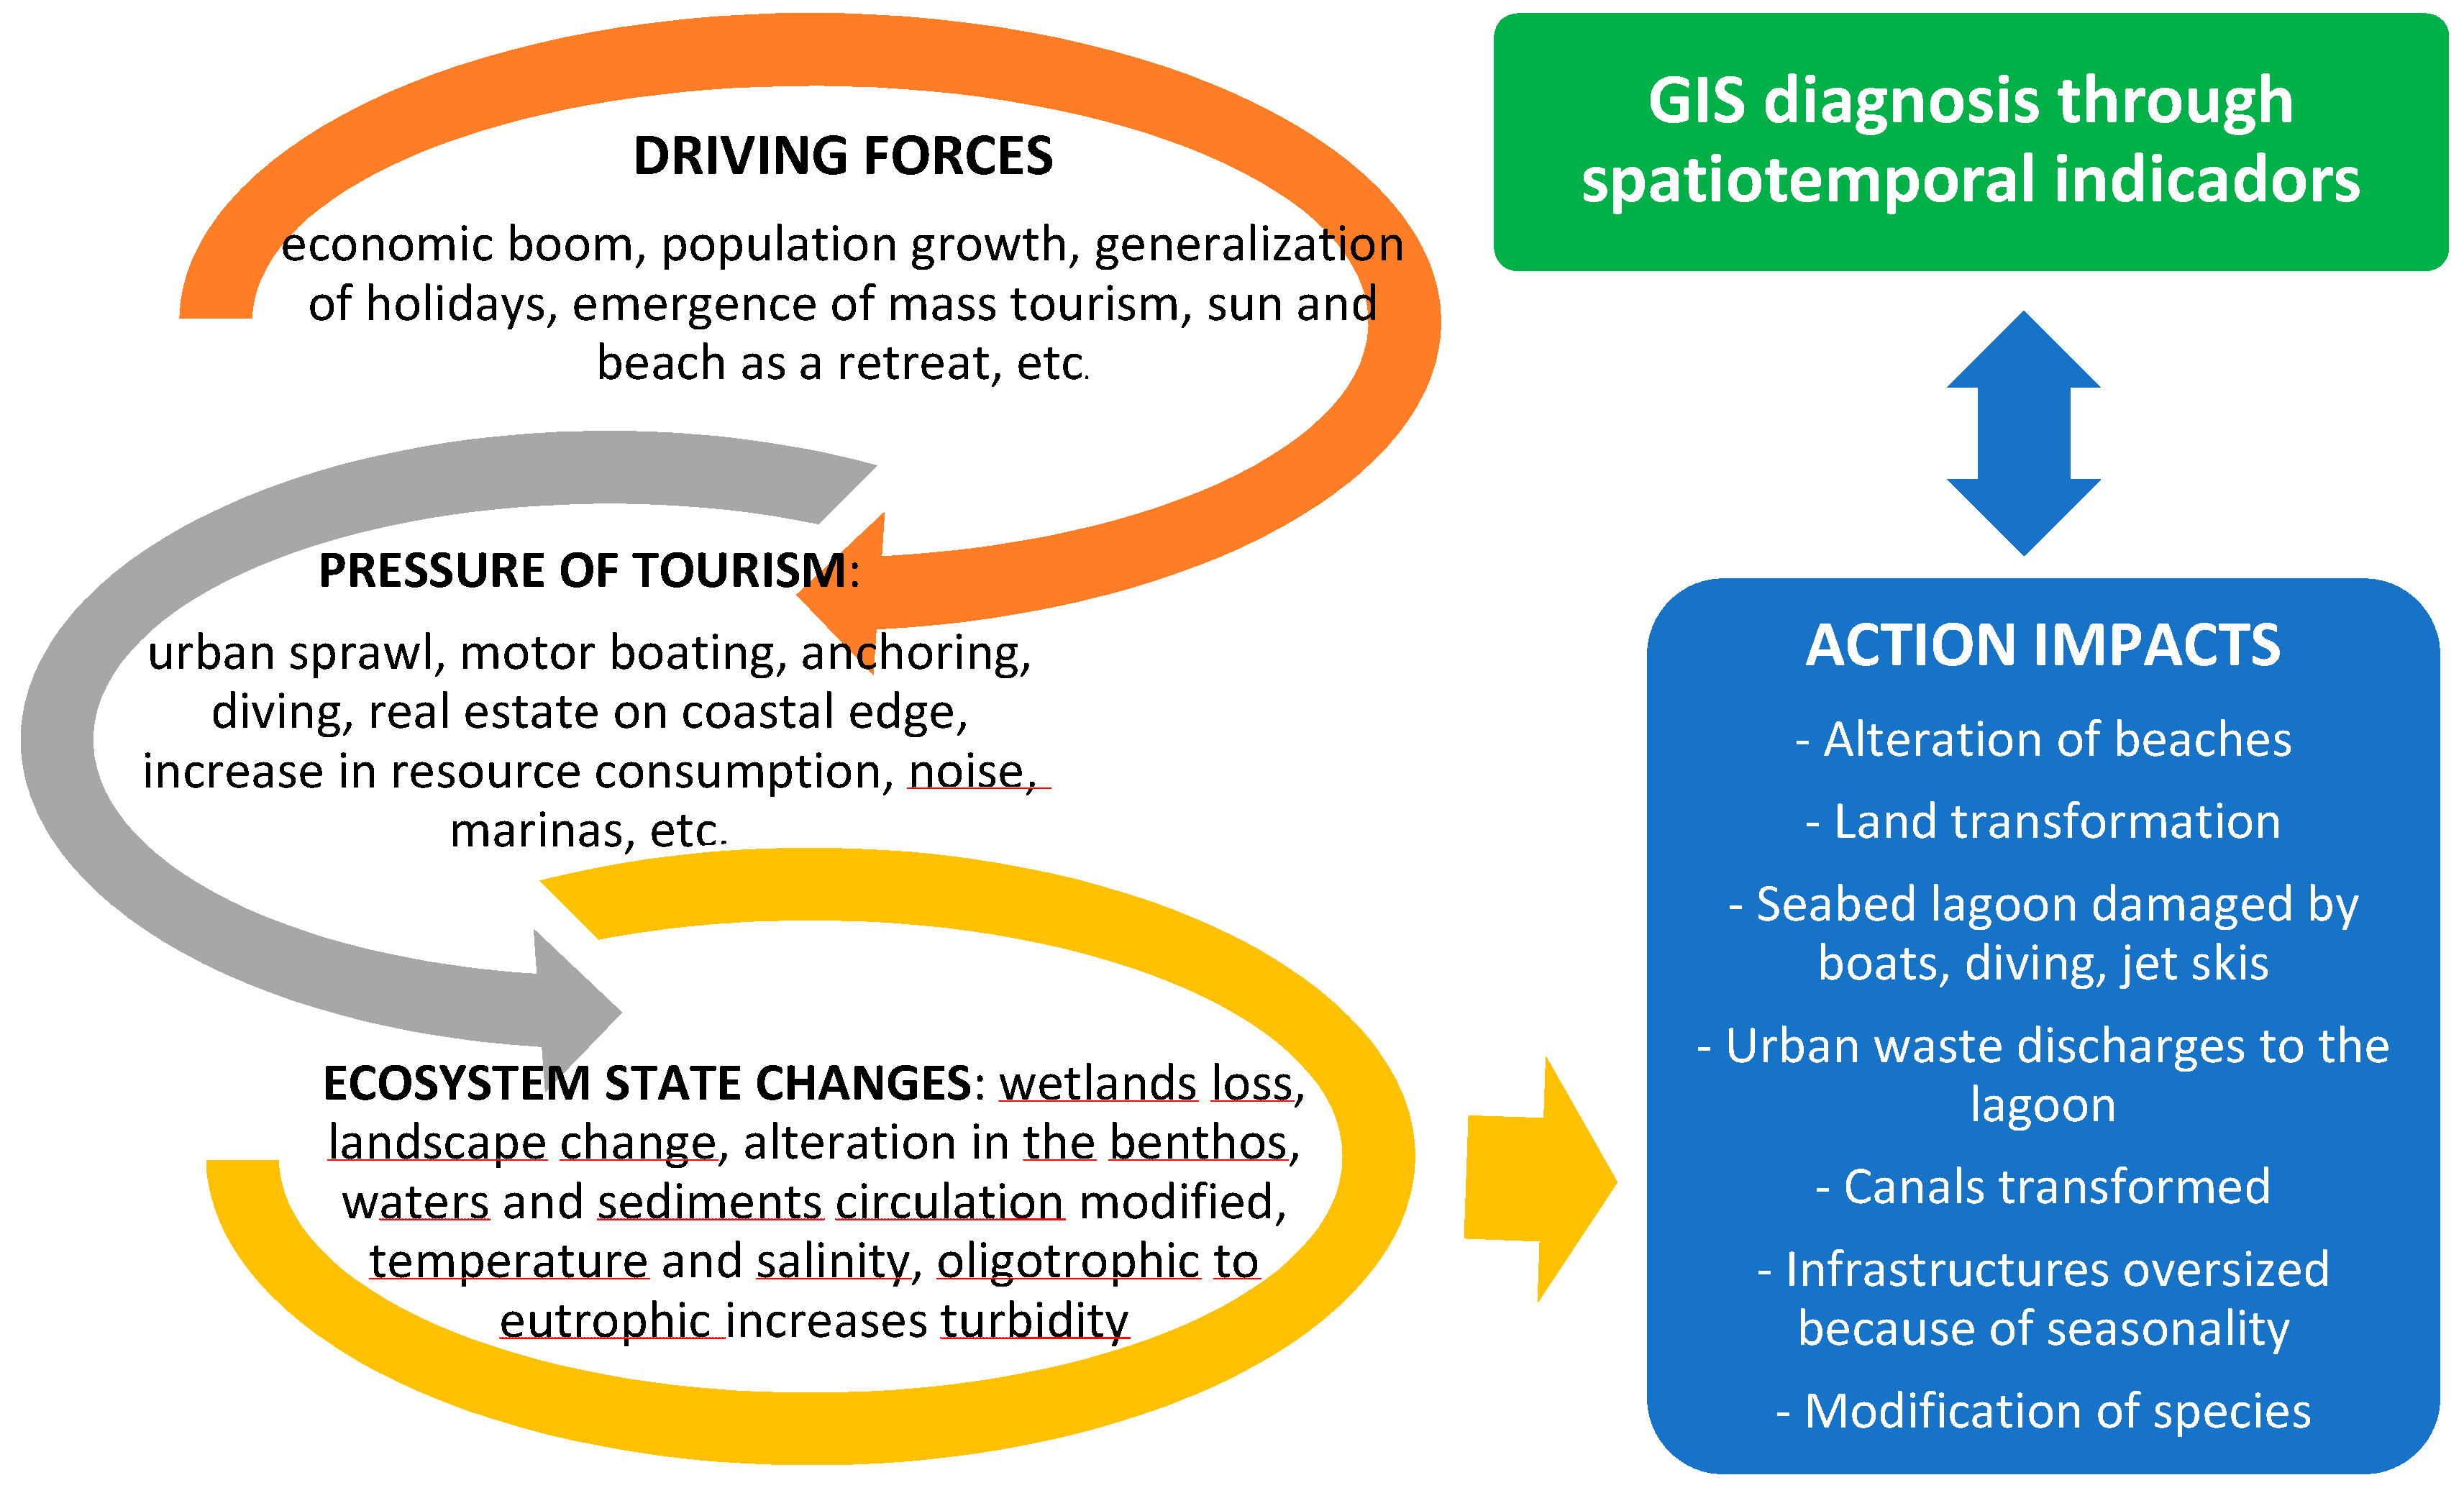
For the analysis and evaluation of the selected area, the proposed methodology will be applied. The development of the first phase will be carried out using a DPSIR (Driving force, Pressure, State, Impact and Response) diagnosis model based on various social-scientific surveys. It is an extension of the classic PSR model (Pressure, State, and Response) of the OECD (Organization for Economic Cooperation and Development) adapted to the specific conditions of the territory in which very diverse economic activities linked to tourism converge.
Such an approach is especially applicable for this case study because it is an area that has a dual character. On the one hand, it is a technically complex and sensitive environment subjected to diffuse anthropization in which very diverse scientific disciplines (urban planning, coastal dynamics, biology, etc.) converge. On the other hand, it is a territory that its inhabitants socially value very highly where a varied number of stakeholders linked to tourism act. In this sense, different surveys have been conducted among stakeholders from scientific and social spheres, distributing the weight of their responses to 50% for the development of the indicators given this “socio-ecological” character of the global problem of anthropization. The stakeholders consulted are reflected in Table 1.
The DPSIR diagnosis of this first phase (Figure 3) yielded different problems channeled into numerous actions (see the actions finally selected with their weighted scores in the results section). These actions focused mainly on the issues arising from the transformations related to the urbanization (intensive construction on the coastal perimeter, disappearance of natural areas, tourist overcrowding in summer, traffic jams, etc.) and the alteration of beaches (retraction of beaches in some areas, accumulation of sludge with bad smell in others, loss of environmental or landscape values in some dune areas, etc.). To a lesser extent, stakeholders cited the impact on the ecosystem of tourist recreational activities (seabed and marine species affected by the use of powerful motor boats, nautical activities, diving, etc.) and the widening of the canals for navigation. To globally cover all these issues, this set of actions has been parameterized through the following four GIS indices, according to the approach described in Equations (2)–(4).
3.2.1. Index of Tourist Urbanization (ITU)
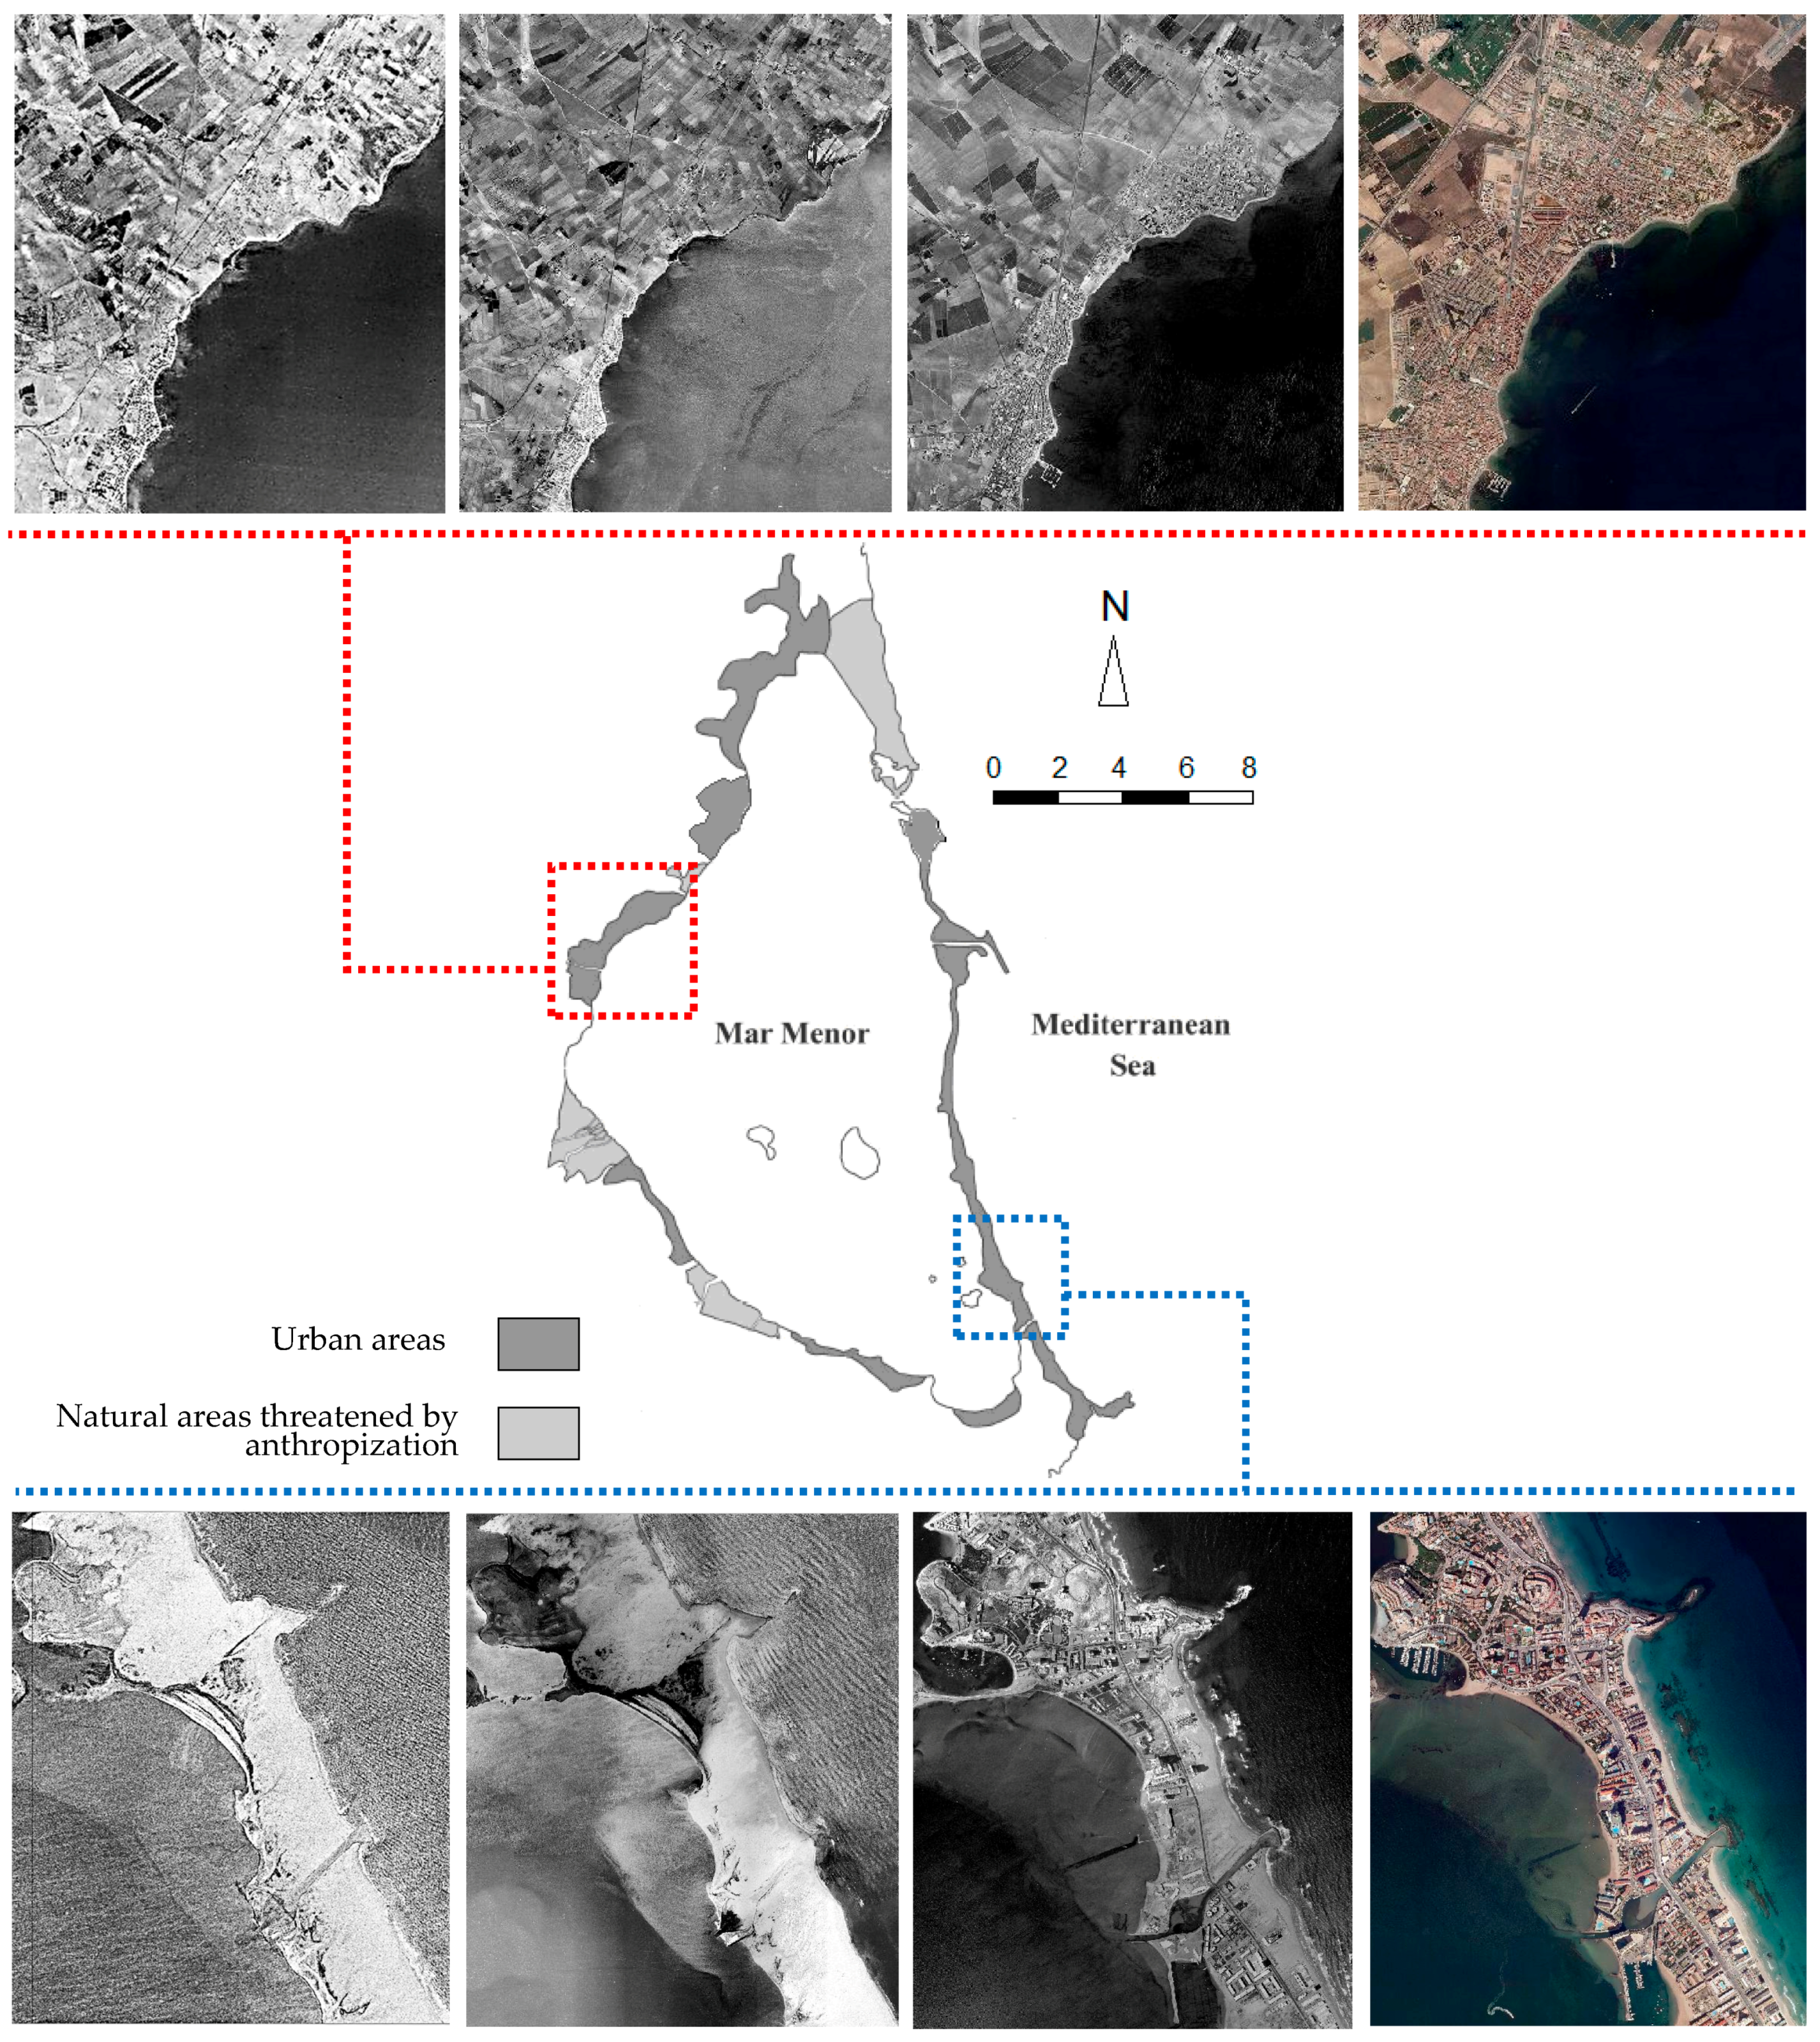
This index includes the phenomena of land transformation associated to tourist activity in the area. On the one hand, it includes the transformation of natural soil (dune spaces, agricultural areas, etc.) necessary for the development of tourist resorts since the mid-1950s. On the other hand, it also contains the urban sprawl of pre-existing coastal settlements during the last 60 years because of mass tourism. For this phenomenon, urban areas located up to 2 km from the coast have been considered.
Calculation method: The natural surface area transformed urbanistically by buildings or affected by the development of infrastructures is calculated against the whole of the reference surface area in a buffer of 2 km in the coastal perimeter since 1956.
with ST being the surface area transformed by new tourist resorts (ST1) and coastal urban sprawl (ST2) processes since 1956 in a coastal buffer of 2 km (in Ha) and SU the analyzed reference surface area (in Ha, Figure 4).
3.2.2. Beach Alteration Index (IBA)
Beaches are usually natural environments that are very affected by anthropization derived from mass tourism. In developed countries, these are areas that do not usually suffer serious direct transformations due to land urbanization now, but they are subjected to the indirect action of breakwaters or port infrastructures for example. These elements alter the sedimentary dynamics of the coast, modifying the natural profile of the beaches. This phenomenon is what causes impacts such as the loss of sand or the accumulation of mud on beaches.
Calculation method: Quotient between the beach surface area transformed by the alteration of the dune profile due to non-natural causes and the total beach area. Non-natural causes are understood as being all those that do not respond to meteorological phenomena from nature (wind storms, water floods, waves, etc.).
with being the sum in absolute value of increases or decreases in beach areas due to non-natural causes between 1956 and 2016 and the total surface area of the i existing beaches in the analyzed territory.
3.2.3. Index of Recreational Pressure (IRP)
The modeling of anthropization linked to the pressure exerted on the ecosystem as a whole by recreational activities associated with tourism is the most difficult action to implement as a GIS indicator. This effect has less weight than the previous two since its anthropic effect is mainly focused on the coastal lagoon of the Mar Menor (its effect is much smaller in the Mediterranean Sea). Due to the idiosyncrasy of the territory (a coastal lagoon with 10 marinas in its perimeter) and the existence of numerous actions from Phase 1 with direct and indirect correlation to the number of existing boats, this parameter may theoretically be a good indicator. On the one hand, we must bear in mind that this parameter has a direct correlation with several of the variables that affect the seabed (motor boats, nautical activities, diving, etc.). On the other hand, it also has an indirect link to the set of pressures related to the whole set of recreational activities derived from tourism (traffic pollution, waste generation, massification of beaches, etc.).
Therefore, an indicator that refers to the evolution of the quantity of boats in the lagoon over its whole surface may be interesting to model these anthropizing actions. However, we must consider what is stated in the Methodology Section on not implementing parameters that generate disproportionate indicators or of a different order of magnitude from the existing ones. For this reason, in order not to generate an unbalanced model, this GIS indicator has been implemented evaluating the increase in the surface area of existing vessels per km2 of the lagoon. This formulation is more precise than simply analyzing the number of boats per km2, since it discriminates between small boats (usually sail and low draft vessels that do not affect the seabed) and large ones (with motor and dragging capacity along the seabed). It has also differentiated between those ships located in a port with reduced impact and those anchored in the lagoon (the latter damage the seabed much more by usually anchoring irregularly to the bottom with heavy elements that creep in the storms).
Calculation method: Summation of selected average surface of small vessels (less than 6–7 m length) and large ones (greater than 6–7 m) per km2 of lagoon. The units located within the ports or in areas of regulated shelter with environmental control service compute at 50%:
with being the surface area of boats (in m2) considering their size and correcting their impact with the coefficient a as a function of their mooring place in the reference surface area (1 km2).
3.2.4. Water Exchange Index (IWE)
The widening and transformation of the canals could be considered an anthropic effect derived from the previous case, since its origin is fundamentally due to the need for large boats to navigate. However, this action has led to other anthropic effects, such as the “Mediterraneanization” of the Mar Menor, affecting its ecosystem (modification in the salinity, temperature, etc. of the lagoon’s waters). This second anthropic effect is thus not derived from the direct action of the recreational pressures of tourist activity but is rather an anthropic effect derived from another anthropic effect. Nevertheless, it is sufficiently interesting to constitute a GIS partial indicator in itself, which allows a global modeling of the current situation for the analyzed territory to be generated. Even so, this indicator will have a lower weight than the previous one because it is an effect derived from it and has been cited to a lesser extent by stakeholders in Phase 1.
with being the functions that model the exchange of water volume for each i canal existing on the date t2 and the functions that model the exchange of water volume for each i canal existing on the date t1. For the case study developed, t1 is 1929 or 1956 for some points of analysis. Due to the limitations of existing information to model h(x,y,z) for these dates of t1 (especially with regard to the drafts of the canals), the process has been simplified by calculating the surface area S(x,y) of the different canals. Even so, it is understood that this loss of precision does not represent an important impairment in the overall analysis model.
3.3. Results
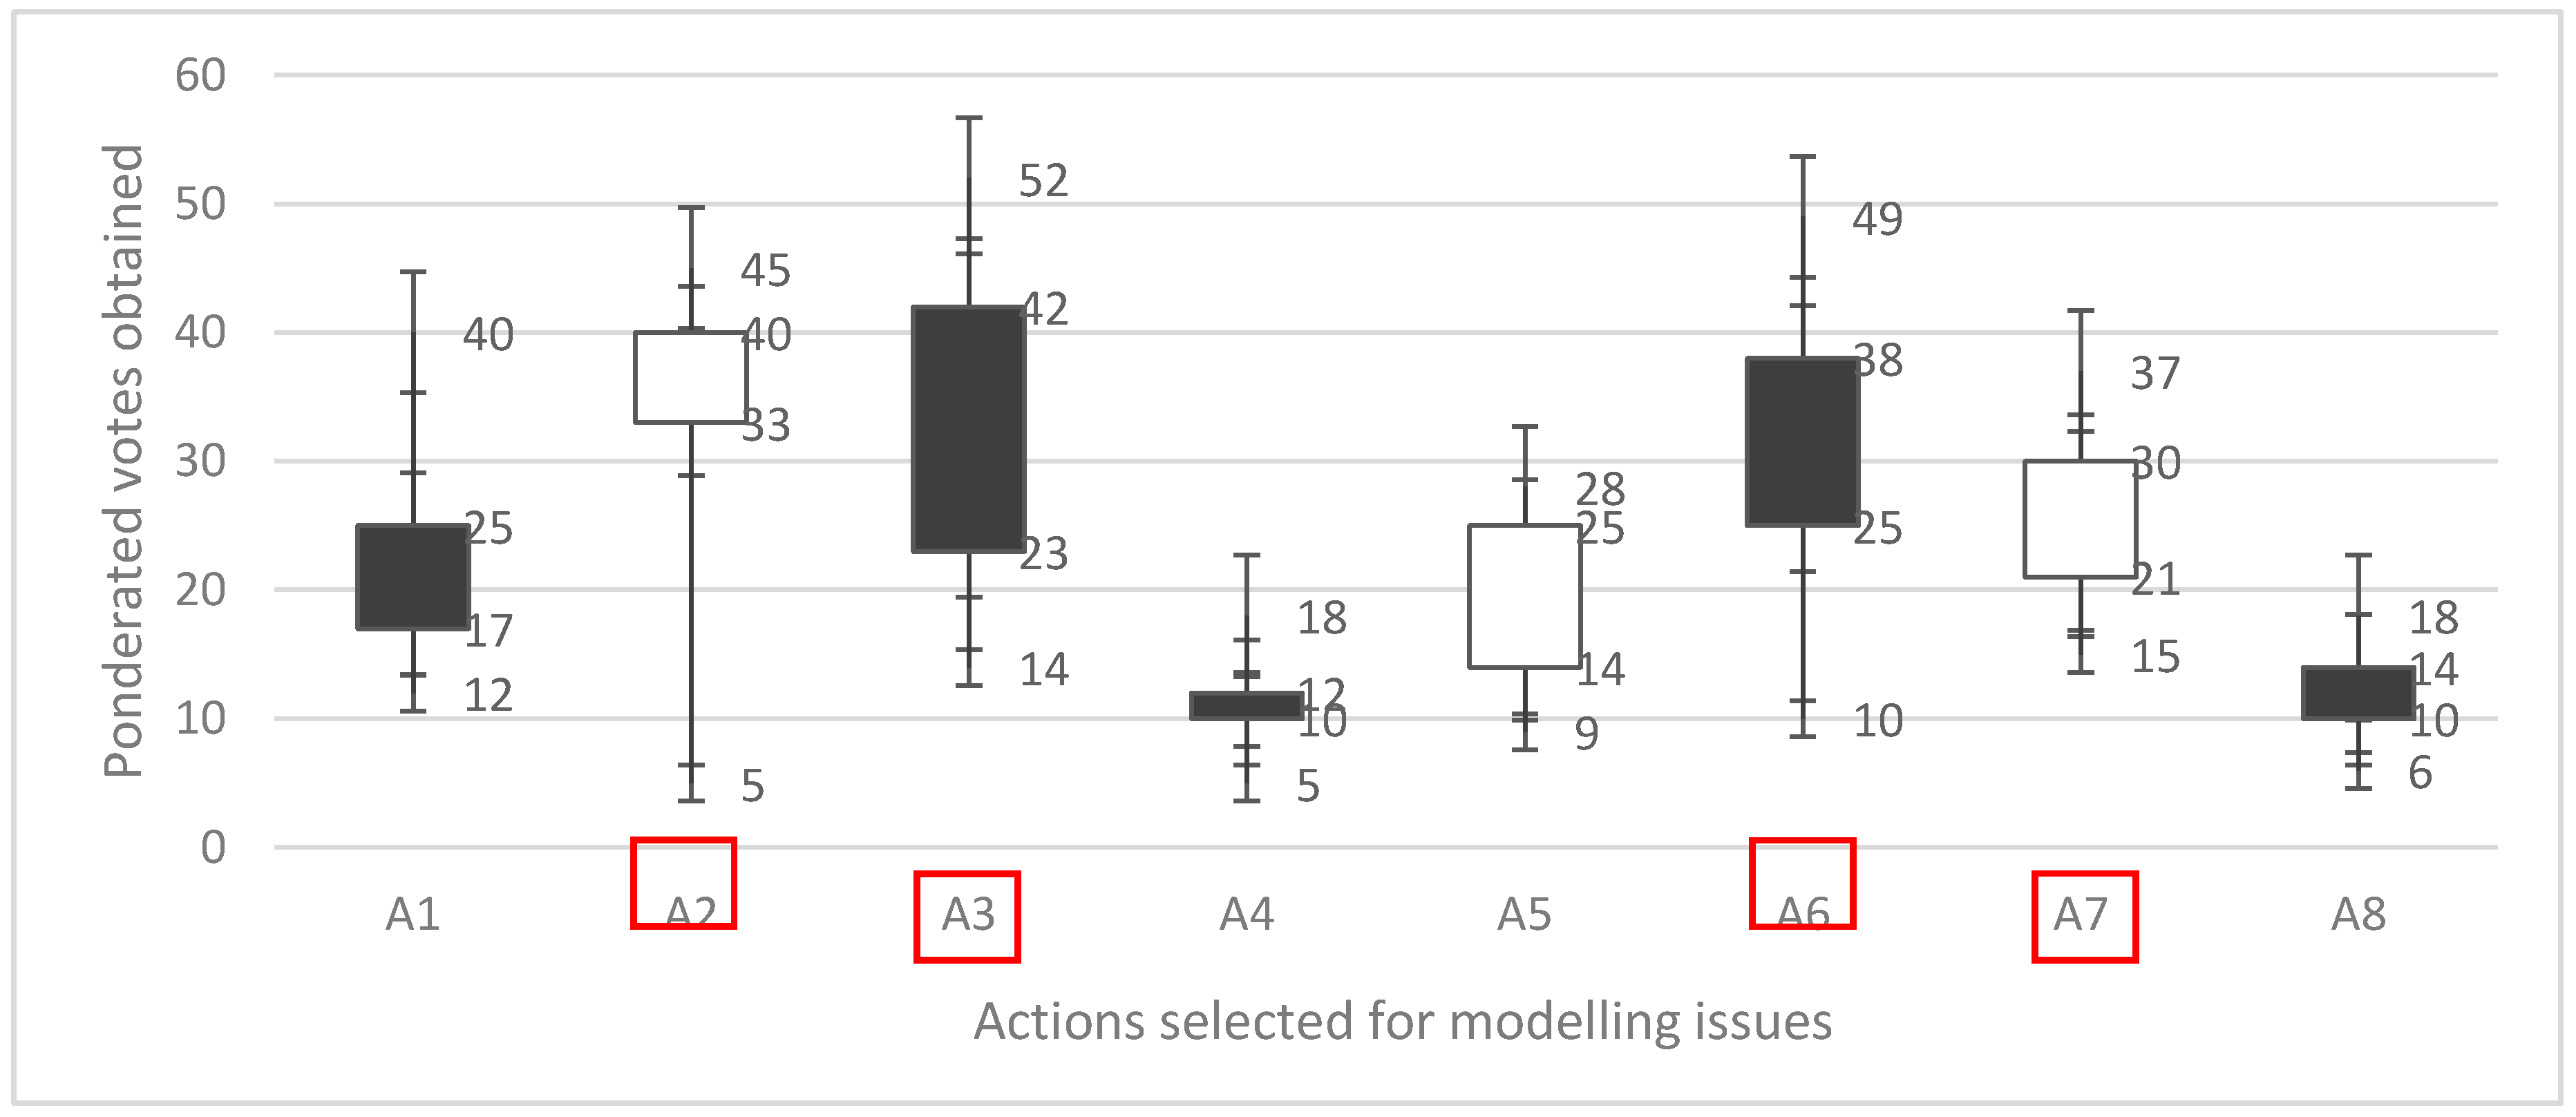
Adhering to the indications of the previous section, the following results have been obtained. First, the results of the DPSIR diagnosis adapted to the environmental conditions are shown to obtain overall model actions. To select them, the problems posed by the different stakeholders were grouped into eight possible actions: (A1) Discharge of urban waste to the lagoon; (A2) Massive urbanization of natural and agricultural land; (A3) Impact of recreational tourism activities; (A4) Extreme seasonality of tourist demand; (A5) Disappearance of native species and entry of invasive species into the flora and fauna; (A6) Landscape deterioration of beaches; (A7) Transformation of the canals; and (A8) Traffic problems and services. A summary of the results of Phase 1 is plotted in Figure 5.
These actions have been modeled as partial GIS indicators following the process described in the previous section. The indicators have been evaluated for three periods: 1929–1958 (period in which there was no tourism in the area), 1956–1980 (time of tourism development and beginning of mass tourism in the area) and 1980–2016 (development and consolidation of mass tourism in the area, see [41]). All the georeferenced mapping data were obtained from the geoportals Cartomur [42] and Sitmurcia [43], and their numerical analysis and treatment were carried out through the GIS program GvSIG version 2.3.1 (Asociación gvSIG, Valencia, Spain). The weighting coefficients have been calculated based on their statistical deviation from the average weight granted by the stakeholders in Phase 1 to each of the selected actions according to Equation (6) and using a normal distribution. The values of the global anthropization index of the territory analyzed for each of the dates have been calculated following the criterion established in Equation (7). The summary of the numerical results of partial indicators, weighting coefficients and global anthropization index for each of the three selected periods can be seen in Table 2.
From a preliminary analysis of the results obtained, several issues can be observed. First, it can be seen how the partial indicators and the value of the global index of anthropization have continually been growing over the years. During the first period corresponding to the stage without tourism, the indicators are very weak in all cases (all the indicators are <0.1). It is interesting to observe how there was a previous increase in the tourism urbanization index ITU during the second period, as a process prior to the rest of the indicators.
This can be interpreted as this phenomenon acting as a “catalyst” to the process of global anthropization. However, it can also be interpreted as being a consequence of the different periods of maturation in time of both types of phenomena (the processes of land transformation associated to tourism activity use were faster than those of alteration of the natural profile of the beaches, for example). What is clear is that with the arrival of mass tourism in the third period, all phenomena accentuate their behavior compared to the previous period (the ITU index increased by 65% while the IBA and IPR almost tripled). Thus, values were obtained which were generally much higher than the initial period (the ITU value has multiplied by 5, the IBA value by 7 and the IPR value by 17) when there was no tourism.
The IWE index deserves a special mention. This did not show a significant increase in the second period with the arrival of tourism (in both periods the index is <0.1). However, in the third period, it grew exponentially, multiplying by almost 7. Nevertheless, this phenomenon is possibly not associated with the intensification of ordinary tourism into mass tourism. It is more a consequence of the fact that it is not a direct index of an action but an index derived from the effect of another action. In this sense, no significant evolutions were observed in the second period, since the actions that give rise to the effects that later generate the actions that this index models are being developed at that moment (construction of ports and breakwaters for example). However, there is abrupt growth in the third period when catalyzing all the processes that give rise to this index (alteration of the canals).
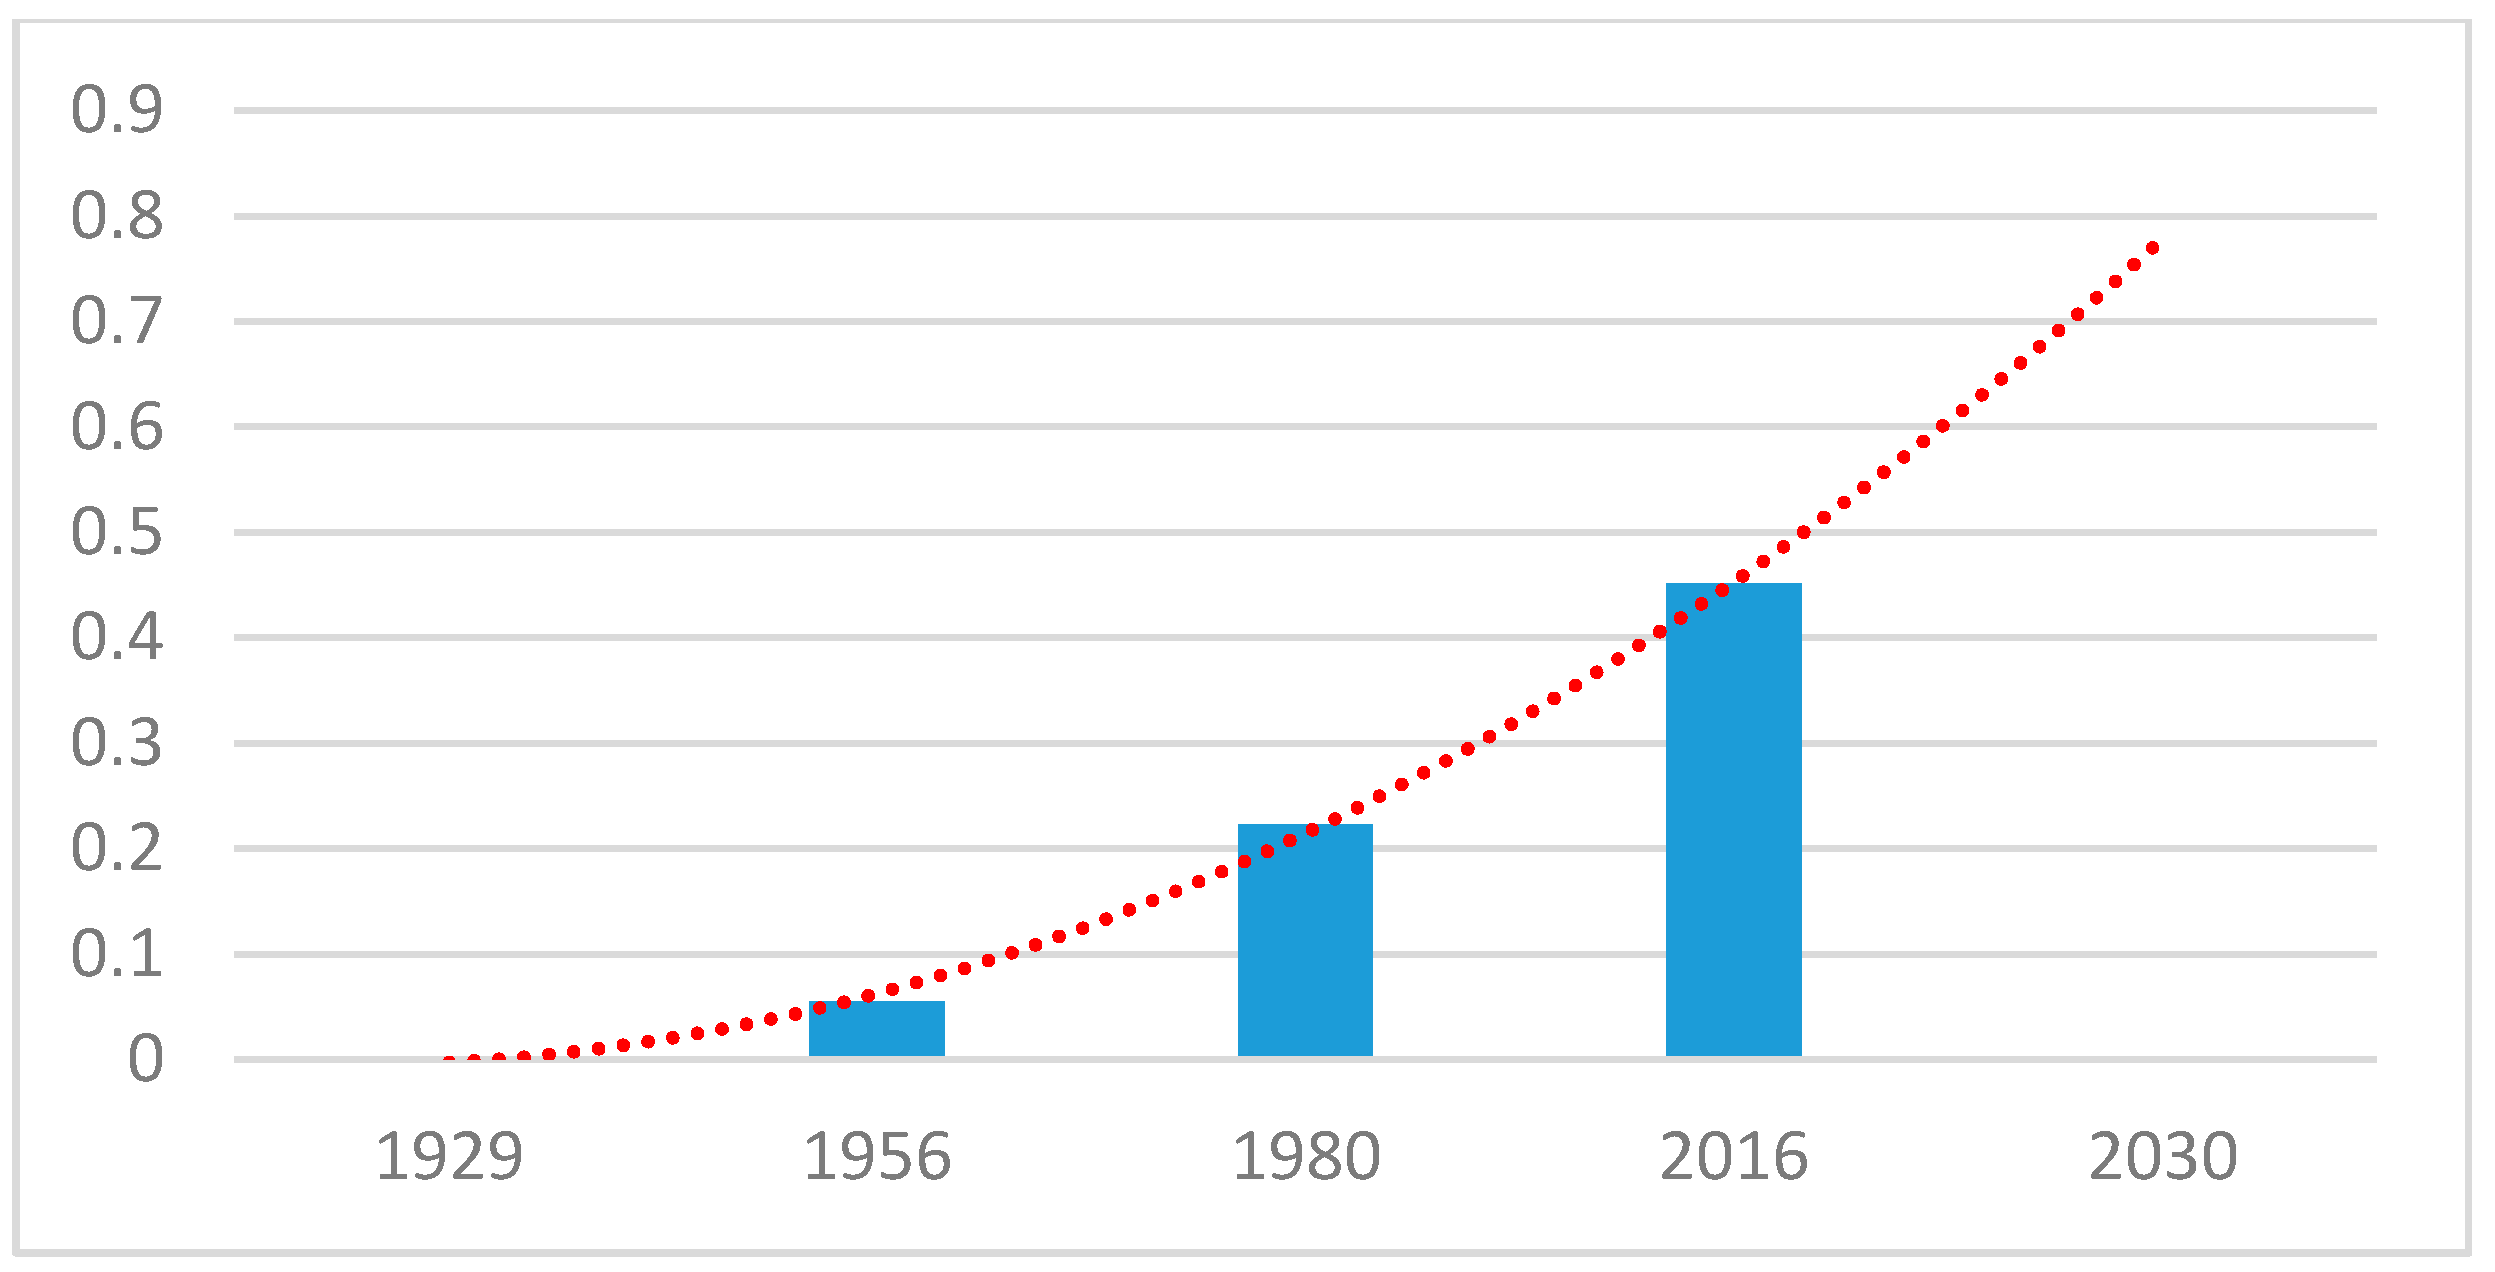
Finally, a general assessment of the process can be established through the global anthropization index . In this field, approximately linear growth sustained over time is observed, taking into account the duration of each of the periods. If we perform a polynomial adjustment to illustrate the current trend line, the scenario estimated for 2030 is a cause for concern, with this area reaching a global anthropization rate of almost 80% if things remain within these parameters (Figure 6).
4. Discussion and Conclusions
The results obtained on the anthropic inertia of the analyzed environment are a priori worrying but also require a certain reflection on the scope and limitations of the work, both from a general point of view and at a particular level of this study. At the particular level, it should be noted that there have already been several studies in this territory warning about the effect of discharges of urban pollutants [44,45]; contributions of nitrates to the lagoon from agriculture [46,47]; the increasing exchange of water between the lagoon and the Mediterranean [48]; degradation of the wetlands landscape [49]; urban problems derived from the seasonality of the tourism sector [50]; or environmental impacts on the ecosystem linked with the alteration of marine [51,52] and terrestrial species [53], among others. However, the approach carried out thus far has always been considered from a uni-disciplinary point of view associated with the field of study of each research (biology, ecology, chemistry, urban planning, oceanography, etc.). This limits the possible understanding of the global phenomenon, and prevents a complete vision of the real situation of this coastal area today.
It is in this sense that the approach made, based on an assessment of the diffuse anthropization global process associated to tourist activity through GIS indicators is more interesting. On the one hand, the concept of global anthropization allows us to propose a multidisciplinary approach necessary in cases of a complex nature such as this one. On the other hand, the implementation of GIS methodologies by means of indicators allows the process to be quantified objectively and numerically, and to propose future scenarios in threatened fragile environments. In this case, the progress of the anthropization process in the area has been objectively quantified, and it has been possible to estimate the worrying future scenario that it poses. However, the approach taken has certain limitations in its scope that must be considered.
To begin with, one should be cautious about modeling the impact of recreational activities in the lagoon. In this case, the parameter of the number of boats has been used taking into account their size since it is assumed that larger vessels affect the lagoon more than small ones do. Maybe it would be advisable to discriminate between sailing and motor vessels, since again presumably the latter have a greater impact on the seabed. Even so, this last approach could also be debatable, since no conclusive scientific studies have been found in this matter. In addition, it is also true that many motor boats basically “skim” across the surface of the water (especially jet skis). Therefore, their impact on the seabed may in fact be even lower than that of a traditional large-draft vessel (although even in this case one could then consider the effects on the ecosystem of other aspects such as noise or waves, for example).
Another factor that should be studied in greater detail is the question of alterations in beaches and the exchange of water between the lagoon and the Mediterranean Sea. In the former case, the work carried out only deals globally with transformations linked to beach increments or decreases to model anthropization, while the causes and consequences of neither of the two are studied. To understand these impacts and their severity, it would be necessary to analyze the link between past actions and present-day effects. An interesting line of research that could be the subject of future studies would be the analysis of the origin and future risks of the retractions in the beaches or the accumulation of sludge on them as a consequence of the development of marinas and breakwaters.
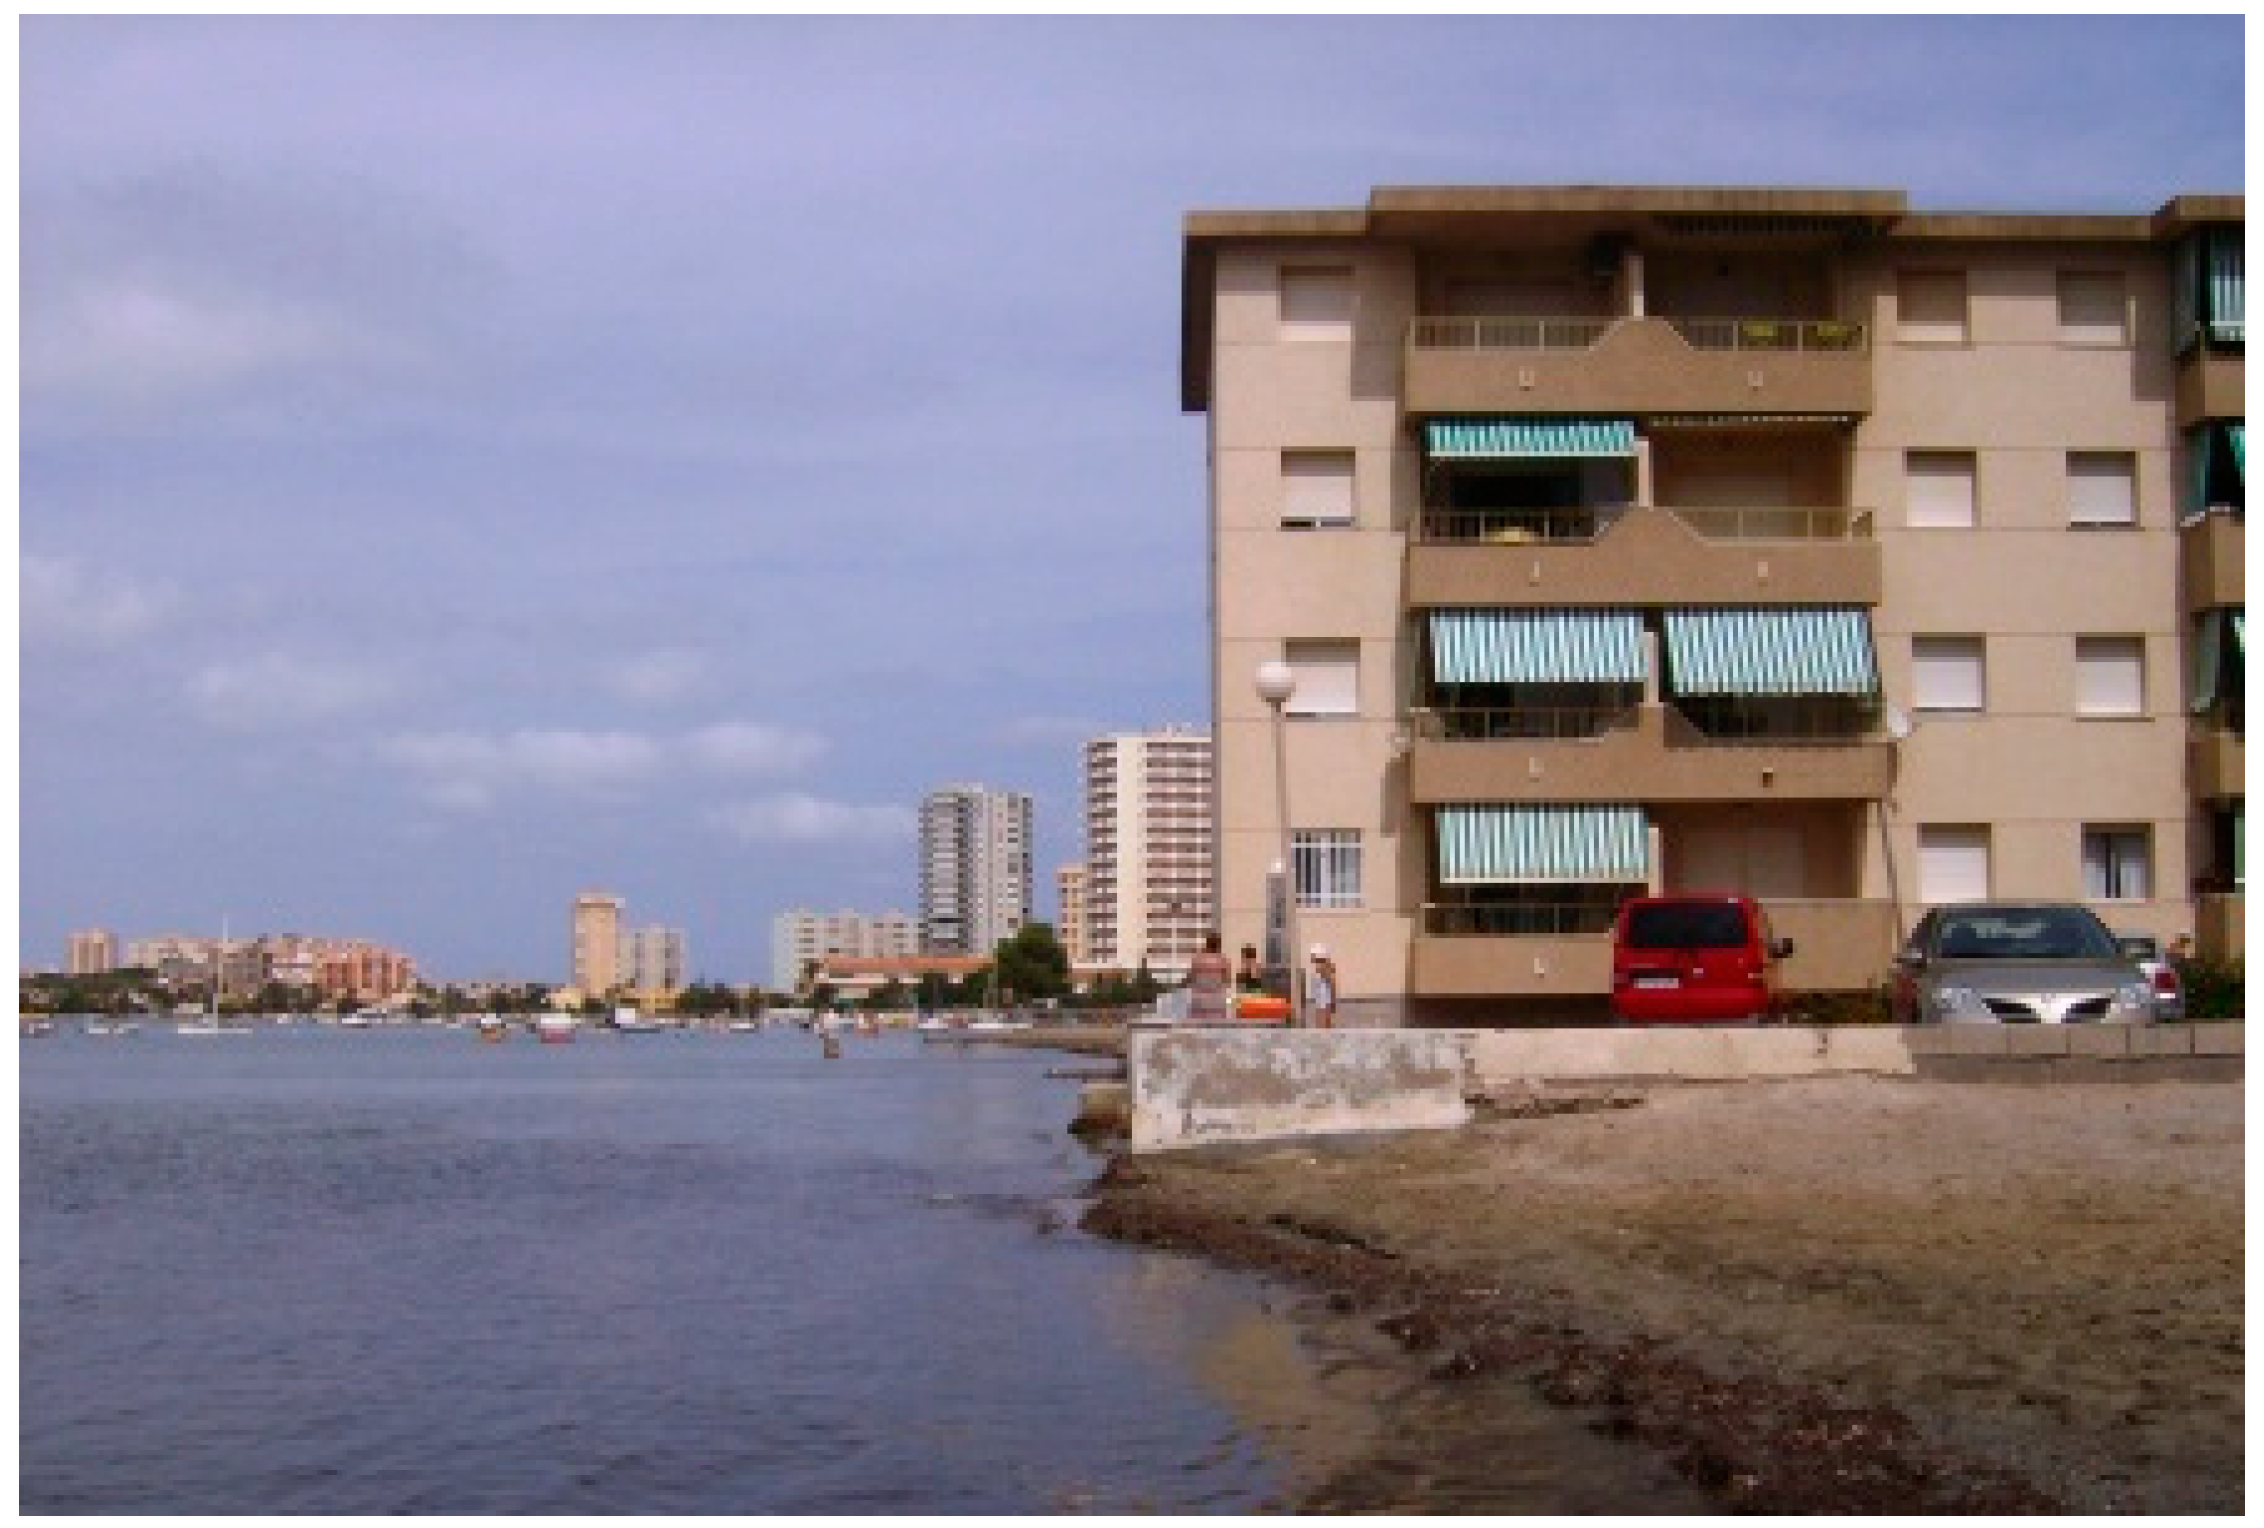
In this field, an interesting question that seems to emerge from the retrospective GIS analysis carried out, but that could not be addressed in this work, is the possible linkage and even feedback of the phenomenon of beach retraction with other indicators, such as water exchange IWE or the urbanization ITU. For example, an issue that seems to arise from the analyses carried out in the old sand strip that separates the Mar Menor from the Mediterranean Sea is how its urbanization process has modified the profile of the beaches. This area, called “La Manga” and now intensely urbanized, has possibly generated a “screen effect” with its buildings. The “screen effect” has led to the traditional sand feeding by the prevailing easterly winds of its beaches on the Mar Menor side from the Mediterranean Sea to become impossible. This question is surely behind many of the problems of extreme retraction of beaches that currently concern the population in that area (Figure 7).
Another cross-linked effect may be the controversial phenomenon of the canals analyzed with the IWE indicator. It has been paradoxically found during the analysis performed that some of these channels have widened and deepened over the years, while others have been losing depth and surface area. Moreover, this study did not completely clarify if their anthropization during the last period was due to the direct action of man or if it is indeed derived from the effect of another action delayed in time. The first case is complicated because since the 1990s environmental regulations in Spain have become more stringent, making the transformation or dredging of these elements difficult. The second possibility requires studying possible crossed links or feedback with other phenomena such as sedimentary dynamics of closed areas to the canals. Possibly the cross effect of coastal dynamics in these areas is fed by the alteration of nearby beaches whose sand ends up moving these channels over the years. In any case, it is also an interesting line of research to address in the future both in its causes and its consequences.
Finally, at a general level, it is necessary to reflect on the limitations and the possible application of this methodology to other territories. In this sense, we must not lose sight of the fact that the purpose of this study was to present a methodology which is able to objectively measure the complex process of diffuse anthropization of a territory as a consequence of tourist activity, and to implement it in a case study. This methodology also allows, as shown, to propose future scenarios. However, it may also have other different applications, such as enabling a comparative analysis between different territories to be performed. In this case, the development of this last approach would require a different study from that performed, in which, for example, a comparative analysis of the recent evolution of several coastal case studies in different countries (but with theoretically similar anthropization problems) would be carried out.
In this context, the limitations when evaluating the obtained data must also be considered. Obviously, there is always a limitation in relation to the important requirement of georeferenced information to design models that are robust and representative of the phenomenon of global anthropization. In this aspect, it is important to differentiate those limitations that simply reduce the accuracy of the analysis (such as the simplification performed to evaluate IWE), of those problems that may question the representability of the phenomenon in the model. Apart from this question, the presented methodology also poses certain limitations to be considered in terms of the contextualization of its results. In this field, the value of an individual parameter in itself, although it is dimensionless between 0 and 1, should not be interpreted automatically as a numerical level of quantification of a problem. For example, the value of 0.4511 for the global anthropization index can therefore be much or little depending on how the territory is contextualized.
What is unequivocal in a case study is for example the comparative trend analysis of the territory if it is developed with a balanced model according to the article criteria. In the case analyzed, the value obtained from the index of global diffuse anthropization, for example, does in fact reflect a worrying situation since it rises from 0.0655 in the absence of tourism activity to 0.2229 with the development of it, and further increases to 0.4511 due to the derivation of the territory to mass tourism. This situation occurs under contour conditions and homogeneous periods of time and also warns of the danger of reaching very high levels (in relative proportion to the initial) of the global index of diffuse anthropization of the territory studied in 2030.
As indicated above, another very different approach to the article could have been to present an analysis at the present time of three or four different coastal territories subject to the anthropizing effect of tourism. In this case, the value of 0.4511 for example of the global anthropization index of a territory submitted to a homogeneous and balanced modeling together with other similar cases would be rather high or low, depending on the relative values obtained in the other cases.
Supplementary Materials
The following are available online at https://www.mdpi.com/2071-1050/10/5/1344/s1. The delimitation of the areas analyzed has been included as GIS Supplementary Data.
Funding
This research received no external funding.
Conflicts of Interest
The author declares no conflict of interest.
References
- Salvati, L.; Zitti, M.; Sateriano, A. Changes in city vertical profile as an indicator of sprawl: Evidence from a Mediterranean urban region. Habitat Int. 2013, 38, 119–125. [Google Scholar] [CrossRef]
- De Andrés, M.; Barragán, J.M.; García, J. Relationships between coastal urbanization and ecosystems in Spain. Cities 2017, 68, 8–17. [Google Scholar] [CrossRef]
- García-Ayllón, S. La Manga case study: Consequences from short-term urban planning in a tourism mass destiny of the Spanish Mediterranean coast. Cities 2015, 43, 141–151. [Google Scholar] [CrossRef]
- García-Ayllón, S.; Miralles, J.L. The environmental impacts of land transformation in the coastal perimeter of the Mar Menor lagoon (SPAIN). Int. J. Des. Nat. Ecodyn. 2014, 9, 109–128. [Google Scholar] [CrossRef]
- Lai, S.; Leone, F.; Zoppi, C. Anthropization Processes and Protection of the Environment: An Assessment of Land Cover Changes in Sardinia, Italy. Sustainability 2017, 9, 2174. [Google Scholar] [CrossRef]
- Deter, J.; Descamp, P.; Ballesta, L.; Boissery, P.; Holon, F. A preliminary study toward an index based on coralligenous assemblages for the ecological status assessment of Mediterranean French coastal waters. Ecol. Indic. 2012, 20, 345–352. [Google Scholar] [CrossRef]
- Rova, S.; Pranovi, F.; Müller, F. Provision of ecosystem services in the lagoon of Venice (Italy): An initial spatial assessment. Ecohydrol. Hydrobiol. 2015, 15, 13–25. [Google Scholar] [CrossRef]
- Lima Magalhães, J.L.; Lopes, M.; Lima de Queiroz, H. Development of a Flooded Forest Anthropization Index (FFAI) applied to Amazonian areas under pressure from different human activities. Ecol. Indic. 2015, 48, 440–447. [Google Scholar] [CrossRef]
- Reale, R.; Magro, T.C.; Ribas, L.C. Measurement and analyses of biodiversity conservation actions of corporations listed in the Brazilian stock exchange’s corporate sustainability index. J. Clean. Prod. 2018, 170, 14–24. [Google Scholar] [CrossRef]
- Falcone, J.A.; Carlisle, D.M.; Weber, L.C. Quantifying human disturbance in watersheds: Variable selection and performance of a GIS-based disturbance index for predicting the biological condition of perennial streams. Ecol. Indic. 2010, 10, 264–273. [Google Scholar] [CrossRef]
- García-Ayllón, S. Retro-diagnosis methodology for land consumption analysis towards sustainable future scenarios: Application to a Mediterranean coastal area. J. Clean. Prod. 2018. [Google Scholar] [CrossRef]
- Dias, J.A.; Cearreta, A.; Isla, F.I.; Michaelovitch de Mahiques, M. Anthropogenic impacts on Iberoamerican coastal areas: Historical processes, present challenges, and consequences for coastal zone management. Ocean Coast. Manag. 2013, 77, 80–88. [Google Scholar] [CrossRef]
- Mata-Lara, M.; Garza-Pérez, J.R.; Aranda-Fragoso, A.; Alfonso de Almeida, P.S. Social alienation and environmental decline in a coral reef: Challenges to coastal management in the Mexican Caribbean. Ocean Coast. Manag. 2018, 155, 30–39. [Google Scholar] [CrossRef]
- Barot, S.; Yé, L.; Abbadie, L.; Blouin, M.; Frascaria-Lacoste, N. Ecosystem services must tackle anthropized ecosystems and ecological engineering. Ecol. Eng. 2017, 99, 486–495. [Google Scholar] [CrossRef]
- Perni, Á.; Martínez-Paz, J.M. Measuring conflicts in the management of anthropized ecosystems: Evidence from a choice experiment in a human-created Mediterranean wetland. J. Environ. Manag. 2017, 203, 40–50. [Google Scholar] [CrossRef] [PubMed]
- Nogueira, V.L.R.; Rocha, L.L.; Colares, G.B.; Angelim, A.L.; Normando, L.R.O.; Cantão, M.E.; Agnez-Lima, L.F.; Andreote, F.D.; Melo, V.M.M. Microbiomes and potential metabolic pathways of pristine and anthropized Brazilian mangroves. Reg. Stud. Mar. Sci. 2015, 2, 56–64. [Google Scholar] [CrossRef]
- Misson, B.; Garnier, C.; Lauga, B.; Dang, D.H.; Ghiglione, J.-F.; Mullot, J.-U.; Duran, R.; Pringault, O. Chemical multi-contamination drives benthic prokaryotic diversity in the anthropized Toulon Bay. Sci. Total Environ. 2016, 556, 319–329. [Google Scholar] [CrossRef] [PubMed]
- Iriarte, M.J. Vegetation landscape and the anthropization of the environment in the central sector of the Northern Iberian Peninsula: Current status. Quat. Int. 2009, 200, 66–76. [Google Scholar] [CrossRef]
- Mercier, A.; Ajzenberg, D.; Devillard, S.; Demar, M.P.; de Thoisy, B.; Bonnabau, H.; Collinet, F.; Boukhari, R.; Blanchet, D.; Simon, S.; et al. Human impact on genetic diversity of Toxoplasma gondii: Example of the anthropized environment from French Guiana. Infect. Genet. Evol. 2011, 11, 1378–1387. [Google Scholar] [CrossRef] [PubMed]
- Guetté, A.; Godet, L.; Robin, M. Historical anthropization of a wetland: Steady encroachment by buildings and roads versus back and forth trends in demography. Appl. Geogr. 2018, 92, 41–49. [Google Scholar] [CrossRef]
- Da Silva, A.M.; Huang, C.H.; Francesconi, W.; Saintil, T.; Villegas, J. Using landscape metrics to analyze micro-scale soil erosion processes. Ecol. Indic. 2015, 56, 184–193. [Google Scholar] [CrossRef]
- Vaz, E. The future of landscapes and habitats: The regional science contribution to the understanding of geographical space. Habitat Int. 2016, 51, 70–78. [Google Scholar] [CrossRef]
- Pagán, J.I.; López, I.; Aragonés, L.; Garcia-Barba, J. The effects of the anthropic actions on the sandy beaches of Guardamar del Segura, Spain. Sci. Total Environ. 2017, 601–602, 1364–1377. [Google Scholar] [CrossRef] [PubMed]
- García-Ayllón, S. Integrated management in coastal lagoons of highly complexity environments: Resilience comparative analysis for three case-studies. Ocean Coast. Manag. 2017, 143, 16–25. [Google Scholar] [CrossRef]
- Lee, S.; Lee, S.; Lee, M.-J.; Jung, H.-S. Spatial Assessment of Urban Flood Susceptibility Using Data Mining and Geographic Information System (GIS) Tools. Sustainability 2018, 10, 648. [Google Scholar] [CrossRef]
- Hou, D.; O’Connor, D.; Nathanail, P.; Tian, L.; Ma, Y. Integrated GIS and multivariate statistical analysis for regional scale assessment of heavy metal soil contamination: A critical review. Environ. Pollut. 2017, 231, 1188–1200. [Google Scholar] [CrossRef] [PubMed]
- Gutiérrez, J.; García-Palomares, J.C.; Romanillos, G.; Salas-Olmedo, M.H. The eruption of Airbnb in tourist cities: Comparing spatial patterns of hotels and peer-to-peer accommodation in Barcelona. Tour. Manag. 2017. [Google Scholar] [CrossRef]
- Rubio-Aliaga, Á.; Sánchez-Lozano, J.M.; García-Cascales, M.S.; Benhamou, M.; Molina-García, A. GIS based solar resource analysis for irrigation purposes: Rural areas comparison under groundwater scarcity conditions. Sol. Energy Mater. Sol. Cells 2016, 156, 128–139. [Google Scholar] [CrossRef]
- Baudron, P.; Alonso-Sarría, F.; García-Aróstegui, J.L.; Cánovas-García, F.; Martínez-Vicente, D.; Moreno-Brotóns, J. Identifying the origin of groundwater samples in a multi-layer aquifer system with Random Forest classification. J. Hydrol. 2013, 499, 303–315. [Google Scholar] [CrossRef]
- Al-Anbari, M.A.; Thameer, M.Y.; Al-Ansari, N. Landfill Site Selection by Weighted Overlay Technique: Case Study of Al-Kufa, Iraq. Sustainability 2018, 10, 999. [Google Scholar] [CrossRef]
- Sánchez-Lozano, J.M.; García-Cascales, M.S.; Lamata, M.T. GIS-based onshore wind farm site selection using Fuzzy Multi-Criteria Decision Making methods. Evaluating the case of Southeastern Spain. Appl. Energy 2016, 171, 86–102. [Google Scholar] [CrossRef]
- Lyu, H.-M.; Shen, J.S.; Arulrajah, A. Assessment of Geohazards and Preventative Countermeasures Using AHP Incorporated with GIS in Lanzhou, China. Sustainability 2018, 10, 304. [Google Scholar] [CrossRef]
- Alexander, A.C.; Ndambuki, J.; Salim, R.; Manda, A. Assessment of Spatial Variation of Groundwater Quality in a Mining Basin. Sustainability 2017, 9, 823. [Google Scholar] [CrossRef]
- Tomás, A.; Ródenas, J.L.; García-Ayllón, S. Proposal for new values of behaviour modifiers for seismic vulnerability evaluation of reinforced concrete buildings applied to Lorca (Spain) using damage data from the 2011 earthquake. Bull. Earthq. Eng. 2017, 15, 3943–3962. [Google Scholar] [CrossRef]
- Criado, M.; Martínez-Graña, A.; Santos-Francés, F.; Veleda, S.; Zazo, C. Multi-Criteria Analyses of Urban Planning for City Expansion: A Case Study of Zamora, Spain. Sustainability 2017, 9, 1850. [Google Scholar] [CrossRef]
- Castañeda-Chávez, M.; Lango-Reynoso, F.; Navarrete-Rodríguez, G. Hexachlorocyclohexanes, Cyclodiene, Methoxychlor, and Heptachlor in Sediment of the Alvarado Lagoon System in Veracruz, Mexico. Sustainability 2018, 10, 76. [Google Scholar] [CrossRef]
- Silliman, S.; Borum, B.; Boukari, M.; Yalo, N.; Orou-Pete, S.; McInnis, D.; Fertenbaugh, C.; Mullen, A. Issues of Sustainability of Coastal Groundwater Resources: Benin, West Africa. Sustainability 2010, 2, 2652–2675. [Google Scholar] [CrossRef]
- Armah, F.; Yawson, D.; Pappoe, A.; Afrifa, E. Participation and Sustainable Management of Coastal Lagoon Ecosystems: The Case of the Fosu Lagoon in Ghana. Sustainability 2010, 2, 383–399. [Google Scholar] [CrossRef]
- Ostrom, E. A General Framework for Analyzing Sustainability of Social-Ecological Systems. Science 2009, 325, 419–422. [Google Scholar] [CrossRef] [PubMed]
- Garcia-Ayllon, S. Geographic Information System (GIS) Analysis of Impacts in the Tourism Area Life Cycle (TALC) of a Mediterranean Resort. Int. J. Tour. Res. 2016, 18, 186–196. [Google Scholar] [CrossRef]
- Garcia-Ayllon, S. Diagnosis of complex coastal ecological systems: Environmental GIS analysis of a highly stressed Mediterranean lagoon through spatiotemporal indicators. Ecol. Indic. 2017, 83, 451–462. [Google Scholar] [CrossRef]
- Cartomur. Available online: http://cartomur.imida.es/visorcartoteca/ (accessed on 20 March 2018).
- Infraestructuras de Datos Espaciales de la Región de Murcia SITmurcia. Available online: http://sitmurcia.es/visor/? (accessed on 20 March 2018).
- Pérez-Ruzafa, A.; Fernández, A.I.; Marcos, C.; Gilabert, J.; Quispe, J.I.; García-Charton, J.A. Spatial and temporal variations of hydrological conditions, nutrients and chlorophyll a in a Mediterranean coastal lagoon (Mar Menor, Spain). Hydrobiologia 2005, 550, 11–27. [Google Scholar] [CrossRef]
- Martinez, J.; Esteve, M.A.; Martínez-Paz, J.M.; Carreño, F.; Robledano, F.; Ruiz, M.; Alonso, F. Simulating management options and scenarios to control nutrient load to Mar Menor, Southeast Spain. Trans. Waters Monogr. 2007, 1, 53–70. [Google Scholar] [CrossRef]
- Velasco, J.; Lloret, J.; Millan, A.; Marin, A.; Barahona, J.; Abellan, P.; Sanchez-Fernandez, D. Nutrient and particulate inputs into the Mar Menor lagoon (SE Spain) from an intensive agricultural watershed. Water Air Soil Pollut. 2006, 176, 37–56. [Google Scholar] [CrossRef]
- Pérez-Ruzafa, A.; Navarro, S.; Barba, A.; Marcos, C.; Cámara, M.A.; Salas, F. Presence of pesticides through trophic compartments of the food web in the Mar Menor lagoon (SE Spain). Mar. Pollut. Bull. 2000, 40, 140–151. [Google Scholar] [CrossRef]
- Miralles, J.L.; García-Ayllón, S. The urban metamorphosis of La Manga and the “mediterraneanisation” process of the Mar Menor (Spain). Wit Trans. Ecol. Environ. 2013, 169, 53–64. [Google Scholar] [CrossRef]
- Martínez-López, J.; Carreño, M.F.; Martínez-Fernández, J.; Esteve, M.A. Wetland and landscape indices for assessing the condition of semiarid Mediterranean saline wetlands under agricultural hydrological pressures. Ecol. Indic. 2014, 36, 400–408. [Google Scholar] [CrossRef]
- Miralles, J.L.; García-Ayllón, S. The economic sustainability in urban planning: Case La Manga. WIT Trans. Ecol. Environ. 2013, 173, 279–290. [Google Scholar] [CrossRef]
- Pérez-Ruzafa, A.; Gilabert, J.; Gutiérrez, J.M.; Fernández, A.I.; Marcos, C.; Sabah, S. Evidence of a planktonic food web response to changes in nutrient input dynamics in the Mar Menor coastal lagoon, Spain. Hydrobiologia 2002, 475–476, 359–369. [Google Scholar] [CrossRef]
- Muñoz-Vera, A.; Peñas-Castejón, J.M.; García, G. Patterns of trace element bioaccumulation in jellyfish Rhizostoma pulmo (Cnidaria, Scyphozoa) in a Mediterranean coastal lagoon from SE Spain. Mar. Pollut. Bull. 2016, 110, 143–154. [Google Scholar] [CrossRef] [PubMed]
- Robledano, F.; Esteve, M.A.; Martínez-Fernández, J.; Farinós, P. Determinants of wintering waterbird changes in a Mediterranean coastal lagoon affected by eutrophication. Ecol. Indic. 2011, 11, 395–406. [Google Scholar] [CrossRef]
Figure 1.
Schematized summary of the methodology presented.
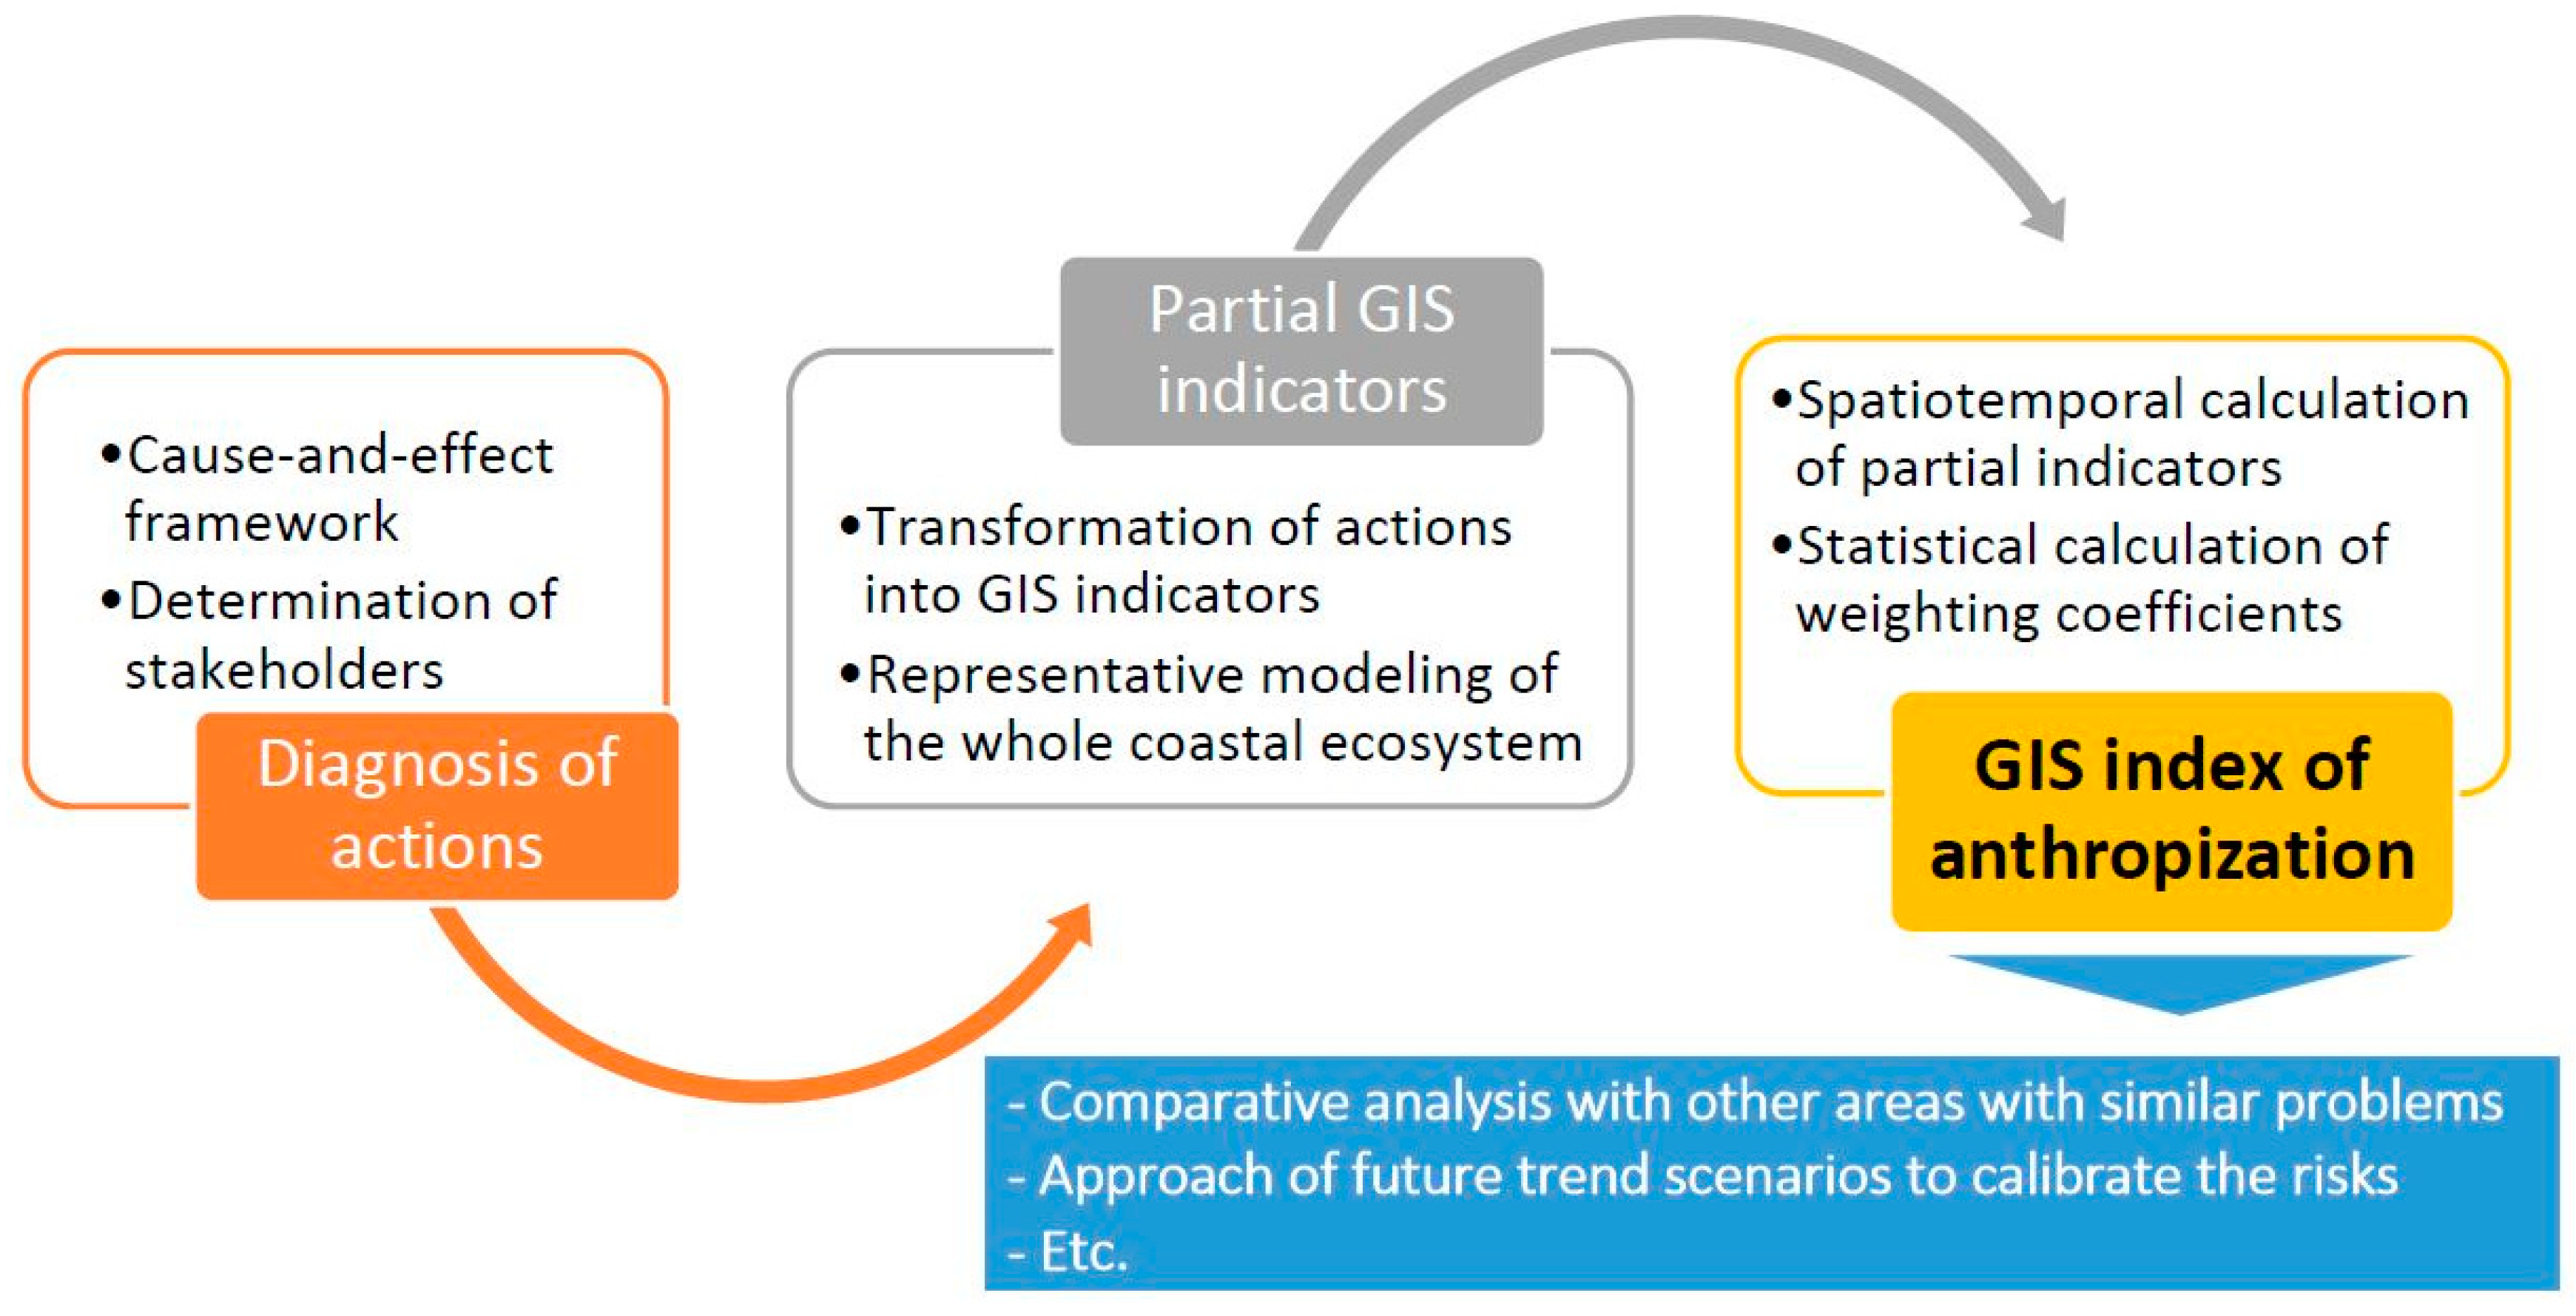
Figure 2.
Main sensitive environmental elements such as seabed, protected wildlife, landscape and dune systems (blue boxes) affected by tourism due to overcrowding, recreational activities, urbanization and beach alterations (red boxes) in the area analyzed (green line).
Figure 2.
Main sensitive environmental elements such as seabed, protected wildlife, landscape and dune systems (blue boxes) affected by tourism due to overcrowding, recreational activities, urbanization and beach alterations (red boxes) in the area analyzed (green line).

Figure 3.
DPSIR model developed for the action diagnosis process.

Figure 4.
Two examples of GIS Evolution for 1929–1956, 1956–1980, and 1980–2016 for urbanization: ST1 for new tourist resorts (in blue) and ST2 for urban sprawl of existing settlements (in red).
Figure 4.
Two examples of GIS Evolution for 1929–1956, 1956–1980, and 1980–2016 for urbanization: ST1 for new tourist resorts (in blue) and ST2 for urban sprawl of existing settlements (in red).

Figure 5.
Actions selected as globally representative to implement the partial GIS indicators (in red) including the average value of the votes of the social and scientific stakeholders (upper and bottom line of each box), and the maximum and minimum values obtained for each of the actions. Note: black box when the average value of social stakeholders is higher than that of scientific stakeholders, and white one otherwise.

Figure 6.
Trend simulation of the global index of anthropization in the area for 2030, adjusted polynomially.
Figure 6.
Trend simulation of the global index of anthropization in the area for 2030, adjusted polynomially.

Figure 7.
Extreme retraction in numerous beaches on the Mar Menor side of La Manga that currently reach the foundations of the houses.
Figure 7.
Extreme retraction in numerous beaches on the Mar Menor side of La Manga that currently reach the foundations of the houses.


Table 1.
Stakeholders consulted during the elaboration of surveys.
| Social Stakeholders | Scientific Stakeholders |
|---|---|
| Local administrations | Urban planners |
| Environmental groups | Biologists |
| Neighborhood associations | Ecologist and Environmental planners |
| Business associations | Coastal engineers |
| Citizen and tourist platforms | Geologists |
| Fishing guilds | Marine and Hydrodynamic scientists |
Table 2.
Summary of results of partial indicators, weighting coefficients and global anthropization index for each of the three selected periods.
Table 2.
Summary of results of partial indicators, weighting coefficients and global anthropization index for each of the three selected periods.
| GIS Indicators | Evolution of GIS Indicators and | Weighting Coefficient | ||
|---|---|---|---|---|
| 1929–1956 | 1956–1980 | 1980–2016 | ||
| ITU | 0.09 | 0.39 | 0.57 | 0.36 |
| IBA | 0.07 | 0.15 | 0.35 | 0.31 |
| IPR | 0.02 | 0.12 | 0.34 | 0.21 |
| IWE | 0.06 | 0.08 | 0.55 | 0.12 |
| 0.0655 | 0.2229 | 0.4511 | ||
© 2018 by the author. Licensee MDPI, Basel, Switzerland. This article is an open access article distributed under the terms and conditions of the Creative Commons Attribution (CC BY) license (http://creativecommons.org/licenses/by/4.0/).
Share and Cite
MDPI and ACS Style
García-Ayllón, S. GIS Assessment of Mass Tourism Anthropization in Sensitive Coastal Environments: Application to a Case Study in the Mar Menor Area. Sustainability 2018, 10, 1344. https://doi.org/10.3390/su10051344
AMA Style
García-Ayllón S. GIS Assessment of Mass Tourism Anthropization in Sensitive Coastal Environments: Application to a Case Study in the Mar Menor Area. Sustainability. 2018; 10(5):1344. https://doi.org/10.3390/su10051344
Chicago/Turabian StyleGarcía-Ayllón, Salvador. 2018. "GIS Assessment of Mass Tourism Anthropization in Sensitive Coastal Environments: Application to a Case Study in the Mar Menor Area" Sustainability 10, no. 5: 1344. https://doi.org/10.3390/su10051344
Note that from the first issue of 2016, this journal uses article numbers instead of page numbers. See further details here.