A Comparative Study of the Role of China and India in Sustainable Textile Competition in the U.S. Market under Green Trade Barriers

School of Business, Jiangnan University, Wuxi 214122, Jiangsu Province, China
*
Author to whom correspondence should be addressed.
Sustainability 2018, 10(5), 1348; https://doi.org/10.3390/su10051348
Submission received: 24 March 2018
/
Revised: 18 April 2018
/
Accepted: 24 April 2018
/
Published: 26 April 2018
(This article belongs to the Special Issue Environmental Policy for Sustainability)
Abstract
:The United States is the most important textile import market in the world, and one of the most important export targets of developing countries. In view of its ecological environment and consumer health, the United States has put forward increasingly harsh environmental protection systems and standards for imported textile products, and its environmental trade barriers have been steadily strengthened. China’s textile exports increased substantially after joining the World Trade Organization (WTO) in 2000; at present, the textile imports of the United States from China and India reach in total more than one third of all their imports. China and India both have comparative advantages in the import trade of textile raw materials and clothing in the United States (U.S.). On the basis of the United Nation ComTrade Rev. 3, this paper studies the role of China and India in the United States textile market, including calculating the trade competitiveness index, revealing the competitive advantages of China and India, and investigating the impact of both Chinese and Indian textiles on United States imports from the rest of the world across three main textile sectors in the period 2000–2016, especially in the context of green trade barriers. We find that the relative textile import prices, the ecological standard of China’s textile production re-edited Oeko-Tex Standard 100 in 2008 and export tax policy, and the competitive advantages of China and India had varied impacts on relative U.S. textile imports across related sectors under green environmental trade barriers. These findings recognize China’s competitiveness in international trading, and also provide suggestions regarding China’s competitiveness and sustainable development in the U.S. market.
1. Introduction
When the Agreement on Textiles and Clothing was reached in the Uruguay Round of General Agreement on Tariffs and Trade (GATT) negotiations on 31 December 2004, quotas on global trade in textile raw materials and clothing became history. Since the agreement will be gradually implemented, every textile exporting country and region now hopes to have as much market share as possible before the quota is abolished [1]. From 1 January 2005, trade in textiles and clothing has been formally incorporated into the Word Trade Organization (WTO) free trade framework [2]. It has provided extremely favorable conditions for China and India, which are major exporters of textiles and clothing, to further exert their comparative advantages and expand both their exports of textiles and clothing and their shares in the international market [3]. There has been a lot of analysis in the field of trade in textile at both aggregate and sector levels, but few studies have paid attention to the United States’ relative imports from the world in relation to China or India from the perspective of three textile-related products after 2000, when China’s textile exports increased dramatically. As the most important textile import market in the world, the United States (U.S.) strongly attracts all major textile-exporting countries, and at the same time has also strengthened the protection of its textile industry. We would like to analyze three kinds of textile-related products imports into the U.S. from the world in relation to China and India, respectively, under green trade barriers in order to investigate the role of China and India on U.S. textile imports from the international market.
Developing countries generally have a problem with textile overproduction, since the development of the textile industry can greatly enhance the employment rate and promote the development of related industries [3]. China and India both regard the textile industry as their major industry for the development of the national economy [4], and the U.S. has become the main target market for the international competition between these two major textile exporters [5]. The scale of China’s textile industry is very large, yet its domestic demand is still underdeveloped; the export share of its production is a high proportion of its total trade [5]. Maintaining the steady growth of China’s textile and garment exports will remain one of the crucial factors for maintaining the healthy, stable, and sustainable development of China’s textile industry and ensuring the steady growth of China’s economy for some considerable time [6]. Analyzing the competitiveness of China and India in the U.S. textile, raw materials, and clothing market, as well as their impact on U.S. imports from the world in the context of green trade barriers is of great significance to China and other developing countries in formulating their textile trade strategies for the future.
With the continuous impact of the financial crisis and the accelerating pace of re-industrialization in developed countries, the scramble and competition of the international market has increasingly become the focus of various countries all over the world [7,8]. Technical barriers to trade (TBT) have gradually replaced such traditional barriers as tariffs, permits, and quotas; they have become the major means of setting trade protection measures internationally, and have also become more and more systematized, complicated, diffused, and covert. From the perspective of sustainable development, TBTs have positively and significantly promoted the progress of science and technology and protected the healthy and harmonious development of people and the environment [4,5]. As the modern textile industry gradually evolves into a typical chemical processing industry, each process becomes less and less separable from the use of chemicals. At the same time, the widespread use of chemicals without an ecological safety assessment has caused widespread concern all over the world. Now, the ecological security of textiles has become a hot issue because of the appeal for technical barriers in international trade [9].
Green trade barriers (GTBs), also called environmental trade barriers (ETBs) form a new kind of technical barrier to trade and have been widely used in developed countries [10]. Countries that implement ETBs augment their own sustainable development and protection of the natural environment, ecology, and human health, and simultaneously extend harsh environmental protection systems and standards for their imports. In recent years, China’s exports of textiles and clothing have frequently encountered green trade barriers in developed countries [11,12,13,14,15]. People are paying more attention to ecological and environmental issues. Concepts such as “green products” and “ecological textiles” have been introduced into the areas of trading in textiles and apparel. The developed countries have imposed higher requirements on the production of chemically clean textiles and clothing and the safety of wearers and users. Major importers, such as the United States, the European Union, and Japan all conform to this trend, and have formulated a series of relevant laws, regulations, and environmental standards to exert strict environmental protection and quarantine measures on imported textiles and clothing [16]. At present, there are dozens of green ecological textile standards in the world, among which the most influential, widely used, authoritative, and strictest green eco-textile standard is the Oeko-Tex Standard 100, which is also called the eco-textile standard 100. This standard was formulated and promulgated on the basis of ecological research on textiles by the International Environmental Protection Textile Association in 1992, and was designed to test the presence of harmful residues in textiles. The test subjects of its standards involve free formaldehyde residues, polychlorinated biphenyls ( PCBs) alkalinity, residues of soluble heavy metal pesticides, preservatives, and fungicides, such as organic chlorine carriers and other harmful PCBs. The standard controls the capacity for environmental protection of textiles and clothing in the U.S. through international environmental labels (Oeko-Labels).
The Oeko-Tex Standard 100 allows more textiles and apparel products to be traded in the European and American markets, which has set off a green trend in international trade and posed a severe challenge to China, the biggest exporter of textiles. To keep pace with the latest international technology and standards and break down the “green fortress”, China has gradually built up an improved standard system for testing ecological textiles that is based on the Oeko-Tex Standard 100, and developed it from a single standard to a quality accreditation standard system that meets the requirements of international ecological textile testing.
According to the United Nations (UN) Standard of International Trade Classification (SITC) of trade, bilateral trade statistics for textiles fall into three sectors: textile fabrics (SITC26), textile yarn (SITC65), and clothing (SITC84). As Table 1 shows, from 2000 to 2016, the U.S. textile imports in these three sectors were all increasing. In 2000, the cost of textile fabrics imported to the U.S. amounted to $691.47 million USD, and its imports of textile yarn totaled $15.985 million USD. The imports of clothing were worth $67.115 million USD, and its total amount of imports accounted for 21.6% of the world’s textile imports. Before 2005, the share of U.S. imports in the world’s textile imports remained at about 20%; it declined from 2007 to 2014, though had risen again to 20.1% by 2016. Of all textile imports, the main one for the United States is clothing, which accounted for 17.3% of world textile imports in 2000, before a slight decline; however, it reached 15.07% in 2016. After ready-made clothing, textile yarn is the second most important sector of the U.S. textile imports, accounting for about 4% of the world’s textile imports, with a slight increase of 4.76% in 2016. Imports of textile fabrics also increased in comparison with ready-to-wear clothing and textile yarns, but their share was not high, only 0.23% in 2016.
The remaining sections in this paper are as follows: section two introduce the textile share of China and India in different time periods in the U.S. market; section three compares the competitiveness of China and India in the U.S. textile market; sections four and five contain the model specification and econometric modeling as well as a classification of the data used in this study; section six analyzes the influence of China and India on the U.S. textile import market; and section seven draws some conclusions.
2. Comparison of Textile Market Share of China and India in the United States
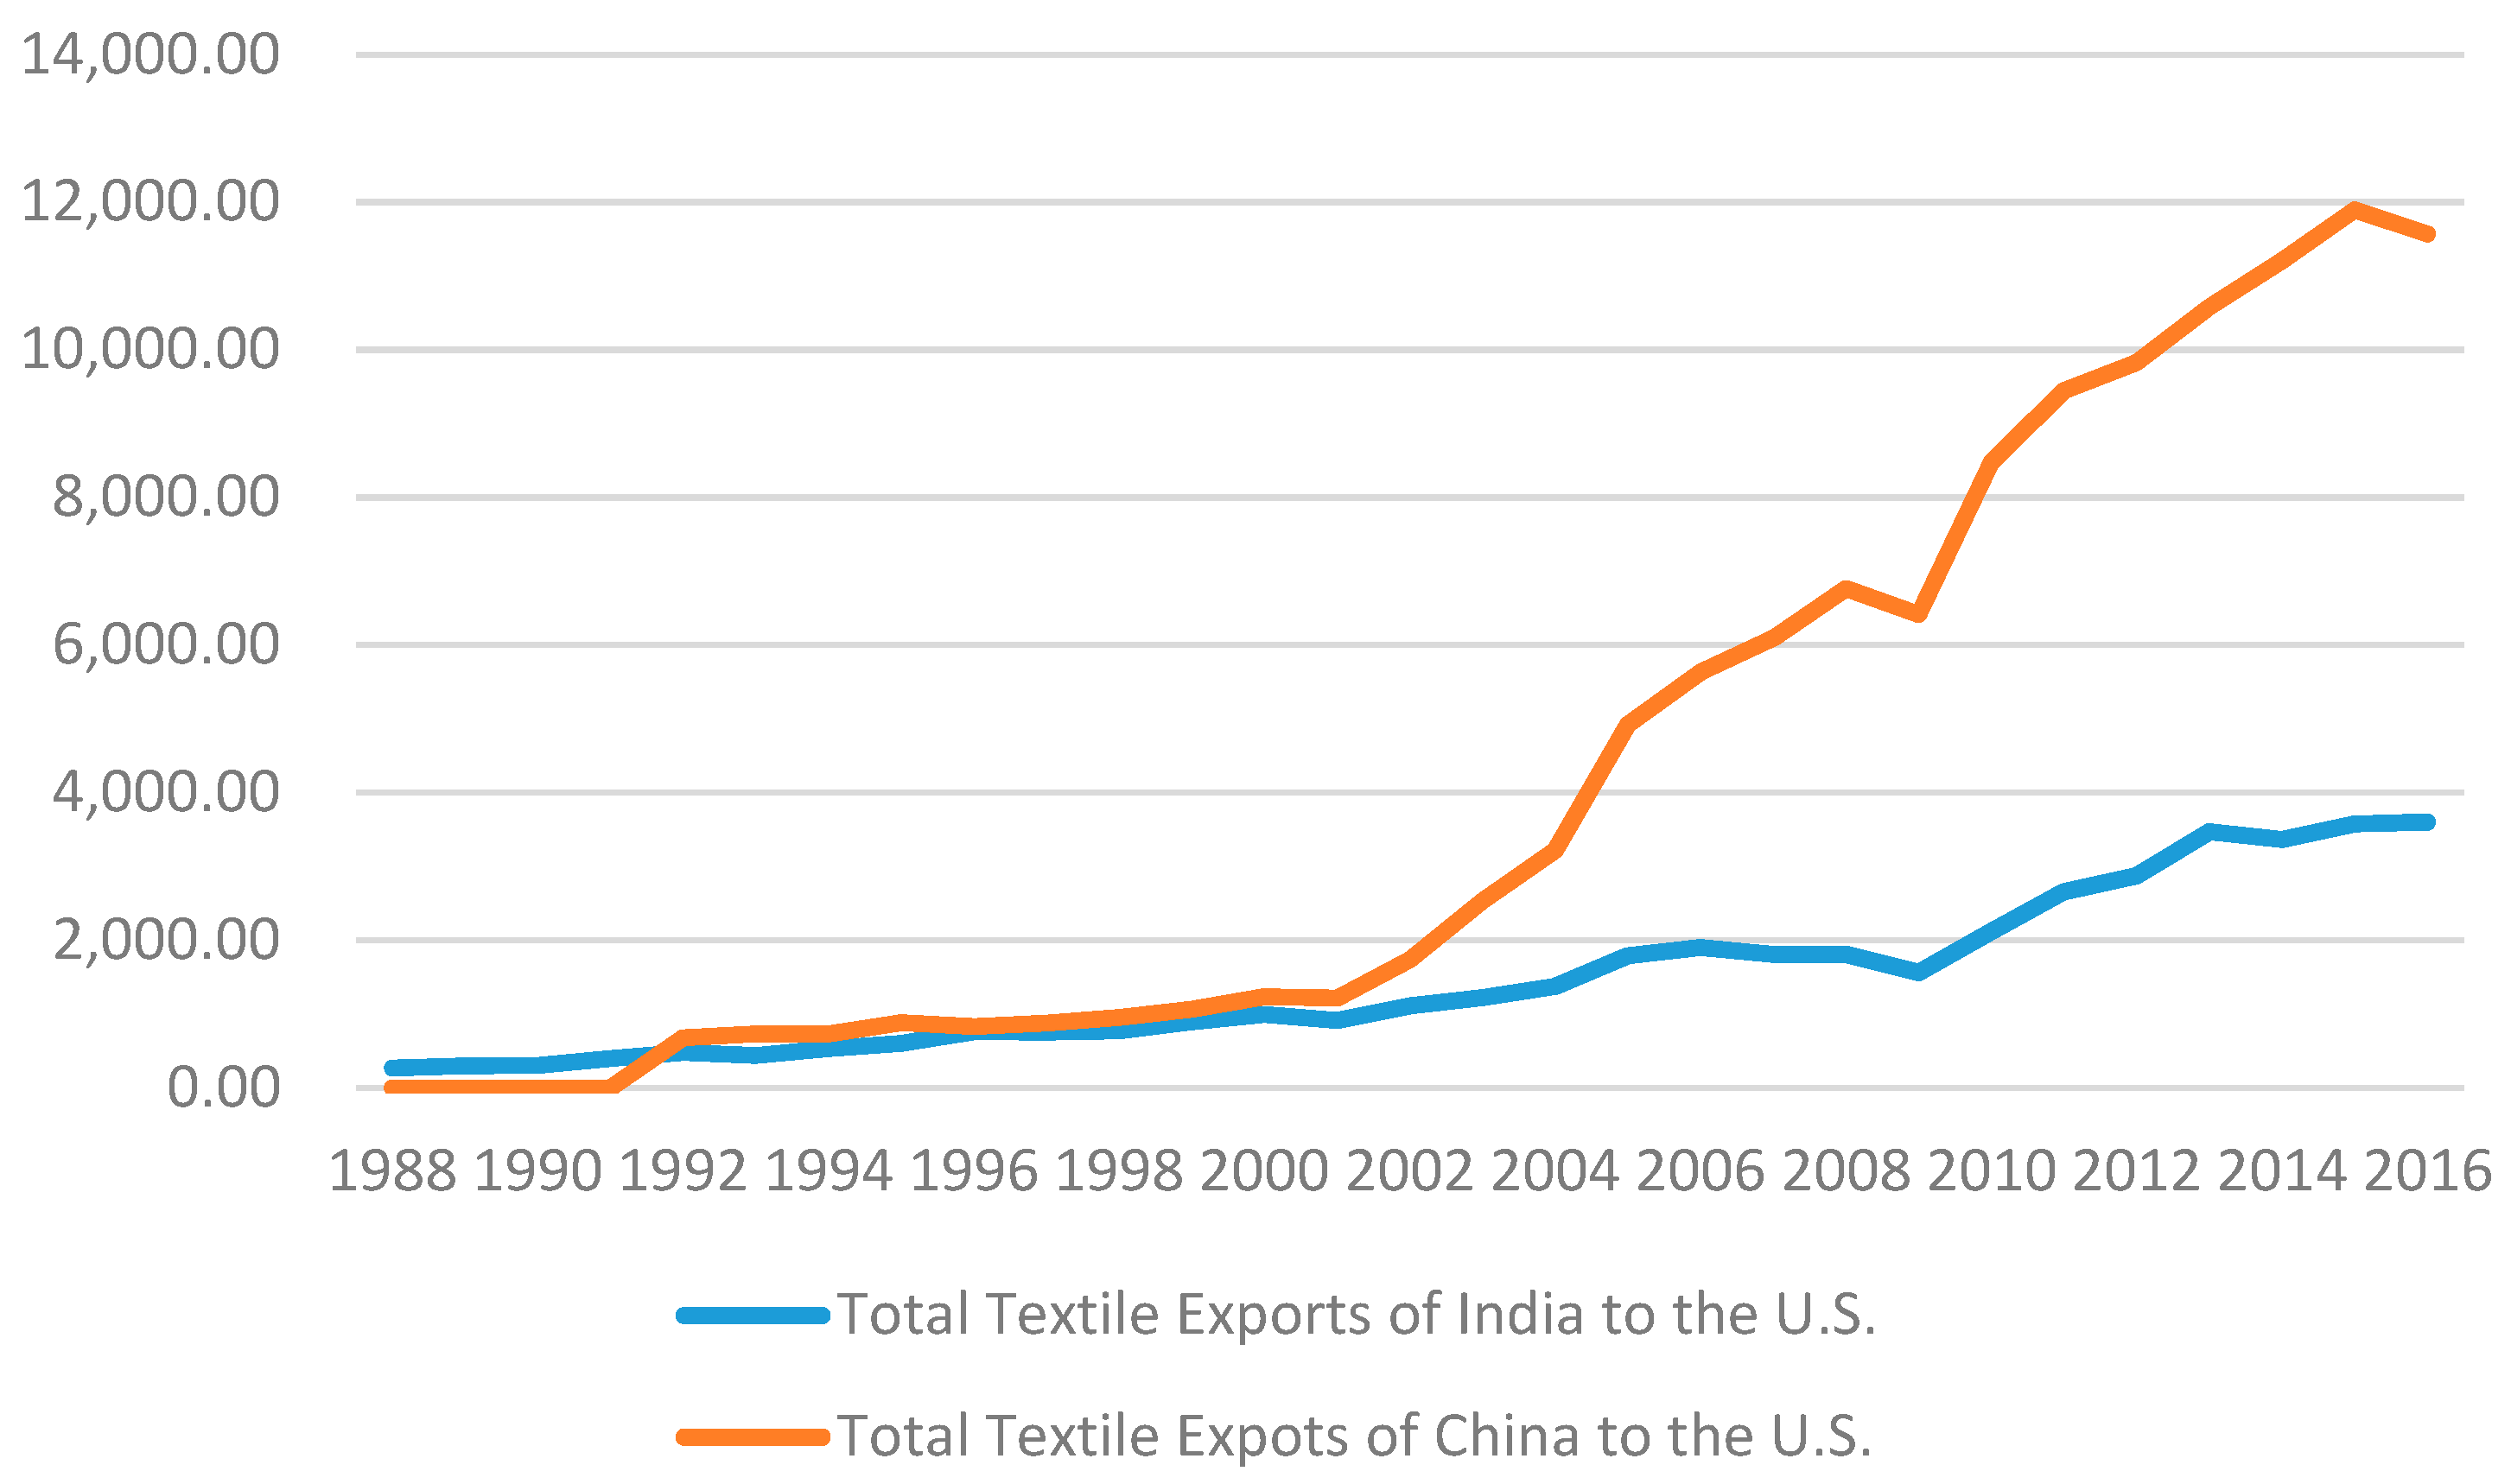
Although the textile trade is protected by a green ecological barrier, i.e., the Oeko-Tex Standard 100, China and India remain the main sources of the textiles imported by the U.S. On 1 January 2005, the quota system in the international textile trade was formally abolished, and the world textile industry entered the post-quota era, of which the biggest beneficiary has been China. According to the WTO, China and India maximized their exports of clothing and other textile products in all countries after the import quotas of the United States and other developed countries were abolished in 2005 [1,2]. The labor conditions in China and India have many points of resemblance; they are both developing countries with a large domestic population and abundant labor resources [18]. In addition, the geographical environment and climatic conditions of the two countries are highly suitable for the cultivation and production of textile raw materials [19]. Especially after China’s entry to the WTO in 2000, its textile exports to the United States increased greatly, to a point far beyond those of India (Figure 1).
The textile industry has not only brought huge profits to China’s exports, it also solved its labor employment problem [20,21,22,23]. Similar to China, India sees its textile industry as an important pillar to which the Indian government pays great attention [24]. It has implemented many preferential measures in favor of its textile exports. India’s textile industry in the international market has become the most powerful competitor to China’s in the world textile market [25,26]. As shown in Table 2, the three categories of the U.S. textile imports from China and India have increased year by year, but the import ratios vary throughout the period shown. For example, the proportion of imports of textile fabrics (SITC 26) from China rose from 3.38% in 2000 to 23.36% in 2016, a sevenfold increase. Meanwhile, the share of India increased from 0.77% in 2000 to 9.42% in 2016, and the share of U.S. imports from India increased 12-fold. In terms of textile yarn (SITC 65), the proportion of imports of textile yarns from China increased from 12.17% in 2000 to 40.66% in 2016, and the proportion of imports increased by a factor of 3.34. However, the proportion from India increased from 7.57% in 2000 to only 13.83% in 2016, an increase by a factor of 1.83. For clothing (SITC 84), the proportion of imports from China rose by a factor of 2.7, from 13.30% in 2000 to 36.01% in 2016. The proportion of clothing from India increased by a factor of 1.36, from 3.21% in 2000 to 4.38% in 2016.
Although the U.S. imports from China and India grew at different rates, we can clearly see that in the context of Oeko-Ted Standard 100, the U.S. imports of the three categories of textiles from China and India together account for at least 30% of all imports, indicating that textile yarn (SITC 65) and clothing (SITC 84) from China and India had competitive status in the U.S. market. Compared with these two sectors, the U.S. imports from China of textile fabrics (SITC 26) accounted for the lowest proportion of the total imports of this sector, but its rate of growth was the fastest. The U.S. textile imports from India mainly focus on textile yarns, followed by textile fibers and clothing.
3. Competitiveness of China and India in the U.S. Textile Market
As one of the world’s major textile trade deficit countries, the textile market in the United States is huge. However, in the textile raw materials market, the U.S. is a textile surplus country. As shown in Table 3, despite the rising competitiveness of SITC 26 from China and India in the textile market of the United States, it had become negative by 2016, as reflected in the trade in cotton (SITC 263), waste materials from textile fabrics (SITC 267), wool (SITC 268), and old clothing (SITC 269).
China and India differ in the competitiveness of their raw materials for other textile fabrics [27,28]. Silk is one of these; China, as a big silk producer from ancient times, is still important, with a strongly competitive position in the U.S. market. India’s silk products are less competitive in the United States than China’s, and India needs to import silk from the United States. India leads jute production in the world, according to the U.S. textile market competitiveness index (Table 3). Its jute fiber rose from 0.148 in 2005 to 0.879 in 2016, showing that its competitiveness in this area had become very strong. Compared with India, China after 2000 had a basically blank record in jute trade with the United States. However, despite the trade deficit for China and India in the U.S. textile market, there was still a trend of favorable balance and competitive growth in some specific product categories, such as vegetable fabrics (SITC265) and synthetic and regenerated artificial fabrics (SITC266).
China and India showed very strong competitiveness between 2000 and 2016 in the U.S. textile raw materials and clothing markets. The competitiveness index of the two countries shows an identical overwhelming trade surplus. However, as shown in Table 2, the import share of textiles in China and India is always different from that in the U.S. market, so it is necessary to understand the comparative advantages of these textile materials in this market.
Although China and India’s share in textile fabrics is not as great as the share of textile yarn and clothing (Table 2), Table 4 shows that the revealed comparative advantages (RCA) of China’s textile fabrics (SITC 26) increased in the U.S. market, and were slightly higher than those of India. However, the RCA of the textile fabrics of both India and China were less than one in this sector, indicating that the comparative advantages of both countries were not obvious. In the textile fiber market, we also observe that India’s synthetic and regenerated artificial fabrics (SITC 266) had an RCA >1 after 2005, indicating that India had a more obvious comparative advantage in synthetic and regenerated artificial fabrics than China had in the U.S. market.
In Table 4, we find that after 2003, for the second type of textile raw material or textile yarn (SITC65), India’s RCA was always greater than one. Meanwhile, China’s RCA was lower than one, meaning that India’s textile raw materials had obvious revealed comparative advantages. This is also true of other textile fabric materials (SITC654), knitted crocheted fabrics (SITC655), and special yarn and related fabrics (SITC657).
Of course, the revealed comparative advantage of Chinese products is also evident in made-up articles (SITC658) and floor coverings (SITC659); however, compared with India’s, the index of these sectors for China are slightly lower, which implies that Indian textile yarn (SITC65) had a stronger comparative advantage. The proportion of Chinese textile raw materials in the U.S. market is higher than those of India, reaching 40.66% in 2016, while India’s was only 13.83%; however, the comparative advantage of Chinese products is not as great as that of India. At the same time, we also observe that the RCAs of some textiles with strong Chinese and Indian features, such as textile yarn, woven cotton fabrics, and embroidery were all less than one, and not as strong as we might have expected. This finding implies that these products from China and India may not have been satisfactory given the barrier of ecological standards in the U.S. market.
For clothing (SITC84), another important U.S. textile imports sector, China’s and India’s RCA were both more than one, while India’s RCA index was even greater than China’s (though not by much), meaning that these two countries’ exports to the United States both had strong revealed comparative advantages, and India’s was the greater. India has a stronger revealed comparative advantage than China, which was embodied in clothing except fur clothing (SITC841), articles of women’s clothing (SITC842), undergarments of textile fabrics (SITC844), and outerwear knitted or crocheted (SITC845). In the competition to sell clothing products, China and India both have revealed comparative advantages in some specific products, such as India’s women’s outerwear (SITC843), and China’s knitted or crocheted undergarments (SITC846) and clothing accessories (SITC848).
In summary, under the green trade barrier of Oeko-Tex Standard 100, although China has advantages in the U.S. market, the competitiveness of the textile raw materials from China is generally lower than that of India [19,20]. In addition to the changes in the international economic and financial environment, the consumer market also exerts an impact on China’s textile exports, and green trade barriers and the trend of green consumption altogether amount to a major challenge to the sustainable and stable development of China’s textile exports.
4. Model Specification
Both China and India have obvious comparative advantages in the U.S. textile market, and the relative price of their textile goods may have diverse effects on different sectors of textiles at different times. As Bini-Smaghi (1991) [29] suggests, different countries/sectors make different import demands and have different price elasticities. Following Rauch (1999) [30] and Broda and Romalis (2004) [31], some researchers have conducted a bilateral sectoral study and used data separated into “differentiated” and “commodity” trading. Bilateral sectoral trade using sectoral prices instead of country aggregates have been examined by many researchers, including Buongiorno et al. (2017) [32], Bas et al. (2017) [33], Campbell (2018) [34], Álvarez et al. (2018) [35], Aminu et al. (2018) [36], and Xu (2017) [37].
Armington (1969) [38] and Olekseyuk and Schürenberg-Frosch (2016) [39] assume that imported goods and their domestic counterparts are incomplete substitutes, and derived a “Theory of Demand for Products Distinguished by Place of Production”. In the Armington approach, elasticities of substitution among imports and competing domestic production (Armington elasticities) play a key role in open-economy computable general equilibrium (CGE) modeling. Both price and output elasticities are estimated by the Armington model, which assumes a consumer utility for goods in an industry that is separable from the consumption of other products. Armington (1969) [37] and most CGE modelers have used the constant elasticity of substitution (CES) form for an industry group, where utility is derived from domestic and foreign goods:
where is the constant elasticity of substitution between the domestic and traded goods (Armington elasticity), M is the trade volume, which in the present study is the volume of imported goods, and is the volume of domestic goods. and are the distribution parameters associated with M and D (indices for industry groups are omitted).
Cost minimization subject to the above utility function implies the first-order condition that the marginal rate of substitution between M and D should equal the corresponding price ratio . This condition can be solved for the quantity ratio of imported and domestic products in Equation (2) as follows:
where and are the trade and domestic prices, respectively. Re-writing Equation (2) in logarithmic form, we have:
Elasticities are unlikely to be equal across sectors [30,31,32,33,34,35,36,37,38,39,40,41,42,43]. A simplified form of the level relationship based on bilateral industry/sector data is as follows:
where is the price elasticity of substitution. Equation (4) can be estimated within a panel framework, which helps in testing the equivalence of coefficients across industries/sectors: . Indeed, in a panel context, we can also combine trade from a number of countries and all industries/sectors in our basic specification: .
Similarly, the U.S.’s imports from China ( is China or India) can be written as:
where is the U.S. imports from China or India for sector and is the ratio of the prices of China or India to those of the U.S. in sector .
Taking Equations (4)–(5), the U.S. relative imports can be written as:
where is the ratio of the U.S. imports from country to the U.S. imports from China or India in sector , and is the ratio of the import price of the U.S. to that of China or India in sector . As expected, when the import price from China or India is lower than the others, the relative demand from China or India will increase, so .
In order to have the effects of the green trade barriers reflected in the textile imports, three dummies were included in our specification, as follows:
where means the China State Administration of Quality Supervision, Inspection, and Quarantine which officially issued the national mandatory standards (NMS), or national basic safety code for textiles (GB8401-2003) in 2003. The promulgation of the standard marks the controlled use of hazardous substances in China, which has also taken substantial steps with legal significance to standardize textile production and promote green consumption that are closely related to consumer life [4]. is equal to 1 in and after 2003, and 0 before 2003.
means a proxy of international green trade barriers (GTBs), namely the Oeko-Tex Standard 100, which is the most representative ecological barrier to trade in textile materials and products, and ensures that textile products are not harmful for the ecological environment and human health. Oeko-Tex Standard 100 was initially launched in 1992. In the re-edited Oeko-Tex Standard 100 in 2008, more than 100 controlled substances, which covers not only chemicals that are harmful or potentially hazardous to human health, but also includes certain substances related to the prevention of health risks. This paper investigates the role of China and India in the U.S. textile market, respectively, under green trade barriers or the re-edited Oeko-Tex Standard 100. The dummy variable equals 1 in and after 2008, and 0 before 2008.
5. The Seemingly Unrelated Regression Model (SUR Model) and Data Classification
We estimate equations across all available sectors of textile fabrics, textile yarn, and clothing, based on Equation (7). If the residuals across equations are uncorrelated, then Ordinary Least Square (OLS) becomes an appropriate technique. However, if the residuals are correlated, the equations may be linked. In the equations, all of the variables, such as relative prices, have been used as regressors; thus, the residuals of these equations are subject to cross-correlation, since they are also associated with various import demands for textiles across the same group of countries.
The seemingly unrelated regression (SUR) model developed by Zellner (1962) [40] is a technique for analyzing a system of multiple equations with cross-equation parameter restrictions and correlated error terms. SUR is an extension of the linear regression model, which allows correlated errors between equations [41,42]. There are eight equations across eight sectors of textile fabrics, nine equations across the nine textile sectors of textile yarn, and seven equations across the seven sectors of clothing. Each equation may satisfy the OLS assumptions, but the joint model exhibits serial correlation due to the correlation of the error terms, and OLS estimation will be inefficient. Using the SUR method to estimate the equations jointly improves efficiency [43].
This paper investigates the role of China and India in the U.S. relative imports in textile-related products. This analysis covers the bilateral imports of textile fabrics, textile yarns, and clothing between the U.S. and the world. Trade data in annual frequencies are taken from the UN Comtrade, the Standard of International Trade Classification (SITC) Revision 3. Textile-related products include index 26, index 65, and index 83, which are also categorized into different sectors and listed in Table 5, below) as follows.
6. Influence of China and India on the United States Textile Import Market
The impact of four factors, namely, the relative prices of the U.S. imports from China and India; China’s green production standards; international green trade barriers; and China’s trade policy on the U.S.’s relative imports in textile fabrics (SITC 26) are shown in Table 6. China’s share of the U.S. imports in SITC26 was much higher than that of India, but the U.S. imports from India were the fastest growing (Table 2). China and India, as major producers of textile raw materials, always enjoyed a competitive advantage in the international market because of their low prices and the high quality of their products. When increases, the negative effects on the U.S. global imports relative to India become stronger.
India’s relative impact on all U.S. textile fabrics sectors (with the exception of SITC267) was greater than that of China, especially the import of synthetic and regenerated artificial fabrics (SITC 266), with RCA the most obvious (Table 4). When the U.S. import price relative to China increased by 10%, the U.S. relative imports fell by 5.94%; when the U.S. relative imports in relation to India increased by 10%, the U.S. relative imports fell by 31.36%. Thus, although the RCAs of China and India in the SITC26 sector were not obvious, they played an important role in American and world markets due to their advantage in exported textile raw materials. The effects of the relative prices in relation to China and India on the U.S. imports of the same products from other regions were nonetheless very obvious, especially for the relative imports from China of SITC 267 and the relative imports from India of SITC266. Although the competitive advantages of both China and India were not obvious in the U.S. market, and the RCAs of both countries were less than one, we observe that the RCAs of India’s textile fabrics (SITC 265, SITC 266, and SITC 269) are all greater than those of China in some years, such as SITC 266 after 2014, SITC 265, and SITC 269 in 2003.
When China began to set regulations on the production of textiles, on the one hand, China’s exports were adjusted; on the other hand, it still plays a positive role in promoting its textile fabrics in the U.S. market. We observe that has a slightly positive impact on the U.S. relative imports in silk (SITC 261) and jute (SITC 264), but significantly negative effects on vegetable fabrics (SITC 265). China was the largest exporter of textile fabrics in the world. The improvement of environmental protection requirements in the manufacture of products not only standardized the export of domestic products, it also encouraged other developing countries to improve the production standards of their textile fabrics. With the improvement of environmental protection standards for textile raw material exports, the global imports of the United States would also be adversely affected. China is a major exporter of textiles among developing countries, so when China’s textile fabrics production standards become more stringent, the United States’ requirements for textile imports from other countries and developing regions will rise accordingly. It has even significantly increased the negative magnitude of the impact on the U.S. global imports relative to India of SITC 265. It seems that the indirect effects of on the U.S. imports relative to India were more obviously reflected on the India sectors with higher competitive advantages. With the implementation of ecological standards for Chinese textiles, the amount of the U.S. imports in wool and other animal hair (SITC 268) and old clothing and other old textiles (SITC 269) from the world relative to India significantly declined.
Oeko-Tex Standard 100, as a proxy of international green trade barriers, was initially launched in 1992, and was re-edited in 2008. In this paper, we consider only the impacts of re-edited Oeko-Tex Standard 100 on the U.S. global imports relative to China and India in three sectors. Table 6 shows that does not significantly increase or decrease the U.S. global relative imports. However, after China stopped the export tax of 78 kinds of textile-related products in 2005, the U.S. global imports relative to China were generally negatively affected by most of the sectors of SITC 26, which indicates that China’s textile exports tax had a strong impact on the related imports of the U.S. In response to the international green trade barriers, China made a corresponding adjustment to the sustainable development of its textile industry, which obviously had a great impact on the relative global import in textile fabrics.
In the SITC26 category, the share and growth rate of China’s textile yarn in the U.S. textile market was much higher than that of India (Table 2). It seems that the U.S. relative imports were more affected by the relative prices of China than of India. Table 7 shows that the U.S. related imports were more affected by the import prices charged by China for six sectors of SITC 26 textile yarn than by those that India charged, which implies that China’s textile yarn had a greater impact on the U.S. imports, especially in the sectors with higher competitive advantages, such as made-up articles (SITC 658) and floor coverings (SITC 659). The U.S. had the highest proportion of imports from China in the SITC65 sector. Although India’s RCA was generally higher than China’s, the impact of imports relative to China’s in the U.S. market should not be underestimated. For example, the RCA of India at SITC654 was higher than that of China, but the impact of relative prices from China was stronger in this sector. When the import price relative to China increased by 10%, the U.S. global imports relative to China fell by 11.29%, and the relative effects from India were 9.49%.
Textile yarn is an important part of Chinese textile raw materials. When China began to implement strict environmental standards for the production of textile raw materials, the improved status of Chinese textile materials in the U.S. had an impact on the import opportunities of similar products from other regions. The greatest impact came from China’s most competitive textile raw materials sector in the United States, for example, textile yarn (SITC 651) and knitted or crocheted fabrics (SITC 655).
When China’s textile production standards are adjusted in line with international standards, the international position and share of its products are affected, as are products from other developing countries. We observe that the U.S. global imports relative to India significantly decreased in fabrics woven of man-made textile materials (SITC 653), which indirectly indicates that India had the highest environmental standards in this sector, and that it was also a raw material sector with the characteristics of Indian textiles. However, we also find that India’s production in this sector was still restricted by international environmental standards or the re-edited Oeko-Tex Standard 100. India’s market share in the U.S. was also moderated, and the U.S. global imports relative to India significantly increased by . However, compared with other sectors, significantly reduced the U.S. global imports in special yarn and related products (SITC 657) relative to both China and India, which indirectly indicates the status of these products from both countries in the U.S. market.
When China’s export taxes for 78 kinds of textile products were stopped, we observe that the U.S. global imports relative to China generally significantly decreased in eight sectors (SITC 651-SITC 658), implying that the U.S. imports from China had crowded out import needs from other regions. This influence also affected India, and stimulated the U.S. global imports relative to India at SITC 653 and SITC 654. We also observe that even though the RCA of China in SITC 659 were greater than one, indicating that China’s floor coverings (SITC 659) were very competitive in the U.S. market, in the face of worldwide competition, the elimination of China’s textile export tariff did not significantly stimulate the export of China’s floor coverings. This also shows that China needs to pay attention to the shortcomings of its production in this sector, compared with its competitors.
Although China’s market share in the United States in the SITC 84 sector was not as good as its share in SITC 65, it was far higher than that of India (Table 2). In the SITC 84 sector, the RCAs of China and India were all greater than one, and the RCA of India was even higher than that of China, especially in the SITC 841–845 sectors (Table 4). However, the U.S. import prices related to China in the SITC 84 sectors generally have more of a negative impact than those related to India. As Table 8 shows, in the sectors with available data, the negative impact of the U.S. import prices related to China on relative imports was greater in five sectors (SITC 841, SITC 842, SITC 844, SITC 845, and SITC 846) than those related to India; in other words, China had more of an impact on the U.S. relative to imports of clothing (SITC 84).
When China begins to impose strict ecological standards on textile production, China’s cloth products became more competitive in the U.S. market. We observe that had a negative impact on the U.S. relative imports at SITC 844 and SITC 846, which means that China’s textiles significantly influenced the U.S. import demand from other regions, due to the improvement of China’s ecological production standards. The adjustment of international textile environmental protection standards restricted the textile exports of other developing countries to the U.S. market. For China, even though it had a strict production system in place, the upgrading of the re-edited international textile ecological standards in 2008 did not significantly influence the U.S. global imports related to China and India, which indirectly indicates that even though China and India were major textile producers, the competition for clothing products of both countries did not seem to have a greater advantage than that of other textile and garment exporters, and China and India also had limited influence on the U.S. market. China’s clothing products often do not have a brand or a design identity, and if they are to remain competitive in the U.S. market, China will have to learn more from clothing brands abroad.
To be sure, China clothing products are still observed as very challenging for other competitors in the U.S. market. The U.S. global imports relative to China have been adversely affected by the abolition of taxes on 78 kinds of textile product, omitting only ITC 848. The influence has even spread to India, and apart from SITC 842 and SITC 844, the U.S. global imports relative to India have generally increased, which indirectly implies that China’s trade policy greatly impacts other textile exporters.
In summary, we find that the market shares of both China and India in the U.S. textile market increased up to 2016, and China had the highest market share. The U.S. imports of this kind are more affected by their prices from China across more sectors than by their prices from India. This effect became even more evident when China began raising environmental standards for its textile production in 2003. Both China and India are subject to international ecological production standards for textiles—or green trade barriers—in the American market. When we inspect the new standards of Oeko-Tex Standard 100 as re-edited in 2008, we find that the impact of the standards on the global imports of the United States related to China and India was not obviously significant. This means that under the influence of these re-edited standards, the impact of Chinese and Indian textiles in U.S. market was limited. However, with the abolition of Chinese export taxes on 78 kinds of product, it is obvious that China’s domestic export policy significantly stimulated textile exports and affected the global U.S. related imports.
7. Conclusions
Against the background of the substantial increase of Chinese textile exports after China’s entry to the WTO in 2000, we investigate the United States’ global imports in textile fabrics, textile yarn, and clothing products in relation to two major developing countries, China and India. Our emphasis was on examining the factors of implementing the ecological standards for China’s domestic textile production in 2003, the re-edited international Oeko-Tex Standard 100 in 2008, and China’s trade policy on the U.S. related imports in the face of green trade barriers.
We find that China’s share of textile yarn (SITC 65) and of clothing (SITC 84) in the U.S. market were greater than those of India, and the U.S. related imports were more affected by the prices from China than those from India in these two sectors. Since the share of textile fabrics (SITC 26) from India increased faster (Table 2), the impact of the U.S. import price relative to India on its global imports across all sectors in SITC 26 was greater than the price relative to China. Meanwhile, we also find that India’s RCA regarding textile yarn (SITC 65) and clothing (SITC 84) was greater than that of China in general. China’s main competitive advantages are a more mature infrastructure, and a higher equipment level than India’s, with a complete industrial chain, a large production scale, and a high degree of industrial cluster. Meanwhile, India’s competitive advantages are abundant raw materials, low labor costs, excellent design in products, high added value, fewer export restrictions, a language advantage, and government support. In recent years, India’s imports of production equipment and advanced technology have greatly improved the international competitiveness of its textile industry. Compared with China, India still has a rich labor force to come. In the long run, the competitiveness of India’s textile industry in the international market will continue to improve in the future, and this will have an unpredictable impact on China’s textile trade. At the same time, it will have a certain impact on other industries related to the textile industry. If China wants to maintain sustainable development and competitiveness in its textile industry, it must consider how best to deal with the potential competitive advantages of other textile-exporting countries in the future.
Although China’s share of exports to the United States has increased year by year since China’s entry to the WTO, the green trade barriers to textile exports have also affected China’s textile industry. The international environmental and ecological standards or Oeko-Tex Standard 100 in 1992 for textile production imposed great challenges on the textile industry in developing countries. With the gradual rising of green trade barriers, China began to implement mandatory production standards in 2003. On the one hand, the production of China’s domestic textiles has become more rigorous, which has strengthened its export controls and even made the United States shift its imports to other regions; on the other hand, due to the integration of Chinese product quality and international standards, the international status of Chinese textiles has been enhanced, which has led to a significant reduction in the U.S. global relative imports of textile raw materials such as vegetable fabrics (SITC 265), textile yarn (SITC651), knitted or crocheted fabrics (SITC655), and finished products (SITC844, SITC846, SITC848) and clothing, for instance, undergarments of textile fabrics (SITC 844 and SITC 846) and clothing accessories made of leather (SITC 848).
The mandatory requirements for textile production in China have even affected the U.S. textile standards for other regions. As a result, the global textile raw materials imports of the United States related to India have also decreased in five sectors: vegetable fabrics (SITC 265), synthetic and regenerated artificial fabrics (SITC266), wool and other animal hair (STIC268), old clothing and other old textile articles (SITC269), and fabrics woven of man-made textile materials (SITC653). Therefore, if China wants to continue the competitive position of its textile industry in the U.S. market, it will have to constantly adjust its production standards according to its own product characteristics, so as to maintain the sustainable competitiveness of Chinese textiles in the U.S. market.
China’s domestic textile production adopted a mandatory eco-environmental standard in 2003, but international standards are constantly being adjusted. We find that the impact of the re-edited Oeko-Tex Standard 100 on the U.S. global imports relative to China was not significant, which means that this adjustment did not affect the relative imports of the United States. It also indicates that the textile competitiveness of China and India was not strong enough to affect U.S. imports from other regions. However, China’s own trade policy has a significant impact on the related imports of the United States. With the rise of ecological standards and the abolition of 78 textile export taxes, China has greatly increased its textile exports, which has significantly affected the relative imports of the United States.
All textile products, including textile fabrics, textile yarn and clothing, were considered in this research as we comparatively analyzed the role of both China and India in the U.S. market. However, some results cannot be calculated due to the data problem, which takes the form of limited data coverage and measurement problems. For example, the exports or imports of China and India to the U.S. are not available in some sections such as wool and other animal hair (SITC262) and clothing accessories made of textile fabrics (SITC 847); as a result, the effects of both China and India in the U.S. market in these two sections cannot be calculated. Direct methods are best, but not always feasible due to data limitations, which can make even the available information on international green trade barriers (GTBs) difficult to interpret. An important theme is the many difficulties faced in obtaining accurate measures of green trade barriers. The U.S. as the most developed country has formulated a series of laws, regulations, and environmental standards to exert strict environmental protection and quarantine measures on imported textiles and clothing. In this paper, only the most authoritative and strictest green eco-textile standard or Oeko-Tex Standard 100 is conducted as a proxy of international green trade barriers (GBs). We observe that the of some sectors such as silk, cotton, and jute in textile fabrics was less than 0.4, implying that there could be some uncontrollable or unknown factors in these sectors such as silk, cotton, and jute influencing the responses and results. However, these were not considered in this research.
It would be valuable for further studies to investigate not only the U.S. but also other developed countries’ relative imports in textile-related products from other major exporters of textile, such as Mexico and Bangladesh. Furthermore, it would be worthwhile to consider more green trade barrier factors in relation to textile products, especially silk, cotton, and jute using some alternative techniques to explain the data and make robust results in further research.
Author Contributions
Acknowledgments
This study is financially supported by General Foundation of Jiangsu High Institutes Philosophy and Social Science (2015 SJD348), Jiangsu Province Social Science Foundation (17GLB023) and Jiangnan University Individual Research Fund Youth Project Foundation (JUSRP115A38) and partially funded by the National Natural Science Foundation of China (71503103), Natural Science Foundation of Jiangsu Province (BK20150157); Social Science Foundation of Jiangsu Province (14GLC008); Jiangsu Province University Philosophy and Social Sciences for Key Research Program(2017ZDIXM034); the Fundamental Research Funds for the Central Universities (2017JDZD06).
Conflicts of Interest
The authors declare no conflict of interest.
References
- Curran, L. Forecasting the trade outcomes of liberalisation in a quota context—What do we learn from changes in textiles trade after the ATC? J. World Trade 2008, 42, 129–150. [Google Scholar]
- Ghosh, M.; Rao, S. Chinese accession to the WTO: Economic implications for China, other Asian and North American economies. J. Policy Model. 2010, 32, 389–398. [Google Scholar] [CrossRef]
- Sun, C.; Ma, T.; Xu, M. Exploring the prospects of cooperation in the manufacturing industries between India and China: A perspective of embodied energy in India-China trade. Energy Policy 2018, 113, 643–650. [Google Scholar] [CrossRef]
- Besserman, J.; Mentzer, R.A. Review of global process safety regulations: United States, European Union, United Kingdom, China, India. J. Loss Prev. Process Ind. 2017, 50, 165–183. [Google Scholar] [CrossRef]
- Jiang, L.; Folmer, H.; Bu, M. Interaction between output efficiency and environmental efficiency: Evidence from the textile industry in Jiangsu Province, China. J. Clean. Prod. 2016, 113, 123–132. [Google Scholar] [CrossRef]
- Ferrantino, J.M.; WANG, Z. Accounting for discrepancies in bilateral trade: The case of China, Hong Kong, and the United States. China Econ. Rev. 2008, 19, 502–520. [Google Scholar] [CrossRef]
- Seyoum, B. Trade liberalization and patterns of strategic adjustment in the US textiles and clothing industry. Int. Bus. Rev. 2007, 16, 109–135. [Google Scholar] [CrossRef]
- Yadav, P. India’s Changing Trade Pattern in the Process of Globalization. Procedia Soc. Behav. Sci. 2012, 37, 157–166. [Google Scholar] [CrossRef]
- Parisi, M.L.; Fatarella, E.; Spinelli, D.; Pogni, R.; Basosi, R. Environmental impact assessment of an eco-efficient production for coloured textiles. J. Clean. Prod. 2015, 108, 514–524. [Google Scholar] [CrossRef]
- Chandra, P. Impact of temporary trade barriers: Evidence from China. China Econ. Rev. 2016, 38, 24–48. [Google Scholar] [CrossRef]
- Cao, X.; Lu, Y.; Zhang, Y. An overview of hexabromocyclododecane (HBCDs) in environmental media with focus on their potential risk and management in China. Environ. Pollut. 2018, 236, 283–295. [Google Scholar] [CrossRef] [PubMed]
- Zheng, D.; Shi, M. Multiple environmental policies and pollution haven hypothesis: Evidence from China’s polluting industries. J. Clean. Prod. 2017, 141, 295–304. [Google Scholar] [CrossRef]
- Yu, X. Coal mining and environmental development in southwest China. Environ. Dev. 2017, 21, 77–86. [Google Scholar] [CrossRef]
- Liu, Q.; Wang, S.; Zhang, W.; Zhan, D.; Li, J. Does foreign direct investment affect environmental pollution in China’s cities? A spatial econometric perspective. Sci. Total Environ. 2018, 613–614, 521–529. [Google Scholar] [CrossRef] [PubMed]
- Kang, Y.; Xie, B.; Wang, J.; Wang, Y. Environmental assessment and investment strategy for China’s manufacturing industry: A non-radial DEA based analysis. J. Clean. Prod. 2018, 175, 501–511. [Google Scholar] [CrossRef]
- Mair, S.; Druckman, A.; Jackson, T. Global inequities and emissions in Western European textiles and clothing consumption. J. Clean. Prod. 2016, 132, 57–69. [Google Scholar] [CrossRef] [Green Version]
- United Nations ComTrade Standard of International Trade Classification Rev 3, 2017. Available online: http://comtrade.un.org/ (accessed on 24 April 2018).
- Yu, W.; Li, X. Comparison of Competitiveness of Textiles between China and India. Int. Bus. 2008, 1, 23–27. [Google Scholar]
- Amighini, A.A. China and India in the international fragmentation of automobile production. China Econ. Rev. 2012, 23, 325–341. [Google Scholar] [CrossRef]
- Xu, K. Barriers to labor mobility and international trade: The case of China. China Econ. Rev. 2014, 29, 107–125. [Google Scholar] [CrossRef]
- Ruan, J.; Zhang, X. “Flying geese” in China: The textile and apparel industry’s pattern of migration. J. Asian Econ. 2014, 34, 79–91. [Google Scholar] [CrossRef]
- Peng, L.; Zhang, Y.; Wang, Y.; Zeng, X.; Yu, A. Energy efficiency and influencing factor analysis in the overall Chinese textile industry. Energy 2015, 93, 1222–1229. [Google Scholar] [CrossRef]
- Morck, R.; Yeung, B. China in Asia. China Econ. Rev. 2016, 40, 297–308. [Google Scholar] [CrossRef]
- Nimkar, U. Sustainable chemistry: A solution to the textile industry in a developing world. Curr. Opin. Green Sustain. Chem. 2018, 9, 13–17. [Google Scholar] [CrossRef]
- McDonald, S.; Robinson, S.; Thierfelder, K. Asian Growth and Trade Poles: India, China, and East and Southeast Asia. World Dev. 2008, 35, 210–234. [Google Scholar] [CrossRef]
- Pappas, D.; Chalvatzis, K.J.; Guan, D.; Li, X. Industrial Relocation and CO2 Emission Intensity: Focus on the Potential Cross-Country Shift from China to India and SE Asia. Energy Procedia 2017, 142, 2898–2904. [Google Scholar] [CrossRef]
- Pradhan, B.K.; Ghosh, J.; Yao, Y.; Liang, Q. Carbon pricing and terms of trade effects for China and India: A general equilibrium analysis. Econ. Model. 2017, 63, 60–74. [Google Scholar] [CrossRef]
- L’Abbate, P.; Dassisti, M.; Cappelletti, G.M.; Nicoletti, G.M.; Ioppolo, G. Environmental analysis of polyester fabric for ticking. J. Clean. Prod. 2018, 172, 735–742. [Google Scholar] [CrossRef]
- Bini-Smaghi, L. Exchange rate variability and trade: Why is it so difficult to find any empirical relationship? Appl. Econ. 1991, 23, 927–936. [Google Scholar] [CrossRef]
- Rauch, J.R. Networks versus markets in international trade. J. Int. Econ. 1999, 48, 7–37. [Google Scholar] [CrossRef]
- Broda, C.; Romalis, J. Identifying the relationship between trade and exchange rate volatility. In Commodity Prices and Markets, East Asia Seminar on Economics; University of Chicago Press: Chicago, IL, USA, 2011; Volume 20. [Google Scholar]
- Buongiorno, J.; Johnston, C.; Zhu, S. An assessment of gains and losses from international trade in the forest sector. For. Policy Econ. 2017, 80, 209–217. [Google Scholar] [CrossRef]
- Bas, M.; Mayer, T.; Thoenig, M. From micro to macro: Demand, supply, and heterogeneity in the trade elasticity. J. Int. Econ. 2017, 108, 1–19. [Google Scholar] [CrossRef]
- Campbell, A. Price and income elasticities of electricity demand: Evidence from Jamaica. Energy Econ. 2018, 69, 19–32. [Google Scholar] [CrossRef]
- Álvarez, I.C.; Barbero, J.; Rodríguez-Pose, A.; Zofío, J.L. Does Institutional Quality Matter for Trade? Institutional Conditions in a Sectoral Trade Framework. World Dev. 2018, 103, 72–87. [Google Scholar] [CrossRef]
- Aminu, N.; Meenagh, D.; Minford, P. The role of energy prices in the Great Recession—A two-sector model with unfiltered data. Energy Econ. 2018, 71, 14–34. [Google Scholar] [CrossRef]
- Xu, J. The role of China in the UK relative imports from three selected trading regions: The case of textile raw material industry. Int. J. Environ. Res. Public Health 2017, 14, 1481. [Google Scholar] [CrossRef] [PubMed]
- Armington, P. A theory of demand for products distinguished by place of production. IMF Staff Pap. 1969, 16, 170–201. [Google Scholar]
- Olekseyuk, Z.; Schürenberg-Frosch, H. Are Armington elasticities different across countries and sectors? A European study. Econ. Model. 2016, 55, 328–342. [Google Scholar] [CrossRef]
- Zellner, A. An efficient method of estimating seemingly unrelated regressions and tests for aggregation bias. J. Am. Stat. Assoc. 1962, 57, 348–368. [Google Scholar] [CrossRef]
- Ortiz, T.; Castillo, V.; Alfaro, G.T.; Rajagopal, E.T. Does textile sector trade of Mexico drive international competitive advantage. Int. J. Bus. Competition Growth 2010, 1, 162–176. [Google Scholar] [CrossRef]
- Mallick, S.; Marques, H. Does quality differentiation matter in exporters’ pricing behaviour? Comparing China and India. China Econ. Rev. 2016, 40, 71–90. [Google Scholar] [CrossRef]
- Zhao, L.; Xu, X. Generalized canonical correlation variables improved estimation in high dimensional seemingly unrelated regression models. Stat. Probab. Lett. 2017, 126, 119–126. [Google Scholar] [CrossRef]
Figure 1.
Total exports of China and India to the U.S. (Unit: Millions in USD). Source: UN ComTrade SITC Rev 3 [17].
Figure 1.
Total exports of China and India to the U.S. (Unit: Millions in USD). Source: UN ComTrade SITC Rev 3 [17].

Table 1.
United States (U.S.) textile imports: values and proportion in world textile imports. (Unit: USD in millions).
Table 1.
United States (U.S.) textile imports: values and proportion in world textile imports. (Unit: USD in millions).
| Year | Standard of International Trade Classification (SITC) | |||||||
|---|---|---|---|---|---|---|---|---|
| SITC 26 | SITC 65 | SITC 84 | Sum | |||||
| Textile Fabrics | Textile Yarns | Clothing | ||||||
| Value | % in World Textile Imports | Value | % in World Textile Imports | Value | % in World Textile Imports | Value | % in World Textile Imports | |
| 2000 | 691.47 | 0.18% | 15,985.03 | 4.12% | 67,114.95 | 17.30% | 83,791.45 | 21.6% |
| 2003 | 710.74 | 0.16% | 18,251.05 | 4.17% | 71,277.41 | 16.28% | 90,239.20 | 20.6% |
| 2005 | 1062.39 | 0.21% | 22,538.18 | 4.39% | 80,070.66 | 15.58% | 103,671.23 | 20.2% |
| 2007 | 1388.86 | 0.23% | 24,088.52 | 4.01% | 84,853.29 | 14.12% | 110,330.67 | 18.4% |
| 2010 | 1285.62 | 0.21% | 23,378.88 | 3.74% | 81,941.64 | 13.12% | 106,606.64 | 17.1% |
| 2012 | 1502.02 | 0.22% | 25,948.24 | 3.75% | 87,956.59 | 12.71% | 115,406.85 | 16.7% |
| 2014 | 1530.61 | 0.21% | 28,268.09 | 3.84% | 93,176.57 | 12.66% | 122,975.27 | 16.7% |
| 2016 | 1388.48 | 0.23% | 28,778.72 | 4.76% | 91,159.32 | 15.07% | 121,326.52 | 20.1% |
Source: United Nations (UN) ComTrade Standard of International Trade Classification (SITC) Rev 3, 2017 [17].
Table 2.
Share of China and India in textile market of the U.S.
| Year | Standard of International Trade Classification (SITC) | |||||
|---|---|---|---|---|---|---|
| SITC 26 | SITC 65 | SITC 84 | ||||
| Textile Fabrics | Textile Yarn | Clothing | ||||
| China | India | China | India | China | India | |
| 2000 | 3.38% | 0.77% | 12.17% | 7.57% | 13.30% | 3.21% |
| 2003 | 5.50% | 1.44% | 19.85% | 8.37% | 16.86% | 3.24% |
| 2005 | 13.23% | 2.50% | 26.90% | 9.03% | 26.40% | 4.22% |
| 2007 | 12.85% | 2.16% | 31.81% | 9.75% | 33.62% | 4.13% |
| 2010 | 18.64% | 4.58% | 37.36% | 11.23% | 40.88% | 4.18% |
| 2012 | 22.47% | 5.29% | 38.52% | 12.34% | 39.43% | 3.81% |
| 2014 | 20.43% | 7.00% | 39.55% | 13.07% | 38.11% | 4.06% |
| 2016 | 23.36% | 9.42% | 40.66% | 13.83% | 36.01% | 4.38% |
Source: UN ComTrade SITC Rev 3, 2017 [17].
Table 3.
Competition index of China and India in the U.S. market (competition index , means country exports to the U.S., means country imports from the U.S.).
Table 3.
Competition index of China and India in the U.S. market (competition index , means country exports to the U.S., means country imports from the U.S.).
| Code | Country | 2000 | 2003 | 2005 | 2007 | 2010 | 2012 | 2014 | 2016 |
|---|---|---|---|---|---|---|---|---|---|
| SITC 26 | China | −0.838 | −0.926 | −0.874 | −0.835 | −0.837 | −0.869 | −0.726 | −0.356 |
| India | −0.771 | −0.867 | −0.435 | −0.623 | −0.518 | −0.526 | −0.464 | −0.456 | |
| SITC261 | China | --- | --- | --- | --- | --- | --- | --- | 0.998 |
| India | 0.169 | 0.652 | 0.996 | --- | −0.940 | −0.888 | --- | --- | |
| SITC262 | China | --- | --- | --- | --- | --- | --- | --- | --- |
| India | --- | --- | --- | --- | --- | --- | --- | --- | |
| SITC263 | China | −0.997 | --- | --- | --- | --- | --- | --- | −0.997 |
| India | −0.988 | −0.999 | −0.994 | −0.974 | −0.983 | −0.984 | −0.990 | −0.986 | |
| SITC264 | China | --- | --- | --- | --- | --- | --- | --- | --- |
| India | --- | --- | −0.148 | --- | --- | --- | --- | 0.879 | |
| SITC265 | China | --- | --- | −0.843 | 0.938 | 0.723 | --- | 0.379 | --- |
| India | 0.705 | --- | --- | --- | 0.985 | 0.988 | --- | --- | |
| SITC266 | China | −0.340 | 0.223 | 0.654 | 0.421 | 0.607 | 0.627 | 0.548 | 0.630 |
| India | 0.286 | 0.326 | 0.813 | 0.771 | 0.835 | 0.882 | 0.908 | 0.917 | |
| SITC267 | China | −0.967 | −0.998 | −0.939 | −0.679 | −0.779 | −0.783 | −0.708 | 0.434 |
| India | −0.917 | −0.773 | −0.928 | −0.990 | −0.875 | −0.921 | −0.922 | −0.023 | |
| SITC268 | China | 0.457 | −0.417 | −0.283 | −0.441 | −0.508 | −0.389 | −0.052 | −0.152 |
| India | −0.513 | −0.773 | −0.574 | −0.578 | −0.666 | −0.006 | −0.260 | −0.987 | |
| SITC269 | China | 0.430 | −0.225 | −0.329 | −0.565 | −0.539 | −0.655 | −0.343 | −0.359 |
| India | −0.862 | −0.720 | −0.595 | −0.805 | −0.949 | −0.937 | −0.938 | −0.895 | |
| SITC 65 | China | 0.786 | 0.812 | 0.860 | 0.835 | 0.856 | 0.867 | 0.870 | 0.891 |
| India | 0.941 | 0.953 | 0.954 | 0.949 | 0.939 | 0.943 | 0.953 | 0.942 | |
| SITC651 | China | −0.166 | −0.031 | 0.389 | 0.413 | 0.323 | 0.304 | 0.313 | 0.360 |
| India | 0.335 | 0.523 | 0.661 | 0.716 | 0.517 | 0.526 | 0.675 | 0.413 | |
| SITC652 | China | 0.949 | 0.944 | 0.946 | 0.932 | 0.952 | 0.959 | 0.949 | 0.941 |
| India | 0.989 | 0.993 | 0.977 | 0.984 | 0.945 | 0.946 | 0.986 | 0.991 | |
| SITC653 | China | 0.589 | 0.547 | 0.860 | 0.818 | 0.850 | 0.879 | 0.858 | 0.844 |
| India | 0.839 | 0.921 | 0.912 | 0.919 | 0.924 | 0.916 | 0.970 | 0.974 | |
| SITC654 | China | 0.723 | 0.790 | 0.784 | 0.767 | 0.534 | 0.671 | 0.631 | 0.642 |
| India | 0.993 | 0.953 | 0.974 | 0.962 | 0.918 | 0.910 | 0.887 | 0.921 | |
| SITC655 | China | −0.510 | 0.716 | 0.897 | 0.821 | 0.918 | 0.939 | 0.953 | 0.965 |
| India | 0.282 | 0.908 | 0.841 | 0.948 | 0.938 | 0.851 | 0.962 | 0.960 | |
| SITC656 | China | 0.267 | 0.674 | 0.803 | 0.854 | 0.833 | 0.866 | 0.871 | 0.890 |
| India | 0.844 | 0.691 | 0.778 | 0.700 | 0.840 | 0.757 | 0.862 | 0.867 | |
| SITC657 | China | 0.028 | −0.300 | 0.017 | −0.034 | 0.387 | 0.494 | 0.540 | 0.630 |
| India | −0.002 | 0.257 | 0.108 | 0.273 | 0.456 | 0.499 | 0.323 | 0.341 | |
| SITC658 | China | 0.994 | 0.993 | 0.991 | 0.992 | 0.992 | 0.992 | 0.991 | 0.991 |
| India | 0.991 | 0.998 | 0.998 | 0.997 | 0.994 | 0.996 | 0.995 | 0.997 | |
| SITC659 | China | 0.951 | 0.972 | 0.951 | 0.911 | 0.873 | 0.893 | 0.919 | 0.926 |
| India | 0.980 | 0.968 | 0.962 | 0.950 | 0.946 | 0.958 | 0.968 | 0.972 | |
| SITC 84 | China | 0.997 | 0.996 | 0.997 | 0.998 | 0.998 | 0.997 | 0.997 | 0.996 |
| India | 0.999 | 0.999 | 0.998 | 0.998 | 0.995 | 0.992 | 0.994 | 0.995 | |
| SITC841 | China | --- | 0.999 | 0.999 | 0.999 | 0.999 | 0.999 | 0.998 | 0.995 |
| India | 0.999 | 0.999 | 0.998 | 0.998 | 0.998 | 0.993 | 0.993 | 0.997 | |
| SITC842 | China | --- | --- | --- | 0.999 | 0.998 | 0.997 | 0.997 | 0.994 |
| India | --- | --- | 0.999 | --- | 0.998 | 0.996 | 0.998 | 0.998 | |
| SITC843 | China | 0.997 | 0.998 | 0.999 | --- | 0.999 | 0.994 | 0.999 | 0.994 |
| India | --- | --- | 0.999 | --- | 0.999 | 0.998 | 0.999 | 0.999 | |
| SITC844 | China | 0.999 | 0.996 | 0.997 | 0.998 | 0.996 | 0.996 | 0.997 | 0.998 |
| India | --- | 0.999 | 0.997 | --- | 0.998 | 0.994 | 0.993 | 0.998 | |
| SITC845 | China | 0.995 | 0.997 | 0.999 | 0.999 | 0.999 | 0.999 | 0.999 | 0.998 |
| India | 0.999 | 0.998 | 0.998 | 0.998 | 0.995 | 0.994 | 0.995 | 0.995 | |
| SITC846 | China | 0.953 | 0.976 | 0.987 | 0.994 | 0.997 | 0.997 | 0.997 | 0.996 |
| India | 0.995 | 0.995 | 0.983 | 0.967 | 0.982 | 0.986 | 0.982 | 0.982 | |
| SITC847 | China | --- | --- | --- | --- | --- | --- | --- | --- |
| India | --- | --- | --- | --- | --- | --- | --- | --- | |
| SITC848 | China | 0.998 | 0.997 | 0.994 | 0.993 | 0.993 | 0.991 | 0.990 | 0.989 |
| India | 0.993 | 0.992 | 0.992 | 0.974 | 0.917 | 0.919 | 0.971 | 0.954 |
Note: (1). Original data is from the UN ComTrade SITC Rev. 3, 2017 [17], and results are calculated by the authors. (2). In the consensus of the competitiveness index, the statistical result is 1 or −1 due to the lack of import and export data, or the exports or imports alone.
Table 4.
Revealed Competitive Advantages (RCA) in the Textile Trading of China and India in the U.S. Market. (revealed comparative advantage index , means textile export of country to the U.S. and the world, means the total export of country to the U.S. and the world. When the RCA is calculated here, added value is used instead of total exports in order to avoid bias.)
| Code | Sector | Countries | 2000 | 2003 | 2005 | 2007 | 2010 | 2012 | 2014 | 2016 |
|---|---|---|---|---|---|---|---|---|---|---|
| SITC 26 | Textile Fabrics | China | 0.072 | 0.157 | 0.465 | 0.441 | 0.515 | 0.541 | 0.482 | 0.503 |
| India | 0.207 | 0.360 | 0.306 | 0.082 | 0.104 | 0.114 | 0.158 | 0.313 | ||
| SITC261 | Silk | China | 0.001 | 0.000 | 0.002 | 0.000 | 0.001 | 0.001 | 0.003 | 0.002 |
| India | 0.185 | 1.155 | 0.703 | 0.207 | 0.013 | 0.031 | 0.015 | 0.031 | ||
| SITC263 | Cotton | China | 0.001 | 0.000 | 0.000 | 0.000 | 0.000 | 0.000 | 0.000 | 0.277 |
| India | 0.015 | 0.005 | 0.002 | 0.004 | 0.002 | 0.002 | 0.001 | 0.007 | ||
| SITC264 | Jute | China | 0.033 | 0.000 | 0.000 | 0.000 | 0.000 | 0.000 | 0.000 | 0.000 |
| India | 0.010 | 0.134 | 0.276 | 0.069 | 0.045 | 0.038 | 0.061 | 0.027 | ||
| SITC265 | Vegetable fabrics | China | 0.013 | 0.032 | 0.007 | 0.167 | 0.006 | 0.006 | 0.006 | 0.000 |
| India | 1.538 | 1.499 | 0.999 | 0.590 | 0.819 | 0.789 | 0.435 | 0.883 | ||
| SITC266 | Synthetic and regenerated artificial fabrics | China | 0.966 | 0.819 | 1.474 | 0.968 | 1.004 | 1.122 | 0.841 | 0.874 |
| India | 0.344 | 0.549 | 1.240 | 0.709 | 1.006 | 1.199 | 1.327 | 1.335 | ||
| SITC267 | Waste materials from textile fabrics | China | 1.586 | 0.109 | 1.166 | 0.805 | 1.027 | 0.602 | 0.842 | 0.820 |
| India | 0.076 | 0.260 | 0.090 | 0.008 | 0.058 | 0.038 | 0.041 | 0.499 | ||
| SITC268 | Wool and other animal hair | China | 0.077 | 0.027 | 0.049 | 0.070 | 0.031 | 0.031 | 0.037 | 0.044 |
| India | 0.169 | 0.133 | 0.121 | 0.091 | 0.238 | 0.735 | 0.734 | 0.003 | ||
| SITC269 | Old clothing and other old textile articles | China | 0.278 | 0.867 | 1.763 | 0.798 | 0.462 | 0.163 | 0.118 | 0.026 |
| India | 0.686 | 1.269 | 2.447 | 1.674 | 0.170 | 0.225 | 0.149 | 0.247 | ||
| SITC 65 | Textile yarn | China | 0.365 | 0.392 | 0.560 | 0.569 | 0.613 | 0.598 | 0.592 | 0.602 |
| India | 0.810 | 1.009 | 1.301 | 1.361 | 1.541 | 1.466 | 1.371 | 1.384 | ||
| SITC651 | Textile yarn | China | 0.057 | 0.076 | 0.154 | 0.167 | 0.213 | 0.222 | 0.259 | 0.251 |
| India | 0.061 | 0.086 | 0.147 | 0.150 | 0.131 | 0.129 | 0.114 | 0.104 | ||
| SITC652 | Cotton fabrics woven | China | 0.222 | 0.136 | 0.145 | 0.132 | 0.142 | 0.130 | 0.110 | 0.103 |
| India | 0.576 | 0.489 | 0.465 | 0.420 | 0.425 | 0.318 | 0.244 | 0.222 | ||
| SITC653 | Fabrics woven of man-made textile materials | China | 0.129 | 0.094 | 0.222 | 0.196 | 0.198 | 0.200 | 0.174 | 0.151 |
| India | 0.165 | 0.259 | 0.268 | 0.273 | 0.267 | 0.320 | 0.330 | 0.377 | ||
| SITC654 | Other textile fabrics woven | China | 0.214 | 0.173 | 0.234 | 0.270 | 0.207 | 0.274 | 0.249 | 0.245 |
| India | 1.603 | 1.678 | 1.585 | 1.649 | 1.125 | 1.494 | 1.435 | 1.161 | ||
| SITC655 | Knitted or crocheted fabrics | China | 0.011 | 0.048 | 0.173 | 0.113 | 0.290 | 0.300 | 0.285 | 0.272 |
| India | 0.150 | 0.185 | 0.994 | 2.020 | 2.390 | 1.305 | 1.256 | 1.026 | ||
| SITC656 | Tulle, lace, embroidery, ribbons etc. | China | 0.188 | 0.378 | 0.395 | 0.283 | 0.360 | 0.409 | 0.429 | 0.387 |
| India | 0.672 | 0.558 | 0.807 | 0.750 | 0.882 | 0.609 | 0.570 | 0.497 | ||
| SITC657 | Special yarn and related products | China | 0.326 | 0.282 | 0.386 | 0.382 | 0.486 | 0.516 | 0.537 | 0.556 |
| India | 0.456 | 0.647 | 0.646 | 0.903 | 1.485 | 1.290 | 0.749 | 1.027 | ||
| SITC658 | Made up articles | China | 0.913 | 1.143 | 1.489 | 1.632 | 1.594 | 1.517 | 1.490 | 1.612 |
| India | 1.634 | 2.156 | 2.527 | 3.078 | 4.474 | 3.797 | 3.575 | 3.177 | ||
| SITC659 | Floor coverings | China | 2.075 | 2.089 | 1.573 | 1.434 | 0.933 | 1.123 | 1.107 | 1.135 |
| India | 2.088 | 2.463 | 2.669 | 2.870 | 2.875 | 3.164 | 3.083 | 2.954 | ||
| SITC 84 | Clothing | China | 0.633 | 0.596 | 0.862 | 0.851 | 1.080 | 1.057 | 1.058 | 1.138 |
| India | 1.483 | 1.419 | 1.917 | 2.111 | 2.369 | 1.773 | 1.581 | 1.372 | ||
| SITC841 | Clothing except fur clothing | China | 0.633 | 0.596 | 0.862 | 0.851 | 1.080 | 1.057 | 1.058 | 1.138 |
| India | 1.454 | 1.768 | 2.510 | 2.517 | 2.531 | 1.967 | 1.676 | 1.274 | ||
| SITC842 | Fur clothing and articles of women’s clothing | China | 0.731 | 0.617 | 1.077 | 1.188 | 1.406 | 1.417 | 1.105 | 1.111 |
| India | 1.891 | 2.103 | 2.247 | 2.349 | 2.457 | 1.957 | 1.735 | 1.631 | ||
| SITC843 | Women’s, girls’, and infants’ outerwear | China | 0.131 | 0.157 | 0.454 | 0.542 | 0.559 | 0.488 | 0.599 | 0.709 |
| India | 1.720 | 1.326 | 2.259 | 2.790 | 2.824 | 1.732 | 1.552 | 1.253 | ||
| SITC844 | Undergarments of textile fabrics, not knitted or crocheted | China | 0.154 | 0.174 | 0.678 | 0.615 | 0.865 | 0.773 | 0.904 | 1.121 |
| India | 1.064 | 0.712 | 1.528 | 2.010 | 2.568 | 1.847 | 1.579 | 1.146 | ||
| SITC845 | Outerwear knitted or crocheted, not elastic nor rubberized | China | 0.542 | 0.559 | 0.847 | 0.761 | 1.117 | 1.191 | 1.270 | 1.366 |
| India | 1.152 | 0.930 | 1.448 | 1.939 | 2.645 | 1.929 | 1.698 | 1.524 | ||
| SITC846 | Undergarments, knitted or crocheted | China | 0.381 | 0.746 | 0.872 | 0.906 | 0.998 | 1.031 | 1.119 | 1.101 |
| India | 0.764 | 0.581 | 0.780 | 0.686 | 0.989 | 0.893 | 0.716 | 0.589 | ||
| SITC848 | Article or apparel, clothing accessories of leather | China | 1.825 | 1.400 | 1.114 | 1.635 | 1.470 | 1.449 | 1.312 | 1.246 |
| India | 1.089 | 0.808 | 0.847 | 0.790 | 0.898 | 0.807 | 1.109 | 0.951 |
Note: Original data is from UN ComTrade SITC Rev. 3, 2017 [17]; results are calculated by authors.
Table 5.
Standard of international trade classification sectors classification.
| Industry | Sectors |
|---|---|
| SITC 26 Textile fabrics not manufactured, and waste | SITC 261—Silk; |
| SITC 262—Wool and other animal hair; | |
| SITC 263—Cotton; | |
| SITC 264—Jute; | |
| SITC 265—Vegetable fabrics, except cotton and jute; | |
| SITC 266—Synthetic and regenerated artificial fabrics; | |
| SITC 267—Waste materials from textile fabrics; | |
| SITC 268—Wool and other animal hair; | |
| SITC 269—Old clothing and other old textile articles; | |
| SITC 65 Textile yarn, fabrics, made-up articles, and related products | SITC 651—Textile yarn; |
| SITC 652—Cotton fabrics woven; | |
| SITC 653—Fabrics woven of man-made textile materials; | |
| SITC654—Other textile fabrics woven; | |
| SITC 655—Knitted or crocheted fabrics; | |
| SITC 656—Tulle, lace, embroidery, ribbons, etc. | |
| SITC 657—Special yarn and related products; | |
| SITC 658—Made-up articles; | |
| SITC 659—Floor coverings. | |
| SITC 84 Clothing | SITC 841—Clothing except fur clothing; |
| SITC 842—Fur clothing and article of artificial clothing; | |
| SITC 843—Women’s, girls’ and infants’ outerwear, textile, not knitted or crocheted; | |
| SITC 844—Undergarments of textile fabrics, not knitted or crocheted; | |
| SITC 845—Outerwear knitted or crocheted, not elastic nor rubberized; | |
| SITC 846—Undergarments, knitted or crocheted; | |
| SITC 847—Clothing accessories made of textile fabrics; | |
| SITC 848—Articles of apparel, clothing accessories of leather. |
Note: Data is from UN ComTrade SITC Rev. 3, 2017 [17] and compiled by authors.
Table 6.
Impact of Chinese and Indian textile fabrics on U.S. imports using the Seemingly Unrelated Regression (SUR) model.
Table 6.
Impact of Chinese and Indian textile fabrics on U.S. imports using the Seemingly Unrelated Regression (SUR) model.
| Variables | Impact Countries | Constant | R2 | Observations | |||||
|---|---|---|---|---|---|---|---|---|---|
| SITC 26 | |||||||||
| Sector 1. Silk | China | 0.208 ** (2.49) | −0.011 *** (3.05) | 0.189 * (1.75) | −0.025 (0.28) | 0.026 (0.34) | 0.335 | 17 | |
| India | 0.849 *** (3.48) | −0.247 *** (3.81) | −0.325 (1.05) | 0.111 (0.41) | 0.355 (1.58) | 0.661 | 17 | ||
| Sector 2. Wool and other animal hair | China | --- | --- | --- | --- | --- | --- | --- | |
| India | --- | --- | --- | --- | --- | --- | --- | ||
| Sector 3. Cotton | China | 2.829 *** (7.44) | −0.062 *** (3.14) | −0.047 (0.10) | −0.40 (1.01) | −0.105 (0.30) | 0.332 | 16 | |
| India | 1.897 *** (5.11) | −2.760 *** (4.05) | 0.172 (0.38) | −0.425 (1.01) | −0.541 (1.64) | 0.544 | 16 | ||
| Sector 4. Jute | China | 1.464 *** (5.72) | −0.061 *** (3.20) | 0.670 * (1.94) | 0.044 (0.16) | −0.452 * (1.88) | 0.363 | 16 | |
| India | 0.871 (2.63) | −0.804 *** (3.39) | −0.026 (0.07) | 0.201 (0.70) | −0.141 (0.60) | 0.264 | 16 | ||
| Sector 5. Vegetable fabrics, except cotton and jute | China | 2.104 *** (10.81) | −0.266 *** (2.89) | −0.322 *** (3.17) | −0.078 (0.91) | −0.566 *** (7.05) | 0.923 | 16 | |
| India | 1.346 *** (6.24) | −1.484 *** (3.12) | −0.401 *** (2.47) | 0.096 (0.73) | −0.239 (1.18) | 0.920 | 16 | ||
| Sector 6. Synthetic and regenerated artificial fabrics | China | 1.452 *** (5.76) | −0.594 *** (2.70) | −0.137 (0.33) | −0.049 (0.59) | −0.526 (7.86) | 0.954 | 16 | |
| India | 1.858 *** (11.18) | −3.116 *** (3.87) | −0.361 ** (2.19) | 0.063 (0.48) | −0.471 *** (4.20) | 0.821 | 16 | ||
| Sector 7. Waste materials from textile fabrics | China | 1.625 *** (4.89) | −3.746 *** (2.44) | 0.099 (0.42) | 0.151 (0.80) | −0.963 *** (3.22) | 0.927 | 16 | |
| India | 3.450 *** (5.07) | −2.141 *** (3.99) | 0.902 (1.15) | 0.387 (0.68) | −2.17 ** (2.00) | 0.641 | 16 | ||
| Sector 8. Wool and other animal hair | China | 1.188 *** (8.76) | −0.304 *** (5.29) | −0.079 (0.80) | 0.040 (0.39) | −0.206 *** (2.59) | 0.480 | 16 | |
| India | 5.244 *** (16.29) | −2.033 *** (6.42) | −1.831 *** (4.14) | 0.053 (0.13) | −1.856 *** (6.07) | 0.930 | 16 | ||
| Sector 9. Old clothing and other old textiles | China | −0.206 *** (2.59) | −0.304 *** (2.24) | −0.079 (0.80) | 0.040 (0.39) | −0.206 ** (2.59) | 0.727 | 16 | |
| India | 3.669 *** (4.87) | −0.457 *** (3.66) | −1.725 ** (3.07) | −0.017 (0.10) | −0.246 (1.45) | 0.895 | 16 | ||
Note: * means significant at 10%, ** means significant at 5%, *** means significant at 1%. Original data is from UN ComTrade SITC Rev. 3, 2017 [17]; results are calculated by authors.
Table 7.
Impact of Chinese and Indian textile yarn on the U.S. imports using the SUR model.
| Variables | Impact Countries | Constant | R2 | Obs | |||||
|---|---|---|---|---|---|---|---|---|---|
| SITC 65 | |||||||||
| Sector 1. Textile yarn | China | 1.346 *** (5.31) | −1.535 *** (2.66) | −0.354 *** (2.55) | 0.039 (0.25) | −0.534 *** (4.84) | 0.898 | 16 | |
| India | 1.772 *** (7.44) | −1.650 *** (3.87) | −0.085 (0.81) | −0.209 (1.21) | −0.298 (1.72) | 0.907 | 16 | ||
| Sector 2. Cotton fabrics woven | China | 0.813 *** (11.4) | −2.897 *** (3.12) | −0.129 * (1.85) | −0.097 (1.27) | −0.435 *** (7.80) | 0.907 | 15 | |
| India | 1.356 *** (4.29) | −0.722 *** (3.55) | 0.067 (0.83) | 0.053 (0.59) | −0.074 (1.19) | 0.705 | 16 | ||
| Sector 3. Fabrics woven of man-made textile materials | China | 1.014 *** (11.29) | −1.061 ** (2.33) | −0.121 * (1.79) | 0.094 (1.43) | −0.405 *** (7.58) | 0.950 | 16 | |
| India | 1.376 *** (6.21) | −4.45 *** (3.54) | −0.293 *** (2.39) | 0.362 *** (2.83) | 1.019 (2.27) | 0.938 | 16 | ||
| Sector 4. Other textile fabrics woven | China | 0.950 *** (15.43) | −1.128 *** (2.99) | 0.088 (1.08) | 0.012 (0.20) | −0.109 ** (2.13) | 0.924 | 16 | |
| India | 0.568 *** (4.74) | −0.949 ** (2.32) | −0.080 (1.28) | 0.019 (0.26) | 0.148 *** (3.21) | 0.795 | 16 | ||
| Sector 5. Knitted or crocheted fabrics | China | 2.462 *** (18.85) | −3.387 *** (3.54) | −0.889 *** (6.66) | 0.215 (1.84) | −0.619 *** (5.68) | 0.956 | 16 | |
| India | 2.98 *** (18.17) | −0.176 ** (2.19) | −0.251 (1.36) | −0.138 (0.68) | −1.133 *** (6.30) | 0.923 | 16 | ||
| Sector 6. Tulle, lace, embroidery, ribbons, etc. | China | 0.746 *** (12.78) | −0.984 *** (6.03) | −0.043 (0.83) | −0.069 ** (1.97) | −0.201 *** (7.62) | 0.984 | 16 | |
| India | 1.438 *** (58.96) | −0.657 *** (3.08) | 0.056 (1.20) | 0.045 (1.21) | −0.044 (1.37) | 0.843 | 16 | ||
| Sector 7. Special yarn and related products | China | 0.972 *** (47.52) | −0.460 *** (2.88) | −0.560 (1.56) | −0.114 *** (16.98) | −0.109 *** (2.72) | 0.997 | 16 | |
| India | 2.581 *** (2.05) | −4.012 *** (3.56) | 1.353 (1.03) | −0.137 ** (2.24) | −0.112 *** (1.21) | 0.866 | 16 | ||
| Sector 8. Made up articles | China | 0.436 *** (6.37) | −2.149 *** (2.63) | 0.040 (0.53) | −0.015 (0.43) | −0.150 *** (6.83) | 0.954 | 16 | |
| India | 0.962 *** (10.06) | −0.247 *** (3.20) | 0.004 (0.04) | 0.037 (0.42) | −0.104 (1.51) | 0.864 | 16 | ||
| Sector 9. Flooring coverings, etc. | China | 1.48 ** (2.22) | −1.165 *** (3.98) | −0.169 (1.16) | 0.051 (0.90) | −0.440 (1.38) | 0.796 | 16 | |
| India | 0.666 *** (19.79) | −0.179 ** (2.45) | −0.044 (2.08) | −0.022 (0.89) | −0.028 (1.36) | 0.791 | 16 | ||
Note: * means significant at 10%, ** means significant at 5%, *** means significant at 1%. Original data is from UN ComTrade SITC Rev. 3, 2017 [17]; results are calculated by authors.
Table 8.
Impact of Chinese and Indian clothing on the U.S. imports using the SUR Model.
| Variables | Impact Countries | Constant | R2 | Obs | |||||
|---|---|---|---|---|---|---|---|---|---|
| SITC 84 | |||||||||
| Sector 1. Clothing except fur clothing; | China | 1.189 *** (17.49) | −1.388 *** (3.85) | −0.130 (1.91) | 0.015 (0.27) | −0.469 *** (8.16) | 0.933 | 16 | |
| India | 1.518 ** (28.94) | −0.272 *** (3.79) | −0.078 (1.91) | −0.021 (0.61) | 0.080 *** (2.51) | 0.742 | 16 | ||
| Sector 2. Fur clothing & articles of artificial clothing; | China | 0.645 ** (7.06) | −0.745 *** (3.72) | 0.012 (0.19) | −0.062 (1.46) | −0.270 *** (4.61) | 0.950 | 16 | |
| India | 1.278 ** (46.96) | −0.276 *** (2.97) | −0.022 (0.81) | −0.005 (0.16) | −0.037 (1.28) | 0.643 | 16 | ||
| Sector 3. Women’s, girls’ and infants’ outerwear, etc. | China | 1.738 ** (6.05) | −0.308 ** (2.47) | −0.158 (1.34) | −0.064 (0.47) | −0.704 *** (5.38) | 0.936 | 16 | |
| India | 1.040 ** (6.58) | −0.544 *** (2.76) | −0.115 (1.24) | −0.074 (1.02) | 0.160 *** (2.36) | 0.510 | 16 | ||
| Sector 4. Undergarments of textile fabrics, not knitted or crocheted; | China | 2.207 ** (5.70) | −1.433 ** (2.27) | −0.241 *** (2.71) | −0.055 (0.54) | −0.401 *** (3.33) | 0.954 | 16 | |
| India | 2.540 ** (21.43) | −1.047 *** (4.55) | 0.067 (1.08) | −0.016 (0.11) | −0.078 (1.19) | 0.960 | 16 | ||
| Sector 5. Outerwear knitted or crocheted, not elastic nor rubberized; | China | 0.954 ** (11.63) | −0.447 *** (3.97) | −0.084 (1.07) | −0.014 (0.27) | −0.371 *** (8.11) | 0.919 | 16 | |
| India | 1.686 ** (42.01) | −0.063 *** (3.22) | 0.002 (0.02) | 0.018 (0.48) | 0.218 *** (7.61) | 0.883 | 16 | ||
| Sector 6. Undergarments, knitted or crocheted; | China | 0.795 ** (14.16) | −1.964 *** (2.81) | −0.332 *** (3.96) | 0.083 (1.25) | −0.209 *** (3.42) | 0.887 | 16 | |
| India | 1.905 ** (28.60) | −0.868 *** (4.71) | 0.031 (0.70) | −0.186 *** (1.04) | 0.084 *** (2.80) | 0.819 | 16 | ||
| Sector 7. Clothing accessories of textile fabrics; | China | --- | --- | --- | --- | --- | --- | --- | |
| India | --- | --- | --- | --- | --- | --- | --- | ||
| Sector 8. Article s of apparel, clothing accessories of leather. | China | 0.237 ** (2.43) | −0.607 *** (3.08) | −0.048 *** (3.50) | −0.043 (0.18) | −0.023 (1.02) | 0.938 | 16 | |
| India | 1.103 ** (3.06) | −0.912 *** (4.20) | 0.178 *** (7.99) | −0.016 (0.87) | 0.131 *** (4.89) | 0.979 | 16 | ||
Note: * means significant at 10%, ** means significant at 5%, *** means significant at 1%. Original data is from UN ComTrade SITC Rev. 3, 2017; results are calculated by authors.
© 2018 by the authors. Licensee MDPI, Basel, Switzerland. This article is an open access article distributed under the terms and conditions of the Creative Commons Attribution (CC BY) license (http://creativecommons.org/licenses/by/4.0/).
Share and Cite
MDPI and ACS Style
Xu, J.; Liu, Y.; Yang, L. A Comparative Study of the Role of China and India in Sustainable Textile Competition in the U.S. Market under Green Trade Barriers. Sustainability 2018, 10, 1348. https://doi.org/10.3390/su10051348
AMA Style
Xu J, Liu Y, Yang L. A Comparative Study of the Role of China and India in Sustainable Textile Competition in the U.S. Market under Green Trade Barriers. Sustainability. 2018; 10(5):1348. https://doi.org/10.3390/su10051348
Chicago/Turabian StyleXu, Junqian, Yong Liu, and Liling Yang. 2018. "A Comparative Study of the Role of China and India in Sustainable Textile Competition in the U.S. Market under Green Trade Barriers" Sustainability 10, no. 5: 1348. https://doi.org/10.3390/su10051348
Note that from the first issue of 2016, this journal uses article numbers instead of page numbers. See further details here.