Article

A Social Assessment of the Usage of Renewable Energy Sources and Its Contribution to Life Quality: The Case of an Attica Urban Area in Greece

by
Stamatios Ntanos
1,*,
Grigorios Kyriakopoulos
2,
Miltiadis Chalikias
3,
Garyfallos Arabatzis
1,
Michalis Skordoulis
1,
Spyros Galatsidas
1 and
Dimitrios Drosos
4
1
Department of Forestry and Management of the Environment and Natural Resources, School of Agricultural and Forestry Sciences, Democritus University of Thrace, 68200 Orestiada, Greece
2
School of Electrical and Computer Engineering, National Technical University of Athens, 15780 Zografou, Greece
3
Department of Tourism Management, School of Business, Economics and Social Sciences, University of West Attica, 12244 Egaleo, Greece
4
Department of Business Administration, School of Business, Economics and Social Sciences, University of West Attica, 12244 Egaleo, Greece
*
Author to whom correspondence should be addressed.
Sustainability 2018, 10(5), 1414; https://doi.org/10.3390/su10051414
Submission received: 28 March 2018 / Revised: 15 April 2018 / Accepted: 28 April 2018 / Published: 3 May 2018

Abstract

:
The aim of this paper is to analyze and evaluate the use of Renewable Energy Sources (RES) and their contribution to citizens’ life quality. For this purpose, a survey was conducted using a sample of 400 residents in an urban area of the Attica region in Greece. The methods of Principal Components Analysis and Logit Regression were used on a dataset containing the respondents’ views on various aspects of RES. Two statistical models were constructed for the identification of the main variables that are associated with the RES’ usage and respondents’ opinion on their contribution to life quality. The conclusions that can be drawn show that the respondents are adequately informed about some of the RES’ types while most of them use at least one of the examined types of RES. The benefits that RES offer, were the most crucial variable in determining both respondents’ perceptions on their usage and on their contribution to life quality.

1. Introduction

Nowadays the key-determinants of public attitudes towards green energy schemes are the accelerated pace of energy demand—based on limited resources in conventional energy sources—and the understanding for a greater penetration of “greener” energy due to devastating climate changes on the planet [1]. The link between energy, economic development, and carbon release is a critical research topic [2,3]. The ongoing regional adaptability of Renewable Energy Sources (RES) to national energy mixes attracted global interest, including that of countries such as Greece [4,5,6,7], Turkey [8], Spain [9,10], Ukraine [11], Western Europe [12,13,14,15], Japan [16], and China [17,18].
Social perceptions vary according to the type of RES investment. Concerning wind investments, social perceptions show that there exist largely approved benefits such as competitiveness, sustainability, lower energy costs, energy independence and local development. On the other hand, local communities often tend to contrast the development of RES due to the relevant costs burdened by the society. Such critical aspects of consideration are the relative aesthetic and acoustic impacts as well as impacts on the territory, in alignment with the spatial localization of wind farms that can undermine the viability of the relevant projects [19]. Local citizens could endanger the objectivity of the outcomes, since they could be prejudiced and concerned about the project consequences [20]. Besides, co-ownership is effectively manipulating the financial constraints of large RES-based projects, which fall beyond the financial possibilities of most communities, leaving the co-ownership perspective as a viable option of large-scale development of RES technologies [21].
Small hydropower (SHP) stations are beneficial for electricity production. The development of SHP sustains a wide spectrum of opportunities to the rural and suburban areas, including the installation of hydraulic works made for other purposes, such as irrigation canals, and dams for water supply purposes. Additionally, these investments have low maintenance costs and extended useful life. Nevertheless, social disproval and opposition can be possibly expressed against hydroelectricity, especially in areas where large dams are built. In this respect, the construction and operation of hydropower stations apparently affect the environmental, social, economic, and political aspects. The social adaptation of SHP, especially in Greece, should be in alignment with a long-term energy policy plan [22]. It is also noteworthy that—based on the qualitative and empirical evidence on hydropower research—the participation and involvement of local communities in hydropower projects are positively associated with their acceptance [23].
Electricity produced by photovoltaic (PV) stations is another type of RES. In many countries, the public communities overwhelmingly support the development of large-scale solar installations [24]. However, when these investments are near residential areas, social opposition and communal objections arise from various stakeholders, thus, the direct benefits to residents should be offered. In a behavioral-based survey, the variables of perceived costs, maintenance requirements, and environmental concerns were evaluated, showing significant differences between RES users and non-users [25]. Marketable cost and operational performance of PVs vary, from place to place. If no subsidy is given, there should be a significant drop in the installation cost of PVs while governmental policies can be drawn under the specifications of solar radiation levels and the maximum income tax rates per installation area [26]. Efficiency is a parameter of utmost importance for the diffusion of PVs while for site space adequacy, the built-in PVs as roof-PV mounting or as wall PVs were suggested [27]. Photovoltaic installations can be ideally applied in Greece, due to county’s abundant sunlight, while governments must lift the prohibition on issuing new photovoltaic licenses and take all the measures needed for market expansion [28].
As we may conclude from the above analysis, public acceptance is an important issue for RES policy implementations and its targets achievement. Thus, many researchers have dealt with the social acceptance of RES. Devine-Wright [29] in a review article, has classified a range of potential factors explaining social perceptions on RES. These factors are, namely, personal (age, gender, class, income), social-psychological (knowledge and direct experience, environmental and political beliefs, place attachment), and contextual (technology type and scale, institutional structure, and spatial context) [29]. Furthermore, there is clear evidence that RES positively contributes to citizens’ life quality [30].
Previous research results show that citizens in Greece are sufficiently informed and willing to invest in RES [31]. Thus, it is a fact that nowadays, most of the citizens are demanding more incentives to use RES than in the past, as they are not only willing to invest in RES, but also believe that those investments can improve their lives’ quality [30].
Attica is studied as a case that bears particular significance for Greece and the broader region, given both the lack of research on its citizens’ views about RES and the fact that it is a highly populous metropolitan area. It is easy to realize that the majority of the contemporary studies about social acceptance of RES in Greece, concern provincial regions such as these of Lesvos [6], Pella [22], Andros [32], Crete [30], Larissa [33,34], and Ioannina [35]. In fact, such regions are in the spotlight as their climate supports energy production based on RES [36]. However, it is important to analyze citizens’ views on RES in metropolitan areas where energy needs are significantly higher [37]. Since half of the Greek population resides in Attica where there is a huge problem in energy allocation, the understanding of citizens’ views on RES is of vital importance in order to motivate them to pay for energy produced by RES or even invest in them [31,37]. This is because citizens’ perceptions of the environment and RES can significantly influence public policies [38]. Thus, by measuring and understanding Attica’s residents’ views in order to form a proper policy to motivate them, the metropolitan area of Athens would become a “greener” constant consumer of energy produced by RES [37]. This “greener” character is needed to be achieved, as Attica is an environmentally compromised region because of its metropolitan character. An effective allocation of the energy sources could allow the development of an energy plan for the rest of the country without the constraints of Attica; this would significantly contribute to the citizens’ life quality improvement both in Attica and in the rest of the country [37,39,40].
The above facts are the main drivers of this study’s development. Thus, the aim here is to analyze the social acceptance of RES by examining the variables which are correlated with citizens’ perceptions of them. More specifically, the variables underlying the differences between RES users and non-users and, the variables encouraging citizens’ positive views towards RES’ contribution to their life quality will mainly be analyzed. The contribution of this work consists in examining RES in relation to their contribution to life quality since there is no other research to make this correlation. In this sense, understanding the citizens’ perception on RES contribution to their lives’ quality is very important as it will be easier to point out the incentives that will drive them to use RES.

2. Materials and Methods

The survey took place in a representative urban area of Attica, with a population of 69,946 residents. Previous Greek surveys on the public perceptions on RES were evaluated to form the questionnaire [22,29,30,31,33]. Questionnaires were filled-out during the period of September 2016 to October 2016. The delivered questionnaire included 16 composite questions which led to the creation of 73 variables, covered various aspects of renewable energy sources such as familiarization, utility, knowledge of technologies, and social acceptance.
Concerning sample size, by retrieving the relevant questionnaire surveys on the social assessment of green investments in Greece, we noticed that in most of those studies, sample size varied between 300–400 cases [6,22,32,34,35,41,42]. The estimation of the final sample size of our research was done by using the equation of simple random sampling with substitution [43,44]. For the calculations, we set the confidence level at 95%; thus, we accept an error of 5%. A confidence interval of 95% indicates a range that would account for 95% of the results of a study that was theoretically repeated countless times. The confidence interval when the population dispersion is available, is calculated by using Equation (1) [44]; there will be no correction of the finite population, as the sample represents less than 5% of the total population [45]:
x ¯ Z 1 a 2 σ n ,   x ¯ + Z 1 a 2 σ n
When the population variability is unknown and for a large sample, the appropriate function is the following [43]:
n =   4 s 2 ( Z 1 a 2 ) D 2
where n is the estimated sample size, s is the calculated standard deviation derived from the control sample, the Z 1 a 2 value is that derived from the confidence level chosen by the investigator based on the normal distribution table, and D is the total width of the desired confidence level, as determined by the researcher or as given by similar studies.
Subsequently, when the variables are expressed in percentages (proportions), the equation for sample size takes the form below [43]:
n = 4 ( Z c r i t ) 2 p ( 1 p ) D 2
In our sample, the variable with the higher standard deviation is “age” (mean = 40.5, s = 14.24). By using Equation (2), the sample size is estimated as follows:
n = 4 × 203 × 1.96 2 2 = 397.88
The appropriate sample size was rounded up to be set at 400 persons since all other variables led to smaller estimates. The final sample size of 400 is compatible with the mean sample size of the studies reviewed [6,22,30,34]. Regarding the response rate of the reviews studies, we noticed that it was averaged at 48.8% while in our study is equal to 45.7%.
Concerning the analysis methods, the initially Principal Components Analysis is applied to all Likert scale questions. To validate the sampling adequacy, the Kaiser Meyer Olkin index and Bartlett test were used. To locate the factors associated with variable “RES usage”, we applied binary logit regression. Furthermore, we created an ordinal logistic regression model for discovering the factors that shape respondents’ agreement on a 5-point Likert statement about “RES contribution to life quality”. For the purposes of the analysis, the SPSS v.17 and STATA MP/13 statistical packages were used.

3. Results and Discussion

3.1. Reliability Analysis

To assess the questionnaire’s reliability, the Alpha-Cronbach’s test was used. The Alpha-Cronbach’s value equaled to 0.884 which indicates high internal consistency and valid questions; by performing an Alpha Cronbach analysis for each individual item, we did not notice reliability issues in any of the questions used, hence, we concluded that the applied questionnaire is properly designed, and the recorded data can be statistically analyzed.

3.2. Sample Demographics

In this section, we include the socio-demographic characteristics of the people that took part in the survey. According to Table 1, most of the respondents are males (52.3%), while the majority belongs to the age group of 41–44 years old (35.5%). Besides this, the high school educational level is at 38.0%, followed by university graduates (35.0%). Most of the sample population holds an annual family income of up to 20,000 €, while it should be noted that around 30% of the sample population stated that their annual income does not exceed 10,000 €. Concerning the occupational status, 34.3% and 22.3% of the sample population are employees at the private and at the public sector, respectively, 14.3% are self-employed, while around 25% of the sample’s population are students, unemployed, or homemakers.

3.3. Citizens’ Perceptions of RES

Respondents’ perceptions on RES are examined in this section. Figure 1, depicts the respondents’ knowledge about RES types.
According to Figure 1, the respondents seem to have a low level of knowledge concerning hydrodynamic, geothermal, and biomass-based sources of energy. On the contrary, they have a fair level of knowledge concerning wind and solar power sources.
As shown in Figure 2, most of the sample (59%) uses at least one type of RES. Remarkably, out of the RES users, most of them (95%) use solar water heaters while 11% have installed solar PVs; on the contrary, just 0.85% of them use geothermal sources of power. The above results are compatible with the respondents’ knowledge level about RES types since solar power is the most familiar and, at the same time, the most commonly used renewable energy source.
Next, the motives to use energy produced by RES are analyzed. According to the data in Figure 3, we may conclude that the most important measure to be taken in the context of an effective adoption of RES by citizens is installation subsidies as 87.2% of the respondents have positive perceptions of it. On the other hand, the least important incentive is credit provision as 34.5% of the respondents express positive views on it. The above analysis shows not only how citizens would be motivated to buying energy produced by RES, but also how to invest in energy production using RES. Thus, an effective public policy should focus on providing incentives for both the purchase of energy produced by RES and the production of it.
In Figure 4, the respondents’ perceptions of RES contribution towards increased life quality is analyzed. Most of the respondents reported that RES improve life quality (85%) since environmental degradation due to fuel consumption is minimized.
In response to the other perceived advantages of RES, according to Table 2, the respondents (88.7%) see environmental protection as the most important parameter followed by the reduced oil dependence. By looking at the “agree” category about RES contribution to reduced oil dependence, it was concluded that this parameter received a portion of 40%. In all the cases, disagreement levels are extremely low which confirms a positive public perspective about RES and their positive effects.

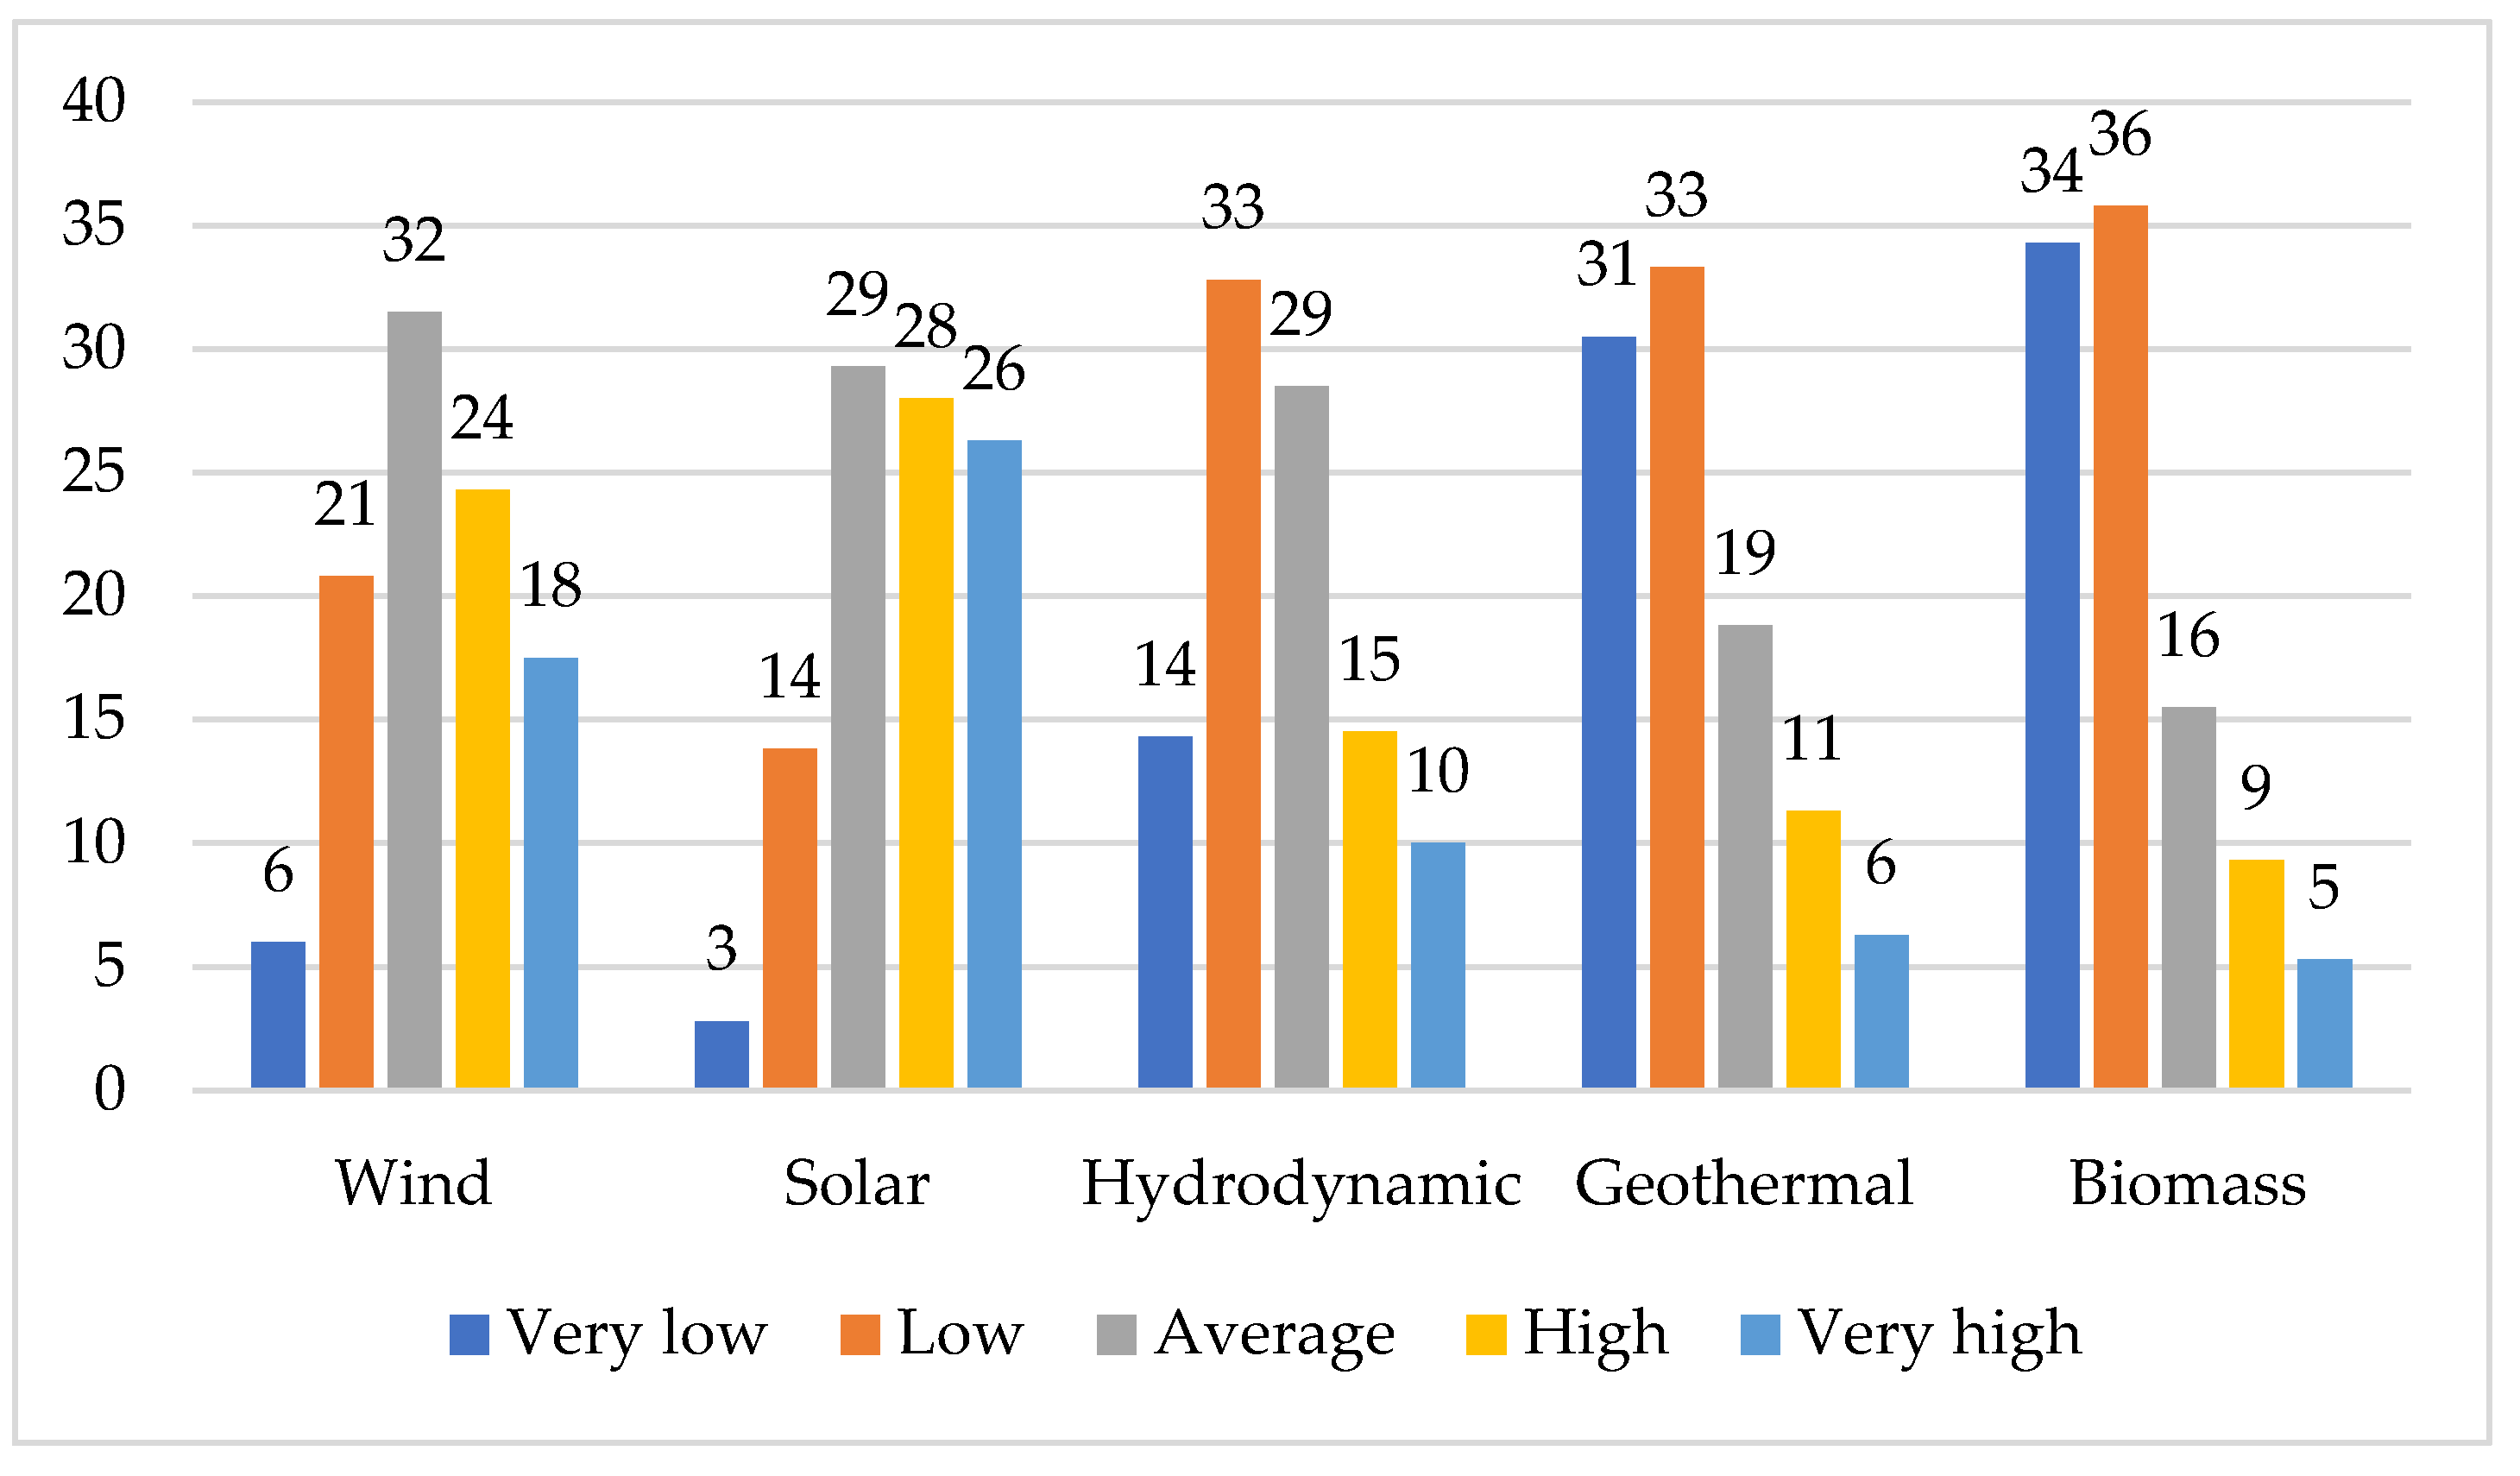
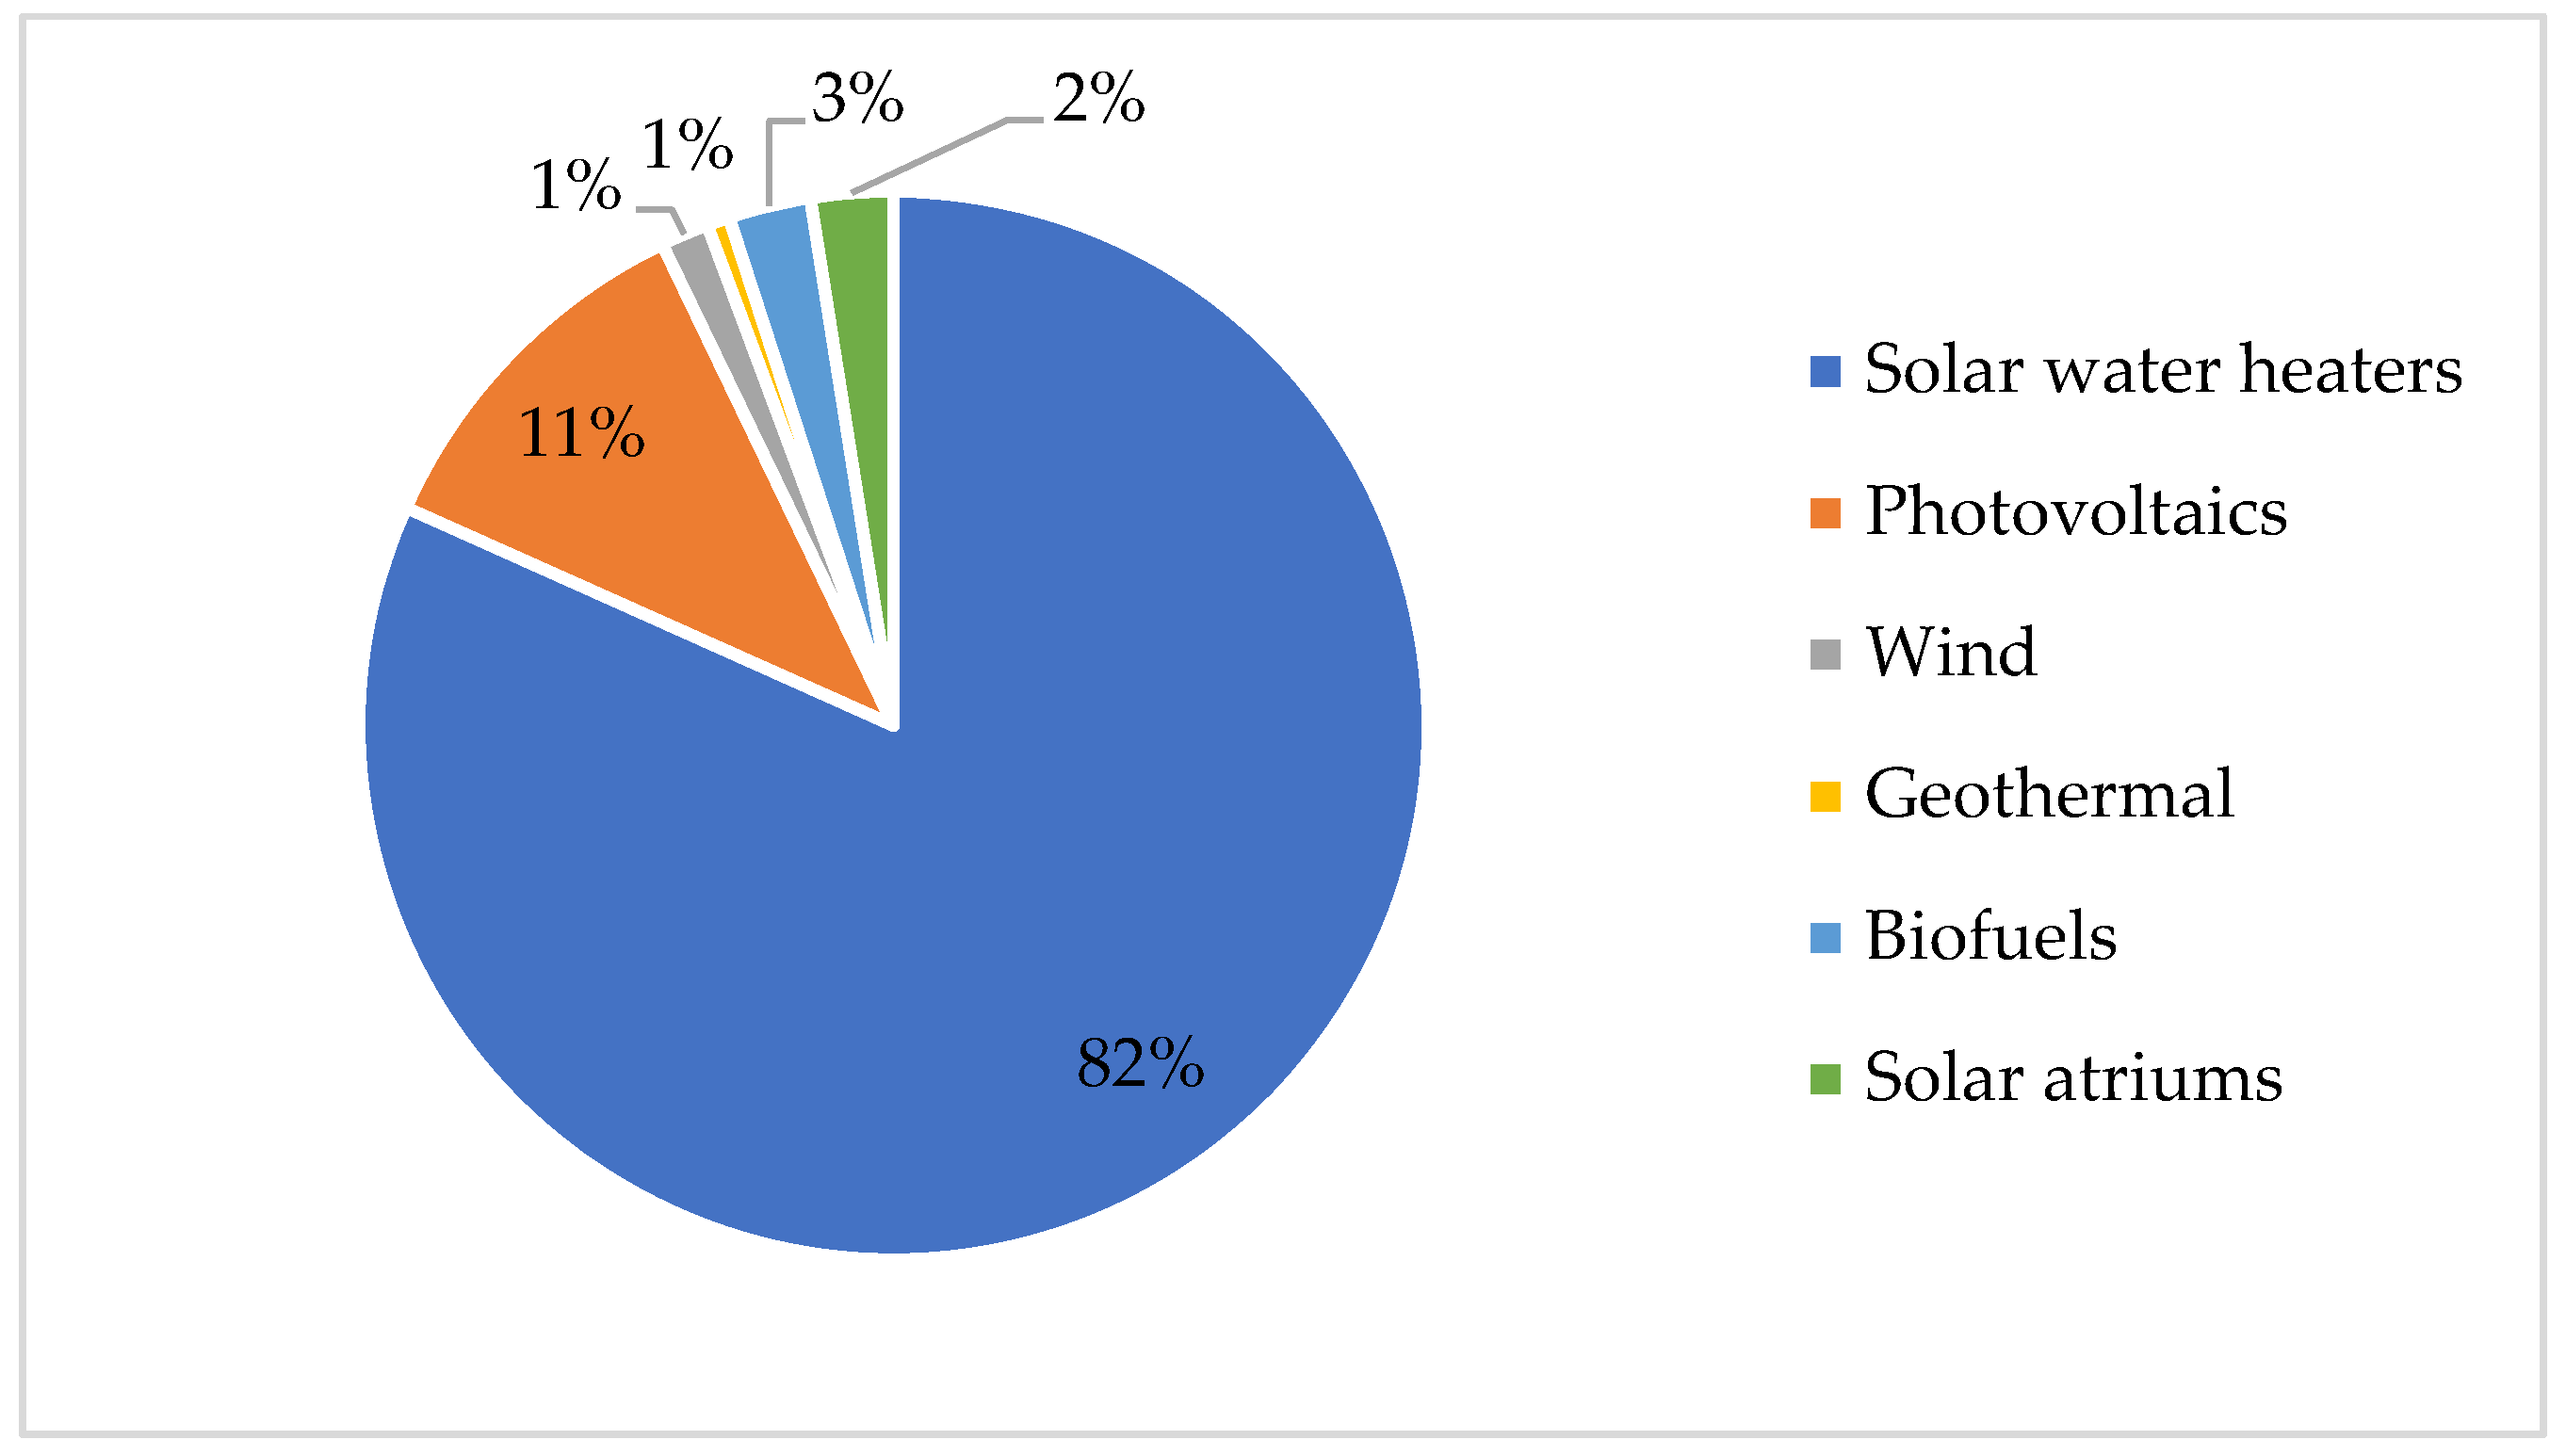
3.4. Citizens’ Perceptions Analysis of RES Usage and Their Contribution to Life Quality

The Principal Component Analysis (PCA) method is used to facilitate the logit models on questions concerning respondents’ opinion on RES. In this method, each identified component interprets a rate of variance that has not been interpreted by previous components. A proportion of 60% of the variance is needed to be interpreted by the factors that arise in social sciences [46]. The criterion for the selection of factors is for the eigenvalue to be greater than 1, known as the Kaiser criterion. The Kaiser–Meyer–Olkin sample measure equals to 0.86; thus, it is proven that factor analysis is acceptable. This is also validated by Bartlett’s test of Sphericity, where sig. = 0. The final number of factors was determined by applying the Principal Components method based on varimax rotation. Nine factors that have eigenvalues greater than 1 have emerged, explaining a total of 68% of the observed variance. An internal affinity test was performed by using Cronbach’s alpha coefficient for the 40 questions used in the factorial analysis, returning a value of 0.884 which is considered to be high [46].
Regarding the nature of the questions that have been assigned to the factors, the following profile of factor interpretation was concluded, as presented in Table 3.
As it can be seen in Table 3, a new set of 9 variables—out of the initial 40 Likert scale questions of the questionnaire—was formulated. The interpretation of each component separately is carried out by commenting on the social assessment variables that they represent.
The first component (F1) is identified as “RES perceived benefits”. It explains 13.7% of the total variance of the variables that are included in the analysis and it is considered as the most important factor. The questions/variables that are associated with the highest loadings in this factor are: “RES promote green growth” (84.4) and “RES promote environmental protection” (83.7).
The second component (F2) explains 11.4% of the total fluctuation and is identified as “RES perceived disadvantages”. This component is mainly determined by the questions/variables: “RES have a low rate of return” (86.1) and “are not profitable throughout the year” (83.4).
The third component (F3) refers to investment incentives for RES and explains 8.7% of the total variance. It is mainly formed by questions/variables such as “subsidized system maintenance” (78.8), “deduction of installation costs from taxable income” (77.1) and others.
The fourth component (F4) explains 7.6% of the total variance and is mainly composed of the following questions: “Public information from the local authorities” (75.8), “Public information from the state” (71.2), “well defined legal framework” (63.7). This component is identified as “RES actions for expansion”.
The fifth component (F5) explains 7.4% of total variance and is identified as “Social Barriers to RES Promotion” since the variables representing the highest load on this factor are “Lack of Knowledge” (83.0) and “Lack of Information” (79.9).
The sixth component (F6) explains 5.8% of the total variance and is identified as “Economic barriers to the promotion of RES” since the variable representing the highest load on this component is “High installation costs” (84.6).
The seventh component (F7) explains 5.1% of the total variance and is identified as “Fossil fuel price relative to RES” as the variable representing the highest load on this factor is “If the cost of oil is appreciably expensive” (90.7).
The eighth component (F8) explains 4.9% of the total variance and is identified as “Effect of a social-legal framework on RES use” since the variables that represent the highest load on this component are “I would use RES if it were also used by fellow citizens” (83.0) and “Lack of complete legal framework” (70.7).
Last, the ninth component (F9) explains 3.1% of the total fluctuation and is identified as “Purchase of RES system with interest-free installments” with the factor load being 71.8.
In the first stage of our analysis, we focused on exploring the variables that are associated with whether a respondent is a RES user or not. For this purpose, we applied a binary logit model where the variable “use of RES (yes/no)” was determined as the dependent. The previously identified factors were used as explanatory variables based on a relevant study [47]. The selection of the most appropriate model was based on the applicability of the backward method. Hosmer-Lemeshow’s test (sig. = 0.001) further indicated that the dependent variable values did not sustain a statistically significant difference from the values provided by the model, thus, the model is considered applicable [48]. Nagelkerke’s pseudo-R Square statistic showed that the final iteration (step 6) explained a percentage of 15% of the dependent variable [49]. Out of the 9 initial independent variables (F1 to F9), the stepwise binary logistic model retained 4 variables at the 90% confidence level. Those statistically significant variables are F1 (RES perceived benefits), F5 (Institutional promotion barriers for RES), F6 (Economic barriers for RES), and F7 (RES price compared with conventional fuels). The final model for the estimation of RES users is presented in Table 4.
The final model based on the above table data is the following one:
l o g ( p 1 p ) = 0.389 + 0.618 F 1 0.257 F 5 0.193 F 6 + 0.263 F 7
By estimating Exp(B), the odds ratio was calculated. For example, the odds ratio coefficient, under column Exp(B) of F1 means that by keeping all the other explanatory variables at a fixed value, we will see 0.54% increase in the odds of a respondent belonging to the category of “RES user”, for a one unit increase in F1 (RES perceived benefits), since Exp(0.618) = 0.539. The same explanation applies to variable F7. On the other hand, the negative coefficient of variables F5 (RES social promotion barriers) and F6 (RES economical promotion barriers) mean that they are negatively associated with RES use. This means that non-RES users consider those barriers (high cost and social barriers as information lack, lack of confidence, the role of the state) to be determining and, at the same time, they seem to overlook the RES advantages.
To validate the proposed model of estimation of RES users, we tested the relationship between each of the independent variables with the dependent variable “RES use (yes/no)”, by applying the Mann–Whitney U method, as presented in Table 5. By looking at the statistical significance index (sig. < 0.05) in Table 5, all four independent variables were found to be related to the dependent variable.
The binary logistic model correctly identified 70.2% of all cases. The success rate for “RES users” is 87.7%, as it correctly identifies 206/235 of the respondents, whereas the success rate range for the “non-RES users” category is narrowed down to just 45.1%, as it correctly identifies 74/164 of the respondents.
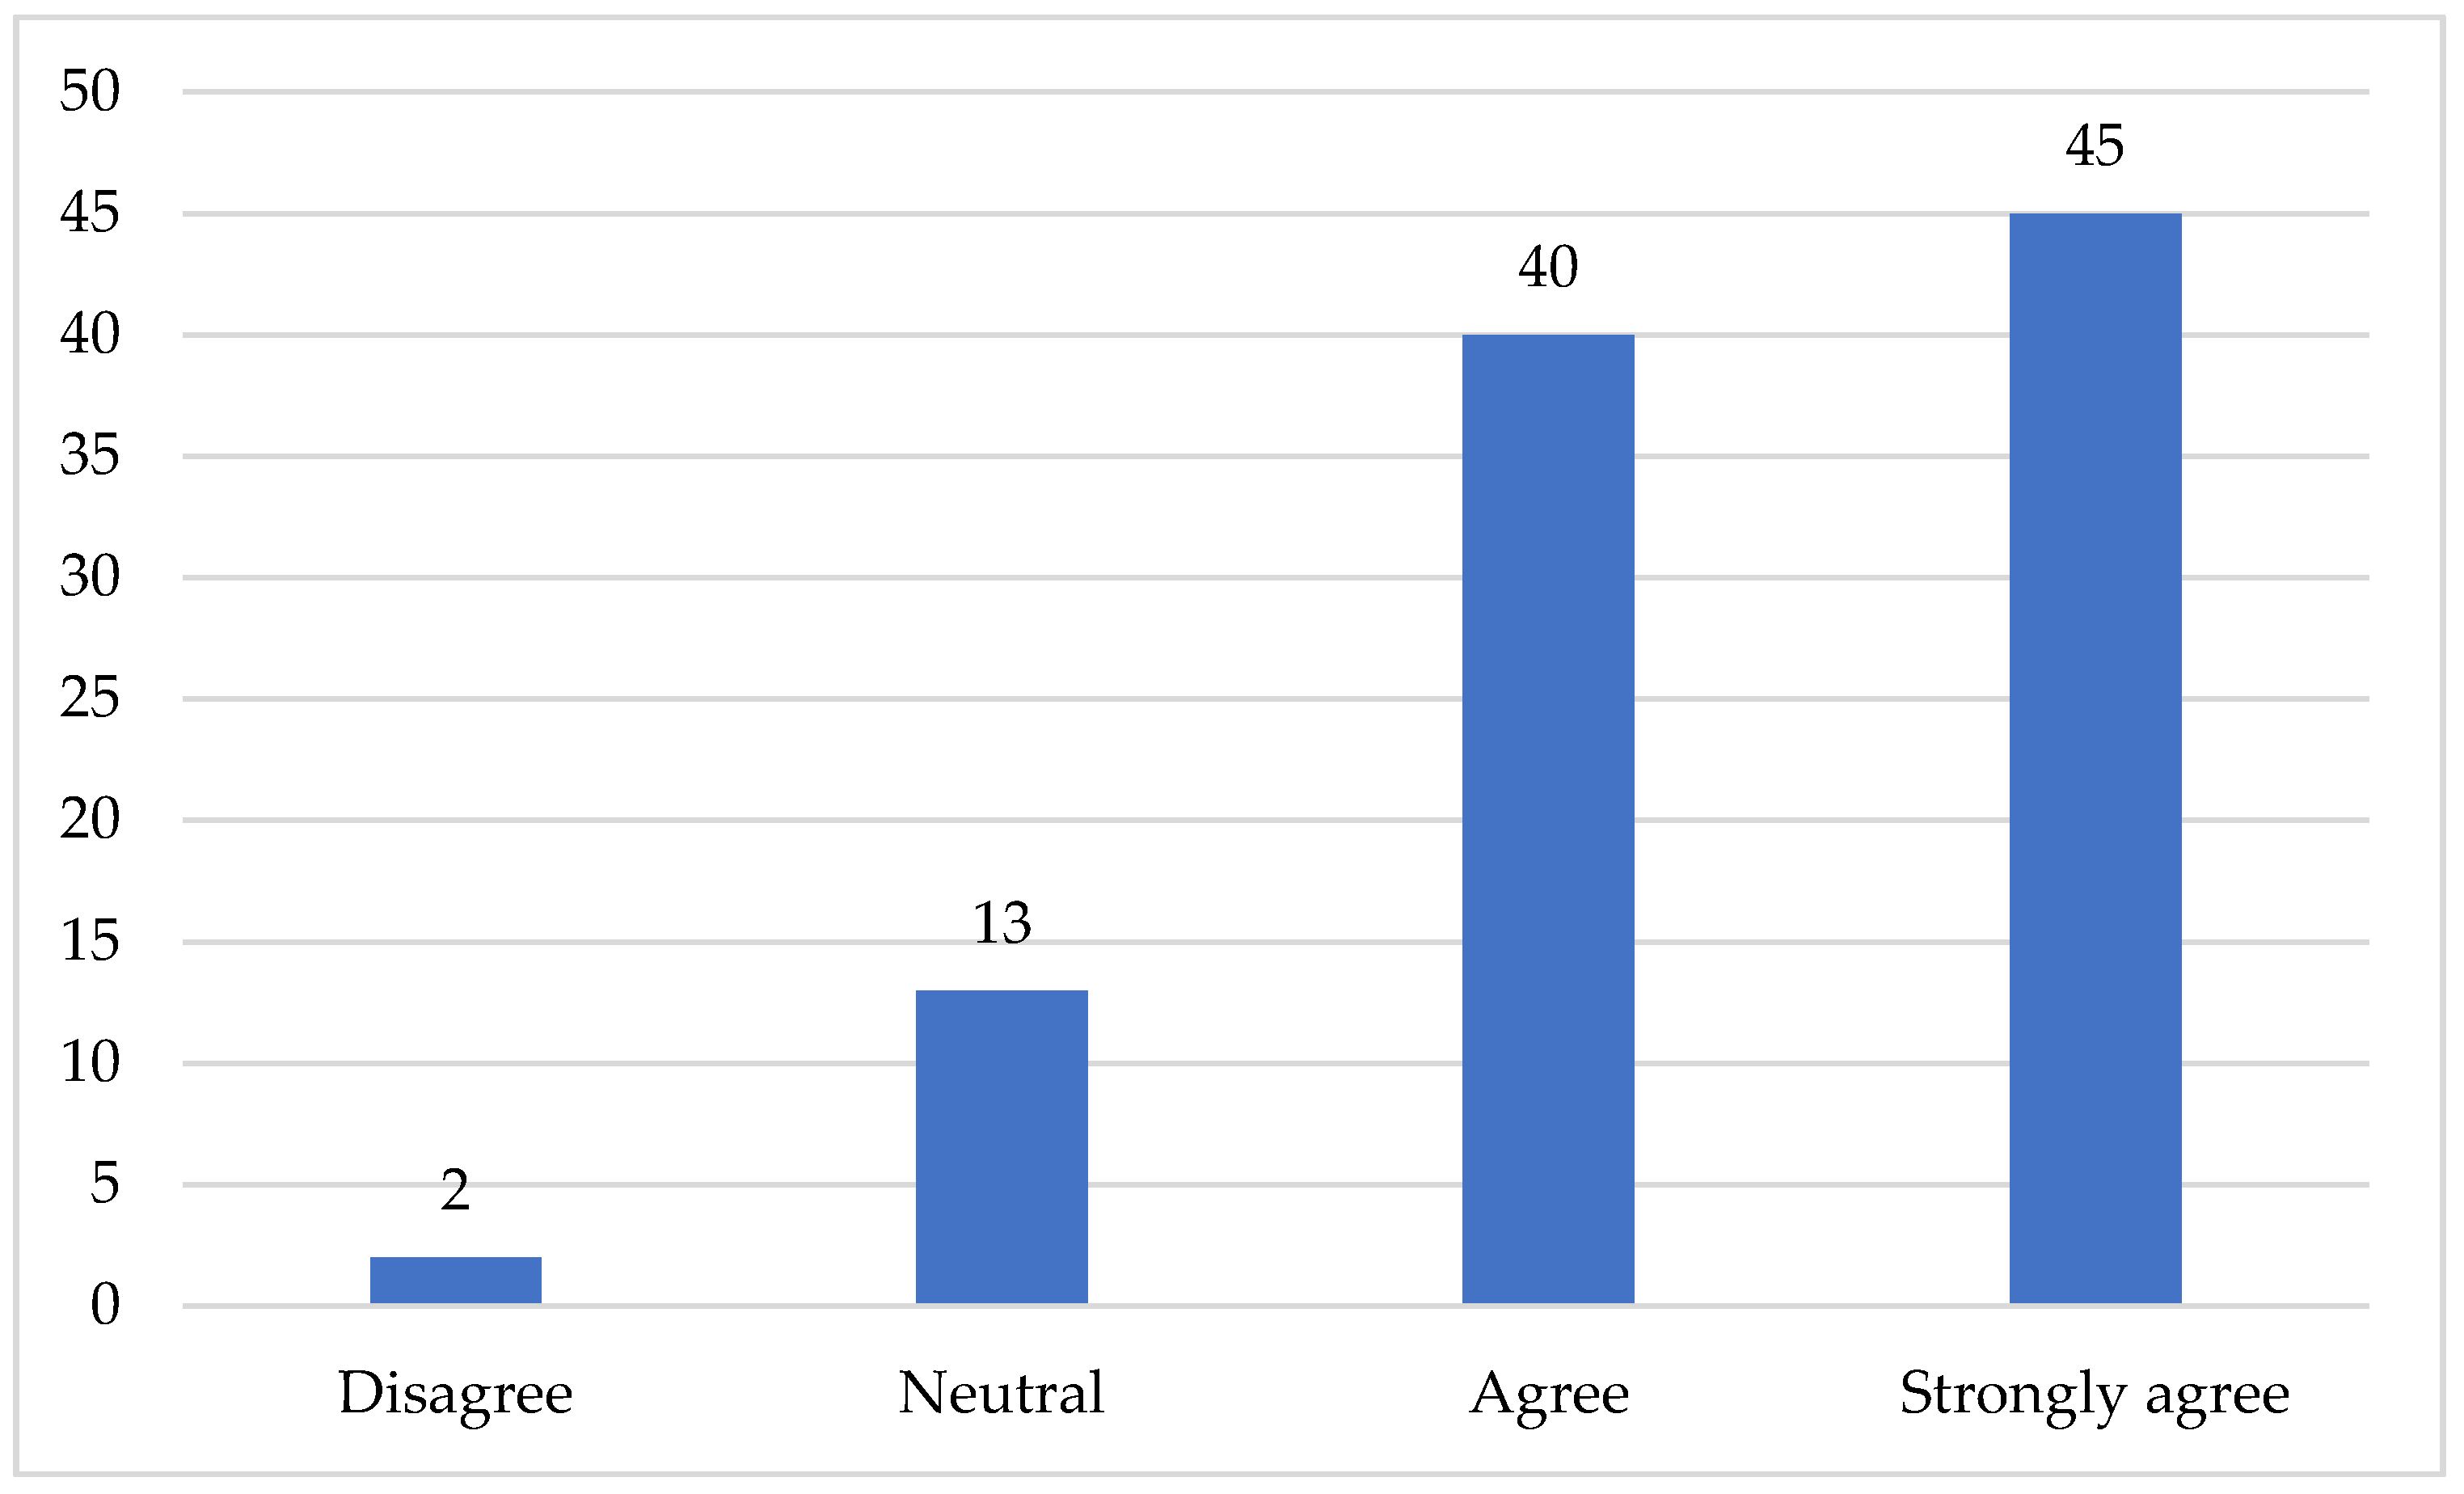
In the second stage of our analysis, we focused on examining the factors that shape respondents’ opinion about RES’ contribution to life quality improvement. All nine factors generated by the above factor analysis procedure were used. Carrying an ordinal regression with the stepwise method in STATA, it was noticed that the final model retained only four factors as independent variables, as the others were removed due to the pr (0.10) criterion. The reference category was that of “strongly agree” as shown in Table 6.
The final model here, based on the above table data is the following one:
l o g ( P ( Y i j ) P ( Y i j ) ) = a j ( 2.799 F 1 0.415 F 2 + 0.502 F 3 + 0.742 F 4 )
In the above model, j = 1, 2, 3 are the categories of the dependent variable (4 − 1 = 3). The p-value (sig. = 0) indicated that the model was statistically significant compared to the null model without any explanatory variables. The pseudo-R2 coefficient equaled to 0.4665 suggesting a strong model in accordance with a relevant statistical table [49]. By estimating Exp(B), the odds ratio was calculated and noted to be higher than 1 for the four independent variables (F1, F2, F3, and F4), suggesting, in most of the cases, a positive correlation between the independent variables and the dependent variable. More specifically, for a one-unit increase in variable F1 while keeping the other variables constant, the likelihood of the category “strongly agree” increases at 1 − Exp(2.799) = 1542%. Respectively, for an increase of one unit in variables F3 and F4, the probability of the category “fully agree” is increased by 65%, and 110%, respectively. Lastly, for an increase of one unit in variable F2, the probability of the category “fully agree” is decreased by 34%.
To validate the proposed ordinal model, we verified the condition of proportionality with the combined utilization of the Brant test in conjunction with the parallel lines in STATA. Finally, three stepwise binary logistic regression models are presented in Table 7, by using life quality as the dependent variable (whether respondents agree that the use of renewable energy improves life quality) and setting as independent variables the four factors (F1, F2, F3, and F4) that were statistically significant in the ordinal logistic regression. A filter was used for the data selection to compare two categories at a time, for the four-category variable life quality (disagree, neutral, agree, and strongly agree). Thus, by taking the “strongly agree” statement as a reference category, three logit models were formulated, all meeting the acceptance criterion of Hosmer and Lemeshow [48].
Moreover, by checking the goodness of fit for the three models with the Nagelkerke pseudo-R Square index, the model between “strongly agree” and “neutral” sustained the highest level of adaptation to the data with R2 = 0.805 as presented in Table 8.
Concerning the predictability of the three binary logistic models, they can determine in which category a respondent belongs concerning his views about RES contribution to life quality, as captured by F1 to F4. Regarding the Exp(B) column of Table 8, we concluded that in all three models, variable F1 “RES perceived benefits” is the main determinant of “strongly agree”. Model 1 includes F1–F4 as significant between the categories of “agree” and “strongly agree”. Model 2 retained F1 and F4, the “RES actions for expansion”, as statistically significant. This model distinguishes between the neutral position towards RES and the strong positive position. Model 3 determines between the categories of “strongly agree” and “disagree” while the stepwise method retained only variable F1 as statistically significant.
By looking at Table 9, we notice that out of the three proposed models, the second one has the highest predictability of 94.4%.
By examining the logit models, we noticed that if a person has a completely negative attitude towards RES contribution to life quality and is found on the “disagree” category of the 5-point Likert Scale, it is possible to move to the “agree” category by a minor increase in the perceived benefits from RES. Furthermore, if a person is already found in the “agree” category, an increase in all the four variables is needed to move to the “strongly agree” point of the scale. Finally, if a person has a neutral position towards RES contribution to life quality, an increase is needed to the variables concerning RES perceived benefits and RES actions for expansion to move to the “strongly agree” category.

4. Conclusions

The aim of this study is to analyze the social acceptance of RES by examining the variables which are correlated with citizens’ perceptions towards them and specifically “RES usage” and “citizens’ perceptions on RES contribution to their lives’ quality”.
The research results show that respondents are adequately informed about some of the RES types, while 59% of them use at least one RES investment, mainly solar heaters and solar PVs. Furthermore, the respondents have a good amount of knowledge on solar and wind investments.
RES’ acceptance is directly affected by the respondents’ perception on the benefits abiding their use. This variable of the perceived RES benefits is the most crucial in determining whether a person is a RES user or not. In parallel, economics and social issues, as well as the government’s role, are negatively related to the respondents’ attitudes towards RES in the case of Greece. Those issues may also include high installation and maintenance cost, lack of confidence, lack of knowledge, and insufficient support of the RES investments by the state. It is noteworthy that the benefits arising from RES’ usage and actions for RES expansion incited the perception that RES can be proven highly beneficial to end-users, since they can actively contribute to improving their life quality. According to the research results, most of the respondents are convinced that RES expansion can significantly contribute to their lives’ quality improvement.
Strategies that can strengthen RES’ acceptance are possible to be developed. Based on the research results, it can be drawn that RES’ acceptance is not difficult to be increased, as the binary logit analysis shows that if a person has a completely negative attitude towards RES contribution to life quality, it is possible to move that person to a positive category by a minor increase in the perceived benefits. Thus, RES’ benefits must be highlighted. Social support and information provision on the potential benefits from technological advances in renewable energy can promote the interaction and participation of local communities to RES’ acceptance. An increase in the role of local authorities would result in an effective policy solution to renewable energy projects [19]. The challenge for project developers is to identify salient stakeholders who understand what it is that they really care about and prioritize.
Moreover, all stakeholders should remember that their effect of participation in energy decisions clearly exists and—as many delayed or canceled projects suggest—failing to take participatory decision-making into account can be costly. Besides, the psychographic factors such as the level of information, membership in environmental organizations, emotional and value components, along with political views, can shape public opinions about RES-based projects more than physical proximity [21,23]. Indeed, the installation and operation of any RES technology require social acceptance and social-driven contradictions resolving—even before the establishment and the consultation with the local community—to persuade those skeptical citizens and reconcile all competitive interests [22]. Last but not least, the research results point out that the authorities should limit the economic promotion obstacles of RES’.
Regarding the future studies’ orientation concerning RES, it can be noted that Greece has shown an enduring reliance on fossil-based fuels, mainly charcoal. Nevertheless, due to its geographical configuration, Greece has an abundance of renewable energy sources, mainly solar and wind. Based on this observation there should be a focus on energy production by solar and wind sources. For the case of solar power, such investments can be easily installed in urban areas. This finding bears significance for Greece, as Attica hosts almost half of the country’s population [50]. As a result, Attica’s residents should be motivated to purchase energy produced by renewable sources or even to produce it on their own in order to meet their specific energy needs. Citizens’ motivation would be relatively easy, as the binary—logit models show that a minor increase in the perceived benefits of RES can move a citizens’ attitude from a negative to a positive category. In this way, RES usage would be significantly increased in Attica, permitting a better allocation of the available energy resources for the whole country and, at the same time, improving citizens’ life quality. It should be noted that state funding programs are already underway in this direction.
The recent European legislation on gas emissions, sustainable energy production, and the ongoing participative role of RES, has gained the interest in accepting energy autonomy schemes based on RES [51]. Thus, the study of the European legislation adaptation to the national legislative framework offers numerous opportunities for the wider development of renewables—wind power, solar energy, biomass and energy crops, geothermal sources, tidal and hydropower potentials—in supporting the Greek energy demand in both the mainland and offshore areas.
Lastly, an extension of the current research would be on the correlation of a region’s specific energy needs and its citizens’ perceptions on RES and their contribution to life quality. In this way, the energy needs would be in the spotlight, aiming to explain citizens’ perceptions on RES.

Author Contributions

Dimitrios Drosos provided the questionnaire and performed data collection. Stamatios Ntanos, Miltiadis Chalikias, and Michalis Skordoulis designed the experimental framework and analyzed the data. Stamatios Ntanos and Miltiadis Chalikias carried out the implementation, performed the calculations and the computer programming. Grigorios Kyriakopoulos, Garyfallos Arabatzis and Spyros Galatsidas gathered and implemented all the theoretical background of the paper, having the input from the experimental development. Garyfallos Arabatzis, Grigorios Kyriakopoulos, and Stamatios Ntanos reviewed and discussed the results of the study.

Conflicts of Interest

The authors declare no conflict of interest.

References

  1. Coburn, T.C.; Farhar, B. Public Reaction to Renewable Energy Sources and Systems. In Encyclopedia of Energy; Cutler, J., Ed.; Elsevier: New York, NY, USA, 2004. [Google Scholar]
  2. Kaya, Y.; Yokobori, K. Environment, Energy, and Economy: Strategies for Sustainability; United Nations University Press: New York, NY, USA, 1997. [Google Scholar]
  3. Chalikias, M.S.; Ntanos, S. Countries clustering with respect to carbon dioxide emissions by using the IEA database. In Proceedings of the 8th International Conference on Information and Communication Technologies in Agriculture, Food and Environment, Kavala, Greece, 17–20 September 2015; pp. 347–351. [Google Scholar]
  4. Kyriakopoulos, G.L.; Chalikias, M.S. The Investigation of Woodfuels’ Involvement in Green Energy Supply Schemes at Northern Greece: The Model Case of the Thrace Prefecture. Procedia Technol. 2013, 8, 445–452. [Google Scholar] [CrossRef]
  5. Tsantopoulos, G.; Τampakis, S.; Andrea, V.; Komitsa, H. Views on Environmental Problems and Assessment of Solutions. The Case of Larisa, Greece. J. Environ. Prot. Ecol. 2013, 14, 646–654. [Google Scholar]
  6. Kontogianni, A.; Tourkolias, C.; Skourtos, M. Renewables portfolio, individual preferences and social values towards RES technologies. Energy Policy 2013, 55, 467–476. [Google Scholar] [CrossRef]
  7. Voumvoulakis, E.; Asimakopoulou, G.; Danchev, S.; Maniatis, G.; Tsakanikas, A. Large scale integration of intermittent renewable energy sources in the Greek power sector. Energy Policy 2012, 50, 161–173. [Google Scholar] [CrossRef]
  8. Baris, K.; Kucukali, S. Availability of renewable energy sources in Turkey: Current situation, potential, government policies and the EU perspective. Energy Policy 2012, 42, 377–391. [Google Scholar] [CrossRef]
  9. López-Peña, Á.; Pérez-Arriaga, I.; Linares, P. Renewables vs. energy efficiency: The cost of carbon emissions reduction in Spain. Energy Policy 2012, 50, 659–668. [Google Scholar] [CrossRef]
  10. Lueken, C.; Carvalho, P.S.; Apt, J. Distribution grid reconfiguration reduces power losses and helps integrate renewables. Energy Policy 2012, 48, 260–273. [Google Scholar] [CrossRef]
  11. Trypolska, G. Feed-in tariff in Ukraine: The only driver of renewables’ industry growth? Energy Policy 2012, 45, 645–653. [Google Scholar] [CrossRef]
  12. Wassermann, S.; Reeg, M.; Nienhaus, K. Current challenges of Germany’s energy transition project and competing strategies of challengers and incumbents: The case of direct marketing of electricity from renewable energy sources. Energy Policy 2015, 76, 66–75. [Google Scholar] [CrossRef]
  13. Fuss, S.; Szolgayová, J.; Khabarov, N.; Obersteiner, M. Renewables and climate change mitigation: Irreversible energy investment under uncertainty and portfolio effects. Energy Policy 2012, 40, 59–68. [Google Scholar] [CrossRef]
  14. Kirsten, S. Renewable Energy Sources Act and Trading of Emission Certificates: A national and a supranational tool direct energy turnover to renewable electricity-supply in Germany. Energy Policy 2014, 64, 302–312. [Google Scholar] [CrossRef]
  15. Kosenius, A.K.; Ollikainen, M. Valuation of environmental and societal trade-offs of renewable energy sources. Energy Policy 2013, 62, 1148–1156. [Google Scholar] [CrossRef]
  16. Moe, E. Vested interests, energy efficiency and renewables in Japan. Energy Policy 2012, 40, 260–273. [Google Scholar] [CrossRef]
  17. Shyu, C.W. Rural electrification program with renewable energy sources: An analysis of China’s Township Electrification Program. Energy Policy 2012, 51, 842–853. [Google Scholar] [CrossRef]
  18. Zhou, H. Impacts of renewables obligation with recycling of the buy-out fund. Energy Policy 2012, 46, 284–291. [Google Scholar] [CrossRef]
  19. Caporale, D.; Delucia, C. Social acceptance of on-shore wind energy in Apulia Region (Southern Italy). Renew. Sustain. Energy Rev. 2015, 52, 1378–1390. [Google Scholar] [CrossRef]
  20. Enevoldsen, P.; Sovacool, B. Examining the social acceptance of wind energy: Practical guidelines for onshore wind project development in France. Renew. Sustain. Energy Rev. 2016, 53, 178–184. [Google Scholar] [CrossRef]
  21. Musall, F.D.; Kuik, O. Local acceptance of renewable energy—A case study from southeast Germany. Energy Policy 2011, 39, 3252–3260. [Google Scholar] [CrossRef]
  22. Arabatzis, G.; Myronidis, D. Contribution of SHP Stations to the development of an area and their social acceptance. Renew. Sustain. Energy Rev. 2011, 15, 3909–3917. [Google Scholar] [CrossRef]
  23. Tabi, A.; Wüstenhagen, R. Keep it local and fish-friendly: Social acceptance of hydropower projects in Switzerland. Renew. Sustain. Energy Rev. 2017, 68, 763–773. [Google Scholar] [CrossRef]
  24. Carlisle, J.; Kane, S.L.; Solan, D.; Bowman, M.; Joe, J.C. Public attitudes regarding large-scale solar energy development in the U.S. Renew. Sustain. Energy Rev. 2015, 48, 835–847. [Google Scholar] [CrossRef]
  25. Zhai, P.; Williams, E. Analyzing consumer acceptance of photovoltaics (PV) using fuzzy logic model. Renew. Energy 2012, 41, 350–357. [Google Scholar] [CrossRef]
  26. Swift, K.D. A comparison of the cost and financial returns for solar photovoltaic systems installed by businesses in different locations across the United States. Renew. Energy 2013, 57, 137–143. [Google Scholar] [CrossRef]
  27. Tyagi, V.V.; Rahim, N.A.; Rahim, N.A.; Jeyraj, A.; Selvaraj, L. Progress in solar PV technology: Research and achievement. Renew. Sustain. Energy Rev. 2013, 20, 443–461. [Google Scholar] [CrossRef]
  28. Tsantopoulos, G.; Arabatzis, G.; Tampakis, S. Public attitudes towards photovoltaic developments: Case study from Greece. Energy Policy 2014, 71, 94–106. [Google Scholar] [CrossRef]
  29. Devine-Wright, P. Reconsidering Public Attitudes and Public Acceptance of Renewable Energy Technologies: A Critical Review; School of Environment and Development, University of Manchester: Manchester, UK, 2007. [Google Scholar]
  30. Zografakis, N.; Sifaki, E.; Pagalou, M.; Nikitaki, G.; Psarakis, V.; Tsagarakis, K.P. Assessment of public acceptance and willingness to pay for renewable energy sources in Crete. Renew. Sustain. Energy Rev. 2010, 14, 1088–1095. [Google Scholar] [CrossRef]
  31. Ntanos, S.; Kyriakopoulos, G.; Chalikias, M.; Arabatzis, G.; Skordoulis, M. Public Perceptions and Willingness to Pay for Renewable Energy: A Case Study from Greece. Sustainability 2018, 10, 687. [Google Scholar] [CrossRef]
  32. Tampakis, S.; Tsantopoulos, G.; Arabatzis, G.; Rerras, I. Citizens’ views on various forms of energy and their contribution to the environment. Renew. Sustain. Energy Rev. 2013, 20, 473–482. [Google Scholar] [CrossRef]
  33. Kyriakopoulos, G.; Kolovos, K.; Chalikias, M. Environmental sustainability and financial feasibility evaluation of woodfuel biomass used for a potential replacement of conventional space heating sources. Part II: A Combined Greek and the nearby Balkan Countries Case Study. Oper. Res. 2010, 10, 57–69. [Google Scholar] [CrossRef]
  34. Arabatzis, G.; Malesios, C. An econometric analysis of residential consumption of fuelwood in a mountainous prefecture of Northern Greece. Energy Policy 2011, 39, 8088–8097. [Google Scholar] [CrossRef]
  35. Malesios, C.; Arabatzis, G. Small hydropower stations in Greece: The local people’s attitudes in a mountainous prefecture. Renew. Sustain. Energy Rev. 2010, 14, 2492–2510. [Google Scholar] [CrossRef]
  36. Kaldellis, J.K. Social attitude towards wind energy applications in Greece. Energy Policy 2005, 33, 595–602. [Google Scholar] [CrossRef]
  37. Xydis, G. Development of an integrated methodology for the energy needs of a major urban city: The case study of Athens, Greece. Renew. Sustain. Energy Rev. 2012, 16, 6705–6716. [Google Scholar] [CrossRef]
  38. Arabatzis, G.; Malesios, C. Pro-Environmental attitudes of users and not users of fuelwood in a rural area of Greece. Renew. Sustain. Energy Rev. 2013, 22, 621–630. [Google Scholar] [CrossRef]
  39. Lambert, J.G.; Hall, C.A.S.; Balogh, S.; Gupta, A.; Arnold, M. Energy, EROI and quality of life. Energy Policy 2014, 64, 153–167. [Google Scholar] [CrossRef]
  40. Akella, A.K.; Saini, R.P.; Sharma, M.P. Social, economical and environmental impacts of renewable energy systems. Renew. Energy 2009, 34, 390–396. [Google Scholar] [CrossRef]
  41. Kaldellis, J.K.; Kapsali, M.; Kaldelli, E.; Katsanou, E. Comparing recent views of public attitude on wind energy, photovoltaic and small hydro applications. Renew. Energy 2013, 52, 197–208. [Google Scholar] [CrossRef]
  42. Savvanidou, E.; Zervas, E.; Tsagarakis, K. Public acceptance of biofuels. Energy Policy 2010, 38, 3482–3488. [Google Scholar] [CrossRef]
  43. Eng, J. Sample Size Estimation: How Many Individuals Should Be Studied? Radiology 2003, 227, 309–313. [Google Scholar] [CrossRef] [PubMed]
  44. Chalikias, M.S.; Manolesou, A.; Lalou, P. Research Methodology and Introduction to Statistical Data Analysis with IBM SPSS STATISTICS; Hellenic Academic Literature: Athens, Greek, 2015. (In Greek) [Google Scholar]
  45. Rose, S.; Spinks, N.; Canhoto, A. Management Research: Applying the Principles; Routledge: New York, NY, USA, 2015. [Google Scholar]
  46. Hair, J.F.; Black, W.C.; Babin, B.J.; Anderson, R.E. Explanatory Factor analysis. In Multivariate Data Analysis, 7th ed.; Prentice Hall International: Englewood Cliffs, NJ, USA, 2010. [Google Scholar]
  47. Kolovos, K.G.; Kyriakopoulos, G.; Chalikias, M.S. Co-evaluation of basic woodfuel types used as alternative heating sources to existing energy network. J. Environ. Prot. Ecol. 2011, 12, 733–742. [Google Scholar]
  48. Hosmer, D.W.; Lemeshow, S. Applied Logistic Regression, 2nd ed.; John Wiley & Sons: Hoboken, NY, USA, 2000. [Google Scholar]
  49. Hu, B.; Shao, J.; Palta, M. Pseudo-R2 in Logistic Regression Model. Stat. Sin. 2006, 16, 847–860. [Google Scholar]
  50. Diakakis, M.; Priskos, G.; Skordoulis, M. Public perception of flood risk in flash flood prone areas of Eastern Mediterranean: The case of Attica Region in Greece. Int. J. Disaster Risk Reduct. 2018, 28, 404–413. [Google Scholar] [CrossRef]
  51. Papageorgiou, A.; Skordoulis, M.; Trichias, C.; Georgakellos, D.; Koniordos, M. Emissions trading scheme: Evidence from the European Union countries. In Communications in Computer and Information Science; Kravets, A., Shcherbakov, M., Kultsova, M., Shabalina, O., Eds.; Springer International Publishing: Cham, Switzerland, 2015; pp. 222–233. [Google Scholar]
Figure 1. The knowledge about RES types (% percent).
Sustainability 10 01414 g001
Figure 2. The RES usage by type (%).
Sustainability 10 01414 g002
Figure 3. The motives to use energy produced by RES (%).
Sustainability 10 01414 g003
Figure 4. The public perceptions of the RES contribution to life quality (%).
Sustainability 10 01414 g004
Table 1. The sample demographics.
VariableCategories%
GenderMale52.3
Female47.8
Age18–3028.3
31–4026.5
41–5535.5
56–658.5
>651.3
EducationPrimary education2.3
Secondary education2.0
High school38.0
Vocational education8.3
Higher education35.0
MSc/PhD14.5
Household annual income<10,000 Euro33.6
10,001–20,000 Euro31.74
20,001–30,000 Euro21.45
>30,000 Euro13.21
OccupationPrivate employee36.8
Public employee22.3
Self-employed15.8
Student15.0
Unemployed10.3
Table 2. The RES’ perceived advantages (%).
Strongly DisagreeDisagreeNeutralAgreeStrongly Agree
Environmental protection0.31.511.535.351.4
Economic development0.31.319.341.637.5
“Green” development0.52.813.439.344.0
New labor positions0.52.320.338.438.5
Reduced oil dependence0.01.313.340.045.4
Energy independence0.01.516.835.046.7
Table 3. The interpretation of the factors.
Factor (Component)Interpretation
F1RES perceived benefits
F2RES perceived disadvantages
F3RES economic incentives
F4RES actions for expansion
F5RES social promotion barriers
F6RES economical promotion barriers
F7RES price compared with fossil fuels
F8Influence of social-legal framework
F9RES purchase with interest-free installments
Table 4. The variables included in the final model for assessing RES usage (yes/no).
VariableBS.E.WaldDfSig.Exp(B)
Step 6F10.6180.11329.74210.0000.539
F5−0.2570.1105.47010.0191.292
F6−0.1930.1103.06210.0801.213
F70.2630.1085.98110.0140.769
Constant−0.3890.10812.89710.0000.678
Table 5. The Mann–Whitney U between RES use and factors 1, 5, 6, and 7.
Factor 1Factor 5Factor 6Factor 7
Mann-Whitney U13.579.50016.853.50017.406.50016.353.500
Wilcoxon W27.109.50044.583.50045.136.50029.883.500
Z−5.021−2.132−1.644−2.573
Asymp. Sig. (2-tailed)0.0000.0330.1000.010
Table 6. The ordinal logistic regression with the stepwise method for the variable “Life quality”.
Life QualityBStd. Err.ZP > z95% conf.Interval
F12.7990.20413.7400.0002.4003.198
F2−0.4150.1353.0700.0020.1500.679
F30.5020.1254.0000.0000.2560.748
F40.7420.1285.8000.0000.4910.993
/cut1−8.0980.647−9.366−6.830
/cut2−3.7150.291−4.286−3.144
/cut30.7630.1620.4451.080
Table 7. The variables and coefficients on the regression models for “Life quality”.
Logit ModelsVariables in ModelBS.E.WalddfSig.Exp(B)
Model 1: odds between “strongly agree and agree”F12.9120.29696.44210.00018.386
F20.5620.1869.14010.0031.754
F30.7180.16818.24210.0002.051
F40.9180.18225.48410.0002.504
Constant−0.7630.18716.69310.0000.466
Model 2: odds between “strongly agree and neutral”F12.9010.41548.79210.00018.199
F40.8790.3088.13310.0042.410
Constant1.7590.33926.95710.0005.806
Model 3: odds between “strongly agree and disagree”F12.5450.73112.13410.00012.741
Constant4.4221.00919.19310.00083.301
Table 8. The R2 tests for regression models on “Life quality”.
Logit Models−2 Log LikelihoodCox & Snell R SquareNagelkerke R Square
Model 1: odds between “strongly agree and agree”252.2280.4720.630
Model 2: odds between “strongly agree and neutral”75.1920.5320.805
Model 3: odds between “strongly agree and disagree”15.2440.1840.741
Table 9. The binary logit models—the percentage of the correct interpretation of the variable “Life quality”.
Predicted Values
AgreeTotally AgreePercentage Correct
Model 1Agree1322882.5
Totally Agree2415586.6
Overall Percentage84.7
NeutralTotally AgreePercentage Correct
Model 2Neutral46885.2
Totally Agree517497.2
Overall Percentage94.4
DisagreeTotally AgreePercentage Correct
Model 3Disagree4266.7
Totally Agree117899.4
Overall Percentage98.4

