A Voting TOPSIS Approach for Determining the Priorities of Areas Damaged in Disasters


1
Graduate School of Logistics, Inha University, Incheon 22212, Korea
2
Asia Pacific School of Logistics, Inha University, Incheon 22212, Korea
*
Author to whom correspondence should be addressed.
Sustainability 2018, 10(5), 1607; https://doi.org/10.3390/su10051607
Submission received: 8 April 2018
/
Revised: 8 May 2018
/
Accepted: 15 May 2018
/
Published: 17 May 2018
(This article belongs to the Special Issue Disasters, Crisis, Hazards, Emergencies and Sustainable Development)
Abstract
:In this paper, we investigate the priority determination problem for areas that have been damaged during disasters. Relief distribution should be planned while considering the priorities of the damaged areas. To determine the priorities of the damaged areas, we first define four criteria and then propose a voting TOPSIS (technique for order of preference by similarity to ideal solution) that utilizes the fuzzy pair-wise comparison, data envelopment analysis, and TOPSIS. Since the voting TOPSIS is based on the voting results of multiple experts, it can be applied to urgent situations quickly, regardless of the consistency of comparison, the number of alternatives, and the number of participating experts. The proposed approach is validated using a real-world case, and this case analysis shows that the voting TOPSIS is viable.
1. Introduction
Because natural disasters occur around the world, disaster management has gained global attention [1,2]. Many governments are taking on the responsibility to perform pre- and post-disaster actions to reduce damage and casualties, and non-governmental organizations are also involved in different stages of disaster management. Distributing relief to the casualties has become one of the important issues of disaster management. Relief distribution is the deployment of resources such as water and food to the affected population. When distributing relief to multiple damaged areas, determining the priorities among those damaged areas becomes a critical issue and leads to distribution planning. Disaster areas that have a higher priority might need a faster distribution of the relief. To determine the priority of any disaster area, we need to consider various factors such as which damaged area has more urgent needs than others or which damaged area has worse geographical conditions (e.g., road conditions or distance from a relief center) that might delay the distribution of the relief. Thus, priority determination for relief distribution should be treated as a multi-criteria decision-making (MCDM) problem.
In this paper, we address this priority determination problem in disasters using a real-world case: the flooding of Zhangbang Town, Huanggang City, Hubei Province, China, in 2016. Using this real-world case, we first propose the evaluation criteria that affect relief priority and then determine the relative priorities of the damaged areas by applying the voting TOPSIS (technique for order of preference by similarity to ideal solution), which is an extension of the well-known MCDM technique TOPSIS. The voting TOPSIS is devised and used for the following reasons: (1) to consider the judgments of multiple experts (i.e., local disaster relief planners) quickly by adopting a voting system and (2) to increase the applicability of the existing TOPSIS in the real world.
In other words, in disaster situations, experts (i.e., decision-makers) are asked to evaluate and determine the priorities as quickly as possible. Thus, a simple and quick decision is required. Additionally, such decisions should be based not on a single expert but on multiple experts to reflect various opinions. In this regard, we propose the voting TOPSIS-based approach to consider the abovementioned issues, and we subsequently show its feasibility by analyzing a real-world case.
This paper is organized as follows. The related literature is summarized in Section 2, and the voting TOPSIS is presented in Section 3. In Section 4, the case study with data is provided to show how the proposed approach works. Finally, Section 5 offers concluding remarks and directions for future research.
2. Literature Review
2.1. Disaster Logistics
Disaster logistics has attracted considerable attention in recent years. In disasters, demands often outstrip the available resources. Disaster logistics can be defined as the required process of handling those resources in order to distribute relief to the victims (i.e. affected people) [3]. Holguín-Veras, J. et al. [4] investigated commercial logistics, and argued that the objective of commercial logistics is to minimize the related cost while transporting large volumes of cargo to the predetermined destination.
In contrast, disaster logistics covers a wide range of activities that occur in any phase of disaster management, i.e., mitigation, preparedness, response, and recovery in disasters [5]. In the mitigation phase of disaster logistics, we need to focus on preventing disasters. The preparation phase involves with various decisions regarding the number of distribution centers to be established and their locations. The response phase is directly related to the operational decisions regarding how to distribute relief goods to the areas damaged. Finally, in the recovery phase, restoring becomes an important issue.
Kovács and Spens [6] identified various challenges regarding humanitarian logistics. They also divided the phases of disaster logistics: (1) preparedness, which refers to preparation and prevention; (2) immediate response for emergency relief or transition; and (3) reconstruction for activities related to recovery, rehabilitation, and development. According to the phase of disaster relief and the different types of disasters, they summarized some related issues which need to be considered. Caunhye et al. [7] reviewed the past researches on optimization models in emergency logistics. In particular, they focused on relief distribution models which are used for post-disaster planning. In their research, various objectives and constraints of past related researches were summarized. Gralla et al. [8] tried to determine the multi-attribute utility function for the related objectives in the earliest stage of response, the week after a disaster. For priority determination, conjoint analysis which can handle piecewise linear, additive utility functions is used. Safeer et al. [9] reviewed past related researches on transportation and distribution in emergency humanitarian logistics using a classification methodology. They identified the objective functions and constraints that are used in relief distribution models. Özdamar and Ertem [10] presented a survey which focuses on the response and recovery planning phases of the disaster lifecycle. They provided a list of models related to relief delivery with regard to their objectives, model particulars and structures, decisions considered, and solution methods. Recently, Goldschmidt and Kumar [11] published a review paper on humanitarian operations and disaster management to identify the related research trend. They used a disaster management lifecycle framework, like that of Kovács and Spens [6]. In their research, when a natural disaster occurs (i.e., response stage), any relief (humanitarian) organizations should understand what aid is required, where it is located, and what transportation method is necessary to deliver it. More recently, Cao et al. [12] also formulated a multi-objective mixed-integer nonlinear programming model to maximize the lowest victims’ perceived satisfaction, and respectively minimize the largest deviation on victims’ perceived satisfaction when distributing relief to the damaged areas. Also, as for the disaster logistics, there have been several survey papers which systematically summarize past related researches. Noham and Tzur [13] proposed a mathematical model for resource allocation in disasters considering the actual post-disaster decision that is based on practitioners’ knowledge and experience. They pointed out that existing models for disaster response typically adopt a global optimization point of view, which may not be attainable since they do not consider the actual decision-making process after a real disaster occurs.
In this paper, we focus on the priority determination for damaged areas when distributing relief goods in the response phase of disaster logistics.
2.2. Priority Determination of the Damaged Areas for Disaster Logistics
Considering the priority determination of the damaged areas, some related research can be found following the increase in disaster- or emergency-related research.
Sheu [3] presented an emergency logistics distribution approach for quickly responding to the urgent relief demands of the affected areas during a three-day crucial rescue period. The methodologies used in his research included fuzzy clustering and multi-objective dynamic programming models. The fuzzy clustering-based approach was used to group the damaged areas and associate the respective distribution priorities to those areas. When grouping the damaged areas, the following four urgency attributes were used: (1) the time difference between the time of the previous relief arrival and the present time; (2) the ratio of the number of casualties to the total number of people trapped; (3) the proportion of helpless groups, including children and the elderly, relative to the total number of people trapped; and (4) the significance of the building damage conditions. Sheu [14] improved his research by presenting a relief-demand management model for dynamically responding to the relief demands of affected people in emergency conditions during a large-scale disaster. This study conducted a numerical study of a real large-scale earthquake disaster. He used a fuzzy clustering-based approach to group these affected areas and then determined the urgency of the groups in the damaged areas using TOPSIS. In the grouping phase of the affected area, he added an additional urgency attribute, the time-variance ratio of the number of trapped survivors.
Lin et al. [15] proposed a logistics model for delivering prioritized items in disaster relief operations. To verify the importance of the proposed model for delivery tasks containing prioritized delivery requests, they used a case study of a disaster relief operation effort in an earthquake scenario. Afshar and Haghani [16] proposed a mathematical model to minimize the total unsatisfied demand for disaster victims. In this model, the given parameters representing the relative urgency regarding commodity, time, and demand point were used. If there was a request for a commodity from any disaster point that seemed more important than others, this request was treated first in their model. However, there was no explanation regarding how the relative urgency was determined. More recently, Rivera-Royero et al. [17] developed a dynamic model to serve the demand while prioritizing the response according to the level of urgency of the demand points. In their case, the objective was to minimize the weighted demand that remained unsatisfied through the given planning horizon, where the weights of the demands were given using a priority score. They recommended that the priority of the disaster point be determined by considering the following aspects: (1) the characteristic of any demand point; (2) how long any demand point has been waiting for relief items; and (3) the type of the relief item.
Gutjahr and Nolz [18] published a comprehensive review paper regarding multi-criteria optimization in humanitarian aid. In their research, optimization criteria such as cost, response time, travel distance, coverage, equity, etc. were summarized first, and then they outlined the MCDM approaches such as analytic hierarchy process (AHP), compromise programming, etc. Ortuño et al. [19] reviewed decision aid models and systems for disaster logistics by classifying the past researches in terms of the phase of disaster management cycle and the methodologies used. According to the abovementioned review papers, there have been a huge number of studies on multi-criteria optimization in disasters rather than MCDM, which focuses on priority determination. This seems to be because most of the past related papers tried to generate a specific plan or schedule of relief distribution using mathematical modeling. Also, they mainly considered multi-objectives to reflect various needs of the damaged areas. In the middle of planning or scheduling, the priorities of the damaged areas were determined as the outcome of running the proposed multi-criteria optimization models. In other words, by checking the allocated amount of the relief after running the optimization models, the priority of any area can be estimated. However, in the real world, when any disaster occurs, there is not enough time to run sophisticated optimization models, which usually require lots of computation time to run. In addition, since any unexpected events (e.g., aftershock) can occur in the middle of relief distribution, a complete plan or schedule obtained from running the multi-objective optimization could become useless at any time. Instead, a quick and simple decision based on the onsite experts might be preferred. From the viewpoint of practitioners, a quick decision on which area has a higher priority for relief distribution is much more important than obtaining a complete distribution schedule for all items for all areas. Once the priorities of the damaged areas are determined, the decision-makers can allocate the required relief to the damaged areas quickly.
In short, even if related research exists, most such studies have focused on developing mathematical models to generate an optimized relief distribution plan or schedule. Thus, the priority determination was either skipped by assuming the priorities or treated as a partial subject of their research. Additionally, investigations of MCDM in connection with priority determination in disaster situations focusing on actual case analyses are lacking.
2.3. TOPSIS
Although there are many MCDM methodologies, we focused on TOPSIS and its variants because we used TOPSIS as the main methodology for our research. Since its development in 1981, TOPSIS has been recognized as a well-known MCDM methodology for determining the priority of given alternatives [20]. The basic premise of TOPSIS is that the most preferred alternative should have the shortest distance from the ideal solution and the longest distance from the negative ideal solution [21,22]. Compared to AHP, another popular MCDM methodology, TOPSIS has the following advantages: the number of alternatives has no explicit limit since it does not require either pair-wise comparison (PWC) or a consistency check, and it is simple and quick to apply. In contrast, AHP has difficulty handling more than seven criteria and/or alternatives because AHP is based on PWC, which requires decision-makers to consider the previous PWC results to avoid violating consistency in their judgements.
TOPSIS has a wide range of real-world applications, and many related research papers can be found. Behzadian et al. [23] found 266 research papers from 103 journals published from 2000 to 2012 and classified those papers into nine application areas, including supply chain management and logistics, engineering and manufacturing systems, and business and marketing management. According to their analysis, TOPSIS has been successfully applied to a wide range of application areas and industrial fields.
Along with the application of TOPSIS, many researchers have tried to modify the conventional TOPSIS by adopting fuzzy set theory or changing the sub-step of TOPSIS. To reflect the ambiguous judgements (e.g., linguistic values) of experts, fuzzy numbers have been utilized in TOPSIS [24,25,26,27]. Additionally, some researchers have tried to change the sub-step of TOPSIS to address several TOPSIS-related issues, such as considering the relative importance of the two separations (i.e., distances from ideal and negative ideal solutions) [22,28,29].
In this paper, we applied the voting TOPSIS, which utilizes fuzzy PWC, data envelopment analysis (DEA), and TOPSIS. Since the voting TOPSIS is based on the voting results of multiple experts, it can be applied to urgent situations quickly, regardless of the consistency of the comparison, the number of alternatives, and the number of participating experts. In disaster situations, a relief team consisting of multiple experts is sent to the damaged areas to determine the condition of the damaged areas and the priorities for the damaged areas. Thus, quick and concise decisions are required to reduce any unnecessary delay caused by the decision-making process.
3. Voting TOPSIS
The concept of voting TOPSIS is adopted from the preference voting and aggregation suggested by Liu and Hai [30] and Wang et al. [31]. Liu and Hai [30] proposed a voting AHP that replaces PWC with DEA-based ordering. Similarly, Wang et al. [31] proposed models for preference voting and aggregation using DEA. These two studies tried to determine the final rank of alternatives by using the votes of experts under the AHP framework. However, since their approaches were concerned with the rank without considering ideal or negative ideal solutions, the final ranks were generated by using only the votes. Thus, the similarity of the current alternative to the ideal or negative ideal solution could not be reflected in the final priority determination.
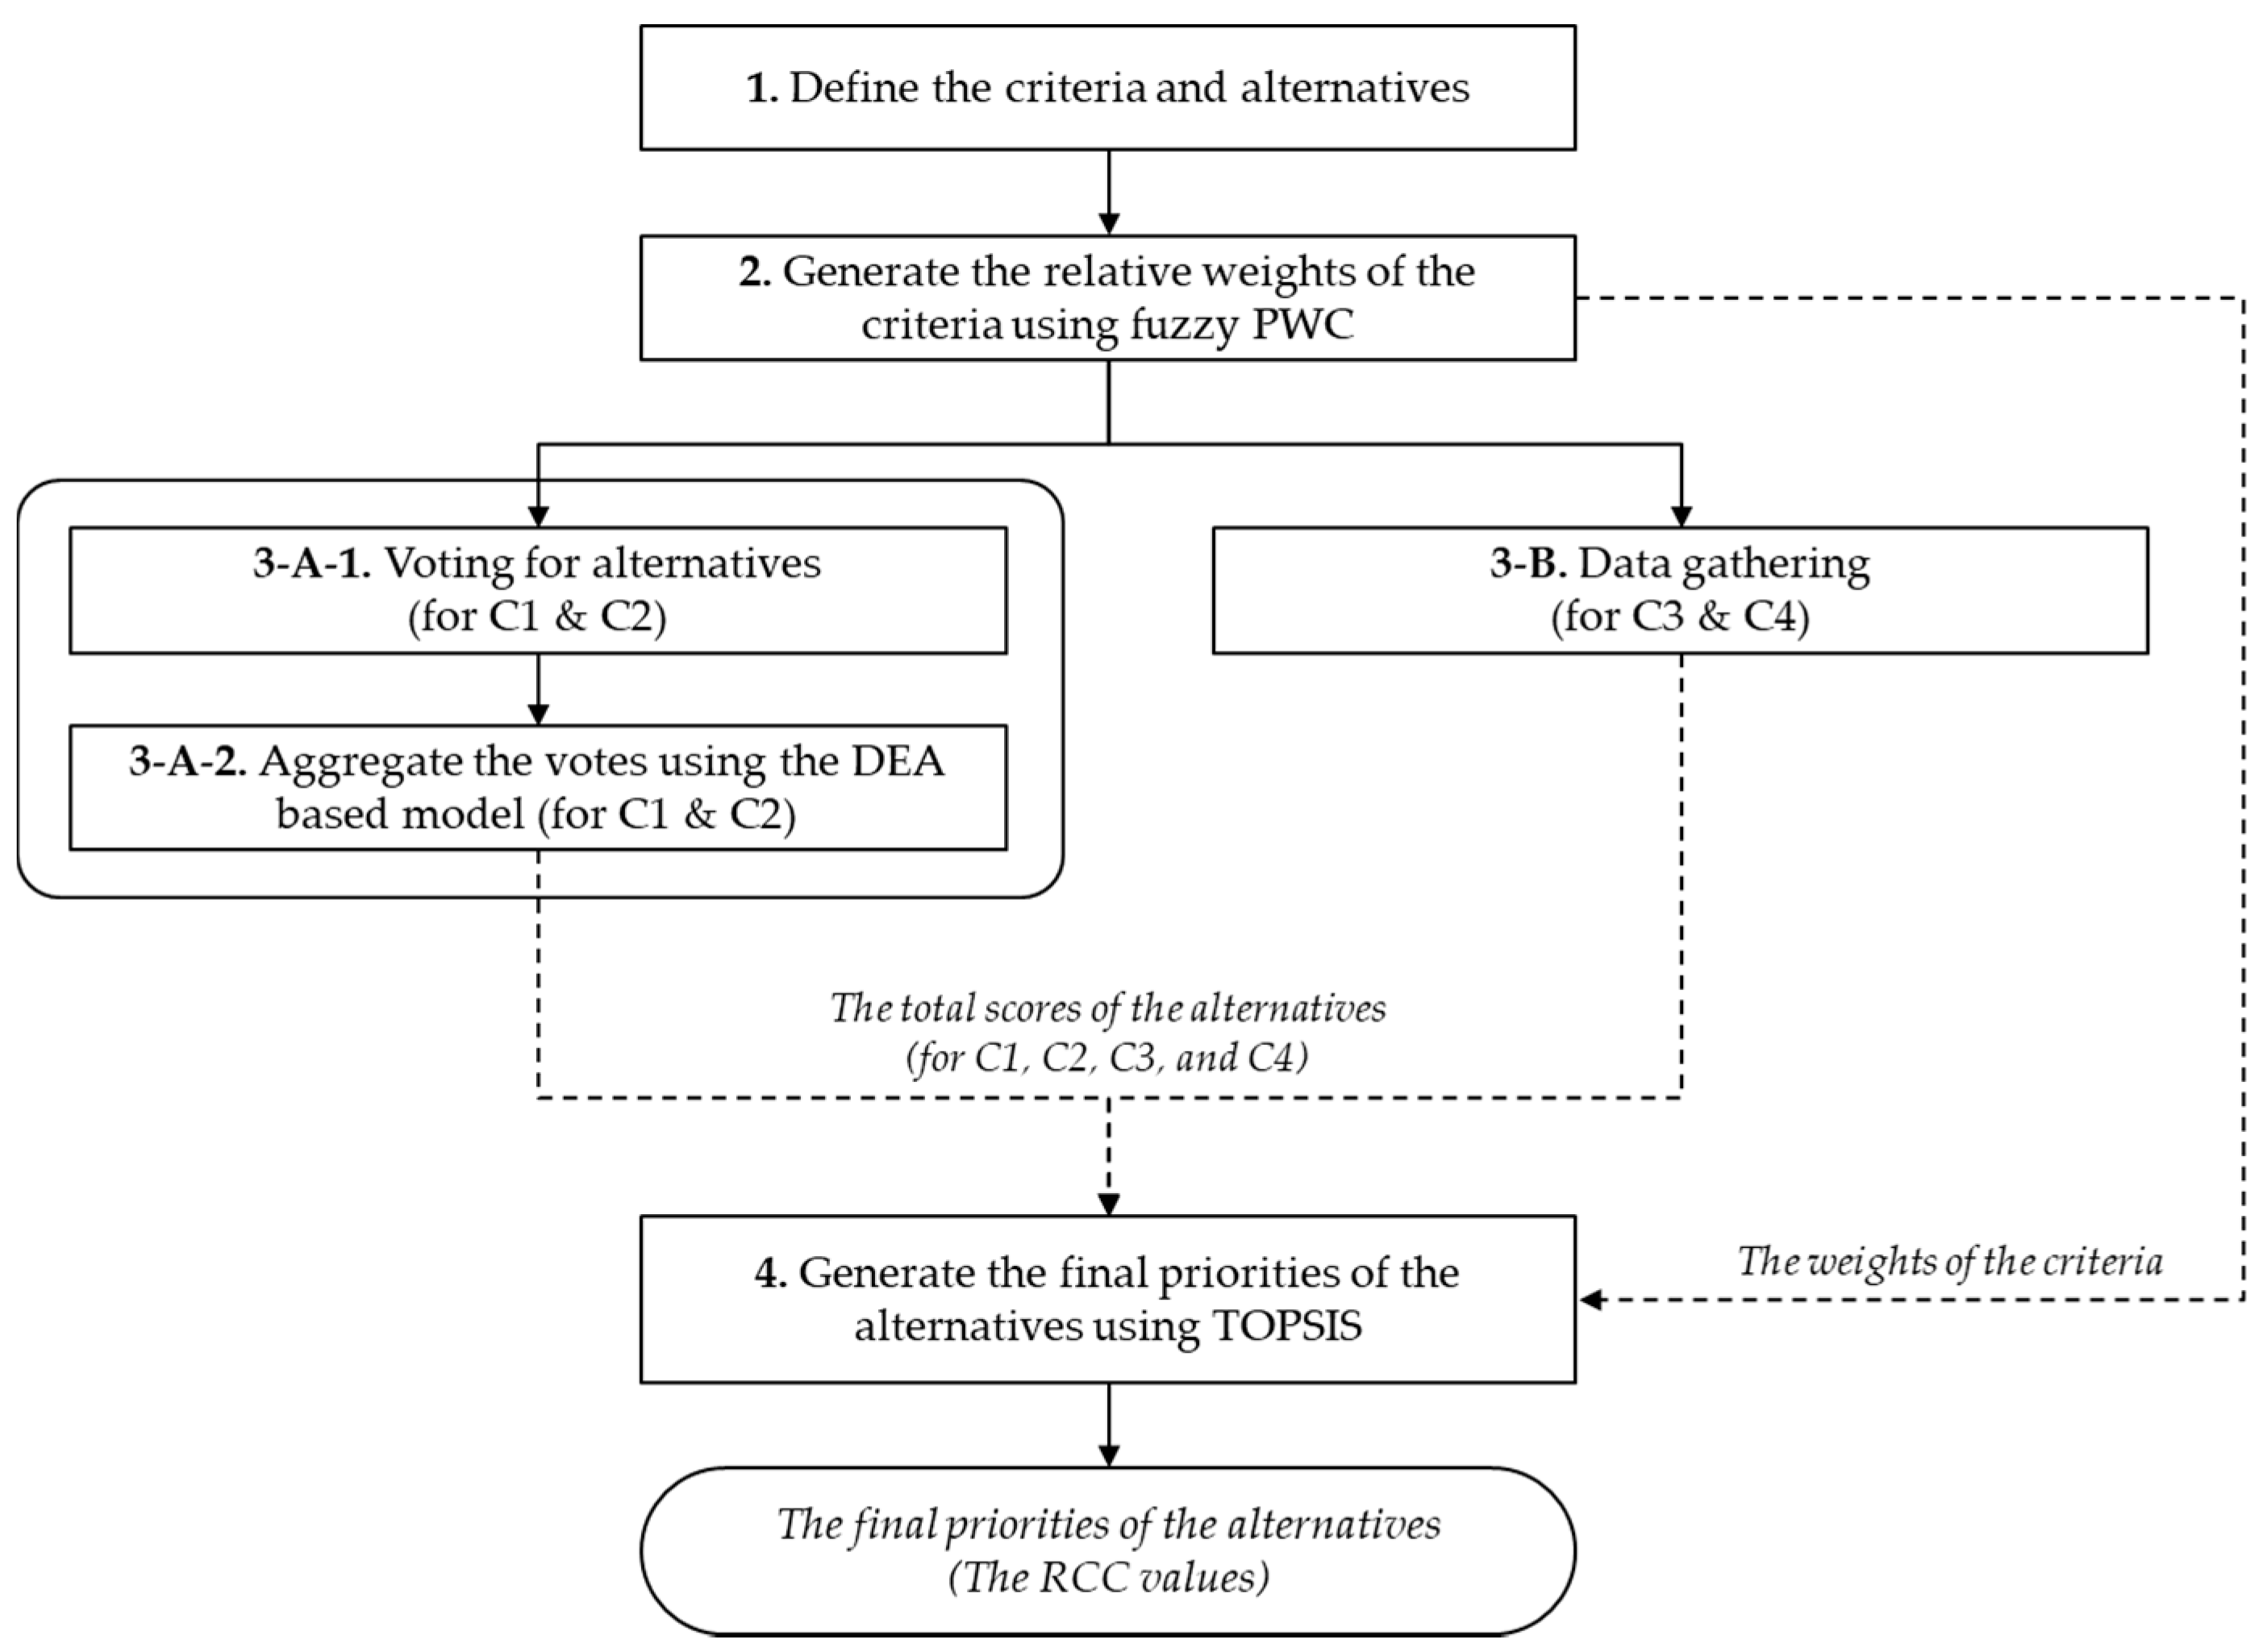
In this paper, we combined three different methodologies, PWC, DEA, and TOPSIS, and name this approach the voting TOPSIS. The voting TOPSIS is composed of the following seven steps. Each step is explained in detail in the following subsections:
- -
- Step 1: Define criteria and alternatives for the given MCDM problem
- -
- Step 2: Apply PWC to determine the relative weights of the criteria
- -
- Step 3: The DMs vote for alternatives and generate a decision matrix that aggregates the votes using the DEA-based model
- -
- Step 4: Apply TOPSIS to the decision matrix to calculate the final relative weights of the alternatives
3.1. Step 1: Define Criteria and Alternatives
For convenience, we define the criteria and alternatives using the main problem in this paper, that is, determining the priorities of the damaged areas in disasters.
Based on the literature survey and discussion among the DMs, four criteria were defined as follows: degree of damage, difficulty of approaching a disaster area, ratio of the vulnerable (e.g., children and seniors), and distance between a disaster area and a distribution center (or point). Table 1 shows a summary of the chosen criteria and the related references.
As shown in Table 1, we found the related researches which support our chosen criteria. Sheu [3] and Sheu [14] considered (1) the significance of the building damage conditions and (2) the proportion of helpless groups, including children and the elderly, relative to the total number of people trapped as the important urgency attributes when grouping the damaged areas. Yi and Özdamar [32] proposed an integrated location-distribution model for coordinating logistics support and evacuation operations in disaster response activities. They categorized two levels of injury, light-to-moderate and heavy, and the structural risk grades related to the degree of damage were checked. Wisetjindawat [33] provided the planning framework of disaster relief operations, and both the estimation of level of damage and the estimation of victims at each shelter were used to develop their framework. Holguin-Veras et al. [4] analyzed the unique features of post-disaster humanitarian logistics. They pointed out that the type of disaster and the accessibility of the disaster area play a major role in delivering supplies to the damaged areas. Rivera-Royero et al. [17] argued that the priority of the disaster point needs to be determined by considering the characteristic of any demand point (isolated or non-isolated) which leads to the difficulty of approaching. Noyan et al. [34] characterized the concepts of accessibility and equity within the context of last mile distribution and presented a mathematical model that incorporates them while capturing the uncertain aspects of the post-disaster situations. They tried to maximize the expected total accessibility, which can be defined as the ease of the access to the damaged areas. More recently, Yu et al. [35] also emphasized accessibility using the following example. Let us assume that some damaged areas can be reached by small trucks, while others cannot be reached without the help of excavator. In this case, it might be reasonable to consider the accessibility of the damaged areas when developing the evaluation metrics for the damaged areas. Marcelin et al. [36] focused on the impact of disasters to older adults. They argued that disasters seem to disproportionately affect some demographic groups, and older adults are more vulnerable to the impacts of disasters as compared with other age groups. They also mentioned that the relief goods and service delivery points should be made as accessible as possible to them due to the potential of older adults being unable to be evacuated or left behind in disaster situations. Balcik et al. [37] emphasized that supplies need to be allocated proportionally among the damaged areas based on demand realizations and population vulnerabilities. In particular, they tried to balance the weighted (by vulnerabilities) unsatisfied demand among all of the damaged areas.
The more detailed definitions of the four criteria are as follows:
- (C1)
- Degree of damage: This indicates how severe the damage is to the building or any infrastructure. The damage includes communication cut off, water cut off, and electricity cut off. These damages are closely related to the survival of the victims and the possibility of a quick rescue. Thus, the higher the degree of damage is for any area, the higher the priority of relief distribution is given.
- (C2)
- Difficulty of approaching a disaster area: This indicates how difficult it is for the rescue team to approach the target area. This is dependent on the road connection and/or condition. In practice, relief distribution may be delayed to any areas that have poor road connections and conditions because a rescue team must distribute relief to many areas as quickly as possible. Thus, the higher the difficulty of approaching for any area, the higher the priority of relief distribution is given.
- (C3)
- Ratio of the vulnerable: This indicates the ratio of the number of elderly and children to the total number of people in the disaster areas. We could consider the number of the trapped elderly and children instead of the number of elderly and children when checking this ratio of the vulnerable. However, the rescue team might not know the exact number of trapped people, including the elderly and children, in disaster situations. Thus, to calculate the ratio of the vulnerable, we use the overall number of the elderly and children. When there are more elderly and children in any disaster area, the priority of relief distribution in that area must be set higher than that in other areas.
- (C4)
- Distance between a disaster area and a distribution center: Since the distance between a disaster area and a distribution center is directly related to the delivery time of relief, the distance is important for determining the priority of relief distribution. The longer the distance from a distribution center to a given disaster area, the higher the delivery priority given to that area.
Among the above four criteria, C1 and C2 are qualitative, whereas C3 and C4 are quantitative because they can be checked quickly by using the existing related databases of disaster areas. Thus, when applying the proposed voting TOPSIS, we focus on C1 and C2, which require the subjective judgements of the experts (i.e., the local government officials).
3.2. Step 2: Fuzzy PWC for Determining the Relative Weights of the Criteria
In Figure 1, the weights of the criteria should be determined first by the DMs. To do this, fuzzy PWC is used to determine the relative weights of the criteria. In the real world, decision-makers provide ambiguous responses rather than exact values, and it is difficult to quantify the qualitative preferences of decision-makers. To overcome this difficulty, fuzzy judgments based on PWC have been suggested and applied to various problems [38,39,40,41]. In this paper, triangular fuzzy numbers are used for representing the linguistic values, and both the alpha-cut method and the index of optimism are used to reflect the confidence level of the decision-maker, respectively. Additionally, the geometric mean method is adopted for defuzzification.
As mentioned above, triangular fuzzy numbers () are adopted to represent the relative importance of each pair of elements. A triangular fuzzy number is defined by the interval [], with its mean , as follows:
Also, the triangular fuzzy number is represented by adopting the interval of confidence level as follows:
Equation (2) shows an -cut method that generates an interval set of values from a fuzzy number: the lower limit and upper limit of the fuzzy numbers with respect to -cut [42]. The value of is set between 0 and 1. If , it means that uncertainty is the greatest and confidence is the lowest. The triangular fuzzy numbers (), the corresponding membership function, and linguistic terms are shown in Figure 1 and Table 2.
Using the pair-wise judgment of the expert and a fuzzy comparison matrix, can be depicted as follows (if there are criteria):
where if , and or if .
The constructed fuzzy comparison matrix must be changed into a crisp comparison matrix. The index of optimism, , is used to represent the decision-maker’s attitude [43]. A larger value of means a higher degree of optimism. The index of optimism can be represented as follows:
where is the crisp value corresponding to considering the index of optimism .
By applying Equation (4) to the fuzzy comparison matrix , a crisp comparison matrix is obtained.
Using the crisp comparison matrix , a geometric mean method (Equation (6)) is used to calculate their priorities [44]:
where is the geometric mean of criterion .
For each of the criteria, the relative weights are calculated as follows:
Once the weights are obtained, we need to check the consistency of the judgments using the consistency ratio (CR) for each matrix. To calculate the CR, the consistency index (CI) is generated first using Equation (7):
where is the largest eigenvalue of and is the size of the matrix.
Next, the CR can be calculated by dividing the CI by a value obtained from a table of random consistency index (RCI), which indicates the average index for randomly generated weights [44].
If the CR is less than 0.1, the weights can be accepted. Otherwise, they are rejected.
3.3. Step 3: DMs’ Vote for Alternatives and Aggregate the Votes
After determining the relative weights of criteria using fuzzy PWC in Section 3.2, we evaluate the alternatives using the given criteria. For the qualitative criteria (i.e., C1 and C2), we collect the votes from the DMs to construct a decision matrix. For the quantitative criteria (C3 and C4), the performance evaluation can be easily performed using the existing database without the DMs’ votes.
In this paper, we adopt a voting system proposed by Wang et al. [31], which requires the DMs to evaluate the given alternatives for the C1 and C2 criteria. Wang et al. [31] proposed a linear programming (LP) model for preference voting and aggregation. Their model was based on the DEA model first suggested by Cook and Kress [45]. Before explaining the model, we set the following five evaluation grades ( for evaluating the alternatives for each of the four criteria in Figure 1.
Evaluation grades = {very high (), high (), normal (), low (), very bad ()}.
More numbers and different sets of evaluation grades can be defined if needed. The DMs can vote for one of five evaluation grades for each alternative under each criterion.
The necessary notations and the model for preference voting and aggregation are as follows:
Notations
- : the index of the criteria (
- : the index of the alternatives (
- : the index of the evaluation grade (
- : the relative importance weight attached to the th grade
- : the numbers (i.e., vote) of the DMs who evaluate the alternative to the th grade
- : the total score of the alternative for criterion
Model (for any given criterion )
subject to
Equations (9) and (10) maximize the minimum of the total scores of the alternative , which is a linear function of the relative importance weights. Additionally, this model determines a common set of weights () for all alternatives. After running the model, the relative weights of the evaluation grades are obtained. These relative weights of the evaluation grades are multiplied by the votes of the DMs for the alternatives under any given criterion. Thus, if there exist criteria and we need to evaluate alternatives using those criteria, then we should apply the above model times.
3.4. Step 4: Apply TOPSIS to the Decision Matrix
With the results obtained in Section 3.3, we define the following decision matrix:
: decision matrix that consists of (obtained from Section 3.3)
Given the decision matrix , the TOPSIS is applied using the following procedure:
- (1)
- Normalize the decision matrix as follows:
- (2)
- Compute the weighted normalized decision matrix. The weighted normalized value is calculated as follows:
- (3)
- Define the positive ideal solution (PIS) and the negative ideal solution (NIS) on each criterion of the weighted normalized decision matrix. The PIS () and NIS () can be defined as follows:where if criterion is maximized, and if criterion is minimized.
- (4)
- Calculate the Euclidean distance for each alternative to the ideal solutions using the following equation:The separation of an alternative from the PIS is given as:Similarly, the separation of an alternative from the NIS is given as:
- (5)
- Calculate the relative closeness coefficient (RCC) of the alternative with respect to the PIS and NIS. The RCC is always between 0 and 1. If an alternative is closer to the positive ideal than the negative ideal, then the RCC approaches 1. If an alternative is closer to the negative ideal than the positive ideal, the RCC approaches 0. The RCC is defined as follows:
Arrange the alternatives in descending order of the RCC to obtain the best alternative.
3.5. Overall Procedure of the Proposed Approach
The overall procedure of the proposed approach is as shown in Figure 2.
4. Case Analysis
4.1. Background
We focused on the flooding in eight villages in Zhangbang Town, Huanggang City, Hubei Province, China (see Figure 3 and Figure 4), on 13 June 2016. At that time, heavy rain caused transportation disruptions, electric power grids failed, 67 civil houses collapsed, 21 bridges were washed out, 1300 hectares of cropland were destroyed, 15.5 km of roadway was damaged, 2900 m of river bank were washed out, 50 river weirs were destroyed, seven water treatment plants were affected, and 13 people were lost. Additionally, many civil houses were damaged, which made them unsafe. The losses caused by the disaster were serious. Rescue was extremely urgent. Determining which village needed to be rescued first was an important issue for the disaster relief team.
4.2. Data Acquisition
In this study, the research data were obtained from the Zhangbang Town government. We asked five disaster relief planners (local officials) from Zhangbang Town to recall the past disaster situation and then vote on the evaluation grades (i.e., very high, high, normal, low, and very bad) for eight villages under C1 and C2.
Table 3 shows the voting results of the officials for the eight villages under C1 and C2, and the required information from the eight villages for evaluation under C3 and C4.
4.3. Applying the Voting TOPSIS
We applied the voting TOPSIS to determine the final priorities for the eight villages. All of the required calculations were coded and conducted using Python 3.6.3 with a Gurobi Python interface (for solving the mathematical model in Section 3.3).
(1) Fuzzy PWC for Determining the Relative Weights of the Criteria
First, we asked five planners to determine the relative weights for the criteria. Through internal discussion, they conducted a pair-wise comparison among four criteria and then generated the final relative weights for the four criteria.
In this example, (confidence level on the judgments of the decision-maker) was set to 0.8, and (optimism index) was set to 0.6, as recommended by Jung [41]. The fuzzy pair-wise comparison matrix, converted crisp comparison matrix, and weights of the four criteria are summarized in Table 4.
Based on the relative weights of the four criteria in Table 4, the degree of damage was considered the most important criterion, and the distance between a disaster area and a distribution center was the least important criterion.
(2) DMs’ Vote for Alternatives and Aggregate the Votes
Using the voting results for C1 and C2 in Table 2, we obtained the total scores for the eight villages (i.e., alternatives) under two criteria, C1 and C2, by applying Equations (9)–(12).
Table 5 shows the total scores for the eight villages for C1 and C2.
(3) Apply TOPSIS to the Decision Matrix
Once the decision matrix was prepared, we applied TOPSIS to that matrix. The decision matrix was composed of two parts: (1) the total scores from Table 5 for C1 and C2 and (2) the matching information (i.e., the last two columns) from Table 3 for C3 and C4. Through the pre-determined procedure in Section 3.4, the distributive normalization matrix (from Equation (13)), the weighted normalization matrix (from Equation (13)), the PIS and NIS (from Equations (15) and (16)), and the final RCC (from Equations (17)–(19)) were found, as shown in Table 6, Table 7, Table 8 and Table 9.
From the RCC values in Table 9, we determined the urgency order for the relief for the eight villages. The higher the RCC value was, the higher the urgency order was. The eight villages were listed in descending order by the RCC values as follows: Dazhu, Jiutan, Tuku, Sunchong, Qili, Huyuan, Gumu, and Shuyuan. After implementing the voting TOPSIS, we discussed the results with five disaster relief planners from Zhangbang Town and were given their positive response, which indicates that the proposed voting TOPSIS was viable when making a quick decision in disaster situations.
5. Conclusions
In this paper, we investigated the priority determination problem for damaged areas in disaster situations. Damaged areas need faster distribution of relief, but the relief planner should consider the restricted resources. Thus, the relief distribution should be scheduled by considering the priorities of the damaged areas. With the help of practitioners, we chose four different criteria: the degree of damage, the difficulty of approaching a disaster area, the ratio of the vulnerable, and the distance between a disaster area and a distribution center. Using these four criteria, we adopted TOPSIS as the main MCDM methodology for analyzing our problem. This method was used to determine the priorities of the damaged areas in disasters because of the following advantages: (1) it is simple to apply, (2) more than seven alternatives can be evaluated, and (3) the priorities can be calculated quickly without PWC or a consistency check.
The proposed approach was validated using a real-world case: the flooding case of eight villages in Zhangbang Town, Huanggang City, Hubei Province, China, in 2016. This case analysis showed that the proposed approach is viable and can be used in similar situations in the future.
However, this paper has some limitations. Although the current four criteria were selected through an extensive literature review and interviews with the local disaster relief planners from Zhangbang Town, additional criteria reflecting the disaster types could be considered. Additionally, other real-world cases can be used to validate the proposed approach. In particular, our case analysis was based on a retrospective application of the voting TOPSIS using a kind of post-event dry run. Thus, if possible, we need to check the applicability of the proposed approach in the real world on a real-time basis. For future studies, we need to categorize the disaster types and then propose a disaster-specific priority determination framework, since the needs will likely differ (e.g., flooding vs. hurricane). Also, disaster logistics needs to be connected to disaster management, comprehensively considering additional important issues such as insurance and retrofit. As pointed out by Peng et al. [46], modeling the integrated roles of insurance and retrofit in disaster management could reduce overall system risks. Finally, we need to identify additional real-world cases to validate the proposed approach in various disaster situations that require quick decisions.
Author Contributions
Y.H. and H.J. conceived and designed this research and experiments; Y.H. collected the required data and conducted survey; H.J. performed the experiments using Python; Y.H. and H.J. analyzed the data and wrote the paper.
Funding
This work was supported by an INHA UNIVERSITY Research Grant (54647-01).
Acknowledgments
The authors appreciate the concerns and support of the mayor (Lin Cai), the vice-mayor (Xiang Wang), and the director (Chunlin Chen) of civil affairs office of Zhangbang Town government.
Conflicts of Interest
The authors declare no conflict of interest. The founding sponsor had no role in the design of the study; in the collection, analyses, or interpretation of data; in the writing of the manuscript, and in the decision to publish the results.
References
- Kellett, J.; Sparks, D. Disaster Risk Reduction: Spending Where it Should Count; Global Humanitarian Assistance: Somerset, UK, 2012. [Google Scholar]
- Sawada, Y.; Takasaki, Y. Natural Disaster, Poverty, and Development: An Introduction. World Dev. 2017, 94, 2–15. [Google Scholar] [CrossRef]
- Sheu, J. An Emergency Logistics Distribution Approach for Quick Response to Urgent Relief Demand in Disasters. Transp. Res. Part E Logist. Transp. Rev. 2007, 43, 687–709. [Google Scholar] [CrossRef]
- Holguín-Veras, J.; Jaller, M.; Van Wassenhove, L.N.; Pérez, N.; Wachtendorf, T. On the Unique Features of Post-Disaster Humanitarian Logistics. J. Oper. Manag. 2012, 30, 494–506. [Google Scholar] [CrossRef]
- National Governors’ Association Center for Policy Research. Comprehensive Emergency Management: A Governor’s Guide; National Governors’ Association: Washington, DC, USA, 1979. [Google Scholar]
- Kovács, G.; Spens, K. Identifying challenges in humanitarian logistics. Int. J. Phys. Distrib. Logist. Manag. 2009, 39, 506–528. [Google Scholar] [CrossRef]
- Caunhye, A.M.; Nie, X.; Pokharel, S. Optimization models in emergency logistics: A literature review. Socio-Econ. Plan. Sci. 2012, 46, 4–13. [Google Scholar] [CrossRef]
- Gralla, E.; Goentzel, J.; Fine, C. Assessing trade-offs among multiple objectives for humanitarian aid delivery using expert preference. Prod. Oper. Manag. 2014, 23, 978–989. [Google Scholar] [CrossRef]
- Safeer, M.; Anbuudayasankar, S.P.; Balkumar, K.; Ganesh, K. Analyzing transportation and distribution in emergency humanitarian logistics. Procedia Eng. 2014, 97, 2248–2258. [Google Scholar] [CrossRef]
- Özdamar, L.; Ertem, M.A. Models, solutions and enabling technologies in humanitarian logistics. Eur. J. Oper. Res. 2015, 244, 55–65. [Google Scholar] [CrossRef]
- Goldschmidt, K.H.; Kumar, S. Humanitarian operations and crisis/disaster management: A retrospective review of the literature and framework for development. Int. J. Disaster Risk Reduct. 2016, 20, 1–13. [Google Scholar] [CrossRef]
- Cao, C.; Li, C.; Yang, Q.; Liu, Y.; Qu, T. A novel multi-objective programming model of relief distribution for sustainable disaster supply chain in large-scale natural disasters. J. Clean. Prod. 2018, 174, 1422–1435. [Google Scholar] [CrossRef]
- Noham, R.; Tzur, M. Designing humanitarian supply chains by incorporating actual post-disaster decisions. Eur. J. Oper. Res. 2018, 265, 1064–1077. [Google Scholar] [CrossRef]
- Sheu, J. Dynamic Relief-Demand Management for Emergency Logistics Operations under Large-Scale Disasters. Transp. Res. Part E Logist. Transp. Rev. 2010, 46, 1–17. [Google Scholar] [CrossRef]
- Lin, Y.; Batta, R.; Rogerson, P.A.; Blatt, A.; Flanigan, M. A Logistics Model for Emergency Supply of Critical Items in the Aftermath of a Disaster. Socio-Econ. Plan. Sci. 2011, 45, 132–145. [Google Scholar] [CrossRef]
- Afshar, A.; Haghani, A. Modeling Integrated Supply Chain Logistics in Real-Time Large-Scale Disaster Relief Operations. Socio-Econ. Plan. Sci. 2012, 46, 327–338. [Google Scholar] [CrossRef]
- Rivera-Royero, D.; Galindo, G.; Yie-Pinedo, R. A Dynamic Model for Disaster Response Considering Prioritized Demand Points. Socio-Econ. Plan. Sci. 2016, 55, 59–75. [Google Scholar] [CrossRef]
- Gutjahr, W.J.; Nolz, P.C. Multicriteria optimization in humanitarian aid. Eur. J. Oper. Res. 2016, 252, 351–366. [Google Scholar] [CrossRef]
- Ortuño, M.T.; Cristóbal, P.; Ferrer, J.M.; Martín-Campo, F.J.; Muñoz, S.; Tirado, G.; Vitoriano, B. Decision aid models and systems for humanitarian logistics. A survey. In Decision Aid Models for Disaster Management and Emergencies; Vitoriano, B., Montero, J., Ruan, D., Eds.; Atlantis Press: Paris, France, 2013; pp. 17–44. [Google Scholar]
- Hwang, C.L.; Yoon, K. Multiple Attribute Decision Making Methods and Applications; Springer: Berlin/Heidelberg, Germany, 1981. [Google Scholar]
- Chen, S.; Hwang, C. Fuzzy multiple attribute decision making methods. In Fuzzy Multiple Attribute Decision Making; Springer: Berlin/Heidelberg, Germany, 1992; pp. 289–486. [Google Scholar]
- Opricovic, S.; Tzeng, G. Compromise Solution by MCDM Methods: A Comparative Analysis of VIKOR and TOPSIS. Eur. J. Oper. Res. 2004, 156, 445–455. [Google Scholar] [CrossRef]
- Behzadian, M.; Otaghsara, S.K.; Yazdani, M.; Ignatius, J. A state-of the-art survey of TOPSIS applications. Expert Syst. Appl. 2012, 39, 13051–13069. [Google Scholar] [CrossRef]
- Kahraman, C.; Yasin Ateş, N.; Çevik, S.; Gülbay, M.; Ayça Erdoğan, S. Hierarchical fuzzy TOPSIS model for selection among logistics information technologies. J. Enterp. Inf. Manag. 2007, 20, 143–168. [Google Scholar] [CrossRef]
- Kaya, T.; Kahraman, C. Multicriteria decision making in energy planning using a modified fuzzy TOPSIS methodology. Expert Syst. Appl. 2011, 38, 6577–6585. [Google Scholar] [CrossRef]
- Liao, C.N.; Kao, H.P. An integrated fuzzy TOPSIS and MCGP approach to supplier selection in supply chain management. Expert Syst. Appl. 2011, 38, 10803–10811. [Google Scholar] [CrossRef]
- Awasthi, A.; Chauhan, S.S.; Omrani, H. Application of fuzzy TOPSIS in evaluating sustainable transportation systems. Expert Syst. Appl. 2011, 38, 12270–12280. [Google Scholar] [CrossRef]
- Deng, H.; Yeh, C.H.; Willis, R.J. Inter-company comparison using modified TOPSIS with objective weights. Comput. Oper. Res. 2000, 27, 963–973. [Google Scholar] [CrossRef]
- Kuo, T. A modified TOPSIS with a different ranking index. Eur. J. Oper. Res. 2017, 260, 152–160. [Google Scholar] [CrossRef]
- Liu, F.H.F.; Hai, H.L. The voting analytic hierarchy process method for selecting supplier. Int. J. Prod. Econ. 2005, 97, 308–317. [Google Scholar] [CrossRef]
- Wang, Y.M.; Chin, K.S.; Yang, J.B. Three new models for preference voting and aggregation. J. Oper. Res. Soc. 2007, 58, 1389–1393. [Google Scholar] [CrossRef]
- Yi, W.; Özdamar, L. A Dynamic Logistics Coordination Model for Evacuation and Support in Disaster Response Activities. Eur. J. Oper. Res. 2007, 179, 1177–1193. [Google Scholar] [CrossRef]
- Wisetjindawat, W.; Itob, H.; Fujitaa, M.; Eizoa, H. Planning disaster relief operations. Procedia Soc. Behav. Sci. 2014, 125, 412–421. [Google Scholar] [CrossRef]
- Noyan, N.; Balcik, B.; Atatkan, S. A stochastic optimization model for designing last mile relief networks. Transp. Sci. 2016, 50, 1092–1113. [Google Scholar] [CrossRef]
- Yu, L.; Zhang, C.; Yang, H.; Miao, L. Novel methods for resource allocation in humanitarian logistics considering human suffering. Comput. Ind. Eng. 2018, 119, 1–20. [Google Scholar] [CrossRef]
- Marcelin, J.M.; Horner, M.W.; Ozguven, E.E.; Kocatepe, A. How does accessibility to post-disaster relief compare between the aging and the general population? A spatial network optimization analysis of hurricane relief facility locations. Int. J. Disaster Risk Reduct. 2016, 15, 61–72. [Google Scholar] [CrossRef]
- Balcik, B.; Beamon, B.M.; Smilowitz, K. Last mile distribution in humanitarian relief. J. Intell. Transp. Syst. 2008, 12, 51–63. [Google Scholar] [CrossRef]
- Mikhailov, L. Deriving priorities from fuzzy pairwise comparison judgements. Fuzzy Sets Syst. 2003, 134, 365–385. [Google Scholar] [CrossRef]
- Kuo, M.S.; Liang, G.S.; Huang, W.C. Extensions of the multicriteria analysis with pairwise comparison under a fuzzy environment. Int. J. Approx. Reason. 2006, 43, 268–285. [Google Scholar] [CrossRef]
- Jung, H. A fuzzy AHP–GP approach for integrated production-planning considering manufacturing partners. Expert Syst. Appl. 2011, 38, 5833–5840. [Google Scholar] [CrossRef]
- Jung, H. Evaluation of Third Party Logistics Providers Considering Social Sustainability. Sustainability 2017, 9, 777. [Google Scholar] [CrossRef]
- Güngör, Z.; Serhadlıoğlu, G.; Kesen, S.E. A Fuzzy AHP Approach to Personnel Selection Problem. Appl. Soft Comput. 2009, 9, 641–646. [Google Scholar] [CrossRef]
- Vahidnia, M.H.; Alesheikh, A.A.; Alimohammadi, A. Hospital Site Selection using Fuzzy AHP and its Derivatives. J. Environ. Manag. 2009, 90, 3048–3056. [Google Scholar] [CrossRef] [PubMed]
- Saaty, T. The Analytic Hierarchy Process: Planning, Priority Setting, Resource Allocation; University of Pittsburgh: Pittsburgh, PA, USA, 1980. [Google Scholar]
- Cook, W.D.; Kress, M. A data envelopment model for aggregating preference rankings. Manag. Sci. 1990, 36, 1302–1310. [Google Scholar] [CrossRef]
- Peng, J.; Kesete, Y.; Gao, Y.; Davidson, R.; Nozick, L.K.; Kruse, J. Modeling the Integrated Roles of Insurance and Retrofit in Managing Natural Disaster Risk: A Multi-stakeholder Perspective. Nat. Hazards 2014, 74, 1043–1068. [Google Scholar] [CrossRef]
Figure 1.
Membership functions for fuzzy numbers.

Figure 2.
The overall procedure.

Figure 3.
The location of Huanggang City in Hubei Province, China.

Figure 4.
The eight villages in Zhangbang Town of Huanggang City.


Table 1.
Chosen criteria and the related references.
| Criteria | References |
|---|---|
| (C1) Degree of damage | Sheu [3]; Yi and Özdamar [32]; Sheu [14]; Wisetjindawat [33]; Holguín-Veras et al. [4] |
| (C2) Difficulty of approaching a disaster area | Holguín-Veras et al. [4]; Rivera-Royero et al. [17]; Noyan et al. [34]; Yu et al. [35] |
| (C3) Ratio of the vulnerable | Sheu [3]; Sheu [14]; Marcelin et al. [36]; Balcik et al. [37] |
| (C4) Distance between a disaster area and a distribution center | Holguín-Veras et al. [4]; Practitioners of this case study (the disaster relief planners from the Zhangbang Town, Huanggang City, Hubei Province, China) |
Table 2.
Linguistic judgements and the corresponding fuzzy numbers.
| Linguistic Judgments | Fuzzy Number | |
|---|---|---|
| Equally important | Equally preferred | (1, 1, 2) |
| Moderately more important | Moderately more preferred | (1, 3, 5) |
| Strongly more important | Strongly more preferred | (3, 5, 7) |
| Very strongly more important | Very strongly more preferred | (5, 7, 9) |
| Absolutely more important | Absolutely more preferred | (8, 9, 9) |
Table 3.
Voting results for C1 and C2 and the required information for C3 and C4.
| C1 | C2 | C3 (%) | C4 (km) | |||||||||
|---|---|---|---|---|---|---|---|---|---|---|---|---|
| VH | H | M | L | VL | VH | H | M | L | VL | |||
| Jiutan | 1 | 4 | 0 | 0 | 0 | 4 | 1 | 0 | 0 | 0 | 33.2 | 9.27 |
| Dazhu | 3 | 2 | 0 | 0 | 0 | 0 | 4 | 1 | 0 | 0 | 31.5 | 8.99 |
| Tuku | 0 | 5 | 0 | 0 | 0 | 3 | 2 | 0 | 0 | 0 | 33.0 | 10.21 |
| Qili | 0 | 0 | 3 | 2 | 0 | 1 | 3 | 1 | 0 | 0 | 32.2 | 9.23 |
| Shuyuan | 0 | 0 | 2 | 3 | 0 | 0 | 0 | 3 | 2 | 0 | 32.4 | 3.30 |
| Gumu | 0 | 0 | 0 | 4 | 1 | 1 | 4 | 0 | 0 | 0 | 32.9 | 4.96 |
| Huyuan | 0 | 0 | 3 | 2 | 0 | 0 | 0 | 0 | 3 | 2 | 32.0 | 6.30 |
| Sunchong | 0 | 1 | 4 | 0 | 0 | 0 | 0 | 0 | 3 | 2 | 32.8 | 8.43 |
VH: Very High; H: High; M: Medium; L: Low; VL: Very Low.
Table 4.
Fuzzy comparison matrix, crisp comparison matrix, and the weights of the four criteria.
| Fuzzy Comparison Matrix | Crisp Comparison Matrix | Weight | |||||||
|---|---|---|---|---|---|---|---|---|---|
| C1 | C2 | C3 | C4 | C1 | C2 | C3 | C4 | ||
| C1 | 1 | (4.6, 5.4) | (1.0, 1.2) | (6.6, 7.4) | 1 | 5.080 | 1.120 | 7.080 | 0.4553 |
| C2 | (1/5.4, 1/4.6) | 1 | (1/3.4, 1/2.6) | (2.6, 3.4) | 0.205 | 1 | 0.348 | 3.080 | 0.1203 |
| C3 | (1/1.2, 1/1.0) | (2.6, 3.4) | 1 | (6.6, 7.4) | 0.933 | 3.080 | 1 | 7.080 | 0.3731 |
| C4 | (1/7.4, 1/6.6) | (1/3.4, 1/2.6) | (1/7.4, 1/6.6) | 1 | 0.145 | 0.348 | 0.145 | 1 | 0.0513 |
Table 5.
The total scores for the eight villages for C1 and C2.
| Village | C1 (Degree of Damage) | C2 (Difficulty of Approaching a Disaster Area) |
|---|---|---|
| Jiutan | 1.3138 | 1.9708 |
| Dazhu | 1.7518 | 1.0218 |
| Tuku | 1.0948 | 1.7518 |
| Qili | 0.6569 | 1.2408 |
| Shuyuan | 0.6204 | 0.6569 |
| Gumu | 0.5255 | 1.3138 |
| Huyuan | 0.6569 | 0.5036 |
| Sunchong | 0.8029 | 0.5036 |
Table 6.
The distributive normalization matrix.
| Village | C1 | C2 | C3 | C4 |
|---|---|---|---|---|
| Jiutan | 0.3219 | 0.2420 | 0.0078 | 0.0039 |
| Dazhu | 0.4292 | 0.1255 | 0.0074 | 0.0037 |
| Tuku | 0.2682 | 0.2151 | 0.0078 | 0.0043 |
| Qili | 0.1609 | 0.1524 | 0.0076 | 0.0039 |
| Shuyuan | 0.1520 | 0.0806 | 0.0076 | 0.0013 |
| Gumu | 0.1287 | 0.1613 | 0.0077 | 0.0020 |
| Huyuan | 0.1609 | 0.0618 | 0.0075 | 0.0026 |
| Sunchong | 0.1967 | 0.0618 | 0.0077 | 0.0035 |
Table 7.
The weighted normalization matrix.
| Village | C1 | C2 | C3 | C4 |
|---|---|---|---|---|
| Jiutan | 0.1465 | 0.0291 | 0.0029 | 0.0002 |
| Dazhu | 0.1954 | 0.0150 | 0.0027 | 0.0001 |
| Tuku | 0.1221 | 0.0258 | 0.0029 | 0.0002 |
| Qili | 0.0732 | 0.0183 | 0.0028 | 0.0002 |
| Shuyuan | 0.0692 | 0.0097 | 0.0028 | 0.0001 |
| Gumu | 0.0586 | 0.0194 | 0.0029 | 0.0001 |
| Huyuan | 0.0732 | 0.0074 | 0.0028 | 0.0001 |
| Sunchong | 0.0895 | 0.0074 | 0.0028 | 0.0002 |
Table 8.
The positive ideal solution (PIS)s and the negative ideal solution (NIS)s.
| Ideal Solution | C1 | C2 | C3 | C4 |
|---|---|---|---|---|
| PIS | 0.1954 | 0.0291 | 0.0029 | 0.0002 (=0.000221) |
| NIS | 0.0586 | 0.0074 | 0.0027 | 0.0001 (=0.000071) |
Table 9.
The RCC (relative closeness coefficient) of the eight towns.
| Village | RCC (Relative Closeness Coefficient) |
|---|---|
| Jiutan | 0.7746 |
| Dazhu | 0.9896 |
| Tuku | 0.4483 |
| Qili | 0.0216 |
| Shuyuan | 0.0071 |
| Gumu | 0.0075 |
| Huyuan | 0.0137 |
| Sunchong | 0.0757 |
© 2018 by the authors. Licensee MDPI, Basel, Switzerland. This article is an open access article distributed under the terms and conditions of the Creative Commons Attribution (CC BY) license (http://creativecommons.org/licenses/by/4.0/).
Share and Cite
MDPI and ACS Style
He, Y.; Jung, H. A Voting TOPSIS Approach for Determining the Priorities of Areas Damaged in Disasters. Sustainability 2018, 10, 1607. https://doi.org/10.3390/su10051607
AMA Style
He Y, Jung H. A Voting TOPSIS Approach for Determining the Priorities of Areas Damaged in Disasters. Sustainability. 2018; 10(5):1607. https://doi.org/10.3390/su10051607
Chicago/Turabian StyleHe, Yanjin, and Hosang Jung. 2018. "A Voting TOPSIS Approach for Determining the Priorities of Areas Damaged in Disasters" Sustainability 10, no. 5: 1607. https://doi.org/10.3390/su10051607
Note that from the first issue of 2016, this journal uses article numbers instead of page numbers. See further details here.