The Effects of an Energy Use Paradigm Shift on Carbon Emissions: A Simulation Study


1
Department of Land Management, Zhejiang University, Hangzhou 310058, China
2
Center for International Earth Science Information Network (CIESIN), Columbia University, Palisades, NY 10964, USA
3
School of Construction Management and Real Estate, Chongqing University, Chongqing 400044, China
4
School of Civil Engineering and Built Environment, Queensland University of Technology (QUT), Brisbane 4000, Australia
*
Author to whom correspondence should be addressed.
Sustainability 2018, 10(5), 1639; https://doi.org/10.3390/su10051639
Submission received: 13 April 2018
/
Revised: 6 May 2018
/
Accepted: 17 May 2018
/
Published: 19 May 2018
(This article belongs to the Special Issue International Perspectives on Sustainable Energy Transition)
Abstract
:Carbon dioxide emissions in developing countries are closely tied to their economy and play a crucial role in the world’s future emissions. In this paper, we put forward an alternative energy use paradigm shift of low-carbon emissions from operational, governance, institutional, and cultural viewpoints (OGIC). An urbanization factor is introduced into the Kaya identity, and three simulations are conducted to forecast the carbon footprint and to explore the effects of the energy use paradigm shift policy. The simulation results show that, in the context of the energy use paradigm shift, the years 2015 and 2024 are the two inflection points that separate the carbon footprint into three periods of extensive consumption (2000–2015), early energy transition (2016–2023), and late energy transition (2024–2030). Overall, the peak carbon emission value is forecasted to appear during the third stage. The findings are expected to demonstrate the effects of the energy use paradigm shift on carbon emissions and assist policy makers formulate a scientific policy framework for low carbon development.
1. Introduction
Carbon emissions, also known as a key component of greenhouse gas emissions, are considered to be the main cause of global climate change and seriously threaten the sustainable development of society [1,2,3]. Industrialization is often accused of having such an adverse effect as releasing large amounts of carbon dioxide and generating serious global environmental pollution, which seriously affect normal social production activities and human life. At present, the carbon emissions caused by the consumption of natural resources and energy has reached an extent not experienced in the past. The climate change that takes place due to this concentration of carbon emissions is largely irreversible [4,5]. Carbon emissions are not only a pollution that triggers the greenhouse effect and brings about an ecological crisis, but also a development right that is related to a country’s industrialization and urbanization [6]. Rapid shift to a green growth paradigm turns to be a vital determinant of the long-term economic growth [7]. As a result, many international treaties and national policies have been promulgated to deal with carbon emissions and slow climate change. The earliest international treaties date back to the 1992 United Nations Framework Convention on Climate Change. This treated developed and developing countries differently in terms of their obligations and procedures to carry out the commitments involved. However, it was not legally binding, as it imposed neither specific obligations nor implementation mechanisms on the individual contracting parties. The Kyoto Protocol emerged soon after in 1997, requiring more than 30 developed and economic transitional countries to reduce their greenhouse gases by 5.2% by 2010 relative to 1990. The first commitment period of the Protocol expired in 2012, but it failed to some extent in the years before the expiration. Most recently, in December 2015, 195 countries met in Paris to adopt a new global agreement on climate change—the Paris Agreement, which was the first sustained, effective, and legally binding agreement in history to be adopted by all parties. Since then, global climate governance has moved to a new stage.
At the same time, numerous academic studies of carbon emissions were also conducted. Some focus on demonstrating whether the relationship between environmental degradation and income conforms to environmental Kuznets curve (EKC) theory [8,9,10,11,12]. Specifically, the EKC theory hypothesizes that there is an inverted U-shape relationship between environment change and economic development. Ibrahim and Law [13] examined the mitigating effect of social capital on EKC for carbon emissions using data for 69 developed and developing countries and confirmed the existence of EKC. By applying unit root tests and the VECM Granger causality approach, Shahbaz, et al. [14] also validated the presence of EKC with economic data for Turkey. Jalil and Mahmud [9] examined the long-run relationship between carbon emissions and income in China, finding a quadratic relationship between income and CO2 emissions over the sample period, supporting an EKC relationship; whereas, Stern, et al. [15] commented that most EKC estimates were dependent on the incorrect assumption that world per capita income was normally distributed. There has been insufficient evidence to date to show that countries follow a common inverted U-shaped pathway as their income rises [16].
Other research has specialized in the prediction of future carbon emissions. Most adopt decomposition methods. Zhang and Zhou [17], for instance, established a cointegration model and state space model to support the long-term equilibrium relationship between urbanization level and carbon emissions; while Lin and Liu [18] applied this relationship to further forecast China’s carbon emissions growth through the Kaya identity. Wu, Shen, Zhang, Skitmore and Lu [1] present U-Kaya, a modified version of the Kaya Identity formula, in forecasting China’s likely carbon emissions by 2020. The majority of these studies focus on the relationship between income and carbon emissions or emission forecasts. Comparative studies of China’s energy policy and carbon footprint are much fewer. However, such empirical studies are important, as they can provide a scientific direction for policy makers to obtain social sustainable development.
China passed the United States in 2011 as the world’s largest CO2 emitter. In the face of the large demand for energy, a low-carbon pathway should become the key policy priority in China [19,20,21]. Urbanization and industrialization often make it difficult to reduce carbon emissions effectively without scientific policy guidance. In developed cities, a higher density brought about by population agglomeration has placed an excessive burden on the local environment’s carbon absorption capacity [22,23].Therefore, in this paper, we extend the Kaya identity with a new factor of “urbanization rate”, an element closely related to energy consumption emissions in developing countries, to make a carbon footprint forecast with the guidance of an established energy use paradigm shift. Data are collected and Monte Carlo simulation is adopted to forecast the country’s carbon emissions with and without the guidance of an established energy policy.
The remainder of this paper is organized as follows. Section 2 presents the research method used in this paper. An alternative energy use paradigm shift of carbon emissions in terms of levels of operation, governance, institution and culture is put forward in Section 3, while Section 4 describes a case study with three simulations to predict the carbon emissions values in China. The final section contains some concluding remarks.
2. Research Method and Data
Three simulations were designed to predict the amount of carbon emissions in 2030 by regression analysis, Kaya Identity and Monte-Carlo Simulation. The first simulation is a simple regression with carbon emission data from previous years. In the second simulation, the parameter setting is based on the existing energy use pattern. The third simulation is designed to forecast the carbon emissions in the context of the energy use paradigm shift.
2.1. Kaya Identity and Model Refinement
The Kaya identity was first proposed by Japanese scholar, Yoichi Kaya, in a seminar held by the United Nations Government Climate Change Committee in 1989. In this equation, carbon dioxide emissions are broken down into four human production and life relating factors, namely the energy carbon emissions coefficient (C/E), energy intensity (E/GDP) (gross domestic product), per capita GDP (GDP/P), and population [24]. The mathematical expression is:
where C represents the amount of carbon dioxide emissions, E is total primary energy consumption, GDP is gross domestic product, and P is the total population. Simple to understand, the C/E refers to the amount of carbon dioxide released from per unit of primary energy consumption, and E/GDP implies how much energy is consumed to realize one unit of GDP.
Until the now, Kaya identity has been adopted in a number of carbon emission studies [25,26,27]. For an industrial society, carbon emissions present a major threat to the sustainability and viability of its economic system. No matter which country or region is involved, it is unlikely that agriculture alone will make much progress in the economy in the face of the wide range of population growth and economic agglomeration [28]. Thus, in order to meet people’s higher standard of living and promote local prosperity, energy-intensive industries, typically a result of industrialization, induce mass carbon emissions and therefore receive the most attention. The energy consumption structure, together with urban and rural residents’ life styles in the different stages of urbanization, will influence carbon emissions too [29,30]. A new factor—“urbanization”—is therefore introduced into the Kaya identity to improve the efficiency of per capita GDP as:
where the new element GDPu/Pu is per capita urban GDP, equal to urban GDP divided by the urban population. Similarly, GDPr/Pr is per capita rural GDP and U is the urbanization rate.
2.2. Monte Carlo Simulation
Monte Carlo simulation is a method of studying distribution characteristics by setting up a random process to repeatedly generate a time series and calculate parameter estimates and statistics. It is a widely used technique in the probabilistic analysis of sophisticated systems [31]. Future carbon emissions are hard to forecast because they are a function of inherently unpredictable socio-economic activities [32,33,34]. Monte Carlo simulation is adopted in the forecasting process in an attempt to accommodate such uncertainty. When the object is probabilistic, a statistic can be calculated based on the sampling distribution generated by the method [35].
2.3.Data
The carbon dioxide emission (C) data of 2000–2015 analyzed in this study are obtained from the European Commission (http://edgar.jrc.ec.europe.eu/). The 2000–2015 primary energy consumption (E), GDP, population (P), and urbanization (U) data are obtained from China Statistical Yearbook 2001–2016.
3. Alternative Energy Use Paradigm Shift
The present energy use pattern in China is still dominated by the traditional approach. As is well known, China is in an early stage of industrialization with an irrational energy structure, and relatively low energy technology equipment and management, which unavoidably leads to a higher energy consumption per unit GDP than the world average [36]. There exists a significant heterogeneous low consumption distribution in the southeast and the northwest, while it is high in the central and northern regions [37]. Coal and oil account for more than 80% of total energy consumption (see Figure 1).
In 2015, the total energy consumption of China reached 4300 million tons coal equivalent (Mtce), of which coal consumed 2752 Mtce and oil consumed 774 Mtce, accounting for 64% and 18%, respectively. The sum of all clean energy, such as natural gas, electric power and other energy sources, only equals 774 Mtce—a mere 18% of the total. Coal is the leading source of carbon emissions, occupying a much higher proportion (more than twice the world average) in China while natural gas, part and parcel of clean energy, is less than a quarter of the world average. In short, actively developing renewable energy and new energy, and optimizing the energy consumption structure in China, are important aspects in the control of greenhouse gas emissions in the future.
China’s carbon emissions reduction policy started from 2007, when the state council promulgated its National Climate Change Program, the first national response to climate change of any developing country. The policy proposes a diversified energy development, and renewable energy is defined as an important part of the national energy strategy. In line with the Paris Agreement, China claimed to have reached its carbon emissions peak as early as possible and is committed to a 60–65% decreased energy consumption per unit GDP by 2030 relative to 2005 (Source: China Energy Outlook 2030 Report). The National Energy Development Strategy Action Plan (2014–2020) [38] issued by the State Council states that China’s non-fossil fuels, natural gas, and coal will account for 15%, 10%, and 62%, respectively, of total primary energy consumption. The China Energy Outlook 2030 Report [39] even claimed that domestic primary energy consumption would continue to be optimized in response to the pressure of reduced carbon emissions as well as environment constraints. The proportion of coal consumption will decrease to 60% with a 17% share of non-fossil energy by 2020. The proportion of coal consumption in 2030 will be further reduced to 49%, while non-fossil energy is planned to be 22% at that time.
Although it is important to pay attention to the optimization of energy structure and international cooperation, the exploration and application of low-carbon economic development is still a challenging task. Continuing the existing energy use pattern will not achieve the proposed emission reduction targets, and the policies that have been implemented already mostly advocate low-carbon development. The absence of a concrete policy framework needs urgent attention. In consideration of this, we focus on four levels: operations, governance, institution, and culture (OGIC) to specify an alternative energy use paradigm shift and realize the emission reduction targets proposed internationally and domestically (see Figure 2).
3.1. Operations
At the operational level, the energy use paradigm shift consists of policies orientated in relation to the energy carbon emissions coefficient, energy intensity, and urbanization.
3.1.1. Energy Carbon Emissions Coefficient
The energy carbon emissions coefficient (C/E) refers to the amount of carbon dioxide released per unit of primary energy consumption. China has been working decisively towards a market economy since 1992. In the ensuing year, many industrial parks sprang up, inducing a large proportion of coal consumption to support the extensive growth. But now, we have entered a new era that advocates a much lower coefficient to meet the requirements of sustainability. Enterprises need to be encouraged to tap into new energy markets and reduce their share of coal consumption. Although it may well be unrealistic to attempt to reduce the proportion of coal by a big margin in the short term, there are still some opportunities for small-scale reductions in the proportions of both coal and oil.
3.1.2. Energy Intensity
Endeavors to reduce energy intensity (E/GDP) need to pay attention to the ecological transformation of industrial energy consumption and the life cycle theory of building energy consumption. Compared with the advanced techniques used in developed countries, building material production consumption is enormous. In China, for example, there is 30–40% more domestic energy consumption than the general level abroad. To reduce industrial energy consumption, technical improvements and life-cycle energy conservation are of great importance, where life cycle refers to the whole process of production [40,41]. Building life cycle energy consumption not only takes consumption during building operation into account, but also considers the preparation stage and construction phase.
3.1.3. Urbanization
Life and production are two major supports for the paradigm shift. For life, the energy use paradigm shift requires energy saving in daily life, while for production, the energy use paradigm shift means the evolution of industrial structure. Urbanization has brought more floating population into the cities, many of which work for non-agricultural industries, especially secondary industries, and thus promotes the manufacturing boom. However, there is a long-term cointegration relationship between secondary industries and energy consumption [42,43]. The most effective way to alleviate the pressure of energy demand is by promoting industrial structure evolution, accelerating modern service industry development to reduce the over-reliance of the national economy on industrial growth and change the present mode of extensive growth.
3.2. Governance
Governance in general is a set of management systems in relation to incentives and constraints. As for industrial production, the main interested parties are the government, the National People’s Congress (NPC) and enterprises (or individuals) (see Figure 3). Enterprises are the center of micro-economic action. A low-carbon economy cannot be separated from the market and neither can low-carbon enterprises. The transformation process involves externalities of such public goods as resources and the environment, which results in assumptions concerning the price, output, cost, and entry barriers cannot meet the market requirements and so it is difficult for the market to effectively allocate resources and hence resulting in eventual market failure. Therefore, the paradigm shift must be government-orientated in China at least. The state formulates long-term planning to strengthen its guidance for enterprises. Specific policies could be creating energy-related standards and incentive measures to encourage enterprises to join the low-carbon development mode. In addition, NPC, a crucial participant in the system, should play a role in supervision by the government. The energy use paradigm shift binding force is weak in China and the local government is insufficiently motivated to force the issue. A monitoring mechanism is therefore necessary for the integrity of the governance system of the low-carbon energy use paradigm shift.
3.3. Institution
Why does coal occupy such a huge proportion in energy consumption in China? Firstly, coal is stored in large quantities. Moreover, it is part of related industrial chains, including petrochemical, heavy industry, steel mills, and heating, which depend exclusively on coal. The most difficult and important aspect of coal consumption is “military restructuring”, i.e., reducing coal consumption through the control of industries and regions. For the former, enterprises meet the industry’s coal limit target by technological transition while, for the latter, the local government imposes a wealth accumulation-led tax instead of the usual production-led as the main source of local revenue. Industrial parks can provide considerable revenue for cities, which is why the local government relentlessly leases industrial land at a very low price. However, coal consumption rises as industrial land spreads. If the old tax mode could be disbanded, the development zone’s contribution to the economy would decline, which, in turn, would benefit the development of a low-carbon economy.
3.4. Culture
During periods of industrial civilization, the outburst of productivity triggered by science provided a historic jump for humankind and was a time when people felt they could conquer nature. The situation now is different, with the destruction of forests, environmental pollution, and desertification all threating human survival. In aiming for sustainable development, it is important to recognize that we are an integral part of nature and the need for harmonization instead of conquest.
The establishment of an environmental justice value system is particularly required for energy use paradigm shift. It is vital that future urban growth pursues social welfare other than economic progress. As with optimizing the urban and rural resources allocation system, it is important to coordinate social contradictions and ease urban-rural conflict [44,45] to steadily promote the energy use paradigm shift to low-carbon emissions.
4. Carbon Emissions Forecast: Three Simulations
China’s carbon emissions play a crucial role in the world. In the context of the existing energy use pattern and energy use paradigm shift, we take China as a research focus to forecast its exact carbon emissions in 2030 based on the combination of Kaya identity and Monte Carlo simulation.
4.1. Reference Simulation
The reference simulation denotes the forecast result through a simple linear fit with carbon emissions data from 2000 to 2015, with fitting function:
When x = 2030, for example, China’s 2030 carbon emissions are predicted to be 19,422 MMtons.
However, a single variable linear regression is not able to provide a precise predicted value, and is therefore only taken to be a reference value.
4.2. Comparative Simulations
Two additional and different sets of comparative simulations are used in order to show the influence of the energy use paradigm shift more intuitively. Comparative simulation I focuses on the values of the coefficients in an environment with no paradigm shift, and simulation II considers the impact of the energy use paradigm shift on the parameter values. Specifically, energy policy has less influence on such parameters as per capita GDP, urbanization, and population. The values of these parameters are therefore the same in both simulations, while the values of the carbon emissions coefficient and energy consumption intensity are different.
4.2.1. Energy Carbon Emissions Coefficient (C/E)
The alteration or amelioration of a local energy structure is reflected in the C/E variation. As mentioned above, the total energy consumption in China in 2015 was 4300 Mtce, of which coal, oil, natural gas, and other primary energy sources accounted for 64%, 18%, 6%, and 12%, respectively, with 10,541 MM tons of carbon emissions. The C/E in 2015 is therefore 2.46.
Under the guidance of the energy use paradigm shift, the future Chinese energy structure can have a clear optimizing tendency, in which the contribution of coal consumption to the total amount of energy use continuously decreases, while natural gas and other primary energy sources increases. Combined with the reduction targets proposed in the official documents [38,39],the proportion of coal consumption in 2030 will be further reduced to 49%, while non-fossil energy is planned to be 22% at that time. Oil consumption is expected to have an estimated appropriate value of 17% and natural gas is 10%.
Figure 4 summarizes the C/E value of previous years and the predicted C/E value of the coming years. There are no obvious laws that describe the trend of previous C/E values. All that can be found is that the value is generally stable at 2.45 ± 0.1; thus we assign 2.45 to be the estimated value for the year after 2015 in comparative simulation I. In comparative simulation II, because of the implementation of the paradigm shift, the local government imposes a wealth accumulation-led tax instead of the usual production-led as the main source of local revenue and pursues social welfare other than economic progress, energy saving has become a binding indicator in industry; the future coefficient therefore has a gradual downward trend. Lin and Liu [18] estimate this as an average annual growth rate of −0.4% during 2016–2020. This being the case, the coefficient in 2020 would be 2.39. In view of the more stable energy structure, and growing difficulties in making reductions in the later period of development, we adopt −0.2% as the new growth rate from 2021 to 2030. This means that the C/E in 2030 will be 2.34.
4.2.2. Energy Intensity (E/GDP)
E/GDP mainly reflects the level of energy efficiency. Excessive consumption of coal inhibits energy efficiency improvement. In addition, the tertiary industries can play a greater role in promoting efficiency than the secondary industries. Studies have shown that industrial structure adjustment with the policy of back three binary (suppress the secondary industries and develop the tertiary industries) will improve energy efficiency to some extent [46].
As mentioned above, China strived to reach its carbon emissions peak as early as possible and is committed to decreasing E/GDP by 60–65% by 2030 relative to 2005. Energy consumption in 2005 in China was 2614 Mtce with a corresponding GDP of CNY18.49 trillion, and thus E/GDP should be 1.41 thousand tons coal equivalent/CNY billion (Ttce/B). If the share in reduction is 60%, the value of energy consumption in 2030 will be 0.564 Ttce/B, or 0.494 Ttce/B if 65%. Accordingly, we choose the median of 0.53 Ttce/B as the intensity value of energy consumption in 2030.
Based on the data of the total energy consumption and gross national product from the past year, the E/GDP is calculated and the fitted curve obtained. To guarantee the accuracy of the forecasts, we disregard the data before 2009 for they show a significantly different distribution from those after 2009. Combining the historic data from 2009–2015 and estimator of 2030, gives:
The linear fit shows it will reach the lowest value in 2019 (Figure 5). In the absence of the energy use paradigm shift, it will not further decline when energy consumption intensity reaches the minimum value. Instead, it is most likely to maintain its lowest level or start to increase. In this way, the energy consumption intensity of comparative simulation I is taken as 0.57 for the coming years. For comparative simulation II, with the implementation of the energy use paradigm shift, energy-related standards and incentive measures will be created to encourage enterprises to join the low-carbon development mode and thus, the value of E/GDP is expected to decline further. We therefore assume this parameter will have a constant growth rate from 0.58 Ttce/B in 2020 to 0.53 Ttce/B in 2030.
4.2.3. Urban and Rural Per Capita GDP
Urban per capita GDP represents the gross domestic product produced by per unit of urban population. There are no official figures of the exact number of urban or rural per capita GDP. Here, we utilize the ratio that takes account of “urban per capita disposable income*urban population” and “rural per capita disposable income*rural population” to embody the value of GDPu/GDPr. Finally, we obtain the urban/rural per capita GDP indirectly by making use of the urbanization rate and population.
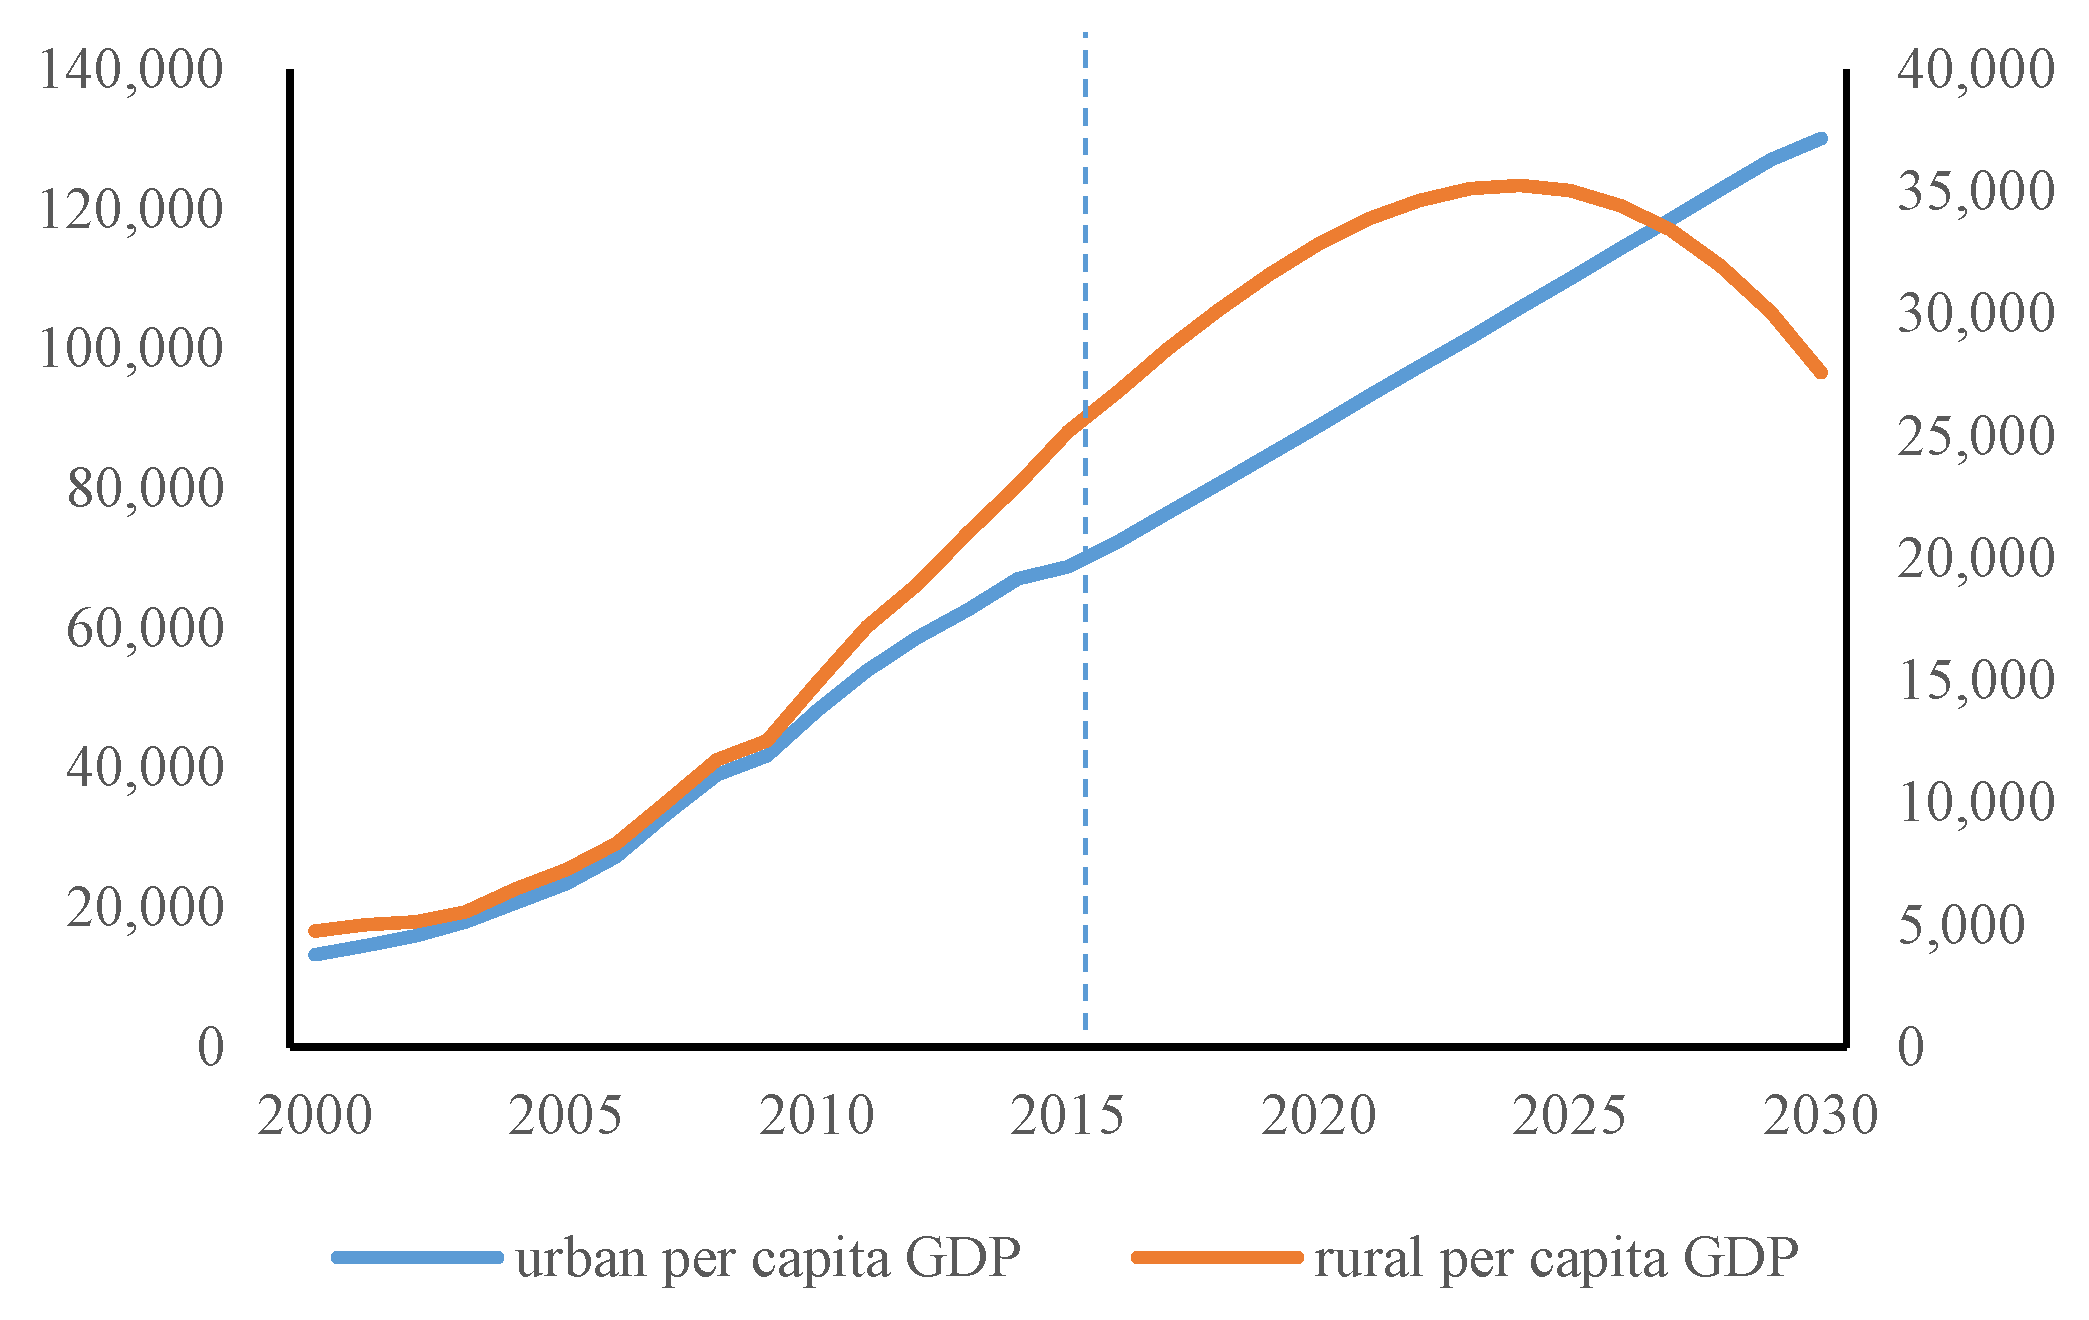
In the wake of urbanization, the urban and rural areas appear to be closer than the previous era. The economic systems in both areas have undergone profound changes and both are beginning to experience some competition. The statistics reveal a substantial economic gap between the urban and rural areas since 2000. The average urban per capita disposable income in 2000 was CNY 6280 and CNY 2253 for urban and rural residents, respectively. Fifteen years later, this had changed to CNY 31,195 and CNY 11,422, respectively, a ratio of 2.73:1. Supposing that y = (urban per capita disposable income*urban population)/(rural per capita disposable income*rural population), and then the values of y in 2000 and 2015 are 1.58 and 3.49, respectively. This seems to run counter to the “new urbanization policy” proposed in China, which aims to promote a “people-oriented” urbanization, facilitate the fusion development of rural primary, second and tertiary industries and finally narrow the gap between urban and rural development. Nevertheless, it seems more likely that the urbanization rate will reach 70%, as increasing numbers of people move to the cities to create wealth. Assuming that the efficiency of the urban population in creating GDP is 50% higher than that of rural population, then in 2030 we can obtain:
There are many ways of predicting GDP. Considering the variability of the economic environment, three assumptions are adopted in doing this in this paper to predict GDP in 2030 China.
Assumption I: On the basis of the GDP data from 2000 to 2014, the fitted function is:
Setting x= 2030 gives the total predicted GDP in 2030 of CNY 120 trillion.
Assumption II: The US Department of Agriculture projects the GDP of the US in 2030 to be 24.8 trillion dollars, followed by China with 22.2 trillion dollars, or CNY149 trillion (US Projections for the 2030 World Economy Ranking, http://watchingamerica.com/WA/2015/04/28/us-projections-for-the-2030-world-economy-ranking/).
Assumption III: President Xijinping states that China’s annual growth rate should be no less than 6.5% from 2016–2020 and then to experience a slight decline to around 6.0%. By this criterion, China’s GDP in 2030 will be CNY 162 trillion (China sets GDP target at about 6.5%, omitting aim to go higher, https://www.livemint.com/Politics/GVRX1Uaoo7qSNPvnEFRj6M/China-sets-GDP-target-at-about-65-omitting-aim-to-go-high.html).
The results of three GDP predictions along with three different urban per capita GDP and rural per capita GDP are shown in Table 1. On the basis of these comparisons, we take the conservative approach and adopt the predictions of the US Department of Agriculture for further curve fitting. Inputting all the 2000 to 2015 data and the 2030 data produces two equations. One for urban per capita GDP:
and the other for rural per capita GDP:
Figure 6 summarizes the annual urban/rural per capita GDP results.
4.2.4. Urbanization
The urbanization rate is a measure of urban development conditions. Of course, a higher rate is not necessarily better. The rates in even the most developed countries are between 70–85% [47] because the state still needs primary industries to support the stable development of both the economy and society. The vast majority of studies agree that China will have reached a stable stage of urbanization by 2030 although the specific urbanization rates differ. For example, Nations [48] believes 70% of the population in China will be citizens by 2030. The China Development Research Foundation suggests that it will take China 20 years to deal with its semi-urbanization problem and raise the urbanization rate to 65% in 2030. Other studies also mainly concentrate at 65% with a fluctuation of no more than 5% [49,50,51].
Note that if a linear fit is applied to the urbanization rate dating from 2000 to 2015, the rate is 85.9%, which is absurd since the momentum of regional development is certain to reduce when the urbanization rate is over 70% [52]. So we disregard this regression result and assume the urbanization rate has a constant growth rate that finally reaches 70% in 2030. Figure 7 summarizes this annual urbanization rate.
4.2.5. Population
World population growth over the next 30 years is expected to mostly take place in Africa and India, which is projected to surpass China to become the world’s most populous country in 2028, and China’s urban population will increase by a further 310 million to reach a peak of approximately 1 billion in 2030 before gradually declining [48].
The linear fit result of the population based on the 2000 to 2015 data is 1.48 billion (R2 = 0.98) in 2030. However, China has now fully implemented its “two children policy”, which allows one couple to have two children from 2015 instead of the previous one-child policy. Qu, et al. [53] sampling survey of the fertility desire of women in China suggests that the population will reach a maximum in 2027 before entering a period of negative growth. The regression equation, therefore, can only estimate the population before the peak, namely 2016–2027. For the remaining period, we conservatively set 0.2% as the constant negative growth rate. Figure 8 summarizes the final results.
4.3. Monte Carlo Simulation
A fundamental requirement of a forecast process is to be robust, i.e., it is able to give a reasonably good output even if the inputs are a little inaccurate. To achieve this goal, we replace the single valued parameter with a probability distribution. Each parameter is defined as being normally distributed. The estimates of the variables proposed in above section are adopted as the mean of their distributions while the standard deviations are acquired from a comparison between data at an adjacent time (see Table 2a,b).
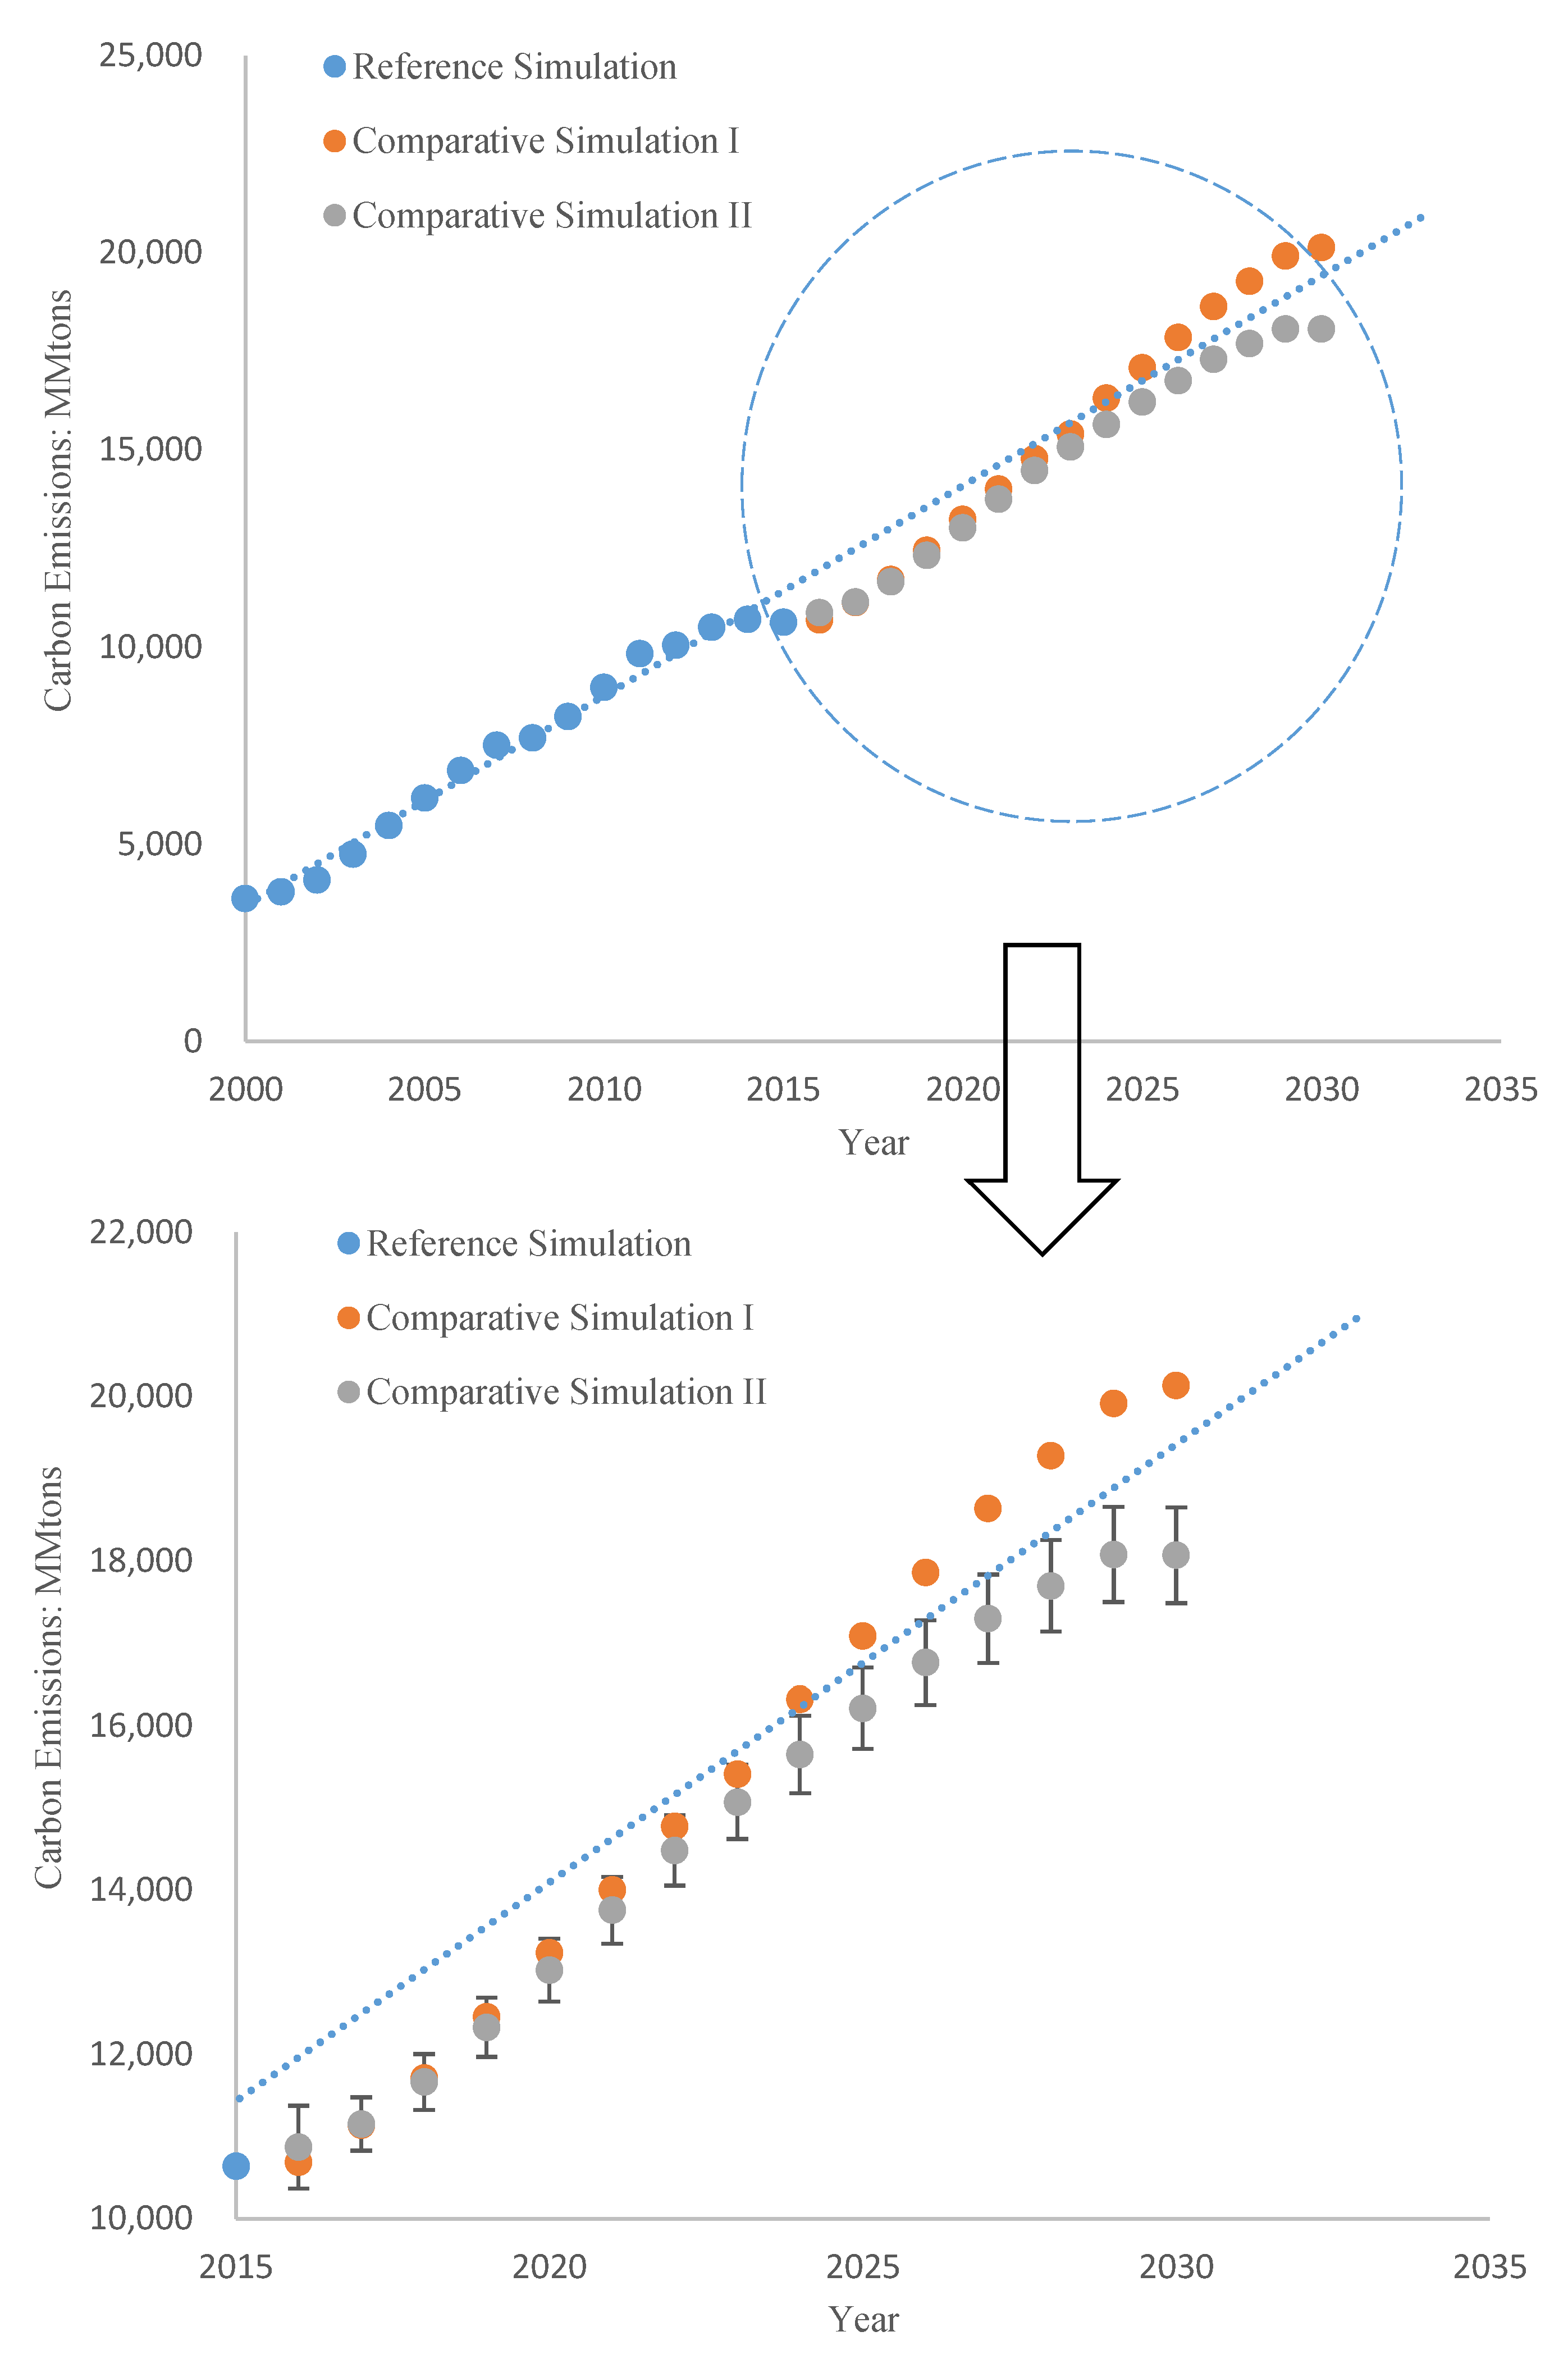
All the parameters are therefore substituted into the model. The number of simulation iterations is set at 100,000. The frequency for the year 2030 is presented in Figure 9a,b as an example. After collecting the statistics from all the research years, including the means and standard deviations, the final results are summarized in Figure 10, which shows two clear inflection points in the emissions in 2015 and 2024. The comparative simulations I and II predict 20,141 and 18,069 MMtons of carbon emissions in 2030–1500 MMtons less than the reference simulation estimate.
4.4. Results and Discussion
The reference simulation in the case study describes the extrapolation of a simple single linear fitted result of carbon emissions in 2030 that may not fully reflect future carbon emissions, which is affected by multi-factor changes such as the local energy structure, population and the economy. The economic and social development situation in the next 15 years is likely to be better than that of the past 15 years, so the reference estimate maybe the lowest possible value under the present extensive development mode. This means that if China still maintains its previous growth pattern and energy consumption structure, the carbon footprint in 2030 will certainly exceed 20,000 MMtons, nearly twice that of 2015 (10,642 MMtons).
There are significant differences between the carbon footprints predicted by the two comparative simulations. The gap begins in 2020, especially after 2024, and becomes more accentuated thereafter. If there is no energy use paradigm shift, the carbon emissions will reach 20,141 MMtons in 2030. However, with the energy use paradigm shift, the estimated value could reduce to 18,069 MMtons. In the comparative simulation II, 2015 and 2024 are two inflection points that separate the Chinese carbon footprint into three stages, namely an extensive consumption period (2000–2015), early energy transition period (2016–2023), and a late energy transition period (2024–2030). Economic development has consumed a large number of resources and energy in China in recent times, as manifested the 2000–2015 extensive mode, leading to a continuous increase in carbon emissions from 2000 [54,55]. Since 2015, industrial restructuring and intensive energy use began to progress steadily under an energy-saving background. A carbon trading market is planned to start in 2017. Energy use paradigm shift lags while the economy is still in a prosperity stage, and therefore carbon emissions maintain a relatively strong growth momentum until the end of the stage. As for the late energy use paradigm shift period after 2024, the energy transformation policy will be fully implemented and, at the same time, both the urbanization rate and population will reach a peak and remain stable [56]. In this situation, the growth rate of carbon emissions slows down. As can be seen from Figure 10, carbon emissions will reach a maximum around 2029 and then no longer increase significantly.
In short, it will take some time for the policy to achieve its effect after introduction; therefore, ensuring an improved realization of low carbon development requires accelerating the implementation of the energy use paradigm shift.
5. Conclusions
Urban growth in developing countries is often accompanied by an increase in carbon emissions. This paper proposes an alternative energy use paradigm shift. The Kaya identity and Monte Carlo simulation are the research methods. Three simulations are conducted for better understanding the effects of the energy use paradigm shift. The results show that the carbon footprint will decline drastically in 2030 with the guidance of the new energy paradigm. The peak carbon emissions value is forecasted to appear around 2029. The study has significant policy implications. The new energy use paradigm should provide a comprehensive improved approach for countries where booming economic indicators induced by the long-term blind pursuit of economic growth conceals such serious problems as wasted resources and increasing carbon emission.
However, the paper contains some uncertainties and limitations. Although the effect of policy on the forecast process is considered, only a simple linear/curve is used to forecast the mean value of each variable, and further work is needed to better model the variables. However, while it is hard to quantify the effect of the energy use paradigm shift on carbon emissions precisely, this paper provides the basis for future policy novelties in China and other similarly placed countries.
Author Contributions
Y.W. and J.L. conducted the model building and wrote the paper; L.S. contributed the comparison and discussion; M.S. provided suggestions and made revisions to the manuscript.
Acknowledgments
This research is co-funded by the National Natural Science Foundation (Project No: 71373231) and the Fundamental Research Funds for the Central Universities (No.2-2050205-17-182). The paper was also completed with support from the Center for International Earth Science Information Network (CIESIN), Columbia University, USA.
Conflicts of Interest
The authors declare no conflict of interest.
References
- Wu, Y.; Shen, J.; Zhang, X.; Skitmore, M.; Lu, W. The impact of urbanization on carbon emissions in developing countries: A Chinese study based on the U-Kaya method. J. Clean. Prod. 2016, 135, 589–603. [Google Scholar] [CrossRef]
- Wei, Y.-M.; Liu, L.-C.; Fan, Y.; Wu, G. The impact of lifestyle on energy use and CO2 emission: An empirical analysis of China’s residents. Energy Policy 2007, 35, 247–257. [Google Scholar] [CrossRef]
- Ahn, C.; Lee, S.; Peña-Mora, F.; Abourizk, S. Toward environmentally sustainable construction processes: The US and Canada’s perspective on energy consumption and GHG/CAP emissions. Sustainability 2010, 2, 354–370. [Google Scholar] [CrossRef]
- Solomon, S.; Plattner, G.-K.; Knutti, R.; Friedlingstein, P. Irreversible climate change due to carbon dioxide emissions. Proc. Natl. Acad. Sci. USA 2009, 106, 1704–1709. [Google Scholar] [CrossRef] [PubMed]
- Nordhaus, W. Critical assumptions in the Stern Review on climate change. Sci. 2007, 317, 1682. [Google Scholar] [CrossRef] [PubMed]
- Qiao, X.; He, Z. Understanding The Paris Agreement: A Double-layered Analysis Framework of Industry Transition and Carbon Emissions. China Rev. Political Econ. 2016, 7, 118–143. [Google Scholar]
- Li, J.; Wang, X. Energy and climate policy in China’s twelfth five-year plan: A paradigm shift. Energy Policy 2012, 41, 519–528. [Google Scholar] [CrossRef]
- Shahbaz, M.; Lean, H.H.; Shabbir, M.S. Environmental Kuznets Curve hypothesis in Pakistan: Cointegration and Granger causality. Renew. Sustain. Energy Rev. 2012, 16, 2947–2953. [Google Scholar] [CrossRef] [Green Version]
- Jalil, A.; Mahmud, S.F. Environment Kuznets curve for CO 2 emissions: A cointegration analysis for China. Energy Policy 2009, 37, 5167–5172. [Google Scholar] [CrossRef] [Green Version]
- Tevie, J.; Grimsrud, K.M.; Berrens, R.P. Testing the environmental Kuznets curve hypothesis for biodiversity risk in the US: A spatial econometric approach. Sustainability 2011, 3, 2182–2199. [Google Scholar] [CrossRef]
- Castiglione, C.; Infante, D.; Smirnova, J. Is there any evidence on the existence of an environmental taxation Kuznets curve? The case of European countries under their rule of law enforcement. Sustainability 2014, 6, 7242–7262. [Google Scholar] [CrossRef]
- Richmond, A.K.; Kaufmann, R.K. Is there a turning point in the relationship between income and energy use and/or carbon emissions? Ecol. Econ. 2006, 56, 176–189. [Google Scholar] [CrossRef]
- Ibrahim, M.H.; Law, S.H. Social capital and CO2 emission—Output relations: A panel analysis. Renew. Sustain. Energy Rev. 2014, 29, 528–534. [Google Scholar] [CrossRef]
- Shahbaz, M.; Ozturk, I.; Afza, T.; Ali, A. Revisiting the environmental Kuznets curve in a global economy. Renew. Sustain. Energy Rev. 2013, 25, 494–502. [Google Scholar] [CrossRef] [Green Version]
- Stern, D.I.; Common, M.S.; Barbier, E.B. Economic growth and environmental degradation: The environmental Kuznets curve and sustainable development. World Dev. 1996, 24, 1151–1160. [Google Scholar] [CrossRef]
- Stern, D.I. The Rise and Fall of the Environmental Kuznets Curve. World Dev. 2004, 32, 1419–1439. [Google Scholar] [CrossRef]
- Zhang, C.; Zhou, Q. Study on China’s social and economic development under the conditions of greenhouse gas emission reduction. Henan Sci. 2012, 30, 1549–1553. [Google Scholar]
- Lin, B.; Liu, X. China’s carbon dioxide emissions under the urbanization process: Influence factors and abatement policies. Econ. Res. J. 2010, 8, 66–78. [Google Scholar]
- Dhakal, S. Urban energy use and carbon emissions from cities in China and policy implications. Energy Policy 2009, 37, 4208–4219. [Google Scholar] [CrossRef]
- Yuan, J.; Kang, J.; Yu, C.; Hu, Z. Energy conservation and emissions reduction in China—Progress and prospective. Renew. Sustain. Energy Rev. 2011, 15, 4334–4347. [Google Scholar] [CrossRef]
- Cong, R. An optimization model for renewable energy generation and its application in China: A perspective of maximum utilization. Renew. Sustain. Energy Rev. 2013, 17, 94–103. [Google Scholar] [CrossRef]
- Martínez-Zarzoso, I.; Maruotti, A. The impact of urbanization on CO2 emissions: Evidence from developing countries. Ecol. Econ. 2011, 70, 1344–1353. [Google Scholar] [CrossRef]
- Dhakal, S. GHG emissions from urbanization and opportunities for urban carbon mitigation. Curr. Opin. Environ. Sustain. 2010, 2, 277–283. [Google Scholar] [CrossRef]
- Kaya, Y. Impact of Carbon Dioxide Emission Control on GNP Growth: Interpretation of Proposed Scenarios; Intergovernmental Panel on Climate Change/Response Strategies Working Group, May 1990. [Google Scholar]
- O’Mahony, T. Decomposition of Ireland’s carbon emissions from 1990 to 2010: An extended Kaya identity. Energy Policy 2013, 59, 573–581. [Google Scholar] [CrossRef]
- Duro, J.A.; Padilla, E. International inequalities in per capita CO2 emissions: A decomposition methodology by Kaya factors. Energy Econ. 2006, 28, 170–187. [Google Scholar] [CrossRef]
- Wang, C.; Wang, F.; Zhang, H.; Ye, Y.; Wu, Q.; Su, Y. Carbon emissions decomposition and environmental mitigation policy recommendations for sustainable development in Shandong province. Sustainability 2014, 6, 8164–8179. [Google Scholar] [CrossRef]
- Allen, R.C. The British Industrial Revolution in Global Perspective; Cambridge University Press: Cambridge, UK, 2009; Volume 1. [Google Scholar]
- Glaeser, E.L.; Kahn, M.E. The greenness of cities: Carbon dioxide emissions and urban development. J. Urban Econ. 2010, 67, 404–418. [Google Scholar] [CrossRef]
- McDonald, R.I.; Green, P.; Balk, D.; Fekete, B.M.; Revenga, C.; Todd, M.; Montgomery, M. Urban growth, climate change, and freshwater availability. Proc. Natl. Acad. Sci. USA 2011, 108, 6312–6317. [Google Scholar] [CrossRef] [PubMed]
- Mahadevan, S. Monte Carlo Simulation; Mechanical Engineering: Basel, Switzerland; Marcel Dekker: Basel, Switzerland, 1997; pp. 123–146. [Google Scholar]
- New, M.; Hulme, M. Representing uncertainty in climate change scenarios: A Monte-Carlo approach. Integr. Assess. 2000, 1, 203–213. [Google Scholar] [CrossRef]
- Lo, S.-C.; Ma, H.-W.; Lo, S.-L. Quantifying and reducing uncertainty in life cycle assessment using the Bayesian Monte Carlo method. Sci. Total Environ. 2005, 340, 23–33. [Google Scholar] [CrossRef] [PubMed]
- Pozzi, S.A.; Padovani, E.; Marseguerra, M. MCNP-PoliMi: A Monte-Carlo code for correlation measurements. Nucl. Instrum. Methods Phys. Res. Sect. A 2003, 513, 550–558. [Google Scholar] [CrossRef]
- Sham, P.; Curtis, D. Monte Carlo tests for associations between disease and alleles at highly polymorphic loci. Ann. Hum. Genet. 1995, 59, 97–105. [Google Scholar] [CrossRef] [PubMed]
- Zhang, K. China’s role, challenges and strategy for the low carbon world. China Popul. Resour. Environ. 2008, 18, 1–7. [Google Scholar]
- Zou, X.; Chen, S.; Ning, M.; Liu, Y. An empirical research on the influence factor of carbon emission in Chinese provincial regions. Ecol. Econ. 2009, 3, 34–37. [Google Scholar]
- Council, T.S. National Energy Development Strategy Action Plan (2014-2020); The State Council: Beijing, China, 2014. [Google Scholar]
- Council, T.S. China Energy Outlook 2030 Report; The State Council: Beijing, China, 2014. [Google Scholar]
- Klöpffer, W. Life cycle assessment. Environ. Sci. Pollut. Res. 1997, 4, 223–228. [Google Scholar] [CrossRef] [PubMed]
- Wang, M.Q.; Han, J.; Haq, Z.; Tyner, W.E.; Wu, M.; Elgowainy, A. Energy and greenhouse gas emission effects of corn and cellulosic ethanol with technology improvements and land use changes. Biomass Bioenergy 2011, 35, 1885–1896. [Google Scholar] [CrossRef]
- Sari, R.; Ewing, B.T.; Soytas, U. The relationship between disaggregate energy consumption and industrial production in the United States: An ARDL approach. Energy Econ. 2008, 30, 2302–2313. [Google Scholar] [CrossRef]
- Lee, C.-C. Energy consumption and GDP in developing countries: A cointegrated panel analysis. Energy Econ. 2005, 27, 415–427. [Google Scholar] [CrossRef]
- Ann, T.; Wu, Y.; Shen, J.; Zhang, X.; Shen, L.; Shan, L. The key causes of urban-rural conflict in China. Habitat Int. 2015, 49, 65–73. [Google Scholar]
- Shan, L.; Ann, T.; Wu, Y. Strategies for risk management in urban–rural conflict: Two case studies of land acquisition in urbanising China. Habitat Int. 2017, 59, 90–100. [Google Scholar] [CrossRef]
- Zhang, W. Energy Efficiency, Industrial Structure and Regional Economic Development Gap in China. J. Shanxi Financ. Econ. Univ. 2010, 10, 28–34. [Google Scholar]
- Bank, W. World Development Report 2010: Development and Climate Change; The World Bank: Washington, DC, USA, 2010. [Google Scholar]
- Nations, U. Department of Economic and Social Affairs. Population Division. World Population Ageing 2013; UN: New York, NY, USA, 2013. [Google Scholar]
- Shen, L.; Cheng, S.; Gunson, A.J.; Wan, H. Urbanization, sustainability and the utilization of energy and mineral resources in China. Cities 2005, 22, 287–302. [Google Scholar] [CrossRef]
- Li, J.; Dong, X.; Shangguan, J.; Hook, M. Forecasting the growth of China’s natural gas consumption. Energy 2011, 36, 1380–1385. [Google Scholar] [CrossRef]
- Yu, B.; Lu, C. Change of cultivated land and its implications on food security in China. Chin. Geogr. Sci. 2006, 16, 299–305. [Google Scholar] [CrossRef]
- Northam, R.M. Urban Geography; John Wiley & Sons: Rogers Hoboken, NJ, USA, 1979. [Google Scholar]
- Qu, Z.; Zhang, X.; Jin, Y. Demographic consequences of an immediate transition to a universal two-child policy. Popul. Res. 2014, 38, 3–17. [Google Scholar]
- Zhang, Y.-J.; Da, Y.-B. The decomposition of energy-related carbon emission and its decoupling with economic growth in China. Renew. Sustain. Energy Rev. 2015, 41, 1255–1266. [Google Scholar] [CrossRef]
- Chang, C.-C. A multivariate causality test of carbon dioxide emissions, energy consumption and economic growth in China. Appl. Energy 2010, 87, 3533–3537. [Google Scholar] [CrossRef]
- Deng, W.; Hu, S. Non-linear combined prediction model of medium and long-term civil vehicle population of China. J. Transp. Syst. Eng. Inf. Technol. 2010, 10, 103–108. [Google Scholar] [CrossRef]
Figure 1.
2000–2015 energy consumption in China. (Source: China Statistical Yearbook 2016).

Figure 2.
Operational, governance, institutional, and cultural (OGIC) analysis of the energy use paradigm shift.
Figure 2.
Operational, governance, institutional, and cultural (OGIC) analysis of the energy use paradigm shift.

Figure 3.
Incentive system for energy transformation.

Figure 4.
Estimates of the energy carbon emissions coefficients for 2000–2030. (* Predicted energy carbon emissions coefficient (C/E) values after 2015).
Figure 4.
Estimates of the energy carbon emissions coefficients for 2000–2030. (* Predicted energy carbon emissions coefficient (C/E) values after 2015).

Figure 5.
Estimates of energy intensity for 2000–2030 (* Predicted energy intensity (E/GDP) (gross domestic product) values after 2015).
Figure 5.
Estimates of energy intensity for 2000–2030 (* Predicted energy intensity (E/GDP) (gross domestic product) values after 2015).

Figure 6.
Estimates of urban per capita GDP and rural per capita GDP for 2000–2030 (* Predicted urban per capita GDP and rural per capita GDP after 2015).
Figure 6.
Estimates of urban per capita GDP and rural per capita GDP for 2000–2030 (* Predicted urban per capita GDP and rural per capita GDP after 2015).

Figure 7.
Estimates of urbanization for 2000–2030 (* Predicted urbanization rate after 2015).

Figure 8.
Estimates of population for 2000–2030 (* Predicted population after 2015).

Figure 9.
(a) Carbon emission simulation results of comparative simulations I in 2030 (* Probability means the chance of appearance. Frequency means the number of times it appears (a total of 100,000 times)). (b) Carbon emission simulation results of comparative simulations II in 2030 (* Probability means the chance of appearance. Frequency means the number of times it appears. (A total of 100,000 times)).

Figure 10.
Carbon emissions simulation results. (* The figure below is an enlarged view of the circled area in the figure above).
Figure 10.
Carbon emissions simulation results. (* The figure below is an enlarged view of the circled area in the figure above).


Table 1.
Urban/rural per capita GDP estimates based on different assumptions.
| Assumptions | GDP (Trillion Yuan) | Urban-Rural Ratio | Urban per Capita GDP (Yuan) | Rural per Capita GDP (Yuan) |
|---|---|---|---|---|
| I | 120 | 11:1 | 104,761.9 | 22,222.2 |
| II | 149 | 11:1 | 130,079.4 | 27,592.6 |
| III | 162 | 11:1 | 141,428.6 | 30,000.0 |
Table 2.
(a) Distribution of variables. (b) Distribution of variables.
| (a) | ||||||||
| Year | Comparative Simulation I | Comparative Simulation II | ||||||
| Energy Carbon Emissions Coefficient | Energy Consumption Intensity | Energy Carbon Emissions Coefficient | Energy Consumption Intensity | |||||
| Mean | Std. | Mean | Std. | Mean | Std. | |||
| 2016 | 2.45 2.45 2.45 2.45 2.45 2.45 2.45 2.45 2.45 2.45 2.45 2.45 2.45 2.45 2.45 | 0.60 | 0.01 | 2.44 | 0.01 | 0.60 | 0.02 | |
| 2017 | 0.58 | 0.01 | 2.43 | 0.01 | 0.58 | 0.01 | ||
| 2018 | 0.57 | 0.01 | 2.42 | 0.01 | 0.57 | 0.01 | ||
| 2019 | 0.57 | 0.01 | 2.40 | 0.01 | 0.57 | 0.01 | ||
| 2020 | 0.57 | 0.01 | 2.39 | 0.01 | 0.58 | 0.01 | ||
| 2021 | 0.57 | 0.01 | 2.38 | 0.01 | 0.58 | 0.01 | ||
| 2022 | 0.57 | 0.01 | 2.38 | 0.01 | 0.57 | 0.01 | ||
| 2023 | 0.57 | 0.01 | 2.37 | 0.01 | 0.57 | 0.01 | ||
| 2024 | 0.57 | 0.01 | 2.37 | 0.01 | 0.56 | 0.01 | ||
| 2025 | 0.57 | 0.01 | 2.36 | 0.01 | 0.56 | 0.01 | ||
| 2026 | 0.57 | 0.01 | 2.36 | 0.01 | 0.55 | 0.01 | ||
| 2027 | 0.57 | 0.01 | 2.35 | 0.01 | 0.55 | 0.01 | ||
| 2028 | 0.57 | 0.01 | 2.35 | 0.01 | 0.54 | 0.01 | ||
| 2029 | 0.57 | 0.01 | 2.34 | 0.01 | 0.54 | 0.01 | ||
| 2030 | 0.57 | 0.01 | 2.34 | 0.01 | 0.53 | 0.01 | ||
| (b) | ||||||||
| Year | Urban per Capita GDP | Rural per Capita GDP | Urbanization | Population | ||||
| Mean | Std. | Mean | Std. | Mean | Std. | Mean | Std. | |
| 2016 | 72,407 | 1448 | 26,801 | 536 | 57% | 1% | 1383 | 277 |
| 2017 | 76,544 | 1531 | 28,554 | 571 | 58% | 1% | 1390 | 278 |
| 2018 | 80,692 | 1614 | 30,170 | 603 | 59% | 1% | 1397 | 279 |
| 2019 | 84,851 | 1697 | 31,617 | 632 | 60% | 1% | 1404 | 281 |
| 2020 | 89,021 | 1780 | 32,864 | 657 | 61% | 1% | 1411 | 282 |
| 2021 | 93,202 | 1864 | 33,882 | 678 | 62% | 1% | 1418 | 284 |
| 2022 | 97,394 | 1948 | 34,638 | 693 | 63% | 1% | 1425 | 285 |
| 2023 | 101,598 | 2032 | 35,103 | 702 | 64% | 1% | 1432 | 286 |
| 2024 | 105,812 | 2116 | 35,246 | 705 | 65% | 1% | 1439 | 288 |
| 2025 | 110,038 | 2201 | 35,036 | 701 | 66% | 1% | 1446 | 289 |
| 2026 | 114,275 | 2285 | 34,441 | 689 | 67% | 1% | 1454 | 291 |
| 2027 | 118,523 | 2370 | 33,432 | 669 | 68% | 1% | 1461 | 292 |
| 2028 | 122,782 | 2456 | 31,978 | 640 | 69% | 1% | 1458 | 292 |
| 2029 | 127,052 | 2541 | 30,048 | 601 | 70% | 1% | 1455 | 291 |
| 2030 | 130,079 | 2602 | 27,593 | 552 | 70% | 1% | 1452 | 290 |
* Energy carbon emissions coefficient: MMtons/Mtce; * Urban/Rural per capita GDP: yuan. Population: million.
© 2018 by the authors. Licensee MDPI, Basel, Switzerland. This article is an open access article distributed under the terms and conditions of the Creative Commons Attribution (CC BY) license (http://creativecommons.org/licenses/by/4.0/).
Share and Cite
MDPI and ACS Style
Wu, Y.; Luo, J.; Shen, L.; Skitmore, M. The Effects of an Energy Use Paradigm Shift on Carbon Emissions: A Simulation Study. Sustainability 2018, 10, 1639. https://doi.org/10.3390/su10051639
AMA Style
Wu Y, Luo J, Shen L, Skitmore M. The Effects of an Energy Use Paradigm Shift on Carbon Emissions: A Simulation Study. Sustainability. 2018; 10(5):1639. https://doi.org/10.3390/su10051639
Chicago/Turabian StyleWu, Yuzhe, Jiaojiao Luo, Liyin Shen, and Martin Skitmore. 2018. "The Effects of an Energy Use Paradigm Shift on Carbon Emissions: A Simulation Study" Sustainability 10, no. 5: 1639. https://doi.org/10.3390/su10051639
Note that from the first issue of 2016, this journal uses article numbers instead of page numbers. See further details here.