Ten Years of Sustainability (2009 to 2018): A Bibliometric Overview


1
Business School, Sichuan University, Chengdu 610064, China
2
Department of Computer Science and Artificial Intelligence, University of Granada, E-18071 Granada, Spain
3
National Institute of Measurement and Testing Technology, Chengdu 610021, China
4
Faculty of Computing and Information Technology, King Abdulaziz University, Jeddah 21589, Saudi Arabia
5
Faculty of Engineering and Applied Science, University of Ontario Institute of Technology, Oshawa, ON L1H 7K4, Canada
*
Author to whom correspondence should be addressed.
Sustainability 2018, 10(5), 1655; https://doi.org/10.3390/su10051655
Submission received: 3 April 2018
/
Revised: 28 April 2018
/
Accepted: 10 May 2018
/
Published: 21 May 2018
(This article belongs to the Special Issue 10th Anniversary of Sustainability—Recent Advances in Sustainability Studies)
Abstract
:Sustainability (SUS) is a journal in the field of environmental, cultural, economic and social sustainability of human beings and civilization, which was founded in 2009. This paper provides a comprehensive bibliometric overview of the journal and 6459 publications from 2009 to 2018. In the paper, we first introduce the materials and methods used. Next, we provide the bibliometric results in four parts. In the first part, we present the publication structure and citation structure of SUS, including annual trends of publications and citations, sources that cite SUS publications, and the most highly cited papers in SUS. The primary influential countries and institutes as well as their co-authorship networks are illustrated in the second part. The co-citation networks of cited references, journals and authors are shown in the third part. Finally, the co-occurrence network of keywords and bursting citation keywords is detected. VOSviewer and CiteSpace software packages are used for graphical visualization.
1. Introduction
Sustainability (SUS) is an international and multidisciplinary journal covering several fields including sustainability and sustainable development, environmental and ecological science, social science, economics and cultural issues. It is an open access journal. SUS was founded in 2009 with four issues. After 2009, it was published monthly. Up to now, SUS has attracted the broad attention of scholars and research institutes. It has an important impact on the sustainable development of human beings and civilization. SUS has been indexed by the well-known database in Web of Science (WoS), namely, the Social Science Citation Index (SSCI), since 2011. The impact factor of SUS has been recorded since 2013. In 2013, the journal impact factor was 1.077. There was a slight decline in 2014 (0.942). In the next two years, 2015 (1.343) and 2016 (1.789), the journal impact factor grew steadily. SUS is located in Switzerland and its publisher is MDPI.
Bibliometrics uses statistics and visualization methods to explore the structures and patterns of certain disciplines [1]. A variety of topic categories have been analyzed with bibliometrics, such as green innovation [2], big data medical [3], supply chain management [4], operations management [5] and fuzzy theory [6]. We can understand systematically the development of these disciplines through bibliometric analyses. Most bibliometrics studies analyze specific disciplines, but there is another kind of bibliometric study that aims to present the basic structure of a specific journal. For example, Schwert [7] provided a bibliometric overview of the Journal of Financial Economics between 1974 and 1991. To commemorate the 25th anniversary of Knowledge-Based Systems, Cobo et al. [8] presented a bibliometric analysis of the journal. Merigó et al. [9] and Yu et al. [10] investigated all publications of Information Sciences from 1968 to 2016. Tang et al. [11] provided a bibliometric review and visualization of International Journal of Fuzzy Systems between 2007 and 2017.
The above papers focusing on a specific field or a certain journal can provide a guidance for the future development of disciplines or journals. For instance, in Ref. [3], the authors analyzed nearly 1000 publications in the domain of medical big data. Based on their analysis results, they found that individualized medical treatment and precision medical treatment are important development directions in medical big data. Ref. [6] concentrated on fuzzy decision making between 1975 and 2015. Its conclusion was that some small countries can also exert an influence on fuzzy theory. As for sustainable development, it is particularly important to explore the development trends. Jia and Jiang [12] provided a bibliometric review of sustainable global sourcing and gave eight future directions for that field. De la Cruz-Lovera et al. [13] discussed the sustainable development status of public buildings and presented the status of this field. Their work could help the scientific community to better understand the current situation and to predict future dynamics and changes. Thus, it is hoped that our paper can provide useful guidance for the journal and fields related to it.
This paper carries out a systematic bibliometric analysis of SUS. To do this, we firstly provide the publication structure and citation structure of SUS, including the annual trends of publications and citations, the sources that cite SUS publications, and the highly cited papers in SUS. Secondly, we discuss the prolific countries/regions and the co-authorship network of the publications in SUS. Next, the co-citation network of the cited references, journals and authors is illustrated. Finally, we display the co-occurrence networks of the keywords and the bursting keywords of SUS. The objective is to better understand the impact of SUS and its publications.
The remainder of this paper is organized as follows. Section 2 introduces the materials and methods used. In Section 3, we present the results of performance including the publication and citation structures and influential countries and institutes. Section 4 displays science mapping in detail. In Section 5, the results are discussed. Section 6 closes the paper with some interesting concluding remarks.
2. Materials and Methods
The data used in this paper are obtained from the WoS. There are 6459 publications in total from 2009 until now (2 March 2018). Regarding the document types, there are 6296 articles, occupying a share of 96.92%. Other types of published work includes reviews (347), meetings (146), editorials (61), corrections (14), letters (2), biographies (1), retracted publications (1) and retractions (1). Note that SUS was indexed by WoS starting in 2011 and there are 6228 publications that are included in the SSCI database of WoS. In this paper, the 6459 publications are used to analyze the publication and citation structures of SUS, while the 6228 publications downloaded from the SSCI database of WoS were used for the co-authorship analysis, the co-citation analysis and the keywords analysis, in part based on visualization software. The 6228 publications were downloaded on 2 March 2018 in the form of a tab separator format.
The term “bibliometrics” was first coined by Pritchard [14] in 1969. Bibliometrics refers to the field that investigates groups of publications by quantitative analysis methods. Many bibliometric indicators are used in this paper including the numbers of publications and citations, the average number of citations per year, and the H-index [15]. The number of publications can reflect the contributions of authors and institutes. The numbers of citations and average citations often are correlated with the quality and influence of scholars. The H-index considers the quantity and quality of academic output simultaneously. There are two main methods for bibliometrics: performance analysis and science mapping [16]. Performance analysis includes the publication and citation distributions in terms of authors, countries, and institutes. Science mapping uses visualization software to present the subject structure. Much bibliometrics software has been developed, such as VOSviewer [17], CiteSpace [18], Bibexcel, CoPalRed, VantagePoint and IN-SPIRE. VOSviewer is widely used and has a powerful user graphic-interface and mapping visualization capability [17]. CiteSpace was developed by Chen [18]. These two software packages are based on a Java environment. The inputs of these software packages are a collection of research materials in terms of a specific field or a journal. Then, various functions such as citation performance, co-citation network, co-authorship network, and bibliographic coupling supported by the software packages allow users to investigate the structure of a field or a journal. In this paper, VOSviewer and CiteSpace are used to analyze the publications in SUS. The co-occurrence, citation, co-citation and bibliographic coupling network is obtained by VOSviewer. We adopt citation burst detection [19] to obtain the keyword citation bursts by CiteSpace.
3. Performance Analysis
In this section, we provide a comprehensive bibliometric analysis for the publications in SUS. The publication and citation distributions, the sources that cite SUS publications, and the most highly cited papers in SUS are presented in Section 3.1. The active countries or regions, and the active institutes and their co-authorship networks are shown in Section 3.2.
3.1. Publication and Citation Structures of the Publications in Sustainability (SUS)
SUS published 6459 studies from its inception in 2009 to 2 March 2018. The annual distribution of these 6459 publications is illustrated in Figure 1. In the first four years, from 2009 to 2012, the number of publications was under 200. Compared with 2010 (138), the number of publications in 2011 (128) declined slightly. After 2012, the number of publications exhibited a significant growth trend. There were more than 1000 publications in 2016 (1357) and 2017 (2391). This growth implies that SUS is attracting the attention of more and more scholars.
We present the annual citation structure of the publications in SUS between 2009 and 2018 in Table 1. There are 7 papers that have more than 100 citations; 2.32% of the documents have more than 20 citations and 8.50% have more than 10 citations; 60.12% of the publications received at least one citation, implying that the majority of SUS publications attracted scholars’ attention. In terms of the average citations per paper from 2009 to 2018, we can see that the citation rate first increased and then decreased, with a peak value observed in 2011 of 15.72 citations per publication. It is reasonable that at the beginning, from 2009 to 2011, the impact of publication was increasing year by year. Also, new publications need some time to catch up regarding citations, so it is natural that the average citations should decrease after a period of time.
The analysis of who is paying attention to the publications in SUS is also interesting. Table 2 lists the top 30 journals, countries/regions and institutes that cite SUS publications. Some papers had international co-authorships. In these cases, every country and institute is counted one time. For example, if one paper contains authors from three countries, then these three countries are counted one time separately. As can be seen, SUS itself ranks first with 2496 times. It is a common phenomenon for a journal to cite itself [20]. At the second position is Journal of Cleaner Production with 658 papers, followed by Energies (203), Renewable Sustainable Energy Reviews (188) and Science of Total Environment (125). The majority of these journals are related to energy, the environment and ecology, which indicates the theme of SUS. As for the countries/regions, China is the leading citing country citing SUS. More than half of the citing countries are from Europe. How to achieve sustainable development is an urgent issue for most countries. Moreover, when considering the citing sources in terms of institute, it is seen that China has 9 institutes in the top 30 citing source list. Note that China here refers to mainland China, not including Hong Kong, Macao and Taiwan. There is one institute from Hong Kong. The remaining 20 institutes are all located in Europe or the USA.
Next, we present the top 30 highly cited papers in SUS (see Table 3). As mentioned above, there are seven articles that have more than 100 citations. Finkbeiner et al. [21] published in 2010 ranks first with 162 citations. In this article, Finkbeiner et al. [21] explored a method to measure sustainability performance. In these 30 highly cited papers, review articles have good performance given that the 4th, 5th, 6th, 10th, 11th, 12th, 14th, 18th, 19th and 30th are review articles, occupying one third of the top 30 highly cited papers. Of these highly cited papers, 18 were published in the first three years of SUS (2009–2011). The papers published in the last several years still need time to catch up. As for average citations by year, Dixit et al.’s [22] article occupies the first place with 20.25 citations per year.
3.2. Influential Countries/Regions and Institutes
The top 30 most productive countries of SUS publication from 2009 to 2018 are presented in Table 4. The table includes 17 European countries, 7 Asian countries/regions, 3 North American countries, 1 Oceania country, 1 African country and 1 Latin American country. China is seen to be the most prolific country with 1893 publications. The USA, South Korea, Italy and Germany rank from 2nd to 5th, respectively. The USA exhibits good performance in terms of highly cited papers. There are 8 papers that have more than 50 citations, far ahead of other countries. What is more, as seen in Table 3, most highly cited papers were written by scholars from western countries/regions. There are no papers by scholars from China or South Korea, which are two of the top three productive countries. To achieve a breakthrough in quality, efforts may be required to establish or improve fair peer review systems and to set up scientific self-organization mechanisms that can address internal problems of the scientific community and coordinate efforts to do so. It is possible that the importance of quality needs to achieve a more widespread recognition and a consensus among researchers.
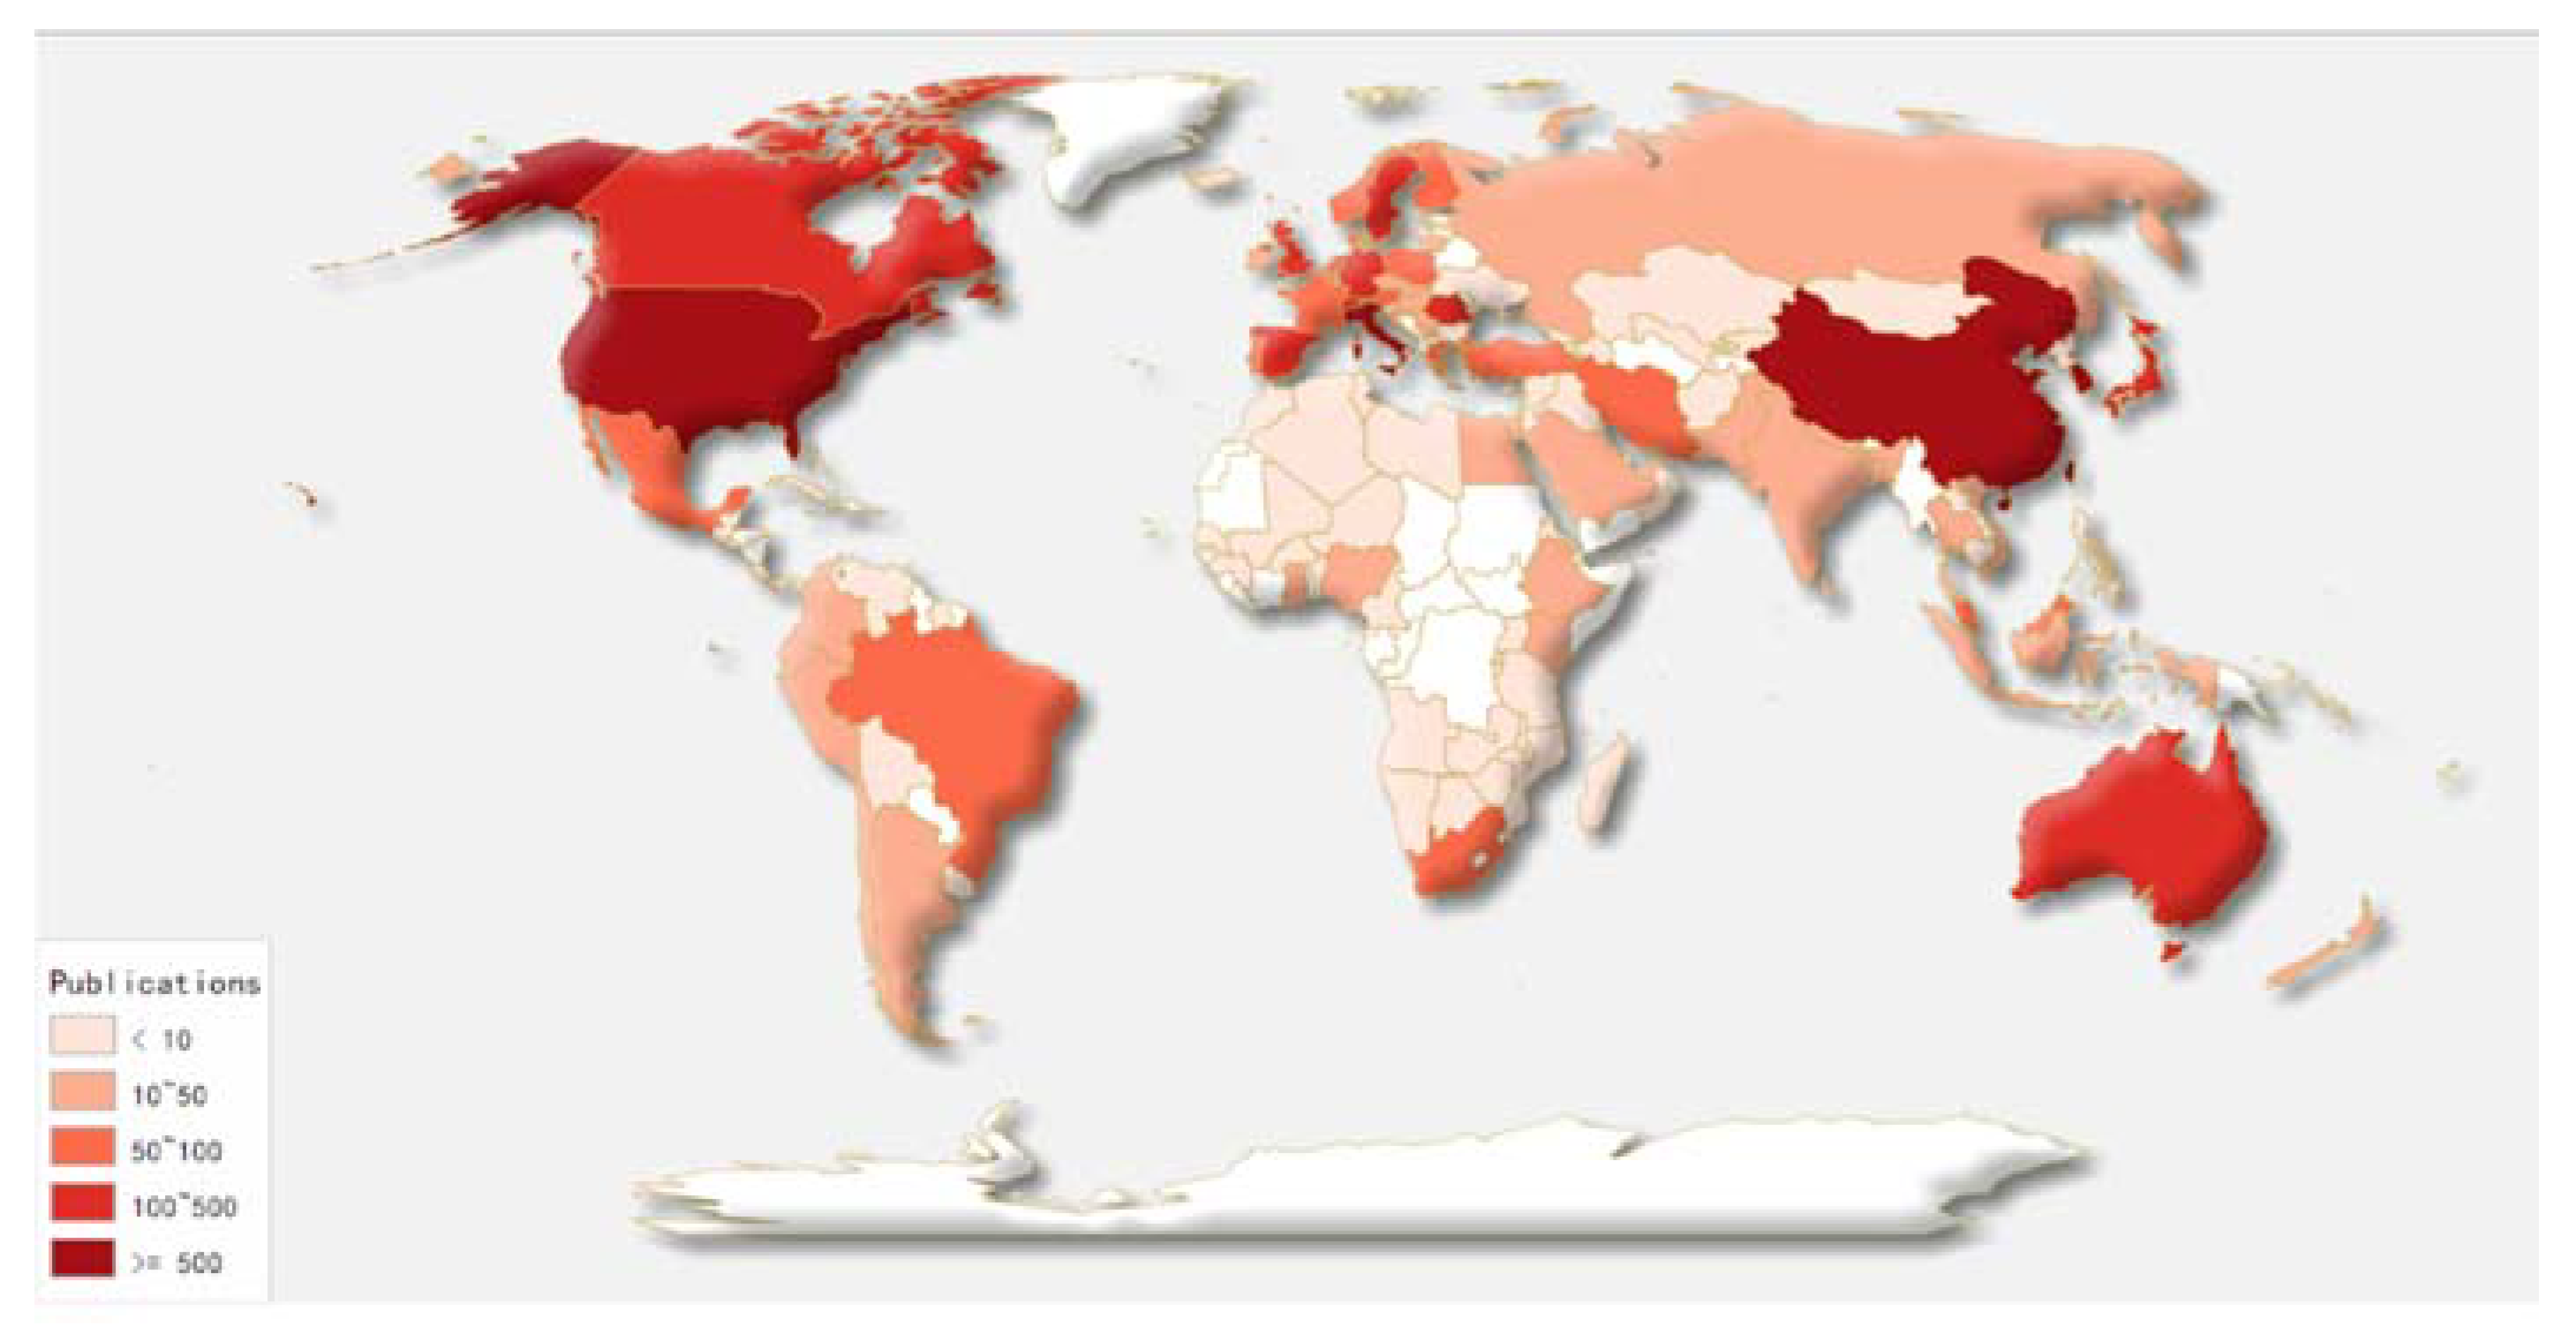
The global distribution of SUS publications from 2009 to 2018 is shown in Figure 2. Figure 2 reveals that SUS publications are widely distributed around the world, although the main output is in Asia, North America and Europe.
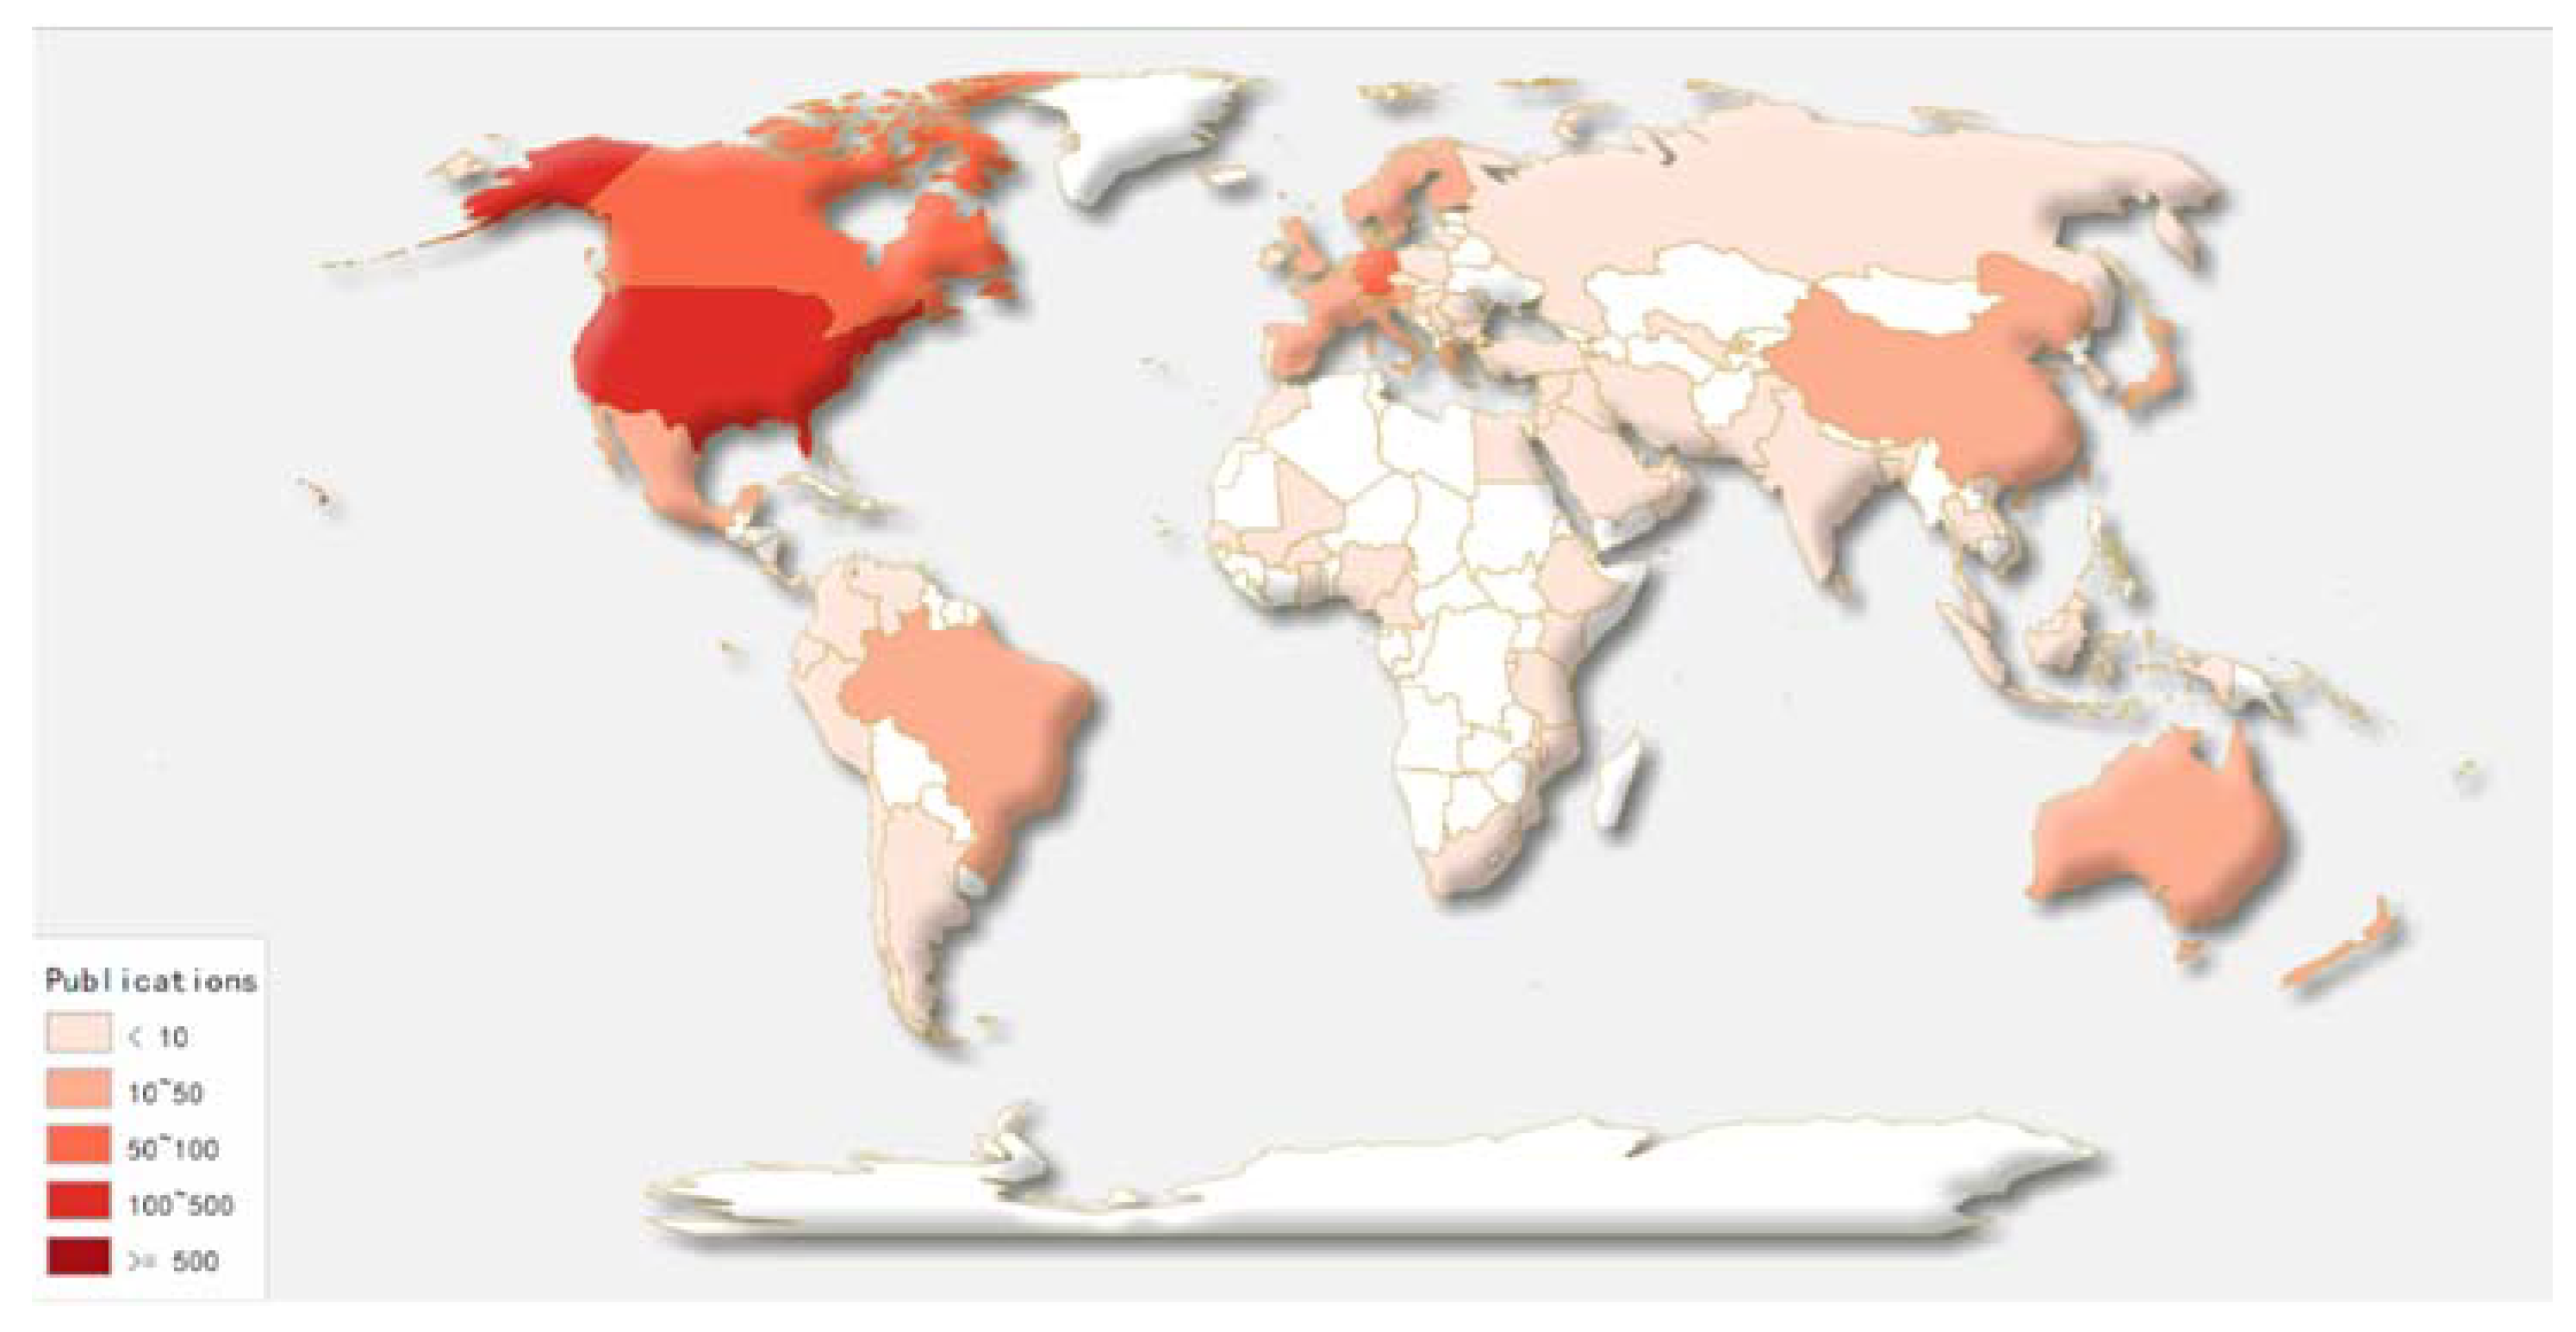
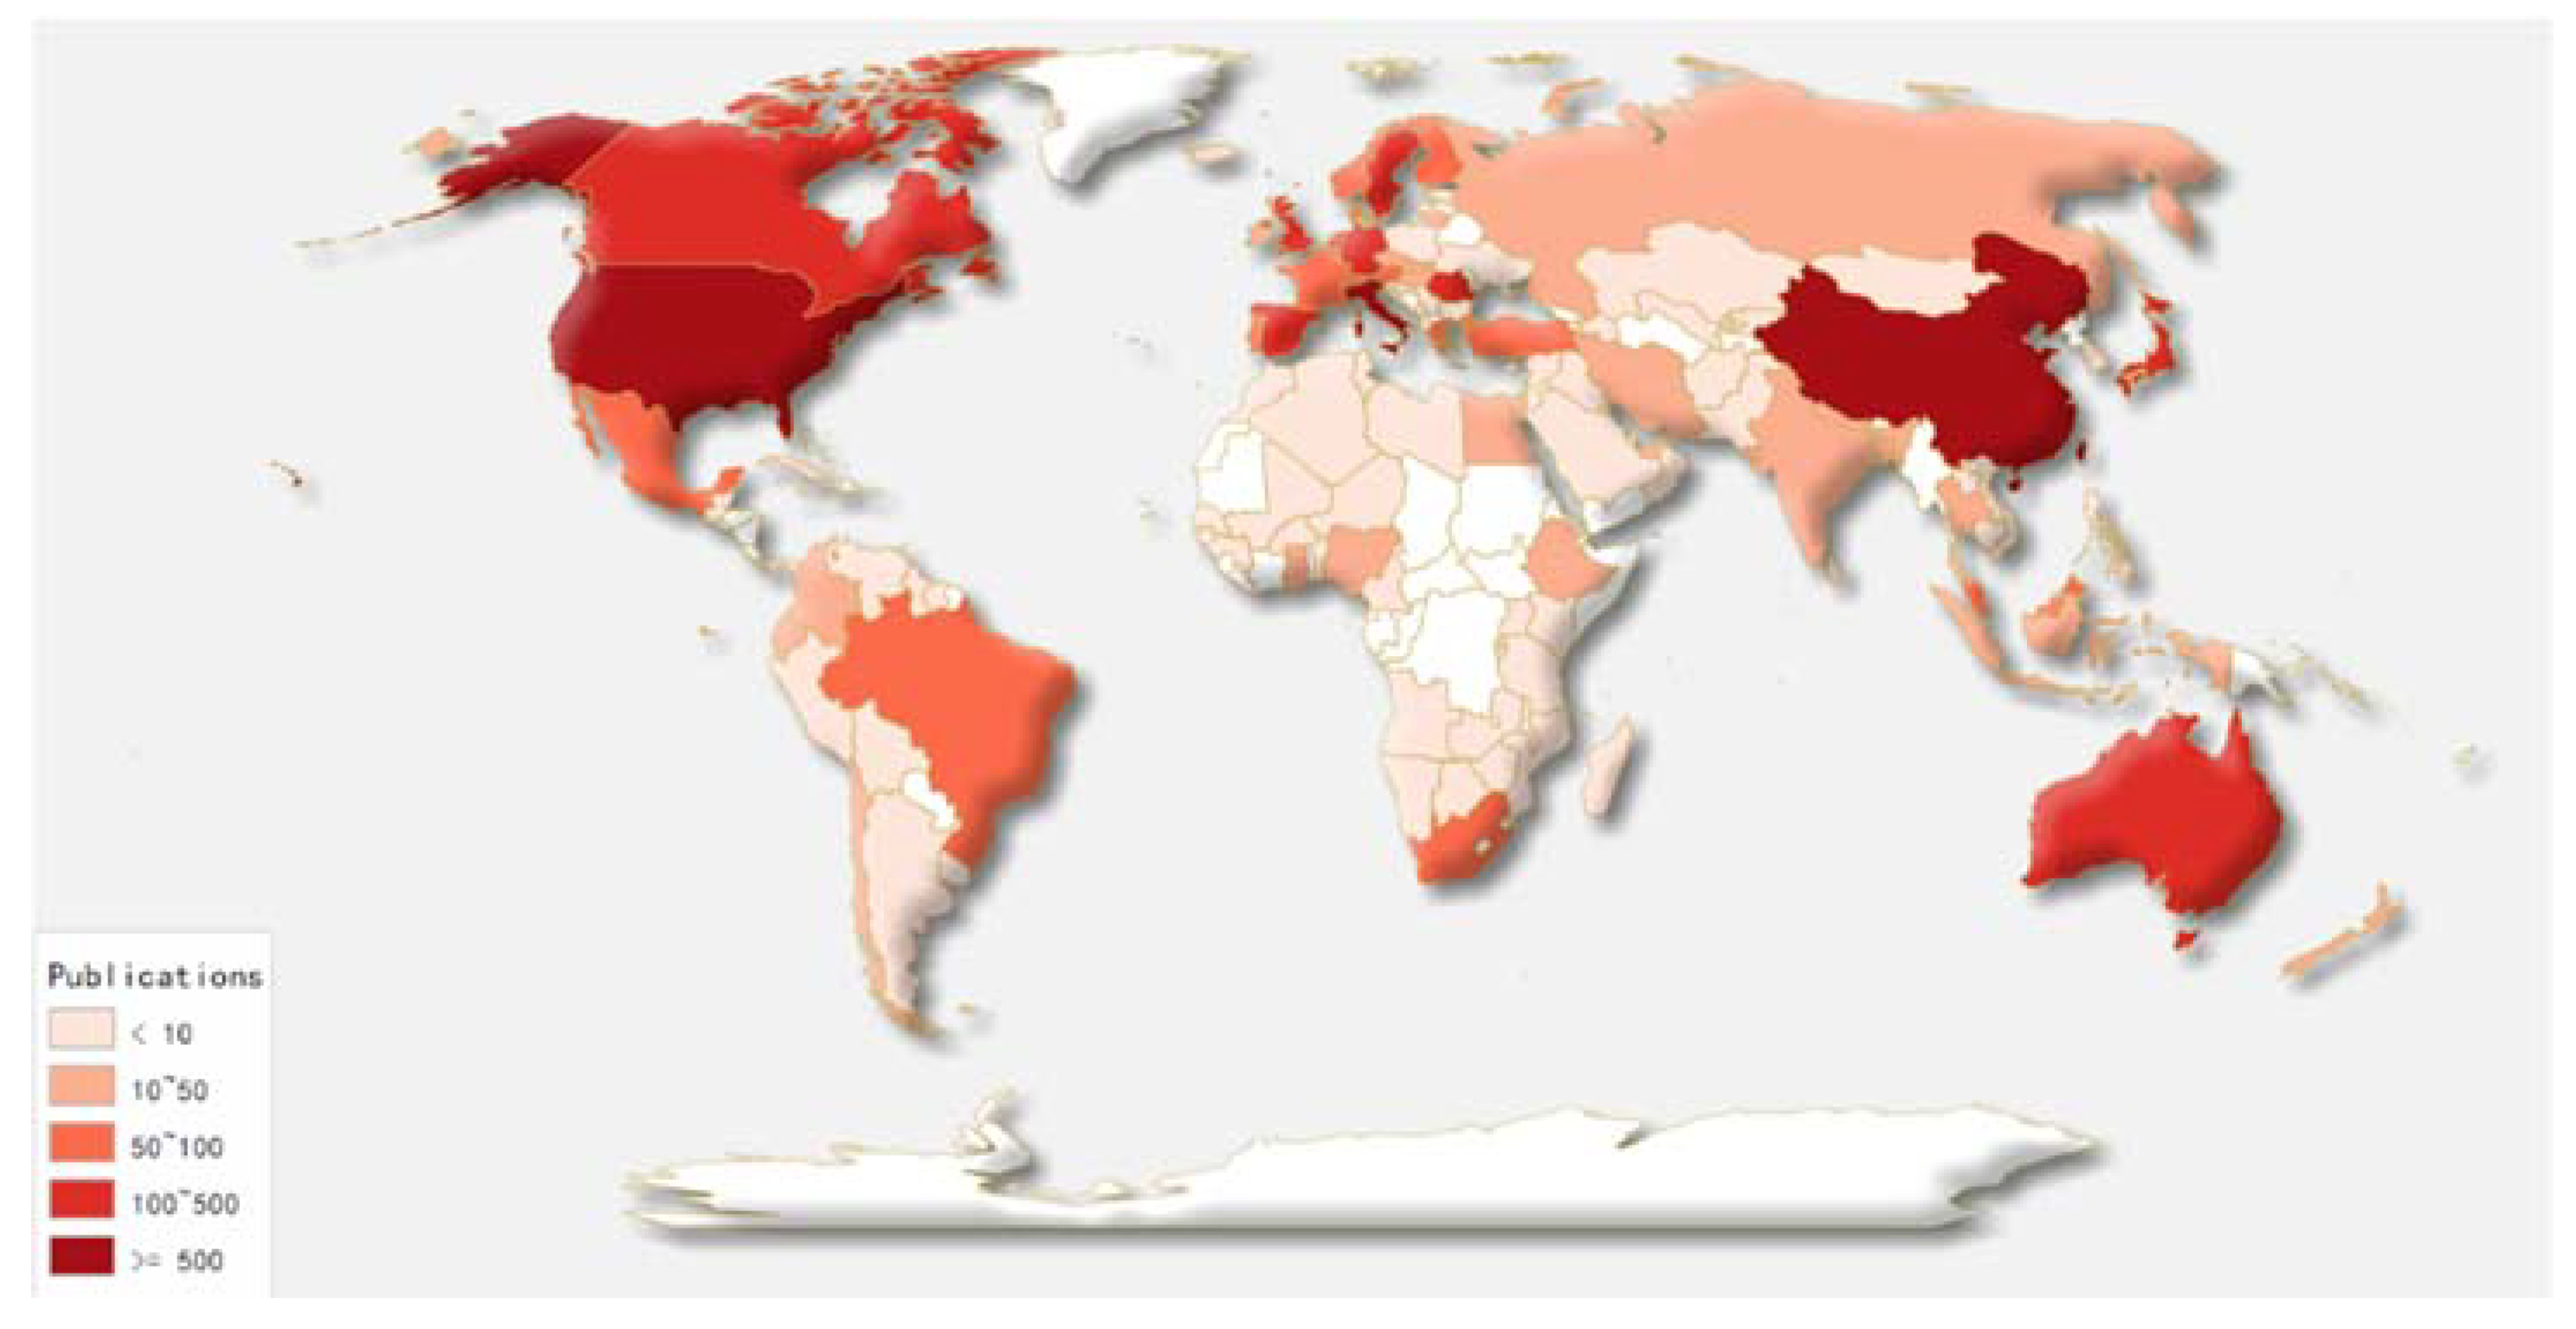
We also divide the distribution of publications into two stages: 2009–2013 and 2014–2018. The last four columns of Table 4 show the numbers of publications and citations in two stages. Compared with the first stage, China and South Korea exhibit a rapid increase in the numbers of publications and citations. Figure 3 and Figure 4 present global distributions of the publications in SUS from 2009 to 2013 and from 2014 to 2018, respectively. Comparing Figure 3 and Figure 4, it is seen that many countries have exhibited progress in publications.
To further study the influential countries, we next discuss the international country co-authorship network of SUS publications. Up until now, co-authorship has been the most common way of cooperation. International country co-authorship is one of the most important forms of co-authorship. We can find the active countries/regions from the international country co-authorship network. Furthermore, international co-authored articles normally have a good performance in terms of numbers and citations [51,52].
We developed the international country co-authorship network map using VOSviewer software (see Figure 5). In Figure 5, a node represents a country/region. The size of the node denotes the activity of the country/region. A line is established when two countries/regions have a collaborative relationship. The thickness of the line reflects the tightness of cooperation between countries/regions. We set the threshold as 10; then there are 62 countries/regions meeting the requirement. The VOSviewer software divides these 62 nodes into 6 clusters. One color represents one cluster. As we can see from Figure 5, China, the USA, South Korea, Italy and Spain are the biggest nodes. Italy, Spain, England, Netherlands, Sweden and Poland belong to the red cluster. The USA, Mexico, Brazil and Chile belong to the blue cluster. South Korea, Taiwan and Thailand belong to the green cluster. Therefore, geographical location is an important factor that determines international cooperation. In addition, China and South Korea have thick belts with the USA. Nowadays, increasing international exchanges have promoted academic communications. An increasing number of scholars have chosen to go abroad for further studies and academic visits, especially between the USA, China, as well as South Korea.
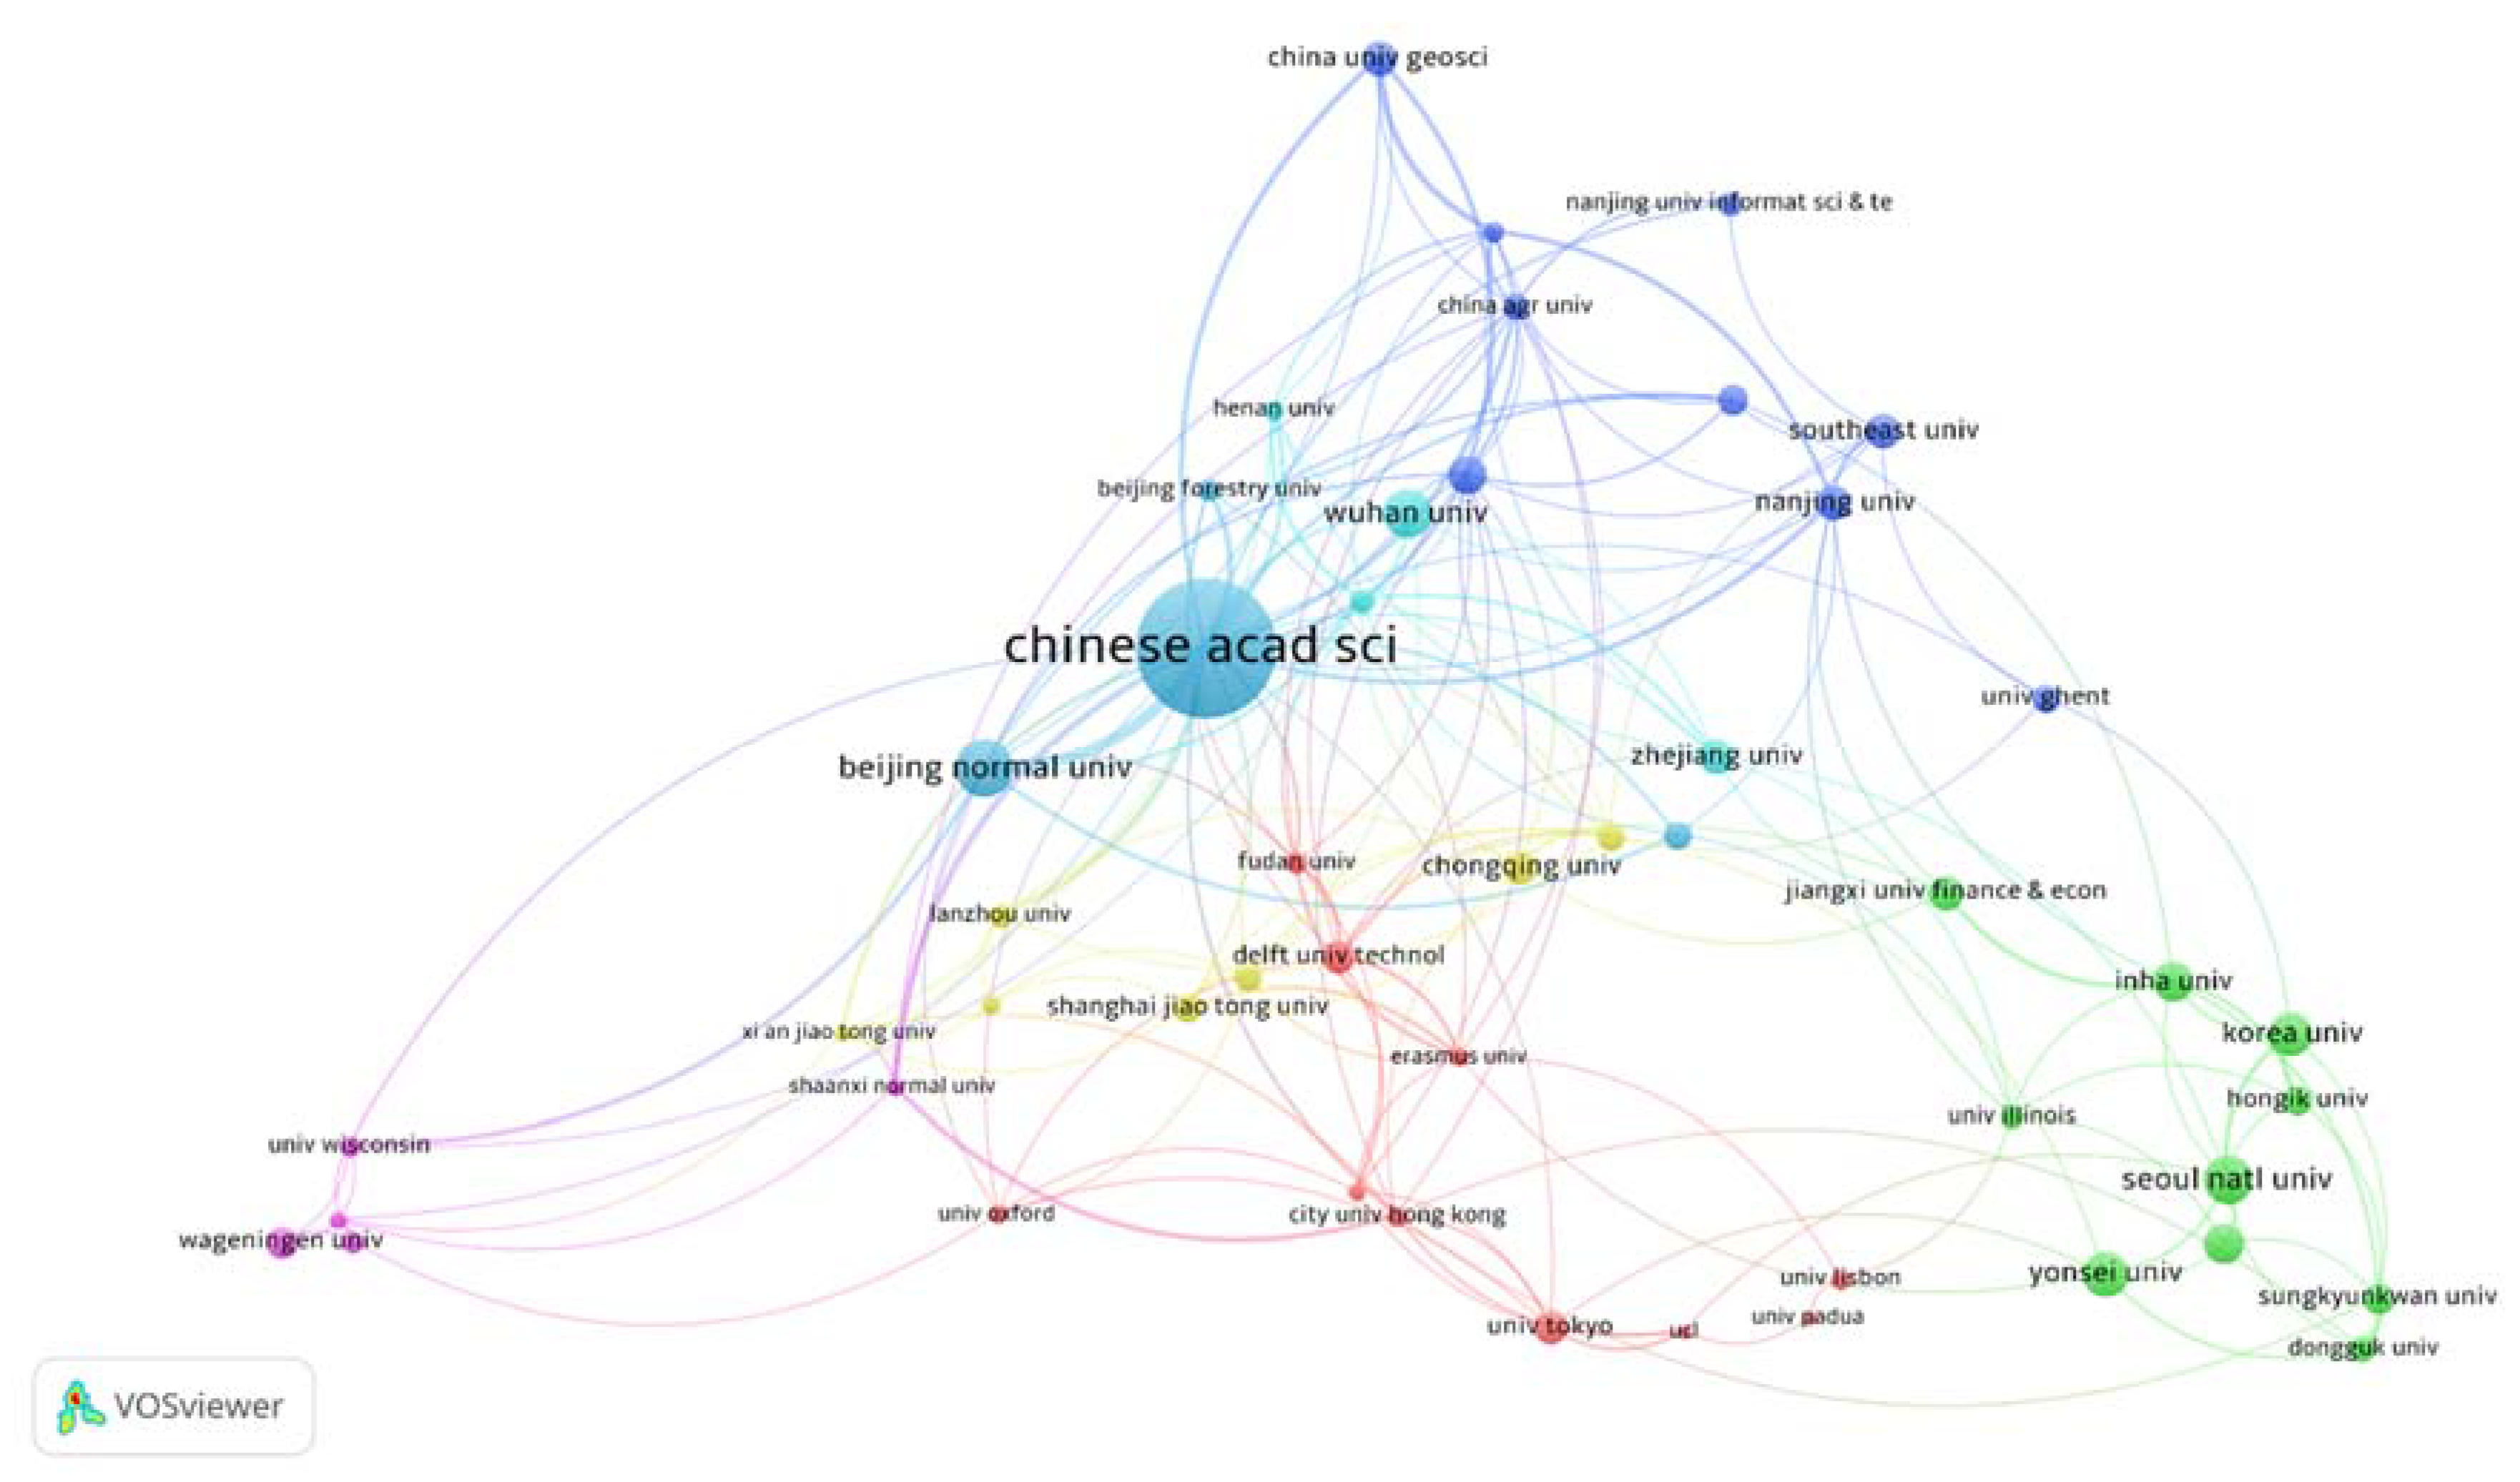
Many institutes around the world have publications in SUS. Table 5 lists the top 30 most prolific institutes. The institute rankings in the general Academic Ranking of World Universities (ARWU) and Quacquarelli Symonds (QS) are also provided in Table 6. The Chinese Academy of Sciences ranks first with 374 publications, followed by Beijing Normal University (93), North China Electric Power University (81) and Wuhan University (75). Note that the Chinese Academy of Sciences does not participate in university rankings. Chinese institutes have more influence in SUS publications than other countries’ institutes. In the list, China has 4 institutes in the top 5 most productive institutes and 13 institutes in the top 30. China and South Korea are seen to be the leaders in SUS publications presently. Nearly two thirds (19/30) of prolific institutes are from these two countries.
We also present the institute co-authorship network map in Figure 6. There are 4294 institutes which have publications in SUS. We selected the top 50 institutes to display in Figure 6. The VOSviewer software divided these 50 institutes into 7 clusters with 7 different colors. The Chinese Academy of Sciences and Beijing Normal University are the two biggest nodes in Figure 6. Korean institutes are concentrated in the green cluster. The distance between Nanjing University and South-east University is very close. It can be seen that language and geographical position are important factors that affect the cooperation of institutes.
4. Science Mapping Analysis
4.1. Co-Citation Analysis
Co-citation analysis was first introduced by Small [53]. Two documents establish a co-citation relationship when they appear in the references of another document simultaneously. In general, if two documents establish a co-citation relationship, they are more or less similar. There are mainly three types of co-citation analysis: reference co-citation analysis, institute co-citation analysis, and author co-citation analysis. In this section, we illustrate the co-citation networks of cited references, institutes and authors.
4.1.1. Co-Citation Network of Cited References
The reference co-citation network of SUS publications is displayed in Figure 7. We set the threshold as 30, and 51 references meet this requirement. The references that have been cited more than 30 times by SUS publications are shown in Figure 7. There, a node represents a document. The size of the node indicates the frequency that the document is cited by SUS publications. A bigger node represents a higher frequency. A line between two nodes indicates that they have been cited by SUS publications at least once.
The most cited references by SUS publications are listed in Table 7. The authorship, publication year, sources, number of citations and citations according to the Core Collection database of WoS are also presented in Table 6. The work of Fornell and Larcker [54] ranks first with 103 citations. They introduced a comprehensive testing system based on methods of shared variance in that paper, which received more than 18,000 citations in WoS. At second place is the article by Charnes et al. [55], which provided a novel non-linear programming model and used it in controlling and evaluating managerial measures for public programs. The third paper published in Nature demonstrated that ecosystem services play a critical role in human welfare [56]. In Ref. [57], Ajzen reviewed planned behavior theory and discussed some issues that are difficult to resolve. A new approach to maintain global sustainability was proposed by Rockstrom et al. [58]. Ostrom’s article [59] ranks sixth with 50 citations by SUS publications. Ostrom established a framework to analyze social-ecological systems’ sustainability. In 7th place is a review [60], which provided a comprehensive summary for sustainable supply chain management. Ref. [61] investigated the consequences of global land use from various perspectives. Large-scale land use has influenced the sustainability of ecosystems. As can be seen, most of these highly co-cited references are about ecosystems and sustainability. These 10 articles can be divided into two categories with 4 papers related to social science and 6 related to natural science. The six natural science articles are about ecosystem services, natural capital, safe operating space, environment competitiveness and land use. These topics are attracting much attention from SUS publications, demonstrating that SUS is focusing on urgent problems of ecosystem protection and sustainable development. These will be topics that merit continuous consideration in the future. The social science articles are about decision-making, planned behavior, supply-chain management and structural equation models. SUS is also a major journal in the management-related spheres. Therefore, management science can also be a priority direction for SUS.
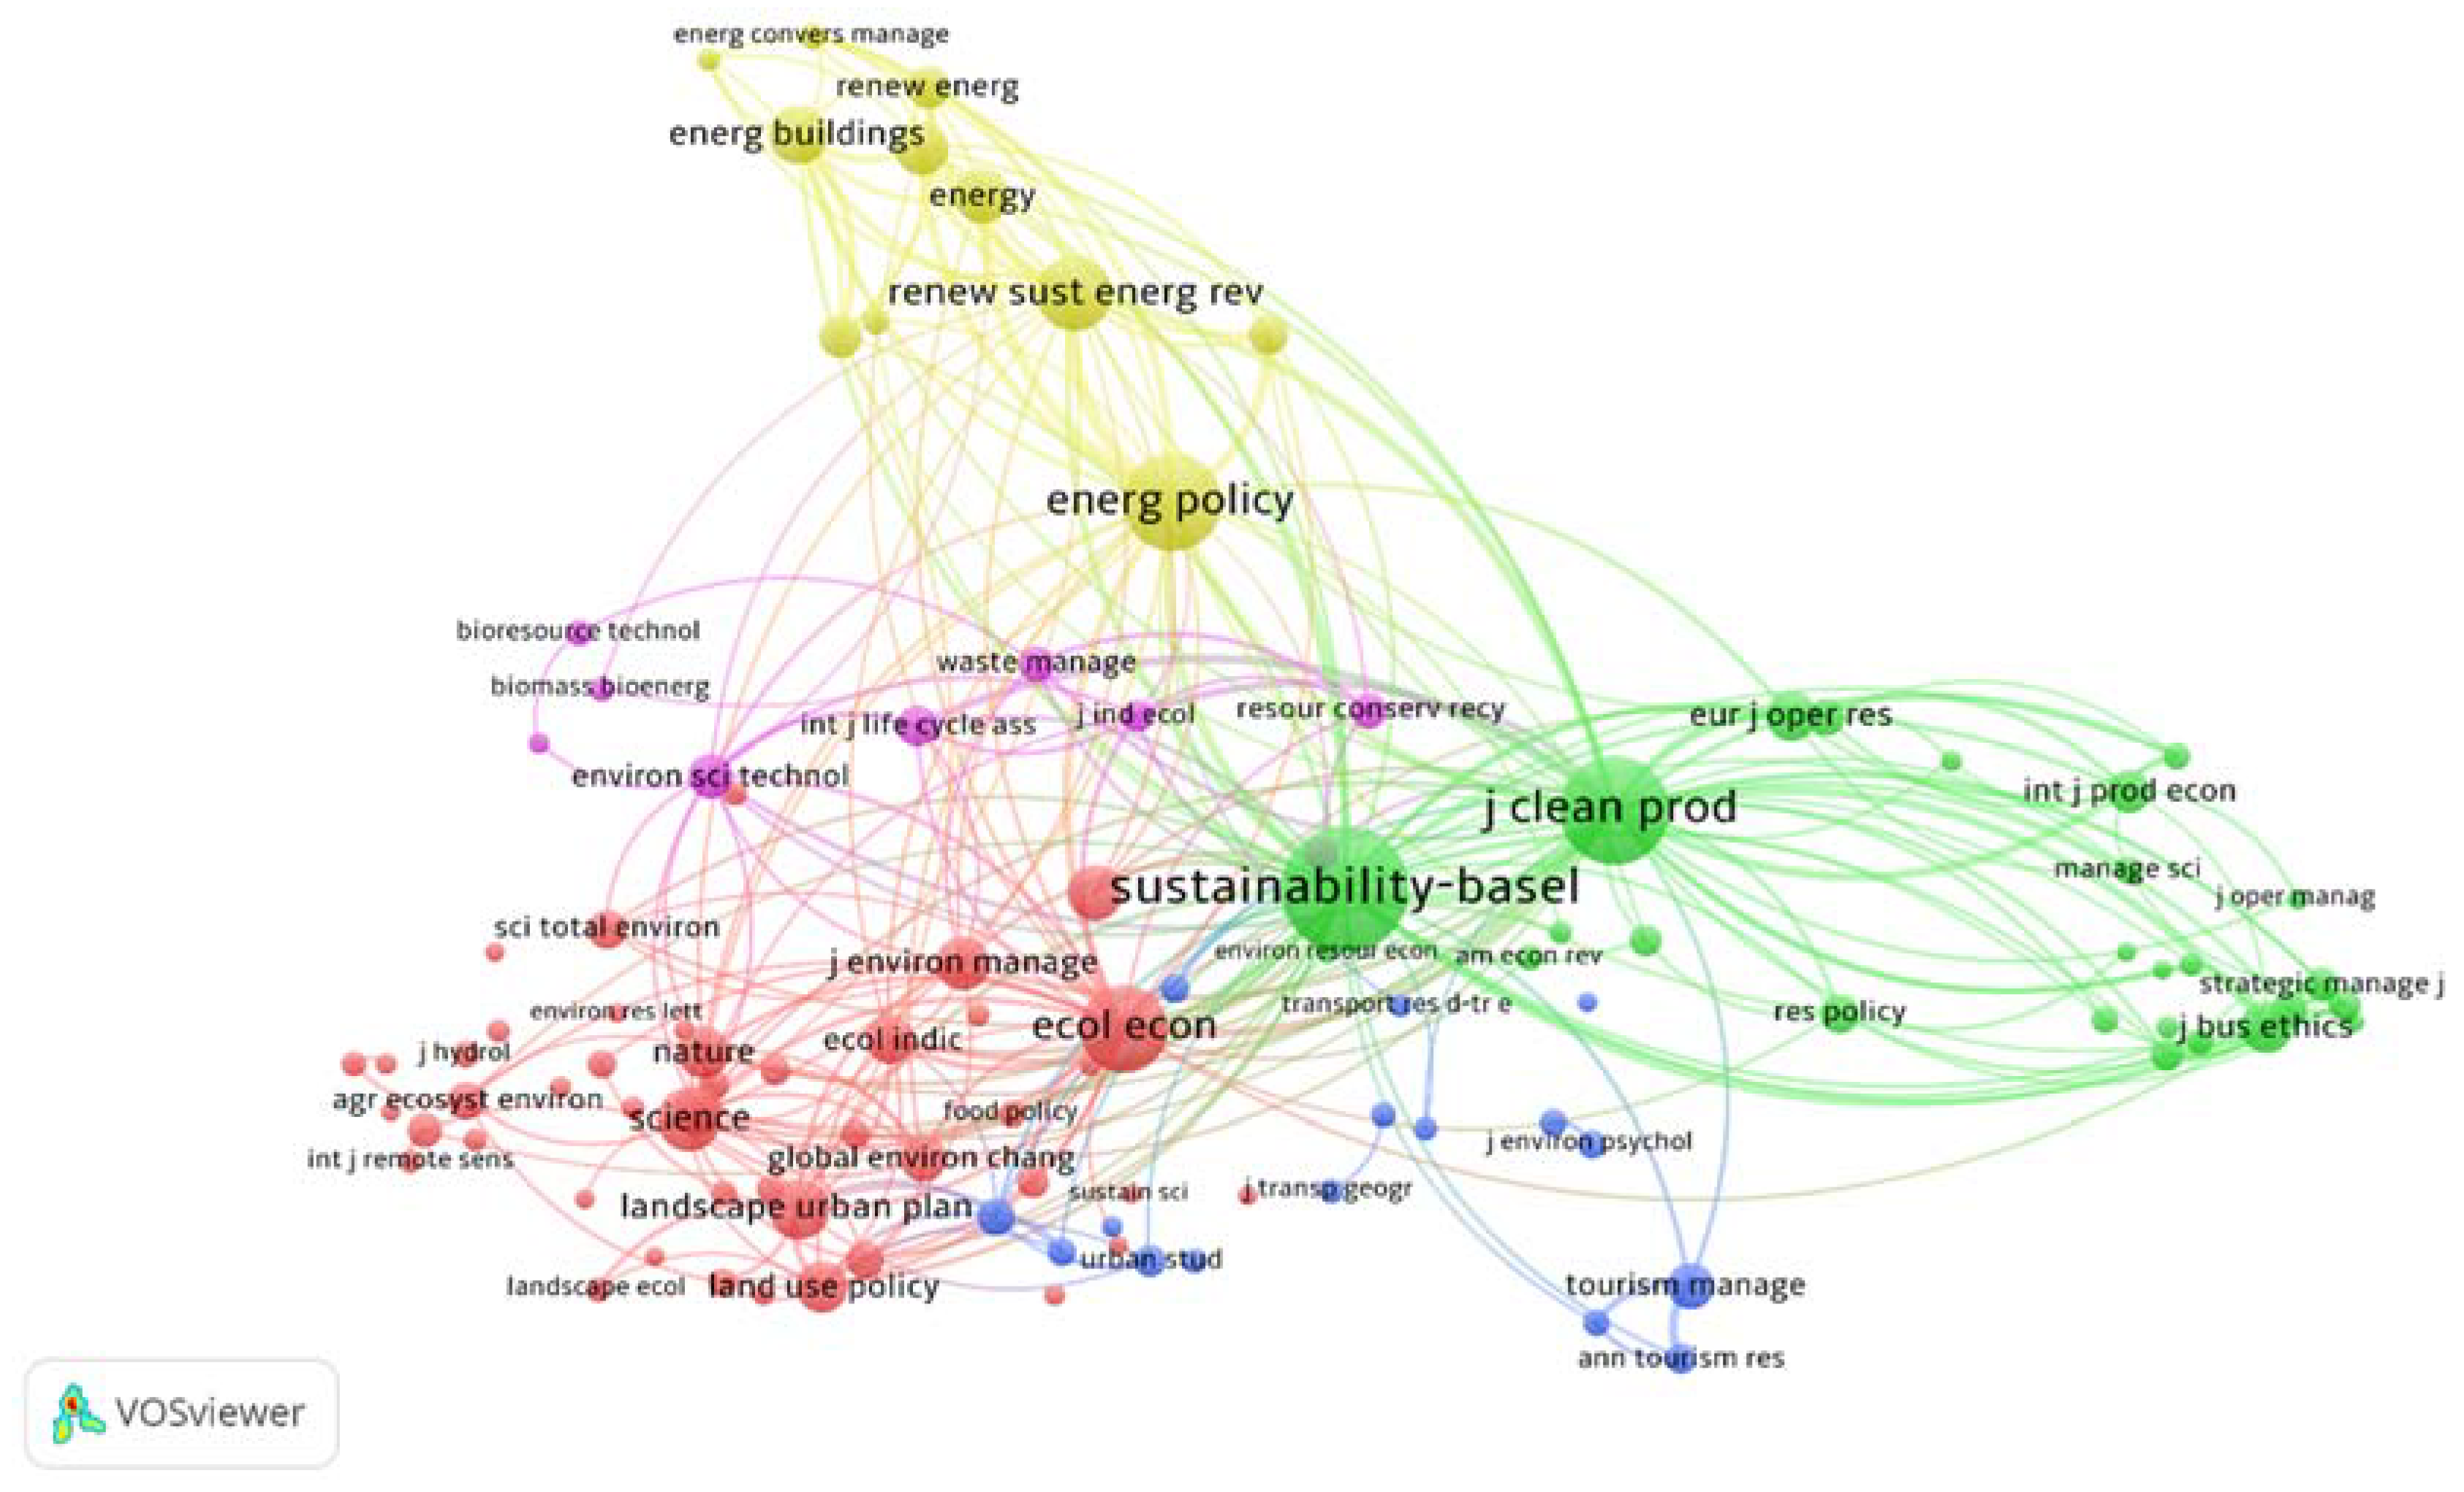
4.1.2. Co-Citation Network of Cited Sources
Journal co-citation analysis is another significant type of co-citation analysis. We provide the co-citation network of cited sources in Figure 8. We set the threshold at 300, and 108 journals are selected for inclusion in Figure 8. In Figure 8, different colors represent different clusters. VOSviewer software divides these 108 sources into 5 clusters. We find that Sustainability, Journal of Cleaner Production, Energy Policy, Ecological Economics, Science and Renewable Sustainable Energy Reviews are the main sources of SUS publications’ references. We provide the top 10 highly cited sources in Table 7. Link strength is the frequency with which two journals appear in one publication simultaneously. Total link strength in Table 8 is the sum of link strength. As we can see from Table 7, Sustainability itself is the most cited journal. Journal of Cleaner Production has been cited 4402 times by SUS publications. There are five journals whose titles include the word “energy”, which indicates that energy sustainability is an important and timely research topic.
4.1.3. Co-Citation Network of Cited Authors
Author co-citation analysis is another interesting topic. According to the analysis results of VOSviewer, 141,001 authors have been cited by SUS publications. We set the threshold at 100, and 54 authors are selected. The co-citation network of cited authors is illustrated in Figure 9. A node represents an author and a line is established when two authors are cited in one document. The size of the node denotes the frequencies for an author. The distance between two nodes reflects the degree of similarity to the authors’ field of study. The most influential authors can be observed in Figure 9. It should be noted that there are some publications that cite the data provided by institutes like the National Bureau of Statistics, the World Bank, the United Nations, and the European Commission. In these cases, the institutes that provide the data would be regarded as authors.
4.2. Keywords Analysis of SUS
Keywords analysis provides a general overview of research trends represented in a journal, as keywords can reflect the focus of the authors and their papers [64]. In this section, we present the keywords co-occurrence network with the help of VOSviewer software. The result of keywords citation bursts is obtained by using CiteSpace.
4.2.1. Keywords Occurrence Network
The keywords occurrence network reflects the study hotspots and research trends of a certain domain or journal [65]. According to the analysis of the results from VOSviewer, there are 26,534 keywords in all SUS publications, and 19,991 keywords appeared only once, accounting for a share of 75.34%; 2890 keywords appeared twice and the frequencies for 817 keywords are greater than 10. In addition, the frequency is more than 50 for 133 keywords and more than 100 for 57 keywords. We select the top 100 keywords for Figure 10. It is seen there that VOSviewer software divides these 100 keywords into 18 clusters. The biggest node is “sustainability”, which is the same as the subject of the journal. “Sustainability” appears 797 times altogether. The keywords “Management” (644), “China” (601), “model” (482) and “performance” (437) rank 2nd to 5th, respectively. The top 30 keywords with their frequencies are provided in Table 8.
4.2.2. Keywords Citation Bursts
Burst citation visualization can be used to detect whether a specific research topic is hot or not [66]. Generally speaking, notable increases in a research field are characterized by citation bursts in publications [66]. Keyword citation bursts can show the emerging topics of a certain field or journal [67]. In the past 10 years, there have been 27 different bursting keywords in SUS publications. Table 9 lists these 27 bursting keywords with their strength and time span. It shows that “community” has the strongest citation burst with a burst strength of 15.04 in the period from 2012 to 2015. Burst strength is an indicator that denotes the change in usage frequency, which can be derived by the burst detection algorithm provided by Kleinberg [19]. “Adaptation” (14.56) is the second strongest citation burst, followed by “knowledge” (13.99), “resilience” (10.78) and “food security” (10.78). In recent years, bursting citation keywords include “risk” (3.65), “environmental impact” (7.20) and “challenge” (7.54).
5. Further Discussion
This study used different bibliometric tools and methods to present the structure of SUS. Based on the results presented, some interesting phenomenon merit further discussion.
China is ahead of other countries in the number of publications. This can be attributed to the large increase of scientific research funds in recent decades. As is known, scientific research funds play a critical role in the progress and improvement of universities and colleges. In addition, as depicted in Table 4, developing countries have a less significant effect on SUS publications. Research funds can affect scientific outputs since SUS is an open-access journal and the authors need to pay the publication fee themselves. In addition, as indicated in Table 3 and Table 4, there are few highly cited papers in SUS from China or South Korea, which are two productive countries in the top 3. Scholars from these two countries should perhaps pay more attention to the quality of publications rather than the quantity.
The results of highly cited papers and journal co-citation networks demonstrate that environmental and energy studies constitute the main topics covered by the journal nowadays. But social and cultural sustainability are also topics that deserve attention. So, in the future, it may be useful to place a greater focus on cultural and social development.
6. Conclusions
A comprehensive bibliometric review of SUS publications from 2009 to 2018 was completed. The work covers four perspectives: publication and citation structures, influential countries and institutes, co-citation analysis, and keywords analysis. Several conclusions can be drawn from the results:
- (1)
- The number of publications in SUS has been increasing year by year, especially in the last few years. The citations of SUS publications in the three most recent years still needs time to catch up to earlier years. SUS itself, China and Chinese Academy of Science paid more attention than others to SUS publications. In terms of highly cited papers, the review papers exhibit better performance.
- (2)
- China, the USA and South Korea are the most active countries in SUS publications. Chinese and Korean institutes have a significant influential impact on SUS publications. International co-authorship plays a critical role in scientific research cooperation in sustainability.
- (3)
- Ref. [54] is the most highly cited reference. SUS itself is the most highly cited journal, and energy related journals make great contributions to the highly cited journals.
- (4)
- The keywords “sustainability”, “management” and “China” are the most frequently observed keywords in SUS publications. “Community” has the strongest citation burst. “Risk”, “environmental impact”, and “challenge” are the nearest citation bursts.
This paper provides a comprehensive overview of the SUS journal. It is hoped that the research results will contribute to the domains related to sustainable science and environmental science. Generally, the study of this paper is of guiding significance to identify the development direction of the journal. In future, we shall pay attention to the specific research directions related to sustainability.
Author Contributions
The research was designed and performed by M.T. and J.L. The data were collected and analyzed by M.T. and J.L. The paper was written by M.T. and J.L., and finally checked and revised by Z.W., Enrique Herrera-Viedma and Marc A. Rosen. All authors read and approved the final manuscript.
Acknowledgments
The work was supported in part by the National Natural Science Foundation of China (Nos. 71771156 and 71501135), the Scientific Research Foundation for Excellent Young Scholars at Sichuan University (No. 2016SCU04A23), and the PetroChina Innovation Foundation (No. 2015D-5006-0607).
Conflicts of Interest
The authors declare no conflict of interest.
References
- Moed, H.F.; De Bruin, R.E.; Van Leeuwen, T.N. New bibliometric tools for the assessment of national research performance: Database description, overview of indicators and first applications. Scientometrics 1995, 33, 381–422. [Google Scholar] [CrossRef]
- Albort-Morant, G.; Henseler, J.; Leal-Millán, A.; Cepeda-Carrión, G. Mapping the field: A bibliometric analysis of green innovation. Sustainability 2017, 9. [Google Scholar] [CrossRef]
- Liao, H.C.; Tang, M.; Luo, L.; Li, C.Y.; Chiclana, F.; Zeng, X.J. A bibliometric analysis and visualization of medical big data research. Sustainability 2017, 10. [Google Scholar] [CrossRef]
- Taticchi, P.; Garengo, P.; Nudurupati, S.S.; Tonelli, F.; Pasqualino, R. A review of decision-support tools and performance measurement and sustainable supply chain management. Int. J. Prod. Res. 2015, 53, 6473–6494. [Google Scholar] [CrossRef]
- Hsieh, P.N.; Chang, P.L. An assessment of world-wide research productivity in production and operations management. Int. J. Prod. Econ. 2009, 120, 540–551. [Google Scholar] [CrossRef]
- Liu, W.S.; Liao, H.C. A bibliometric analysis of fuzzy decision research during 1970–2015. Int. J. Fuzzy Syst. 2017, 19, 1–14. [Google Scholar] [CrossRef]
- Schwert, G.W. The journal of financial economics: A retrospective evaluation (1974–1991). J. Financ. Econ. 1993, 33, 369–424. [Google Scholar] [CrossRef]
- Cobo, M.J.; Martínez, M.A.; Gutiérrez-Salcedo, M.; Fujita, H.; Herrera-Viedma, E. 25 years at Knowledge-Based Systems: A bibliometric analysis. Knowl.-Based Syst. 2015, 80, 3–13. [Google Scholar] [CrossRef]
- Merigó, J.M.; Pedrycz, W.; Weber, R.; de la Sotta, C. Fifty years of information sciences: A bibliometric overview. Inform. Sci. 2018, 432, 245–268. [Google Scholar] [CrossRef]
- Yu, D.J.; Xu, Z.S.; Pedrycz, W.; Wang, W.R. Information Sciences 1968–2016: A retrospective analysis with text mining and bibliometric. Inform. Sci. 2017, 418–419, 619–634. [Google Scholar] [CrossRef]
- Tang, M.; Liao, H.C.; Su, S.F. A bibliometric overview and visualization of the International Journal of Fuzzy Systems between 2007 and 2017. Int. J. Fuzzy Syst. 2018. [Google Scholar] [CrossRef]
- Jia, F.; Jiang, Y. Sustainable Global Sourcing: A systematic literature review and bibliometric analysis. Sustainability 2018, 10. [Google Scholar] [CrossRef]
- De la Cruz-Lovera, C.; Perea-Moreno, A.J.; de la Cruz-Fernandez, J.L.; Alvarez-Bermejo, J.A.; Manzano-Agugliaro, F. Worldwide research on energy efficiency and sustainability in public buildings. Sustainability 2017, 9. [Google Scholar] [CrossRef]
- Osareh, F. Bibliometrics, citation analysis and co-citation analysis: A review of literature I. Libri 2009, 49, 149–158. [Google Scholar] [CrossRef]
- Hirsch, J.E. An index to quantify an individual’s scientific research output. Proc. Natl. Acad. Sci. USA 2005, 102, 16569–16572. [Google Scholar] [CrossRef] [PubMed] [Green Version]
- Noyons, E.C.M.; Moed, H.F.; Luwel, M. Combining mapping and citation analysis for evaluative bibliometric purposes: A bibliometric study. J. Assoc. Inf. Sci. Technol. 1999, 50, 115–131. [Google Scholar] [CrossRef]
- Van Eck, N.J.; Waltman, L. Software survey: VOSviewer, a computer program for bibliometric mapping. Scientometrics 2010, 84, 523–538. [Google Scholar] [CrossRef] [PubMed]
- Chen, C.M. CiteSpace II: Detecting and visualizing emerging trends and transient patterns in scientific literature. J. Am. Soc. Inf. Sci. Technol. 2006, 57, 359–377. [Google Scholar] [CrossRef]
- Kleinberg, J. Bursty and hierarchical structure in streams. Data Min. Knowl. Discov. 2003, 7, 373–397. [Google Scholar] [CrossRef]
- Brown, L.D.; Gardner, J.C. Using citation analysis to assess the impact of journals and articles on contemporary accounting research (CAR). J. Account. Res. 1985, 23, 84–109. [Google Scholar] [CrossRef]
- Finkbeiner, M.; Schau, E.M.; Lehmann, A.; Traverso, M. Towards life cycle sustainability assessment. Sustainability 2010, 2, 3309–3322. [Google Scholar] [CrossRef]
- Dixit, R.; Malaviya, D.; Pandiyan, K.; Singh, U.B.; Sahu, A.; Shukla, R.; Singh, B.P.; Rai, J.P.; Sharma, P.K.; Lade, H.; et al. Bioremediation of heavy metals from soil and aquatic environment: An overview of principles and criteria of fundamental processes. Sustainability 2015, 7, 2189–2212. [Google Scholar] [CrossRef]
- Berger, M.; Finkbeiner, M. Water footprinting: How to address water use in life cycle assessment? Sustainability 2010, 2, 919–944. [Google Scholar] [CrossRef]
- Cordell, D.; White, S. Peak phosphorus: Clarifying the key issues of a vigorous debate about long-term phosphorus security. Sustainability 2011, 3, 2017–2049. [Google Scholar] [CrossRef]
- Walker, W.E.; Haasnoot, M.; Kwakkel, J.H. Adapt or perish: A review of planning approaches for adaptation under deep uncertainty. Sustainability 2013, 5, 955–979. [Google Scholar] [CrossRef]
- Shrestha, G.; Traina, S.J.; Swanston, C.W. Black carbon’s properties and role in the environment: A comprehensive review. Sustainability 2010, 2, 294–320. [Google Scholar] [CrossRef]
- McCormick, K.; Kautto, N. The bioeconomy in Europe: An overview. Sustainability 2013, 5, 2589–2608. [Google Scholar] [CrossRef]
- Frison, E.A.; Cherfas, J.; Hodgkin, T. Agricultural biodiversity is essential for a sustainable improvement in food and nutrition security. Sustainability 2011, 3, 238–253. [Google Scholar] [CrossRef]
- Murphy, D.J.; Hall, C.A.S.; Dale, M. Order from chaos: A preliminary protocol for determining the EROI of fuels. Sustainability 2011, 3, 1888–1907. [Google Scholar] [CrossRef]
- Halog, A.; Manik, Y. Advancing integrated systems modelling framework for life cycle sustainability assessment. Sustainability 2011, 3, 469–499. [Google Scholar] [CrossRef]
- Khasreen, M.M.; Banfill, P.F.G.; Menzies, G.F. Life-cycle assessment and the environmental impact of buildings: A review. Sustainability 2009, 1, 674–701. [Google Scholar] [CrossRef] [Green Version]
- Lam, C.H.K.; Ip, A.W.M.; Barford, J.P.; McKay, G. Use of incineration MSW ash: A review. Sustainability 2010, 2, 1943–1968. [Google Scholar] [CrossRef]
- Malesev, M.; Radonjanin, V.; Marinkovic, S. Recycled concrete as aggregate for structural concrete production. Sustainability 2010, 2, 1204–1225. [Google Scholar] [CrossRef]
- Howard, P.H. Visualizing consolidation in the global seed industry: 1996–2008. Sustainability 2009, 1, 1266–1287. [Google Scholar] [CrossRef]
- Hirel, B.; Tetu, T.; Lea, P.J.; Dubois, F. Improving nitrogen use efficiency in crops for sustainable agriculture. Sustainability 2011, 3, 1452–1485. [Google Scholar] [CrossRef]
- Wood, R.; Stadler, K.; Bulavskaya, T.; Lutter, S.; Giljum, S.; de Koning, A.; Kuenen, J.; Schuetz, H.; Acosta-Fernandez, J.; Usubiaga, A.; et al. Global sustainability accounting-Developing EXIOBASE for multi-regional footprint analysis. Sustainability 2015, 7, 138–163. [Google Scholar] [CrossRef] [Green Version]
- Carpenter, S.R.; Arrow, K.J.; Barrett, S.; Biggs, R.; Brock, W.A.; Crepin, A.S.; Engstrom, G.; Folke, C.; Hughes, T.P.; Kautsky, N.; et al. General resilience to cope with extreme events. Sustainability 2012, 4, 3248–3259. [Google Scholar] [CrossRef]
- Benoit-Norris, C.; Cavan, D.A.; Norris, G. Identifying social impacts in product supply chains: Overview and application of the social hotspot database. Sustainability 2012, 4, 1946–1965. [Google Scholar] [CrossRef]
- Waas, T.; Huge, J.; Verbruggen, A.; Wright, T. Sustainable development: A bird’s eye view. Sustainability 2011, 3, 1637–1661. [Google Scholar] [CrossRef]
- Staffas, L.; Gustavsson, M.; McCormick, K. Strategies and policies for the bioeconomy and bio-based economy: An analysis of official national approaches. Sustainability 2013, 5, 2751–2769. [Google Scholar] [CrossRef]
- Guilford, M.C.; Hall, C.A.S.; O’Connor, P.; Cleveland, C.J. A new long term assessment of energy return on investment (EROI) for US oil and gas discovery and production. Sustainability 2011, 3, 1866–1887. [Google Scholar] [CrossRef]
- Storey, K. Fly-in/fly-out: Implications for community sustainability. Sustainability 2010, 2, 1161–1181. [Google Scholar] [CrossRef]
- Withers, P.J.A.; Neal, C.; Jarvie, H.P.; Doody, D.G. Agriculture and eutrophication: Where do we go from here? Sustainability 2014, 6, 5853–5875. [Google Scholar] [CrossRef] [Green Version]
- Rosen, M.A.; Kishawy, H.A. Sustainable manufacturing and design: Concepts, practices and needs. Sustainability 2012, 4, 154–174. [Google Scholar] [CrossRef]
- Stillwell, A.S.; Hoppock, D.C.; Webber, M.E. Energy recovery from wastewater treatment plants in the United States: A case study of the energy-water nexus. Sustainability 2010, 2, 945–962. [Google Scholar] [CrossRef]
- Adami, M.; Rudorff, B.F.T.; Freitas, R.M.; Aguiar, D.A.; Sugawara, L.M.; Mello, M.P. Remote sensing time series to evaluate direct land use change of recent expanded sugarcane crop in Brazil. Sustainability 2012, 4, 574–585. [Google Scholar] [CrossRef]
- Stock, P.; Burton, R.J.F. Defining terms for integrated (multi-inter-trans-disciplinary) sustainability research. Sustainability 2011, 3, 1090–1111. [Google Scholar] [CrossRef] [Green Version]
- Aschemann-Witzel, J.; de Hooge, I.; Amani, P.; Bech-Larsen, T.; Oostindjer, M. Consumer-related food waste: Causes and potential for action. Sustainability 2015, 7, 6457–6477. [Google Scholar] [CrossRef] [Green Version]
- Lal, R. Restoring soil quality to mitigate soil degradation. Sustainability 2011, 3, 1796–1809. [Google Scholar] [CrossRef]
- Gupta, A.K.; Hall, C.A.S. A review of the past and current state of EROI data. Sustainability 2011, 3, 1796–1809. [Google Scholar] [CrossRef]
- Leydesdorff, L.; Wagner, C.S. International collaboration in science and the formation of a core group. J. Informetr. 2008, 2, 317–325. [Google Scholar] [CrossRef]
- Persson, O.; Glanzel, W.; Danell, R. Inflationary bibliometrics values: The role of scientific collaboration and the need for relative indicators in evaluative studies. Scientometrics 2004, 60, 421–432. [Google Scholar] [CrossRef]
- Small, H. Co-citation in scientific literature—New measure of relationship between 2 documents. J. Am. Soc. Inform. Sci. 1973, 24, 265–269. [Google Scholar] [CrossRef]
- Fornell, C.; Larcker, D.F. Evaluating structural equation models with unobservable variables and measurement error. J. Market. Res. 1981, 18, 39–50. [Google Scholar] [CrossRef]
- Charnes, A.; Cooper, W.W.; Rhodes, E. Measuring efficiency of decision-making units. Eur. J. Oper. Res. 1978, 2, 429–444. [Google Scholar] [CrossRef]
- Costanza, R.; d’Arge, R.; de Groot, R.; Farber, S.; Grasso, M.; Hannon, B.; Limburg, K.; Naeem, S.; ONeill, R.V.; Paruelo, J.; et al. The value of the world’s ecosystem services and natural capital. Nature 1997, 387, 253–260. [Google Scholar] [CrossRef]
- Ajzen, I. The theory of planned behavior. Organ. Behav. Hum. Dec. 1991, 50, 179–211. [Google Scholar] [CrossRef]
- Rockstrom, J.; Steffen, W.; Noone, K.; Persson, A.; Chapin, F.S.; Lambin, E.F.; Lenton, T.M.; Scheffer, M.; Folke, C.; Schellnhuber, H.J.; et al. A safe operating space for humanity. Nature 2009, 461, 472–475. [Google Scholar] [CrossRef] [PubMed]
- Ostrom, E. A general framework for analyzing sustainability of social-ecological systems. Science 2009, 325, 419–422. [Google Scholar] [CrossRef] [PubMed]
- Seuring, S.; Mueller, M. From a literature review to a conceptual framework for sustainable supply chain management. J. Clean. Prod. 2008, 16, 1699–1710. [Google Scholar] [CrossRef]
- Foley, J.A.; DeFries, R.; Asner, G.P.; Barford, C.; Bonan, G.; Carpenter, S.R.; Chapin, F.S.; Coe, M.T.; Daily, G.C.; Gibbs, H.K.; et al. Global consequences of land use. Science 2005, 309, 570–574. [Google Scholar] [CrossRef] [PubMed]
- Stem, P.C. Toward a coherent theory of environmentally significant behavior. J. Soc. Issues 2000, 56, 407–424. [Google Scholar]
- Porter, M.E.; Vanderlinde, C. Toward a new conception of the environment-competitiveness relationship. J. Econ. Perspect. 1995, 9, 97–118. [Google Scholar] [CrossRef]
- Liu, X.J.; Zhan, F.B.; Hong, S.; Niu, B.B.; Liu, Y.L. A bibliometric study of earthquake research: 1900–2010. Scientometrics 2012, 92, 747–765. [Google Scholar] [CrossRef]
- Li, H.J.; An, H.Z.; Wang, Y.; Huang, J.C.; Gao, X.Y. Evolutionary features of academic articles co-keyword network and keywords co-occurrence network: Based on two-mode affiliation network. Phys. A 2016, 450, 657–669. [Google Scholar] [CrossRef]
- Jiang, L.; Yang, Y.Q. Visualization of international environmental DNA research. Curr. Sci. 2017, 112, 1659–1664. [Google Scholar] [CrossRef]
- Pu, B.; Qiu, Y.J. A bibliometric analysis on urbanization research from 1984 to 2013. Open House Int. 2015, 40, 37–43. [Google Scholar]
Figure 1.
Distribution of publications in Sustainability (SUS) by year from 2009 to 2018 (2 March).

Figure 2.
Global distribution of SUS publications from 2009 to 2018.

Figure 3.
Global distribution of SUS publications from 2009 to 2013.

Figure 4.
Global distribution of SUS publications from 2014 to 2018.

Figure 5.
International country co-authorship network of SUS publications from 2009 to 2018.

Figure 6.
Institute co-authorship network of SUS publications.

Figure 7.
Reference co-citation network of SUS publications from 2009 to 2018.

Figure 8.
Journal co-citation network.

Figure 9.
Author co-citation network.

Figure 10.
Keywords co-occurrence network.


Table 1.
Annual citation structure of the publications in SUS.
| Year | ≥100 | ≥50 | ≥20 | ≥10 | ≥1 | TP | TC | AC | H-Index |
|---|---|---|---|---|---|---|---|---|---|
| 2009 | 0 | 2 | 8 | 18 | 56 | 64 | 593 | 9.27 | 14 |
| 2010 | 3 | 7 | 18 | 44 | 129 | 138 | 1690 | 12.25 | 19 |
| 2011 | 2 | 7 | 29 | 58 | 122 | 128 | 2012 | 15.72 | 25 |
| 2012 | 0 | 3 | 19 | 49 | 166 | 175 | 1490 | 8.51 | 19 |
| 2013 | 2 | 3 | 13 | 87 | 265 | 293 | 2336 | 7.97 | 19 |
| 2014 | 0 | 1 | 34 | 143 | 493 | 532 | 3901 | 7.33 | 22 |
| 2015 | 0 | 2 | 25 | 123 | 766 | 848 | 4441 | 5.24 | 21 |
| 2016 | 0 | 0 | 4 | 23 | 980 | 1357 | 2837 | 2.09 | 12 |
| 2017 | 0 | 0 | 0 | 4 | 880 | 2391 | 1444 | 0.60 | 7 |
| 2018 | 0 | 0 | 0 | 0 | 26 | 572 | 27 | 0.05 | 1 |
| Total | 7 | 25 | 150 | 549 | 3883 | 6459 | 20,545 | 39 | |
| Percentage | 0.11% | 0.39% | 2.32% | 8.50% | 60.12% |
TP: Total publications; TC: Total citations; AC: Average citations per paper.
Table 2.
Sources that cite SUS publications.
| Rank | Journal | TP | Country/Region | TP | Institute | TP |
|---|---|---|---|---|---|---|
| 1 | Sustainability | 2496 | China | 2930 | Chinese Academy of Science | 493 |
| 2 | Journal of Cleaner Production | 658 | USA | 2457 | University of Chinese Academy of Science, CAS | 235 |
| 3 | Energies | 203 | Italy | 1286 | Institute of Geographic Sciences Natural Resources Research, CAS | 206 |
| 4 | Renewable Sustainable Energy Reviews | 188 | England | 978 | Wageningen University & Research | 167 |
| 5 | Science of Total Environment | 125 | Germany | 977 | University of California System | 150 |
| 6 | International Journal of Life Cycle Assessment | 115 | Australia | 838 | Sapienza University of Rome | 136 |
| 7 | Energy Policy | 112 | Spain | 745 | United States Department of Agriculture | 133 |
| 8 | Water | 112 | Canada | 633 | Beijing Normal University | 124 |
| 9 | Applied Energy | 109 | Netherlands | 625 | Helmholtz Association | 115 |
| 10 | Ecological Economics | 100 | Sweden | 509 | Arizona State University | 108 |
| 11 | Plos One | 97 | South Korea | 492 | National Institute of Agricultural Research | 104 |
| 12 | Energy and Buildings | 94 | France | 442 | National Centre for Scientific Research | 101 |
| 13 | Energy | 90 | Brazil | 385 | University of Perugia | 101 |
| 14 | Ecological Indicators | 87 | India | 343 | University of London | 95 |
| 15 | Journal of Environmental Management | 85 | Japan | 302 | State University System of Florida | 89 |
| 16 | Energy Procedia | 84 | Switzerland | 255 | North China Electric Power University | 88 |
| 17 | Resources Conservation and Recycling | 82 | Taiwan | 241 | Delft University of Technology | 86 |
| 18 | Waste Management | 75 | Romania | 239 | Tsinghua University | 85 |
| 19 | Land Use Policy | 72 | Belgium | 234 | Wuhan University | 81 |
| 20 | Environmental Science Technology | 69 | Malaysia | 234 | ETH Zurich | 79 |
| 21 | Ecology and Society | 64 | Finland | 233 | University of Naples Federico II | 79 |
| 22 | Construction and Building Materials | 59 | Denmark | 231 | Ghent University | 76 |
| 23 | International Journal of Environmental Research and Public Health | 57 | South Africa | 224 | Pennsylvania Commonwealth System of Higher Education | 76 |
| 24 | Remote Sensing | 57 | Turkey | 211 | Zhejiang University | 75 |
| 25 | Current Opinion in Environmental Sustainability | 56 | Iran | 209 | Lund University | 72 |
| 26 | Building and Environment | 55 | Norway | 206 | University of North Carolina | 72 |
| 27 | Environmental Science and Pollution Research | 54 | Poland | 203 | Commonwealth Scientific & Industrial Research Organization | 71 |
| 28 | Environmental Science Policy | 51 | Portugal | 202 | Utrecht University | 71 |
| 29 | Habitat International | 47 | Austria | 197 | Hong Kong Polytechnic University | 70 |
| 30 | Isprs International Journal of Geo-Information | 46 | Mexico | 154 | Shanghai Jiao Tong University | 70 |
TP: Total Publications.
Table 3.
Top 30 highly cited papers in SUS.
| Title | Author(s) | Year | Citations | AC | |
|---|---|---|---|---|---|
| 1 | Towards life-cycle sustainability assessment [21] | Finkbeiner, M.; Schau, E.M.; Lehmann, A.; Traverso, M. | 2010 | 162 | 18.00 |
| 2 | Water footprinting: how to address water use in life-cycle assessment? [23] | Berger, M.; Finkbeiner, M. | 2010 | 121 | 13.44 |
| 3 | Peak phosphorus: clarifying the key issues of a vigorous debate about long-term phosphorus security [24] | Cordell, D.; White, S. | 2011 | 118 | 14.75 |
| 4 | Adapt or perish: a review of planning approaches for adaptation under deep uncertainty [25] | Walker, W.E.; Haasnoot, M.; Kwakkel, J.H. | 2013 | 105 | 17.50 |
| 5 | Black carbon’s properties and role in the environment: a comprehensive review [26] | Shrestha, G.; Traina, S.J.; Swanston, C.W. | 2010 | 102 | 11.33 |
| 6 | The bioeconomy in Europe: an overview [27] | McCormick, K.; Kautto, N. | 2013 | 101 | 16.83 |
| 7 | Agricultural biodiversity is essential for a sustainable improvement in food and nutrition security [28] | Frison, E.A.; Cherfas, J.; Hodgkin, T. | 2011 | 101 | 12.63 |
| 8 | Order from chaos: a preliminary protocol for determining the EROI of fuels [29] | Murphy, D.J.; Hall, C.A.S.; Dale, N.; Cleveland, C. | 2011 | 95 | 11.88 |
| 9 | Advancing integrated systems modelling framework for life cycle sustainability assessment [30] | Halog, A.; Manik, Y. | 2011 | 91 | 11.38 |
| 10 | Bioremediation of heavy metals from soil and aquatic environment: an overview of principles and criteria of fundamental processes [22] | Dixit, R.; Wasiullah; Malaviya, D.; Pandiyan, K.; Singh, U.B.; Sahu, A.; Shukla, R.; Singh, B.P.; Rai, J.P.; Sharma, P.K.; Lade, H.; Paul, D. | 2015 | 81 | 20.25 |
| 11 | Life-cycle assessment and the environmental impact of buildings: a review [31] | Khasreen, M.M.; Banfill, P.F.G.; Menzies, G.F. | 2009 | 75 | 7.50 |
| 12 | Use of incineration MSW ash: a review [32] | Lam, C.H.K.; Ip, A.W.M.; Barford, J.P.; McKay, G. | 2010 | 74 | 8.22 |
| 13 | Recycled concrete as aggregate for structural concrete production [33] | Malesev, M.; Radonjanin, V.; Marinkovic, S. | 2010 | 74 | 8.22 |
| 14 | Visualizing consolidation in the global seed industry: 1996-2008 [34] | Howard, P.H. | 2009 | 72 | 7.20 |
| 15 | Improving nitrogen use efficiency in crops for sustainable agriculture [35] | Hirel, B.; Tetu, T; Lea, P.L.; Dubois, F. | 2011 | 71 | 8.88 |
| 16 | Global sustainability accounting-Developing EXIOBASE for multi-regional footprint analysis [36] | Wood, R.; Stadler, K.; Bulavskaya, T.; Lutter, S.; Giljum, S.; de Koning, A.; Kuenen, J.; Schuetz, H.; Acosta-Fernandez, J.; Usubiaga, A.; Simas, M.; Ivanova, O.; Weinzettel, J.; Schmidt, J.H.; Merciai, S.; Tukker, A. | 2015 | 69 | 17.25 |
| 17 | General resilience to cope with extreme events [37] | Carpenter, S.R.; Arrow, K.J.; Barrett, S.; Biggs, R.; Brock, W.A.; Crepin, A.S.; Engstrom, G.; Folke, C.; Hughes, T.P.; Kautsky, N.; Li, C.Z.; McCarney, G.; Meng, K.; Maler, K.G.; Polasky, S.; Scheffer, M; Shogren, J.; Sterner, T.; Vincent, J.R.; Walker, B.; Xepapadeas, A.; de Zeeuw, A. | 2012 | 69 | 9.86 |
| 18 | Identifying social impacts in product supply chains: overview and application of the social hotspot database [38] | Benoit-Norris, C.; Cavan, D.A.; Norris, G. | 2012 | 68 | 9.71 |
| 19 | Sustainable development: a bird’s eye view [39] | Waas, T.; Huge, J.; Verbruggen, A.; Wright, T. | 2011 | 68 | 8.50 |
| 20 | Strategies and policies for the bioeconomy and bio-based economy: an analysis of official national approaches [40] | Staffas, L.; Gustavsson, M.; McCormick, K. | 2013 | 67 | 11.77 |
| 21 | A new long term assessment of energy return on investment (EROI) for US oil and gas discovery and production [41] | Guilford, M.C.; Hall, C.A.S.; O’Connor, P.; Cleveland, C.J. | 2011 | 63 | 7.88 |
| 22 | Fly-in/fly-out: Implications for community sustainability [42] | Storey, K. | 2010 | 62 | 6.89 |
| 23 | Agriculture and eutrophication: where do we go from here? [43] | Withers, P.J.A.; Neal, C.; Jarvie, H.P.; Doody, D.G. | 2014 | 54 | 10.80 |
| 24 | Sustainable manufacturing and design: concepts, practices and needs [44] | Rosen, M.A.; Kishawy, H.A. | 2012 | 54 | 7.71 |
| 25 | Energy recovery from wastewater treatment plants in the United States: a case study of the energy-water nexus [45] | Stillwell, A.S.; Hoppock, D.C.; Webber, M.E. | 2010 | 51 | 5.67 |
| 26 | Remote-sensing time series to evaluate direct land use change of recent expanded sugarcane crop in Brazil [46] | Adami, M.; Rudorff, B.F.T.; Freitas, R.M.; Aguiar, D.A.; Sugawara, L.M.; Mello, M.P. | 2012 | 49 | 7.00 |
| 27 | Defining terms for integrated (multi-inter-trans-disciplinary) sustainability research [47] | Stock, P.; Burton, R.J.F. | 2011 | 49 | 6.13 |
| 28 | Consumer-related food waste: causes and potential for action [48] | Aschemann-Witzel, J.; de Hooge, I.; Amani, P.; Bech-Larsen, T.; Oostindjer, M. | 2015 | 47 | 11.75 |
| 29 | Restoring soil quality to mitigate soil degradation [49] | Lal, R. | 2015 | 47 | 11.75 |
| 30 | A review of the past and current state of EROI data [50] | Gupta, A.K.; Hall, C.A.S. | 2011 | 47 | 5.88 |
AC: Average citations per year.
Table 4.
The 30 most productive countries/regions of SUS publications.
| Rank | Country/Region | Total | 2009–2013 | 2013–2018 | ||||||||
|---|---|---|---|---|---|---|---|---|---|---|---|---|
| TP | TC | AC | H | ≥100 | ≥50 | ≥20 | TP | TC | TP | TC | ||
| 1 | China | 1893 | 4053 | 2.14 | 20 | 0 | 1 | 11 | 17 | 207 | 1876 | 3806 |
| 2 | USA | 974 | 4266 | 4.38 | 27 | 1 | 8 | 28 | 245 | 2598 | 729 | 1668 |
| 3 | South Korea | 714 | 1029 | 1.44 | 11 | 0 | 1 | 3 | 1 | 9 | 713 | 1020 |
| 4 | Italy | 564 | 2386 | 4.23 | 19 | 1 | 1 | 18 | 47 | 517 | 517 | 1869 |
| 5 | Germany | 347 | 1668 | 4.81 | 18 | 2 | 3 | 18 | 52 | 748 | 295 | 920 |
| 6 | Spain | 334 | 724 | 2.17 | 12 | 0 | 0 | 3 | 16 | 141 | 318 | 583 |
| 7 | England | 274 | 991 | 3.62 | 15 | 0 | 2 | 12 | 38 | 395 | 236 | 596 |
| 8 | Canada | 247 | 1195 | 4.84 | 16 | 0 | 3 | 12 | 83 | 807 | 164 | 308 |
| 9 | Australia | 243 | 1147 | 4.72 | 17 | 1 | 2 | 10 | 47 | 709 | 196 | 438 |
| 10 | Netherlands | 239 | 1311 | 5.49 | 16 | 1 | 3 | 13 | 36 | 522 | 203 | 789 |
| 11 | Taiwan | 237 | 498 | 2.10 | 9 | 0 | 0 | 2 | 3 | 7 | 234 | 492 |
| 12 | Japan | 200 | 415 | 2.08 | 9 | 0 | 0 | 1 | 31 | 144 | 169 | 271 |
| 13 | Sweden | 190 | 1012 | 5.33 | 15 | 1 | 3 | 8 | 45 | 585 | 145 | 427 |
| 14 | Romania | 138 | 304 | 2.20 | 8 | 0 | 0 | 1 | 4 | 22 | 134 | 282 |
| 15 | Switzerland | 102 | 371 | 3.64 | 11 | 0 | 0 | 3 | 26 | 116 | 76 | 255 |
| 16 | Belgium | 92 | 456 | 4.96 | 12 | 0 | 1 | 3 | 13 | 166 | 79 | 290 |
| 17 | Norway | 91 | 435 | 4.78 | 9 | 0 | 1 | 5 | 18 | 150 | 73 | 285 |
| 18 | South Africa | 83 | 258 | 3.11 | 9 | 0 | 0 | 3 | 6 | 54 | 77 | 204 |
| 19 | Mexico | 81 | 160 | 1.98 | 7 | 0 | 0 | 1 | 12 | 77 | 69 | 83 |
| 20 | Brazil | 74 | 229 | 3.09 | 7 | 0 | 0 | 3 | 13 | 142 | 61 | 87 |
| 21 | France | 74 | 406 | 5.49 | 11 | 0 | 1 | 6 | 17 | 290 | 67 | 116 |
| 22 | Austria | 72 | 295 | 4.10 | 9 | 0 | 1 | 4 | 11 | 139 | 61 | 156 |
| 23 | Portugal | 72 | 221 | 3.07 | 8 | 0 | 0 | 2 | 8 | 90 | 64 | 131 |
| 24 | Finland | 70 | 328 | 4.69 | 11 | 0 | 0 | 4 | 16 | 183 | 54 | 145 |
| 25 | Poland | 67 | 133 | 1.99 | 6 | 0 | 0 | 1 | 1 | 2 | 66 | 131 |
| 26 | Turkey | 67 | 166 | 2.48 | 7 | 0 | 0 | 1 | 2 | 15 | 65 | 151 |
| 27 | Greece | 63 | 212 | 3.37 | 7 | 0 | 1 | 1 | 10 | 123 | 53 | 89 |
| 28 | Denmark | 61 | 345 | 5.66 | 8 | 0 | 1 | 3 | 11 | 56 | 50 | 289 |
| 29 | Malaysia | 60 | 194 | 3.23 | 7 | 0 | 0 | 2 | 3 | 32 | 57 | 162 |
| 30 | Iran | 51 | 122 | 2.39 | 5 | 0 | 0 | 0 | 2 | 5 | 49 | 117 |
TP: Total publications; TC: Total citations.
Table 5.
Top 30 most productive institutes in SUS.
| Rank | Institute | Country/Region | TP | TC | AC | H | ≥100 | ≥50 | ≥20 | ARWU | QS |
|---|---|---|---|---|---|---|---|---|---|---|---|
| 1 | Chinese Academy of Sciences | China | 374 | 957 | 2.56 | 13 | 0 | 0 | 5 | - | - |
| 2 | Beijing Normal University | China | 93 | 302 | 3.25 | 10 | 0 | 0 | 1 | 201–300 | 256 |
| 3 | North China Electric Power University | China | 81 | 239 | 2.95 | 9 | 0 | 0 | 2 | - | - |
| 4 | Wuhan University | China | 75 | 173 | 2.31 | 7 | 0 | 0 | 1 | 201–300 | 282 |
| 5 | Seoul National University | South Korea | 74 | 68 | 0.92 | 4 | 0 | 0 | 0 | 101–150 | 36 |
| 6 | Wageningen University and Research | Netherlands | 64 | 302 | 4.72 | 8 | 0 | 1 | 2 | - | - |
| 7 | Yonsei University | South Korea | 64 | 73 | 1.14 | 5 | 0 | 0 | 0 | 201–300 | 106 |
| 8 | Korea University | South Korea | 61 | 79 | 1.30 | 5 | 0 | 0 | 0 | 201–300 | 90 |
| 9 | Inha University | South Korea | 57 | 144 | 2.53 | 7 | 0 | 0 | 1 | - | 601–650 |
| 10 | Hanyang University | South Korea | 55 | 81 | 1.47 | 4 | 0 | 0 | 0 | 201–300 | 155 |
| 11 | Sapienza University of Rome | Italy | 54 | 371 | 6.87 | 12 | 0 | 0 | 1 | 151–200 | 215 |
| 12 | Tsinghua University | China | 52 | 134 | 2.58 | 7 | 0 | 0 | 1 | 25 | 48 |
| 13 | University of California System | USA | 52 | 142 | 2.73 | 7 | 0 | 0 | 1 | - | - |
| 14 | State University System of Florida | USA | 49 | 118 | 2.41 | 5 | 0 | 0 | 1 | - | - |
| 15 | China University of Geosciences | China | 48 | 120 | 2.50 | 6 | 0 | 0 | 1 | 301–400 | - |
| 16 | Nanjing University | China | 46 | 66 | 1.43 | 5 | 0 | 0 | 0 | 201–300 | 114 |
| 17 | South-east University | China | 46 | 31 | 0.67 | 2 | 0 | 0 | 0 | 201–300 | 501–550 |
| 18 | Zhejiang University | China | 46 | 101 | 2.20 | 6 | 0 | 0 | 1 | 101–150 | 87 |
| 19 | Chongqing University | China | 44 | 98 | 2.23 | 5 | 0 | 0 | 1 | - | 801–1000 |
| 20 | Delft University of Technology | Netherlands | 42 | 218 | 5.19 | 8 | 1 | 1 | 1 | 151–200 | 54 |
| 21 | Jiangxi University of Finance and Economics | China | 42 | 168 | 4.00 | 8 | 0 | 0 | 2 | - | - |
| 22 | United States Department of Agriculture | USA | 42 | 238 | 5.67 | 10 | 0 | 0 | 3 | - | - |
| 23 | The University of Tokyo | Japan | 42 | 87 | 2.07 | 6 | 0 | 0 | 1 | 24 | 28 |
| 24 | Bucharest Academy of Economic Studies | Romania | 41 | 83 | 2.02 | 5 | 0 | 0 | 0 | - | - |
| 25 | University of North Carolina | USA | 41 | 95 | 2.32 | 5 | 0 | 0 | 0 | 33 | 80 |
| 26 | University of Perugia | Italy | 41 | 247 | 6.02 | 9 | 0 | 0 | 3 | - | - |
| 27 | Sungkyunkwan University | South Korea | 37 | 81 | 2.19 | 5 | 0 | 0 | 0 | 201–300 | 108 |
| 28 | University of Ontario Institute of Technology | Canada | 37 | 204 | 5.51 | 8 | 0 | 1 | 1 | - | - |
| 29 | Sichuan University | China | 36 | 61 | 1.69 | 5 | 0 | 0 | 0 | 151–200 | 551–600 |
| 30 | China University of Mining and Technology | China | 36 | 49 | 1.36 | 4 | 0 | 0 | 0 | - | - |
TP: Total publications; TC: Total citations; AC: Average citations per year; H: H-index; ARWU: Academic Ranking of World Universities; QS: Quacquarelli Symonds World University Rankings.
Table 6.
Most cited references by SUS publications from 2009 to 2018.
| R | Authors | Title | Year | Source | Citations | WoSC |
|---|---|---|---|---|---|---|
| 1 | Fornell, C.; Larcker, D.F. | Evaluating structural equation models with unobservable variables and measurement error [54] | 1981 | Journal of Marketing Research | 103 | 18,535 |
| 2 | Charnes, A.; Cooper, W.W.; Rhodes, E. | Measuring efficiency of decision-making units [55] | 1978 | European Journal of Operational Research | 79 | 8784 |
| 3 | Costanza, R.; d’Arge, R.; de Groot, R.; Farber, S.; Grasso, M.; Hannon, B.; Limburg, K.; Naeem, S.; ONeill, R.V.; Paruelo, J.; Raskin, R.G.; Sutton, P.; vandenBelt, M. | The value of the world’s ecosystem services and natural capital [56] | 1997 | Nature | 77 | 6030 |
| 4 | Ajzen, I. | The theory of planned behavior [57] | 1991 | Organizational Behavior and Human Decision Processes | 73 | 18,376 |
| 5 | Rockstrom, J.; Steffen, W.; Noone, K.; Persson, A.; Chapin, F.S.; Lambin, E.F.; Lenton, T.M.; Scheffer, M.; Folke, C.; Schellnhuber, H.J.; Nykvist, B.; de Wit, C.A.; Hughes, T.; van der Leeuw, S.; Rodhe, H.; Sorlin, S.; Snyder, P.K.; Costanza, R.; Svedin, U.; Falkenmark, M.; Karlberg, L.; Corell, R.W.; Fabry, V.J.; Hansen, J.; Walker, B.; Liverman, D.; Richardson, K.; Crutzen, P.; Foley, J.A. | A safe operating space for humanity [58] | 2009 | Nature | 59 | 2704 |
| 6 | Ostrom, E. | A general framework for analyzing sustainability of social-ecological systems [59] | 2009 | Science | 50 | 1569 |
| 7 | Seuring, S.; Mueller, M. | From a literature review to a conceptual framework for sustainable supply-chain management [60] | 2008 | Journal of Cleaner Production | 48 | 1190 |
| 8 | Foley, J.A.; DeFries, R.; Asner, G.P.; Barford, C.; Bonan, G.; Carpenter, S.R.; Chapin, F.S.; Coe, M.T.; Daily, G.C.; Gibbs, H.K.; Helkowski, J.H.; Holloway, T.; Howard, E.A.; Kucharik, C.J.; Monfreda, C.; Patz, J.A.; Prentice, I.C.; Ramankutty, N.; Snyder, P.K. | Global consequences of land use [61] | 2005 | Science | 45 | 3746 |
| 9 | Stem, P.C. | Toward a coherent theory of environmentally significant behavior [62] | 2000 | Journal of Social Issues | 43 | 1725 |
| 10 | Porter, M.E.; Vanderlinde, C. | Toward a new conception of the environment-competitiveness relationship [63] | 1980 | Journal of Economic Perspectives | 42 | 1915 |
R: Rank; WoSC: Web of Sciences Citation.
Table 7.
Top 10 highly cited sources by SUS publications.
| Rank | Source | Citations | Total Link Strength |
|---|---|---|---|
| 1 | Sustainability | 5675 | 91,220 |
| 2 | Journal of Cleaner Production | 4402 | 96,461 |
| 3 | Energy Policy | 3783 | 74,889 |
| 4 | Ecological Economics | 3120 | 64,781 |
| 5 | Renewable Sustainable Energy Reviews | 2420 | 60,042 |
| 6 | Science | 1853 | 35,592 |
| 7 | Landscape and Urban Planning | 1778 | 34,002 |
| 8 | Energy and Buildings | 1668 | 27,576 |
| 9 | Energy | 1494 | 34,719 |
| 10 | Applied Energy | 1427 | 41,253 |
Table 8.
Top 30 keywords of SUS publications.
| Rank | Keyword | Frequency | Rank | Keyword | Frequency |
|---|---|---|---|---|---|
| 1 | sustainability | 797 | 16 | cities | 199 |
| 2 | management | 644 | 17 | perspective | 193 |
| 3 | China | 601 | 18 | industry | 188 |
| 4 | model | 482 | 19 | innovation | 186 |
| 5 | performance | 437 | 20 | growth | 186 |
| 6 | systems | 354 | 21 | ecosystem services | 182 |
| 7 | impact | 335 | 22 | impacts | 179 |
| 8 | sustainable development | 304 | 23 | environment | 170 |
| 9 | climate-change | 293 | 24 | efficiency | 168 |
| 10 | policy | 290 | 25 | design | 167 |
| 11 | energy | 278 | 26 | behaviour | 156 |
| 12 | framework | 267 | 27 | urbanization | 153 |
| 13 | system | 221 | 28 | conservation | 153 |
| 14 | consumption | 204 | 29 | indicators | 152 |
| 15 | governance | 202 | 30 | agriculture | 152 |
Table 9.
Top 27 keywords with the strongest citation bursts.
| Keyword | Strength | Beginning | End | 2009–2018 |
|---|---|---|---|---|
| depletion | 2.71 | 2009 | 2011 | ▂▂▂▂▂▂▂▂▂▂ |
| education | 8.38 | 2009 | 2013 | ▂▂▂▂▂▂▂▂▂▂ |
| fuel | 3.24 | 2009 | 2012 | ▂▂▂▂▂▂▂▂▂▂ |
| United States | 3.70 | 2009 | 2012 | ▂▂▂▂▂▂▂▂▂▂ |
| energy return on investment | 3.39 | 2009 | 2011 | ▂▂▂▂▂▂▂▂▂▂ |
| India | 5.76 | 2009 | 2014 | ▂▂▂▂▂▂▂▂▂▂ |
| poverty | 3.24 | 2009 | 2012 | ▂▂▂▂▂▂▂▂▂▂ |
| resilience | 10.78 | 2009 | 2013 | ▂▂▂▂▂▂▂▂▂▂ |
| net energy | 5.42 | 2009 | 2011 | ▂▂▂▂▂▂▂▂▂▂ |
| life cycle assessment | 4.05 | 2009 | 2012 | ▂▂▂▂▂▂▂▂▂▂ |
| biofuel | 9.96 | 2009 | 2014 | ▂▂▂▂▂▂▂▂▂▂ |
| EROI (energy return on investment) | 10.18 | 2009 | 2011 | ▂▂▂▂▂▂▂▂▂▂ |
| sustainability | 7.11 | 2009 | 2011 | ▂▂▂▂▂▂▂▂▂▂ |
| food security | 10.78 | 2009 | 2013 | ▂▂▂▂▂▂▂▂▂▂ |
| participation | 6.14 | 2012 | 2013 | ▂▂▂▂▂▂▂▂▂▂ |
| adaptation | 14.56 | 2012 | 2014 | ▂▂▂▂▂▂▂▂▂▂ |
| knowledge | 13.99 | 2012 | 2014 | ▂▂▂▂▂▂▂▂▂▂ |
| health | 4.95 | 2012 | 2013 | ▂▂▂▂▂▂▂▂▂▂ |
| vulnerability | 7.56 | 2012 | 2014 | ▂▂▂▂▂▂▂▂▂▂ |
| community | 15.04 | 2012 | 2015 | ▂▂▂▂▂▂▂▂▂▂ |
| water | 7.03 | 2012 | 2014 | ▂▂▂▂▂▂▂▂▂▂ |
| future | 8.38 | 2012 | 2013 | ▂▂▂▂▂▂▂▂▂▂ |
| uncertainty | 9.12 | 2013 | 2014 | ▂▂▂▂▂▂▂▂▂▂ |
| risk | 3.65 | 2014 | 2015 | ▂▂▂▂▂▂▂▂▂▂ |
| environmental impact | 7.20 | 2015 | 2016 | ▂▂▂▂▂▂▂▂▂▂ |
| challenge | 7.54 | 2015 | 2016 | ▂▂▂▂▂▂▂▂▂▂ |
© 2018 by the authors. Licensee MDPI, Basel, Switzerland. This article is an open access article distributed under the terms and conditions of the Creative Commons Attribution (CC BY) license (http://creativecommons.org/licenses/by/4.0/).
Share and Cite
MDPI and ACS Style
Tang, M.; Liao, H.; Wan, Z.; Herrera-Viedma, E.; Rosen, M.A. Ten Years of Sustainability (2009 to 2018): A Bibliometric Overview. Sustainability 2018, 10, 1655. https://doi.org/10.3390/su10051655
AMA Style
Tang M, Liao H, Wan Z, Herrera-Viedma E, Rosen MA. Ten Years of Sustainability (2009 to 2018): A Bibliometric Overview. Sustainability. 2018; 10(5):1655. https://doi.org/10.3390/su10051655
Chicago/Turabian StyleTang, Ming, Huchang Liao, Zhengjun Wan, Enrique Herrera-Viedma, and Marc A. Rosen. 2018. "Ten Years of Sustainability (2009 to 2018): A Bibliometric Overview" Sustainability 10, no. 5: 1655. https://doi.org/10.3390/su10051655
Note that from the first issue of 2016, this journal uses article numbers instead of page numbers. See further details here.