The Prospective of Nuclear Power in China

1
School of Management Science and Engineering, Shanxi University of Finance and Economics, Taiyuan 030006, China
2
Central Research Institute, State Power Investment Corporation, Beijing 102209, China
3
School of Economics and Management, North China Electric Power University, Beijing 102206, China
*
Authors to whom correspondence should be addressed.
Sustainability 2018, 10(6), 2086; https://doi.org/10.3390/su10062086
Submission received: 15 April 2018
/
Revised: 10 June 2018
/
Accepted: 15 June 2018
/
Published: 19 June 2018
(This article belongs to the Section Energy Sustainability)
Abstract
:From scratch to current stage, China’s nuclear power technology has experienced rapid development, and now China has begun to export nuclear power technology. As a kind of highly efficient and clean energy source, nuclear energy is also a priority option to solve energy crisis, replace traditional fossil fuels and reduce air pollution. By analyzing the short-term and long-term development trend of nuclear power in China, the paper has reached the following conclusions: (1) Under the current situation of excess supply, due to high investment cost of first-kind reactors, the decline of utilization hours and the additional cost of ancillary service obligations, the levelized cost of energy (LCOE) of the third generation nuclear power will significantly increase, and the internal rate of return (IRR) will significantly fall. In the short term, market competitiveness of nuclear power will be a major problem, which affects investment enthusiasm. (2) With technology learning of third generation technology, the LCOE of nuclear power will be competitive with that of coal power in 2030. (3) The CO2 emissions reduction potential of nuclear power is greater than coal power with CCS and the avoided CO2 costs of nuclear power is much lower. Therefore, nuclear power is an important option for China’s long-term low-carbon energy system transition. The paper proposes to subsidize the technical learning costs of new technology through clean technology fund at the early commercialization stage. When designing power market rules, the technical characteristics of nuclear power should be fully considered to ensure efficient operation of nuclear power.
1. Introduction
Most of China’s electricity is produced from coal. Rapid growth in demand has given rise to power shortages frequently in China, and the reliance on fossil fuels has led to substantial greenhouse gases (GHG) emissions and serious air pollution. Chronic and widespread smog in the eastern regions of the country is attributed to coal burning. In 2012, China became the world’s largest carbon emitter with –9.64 Gt CO2, and its increment at that year was about 70% of world total increase [1]. In August 2013, the State Council announced that China would reduce its carbon emissions by 40–45% by 2020 from 2005 levels, and would aim to boost non-fossil energy to 15% of its total primary energy consumption by 2020 [2]. In March 2014, China declared a “war on pollution” and would accelerate closing inefficient coal-fired power stations [3]. In November 2014, in the “China-U.S. Joint Presidential Statement on Climate Change”, China officially proposed to peak carbon emissions around 2030, and planned that the proportion of non-fossil energy in primary energy will increase to 20% in 2030 [4]. In addition to a series of domestic environmental protection and pollution control policy documents, China is more active in global climate change governance. In June 2017, Premier Li Keqiang said that the Chinese government has actively participated in the signing of the Paris Agreement, and is the first batch of countries to the United Nations to address climate change program. Premier Li Keqiang also stated that China will continue to fulfill the commitments of the Paris Agreement and contribute to global environmental governance with Chinese wisdom [5].
Wu (2017) discussed the public acceptance of constructing coastal/inland nuclear power plants (NPPs) in China in post-Fukushima period, and revealed that the public still took relatively optimistic attitude although there was a slight decrease just after Fukushima and the public’s confidence recovered four years later [6]. Wang, Ma and Fang (2016) introduced the design philosophy, overall performance, safety, and economics of third generation pressurized water reactors, EPR, AES2006, and CAP1400 [7]. Zeng et al. (2016) analyzed the external environment and historical stages of nuclear power industry in China and proposed policy recommendations from the aspects of industrial distribution optimization, regional resources integration, technical standard system, industrial organization mode and so on [8]. Guo and Guo (2016) simulated the growth rate, development scale and evolvement path of China’s nuclear power by establishing system dynamics models in the new-round construction [9]. Kang, Yao and Zhu (2016) analyzed the variation laws of construction period and construction costs for nuclear power in different period with different technology or the same technology with different reactors [10]. Zhang and Li (2015) illustrated the positive role nuclear power played in reducing CO2 emissions, optimizing energy structure and ensuring energy security. The conclusion is that, when considering the externality of CO2 emissions, if discount rate was as low as 5%, nuclear power would be very competitive [11]. Cai, Wang and Liu (2016) analyzed the causes and impact of the new energy power development and domestic NPPs status. Relevant data and recommendations are proposed for promoting nuclear technology export [12]. Qu (2008) presented the objectives and missions of China’s medium- and long-term nuclear power development program and China’s achievements in technology localization, industry capability, efforts to catch up with world advanced level, and future outlook [13]. Kang et al. (2012) introduced China’s medium- and long-term planning for nuclear and renewable energy, and discussed that the Fukushima accident changes the trajectory of nuclear power development and further affects the China’s strategic of energy structure adjustment [14]. Yuan et al. proposed that nuclear power technology is a good option for energy conservation and emissions reduction in China [15,16,17,18].
Nuclear power has been an important part in China’s national energy strategy due to its safety, reliability characteristics and strong supply capacity. Furthermore, nuclear power as a clean energy source does not emit SO2, NOx and greenhouse gases. However, it should be noted that nuclear waste management has become a dangerous burden, and the nuclear power industry needs to attach great importance to solving the safe disposal of spent fuel.
The purpose of this paper is to conduct a comprehensive assessment on the short-term and long-term development trend of nuclear power in China. Specifically, the first question that is answered is the reason for the lack of investment enthusiasm for nuclear power in the short term. The second contribution is that the LCOE of third generation nuclear power technology will be competitive with that of coal power in 2030. The third contribution is to prove that the nuclear power is an important option for China’s long-term low-carbon energy system transition by comparing the avoided CO2 costs for nuclear power and coal power +CCS. The last contribution is to propose the policy implications to speed up the technology learning and improve the market competitiveness of nuclear power.
The remainder of the paper is organized as follows. Section 2 presents a brief overview of China’s nuclear power industry. Section 3 analyzes the short-term issues of nuclear power development in China. Section 4 presents the long-term prospective of nuclear power in China. Section 5 puts forward policy implications. Section 6 is the conclusion.
2. A Brief Overview of China’s Nuclear Power Industry
2.1. Rapid Growth in Capacity Installation
In the early 1980s, for the first time, the Chinese government developed its nuclear power development policy, and decided to develop the Pressurized Water Reactor (PWR) NPPs. China’s nuclear power industry began to develop since then. In 1991, a 300 MW PWR NPP in Qinshan marked a new step in China’s nuclear industry. In 1994, a 1 GW PWR NPP in Daya Bay was commissioned successfully, representing leapfrog towards international advanced level and the foundation of China’s nuclear power. After the experimental nature of Qinshan and the commercial start-up of Daya Bay, China has built Qinshan II, Lingao, Qinshan III, Tianwan and other NPPs. Through decades of hard work, China’s construction and operation technology has basically entered the mature stage. With the 2011 Fukushima nuclear accident in Japan, China suspended project approval and conducted comprehensive security checks on existing plants. In May 2012, the executive meeting of the state council examined and approved the “Nuclear Safety Inspection Report” and “Nuclear Safety Plan”, and pointed out that China’s civilian nuclear safety and quality was guaranteed, marking the official restart of nuclear power [19].
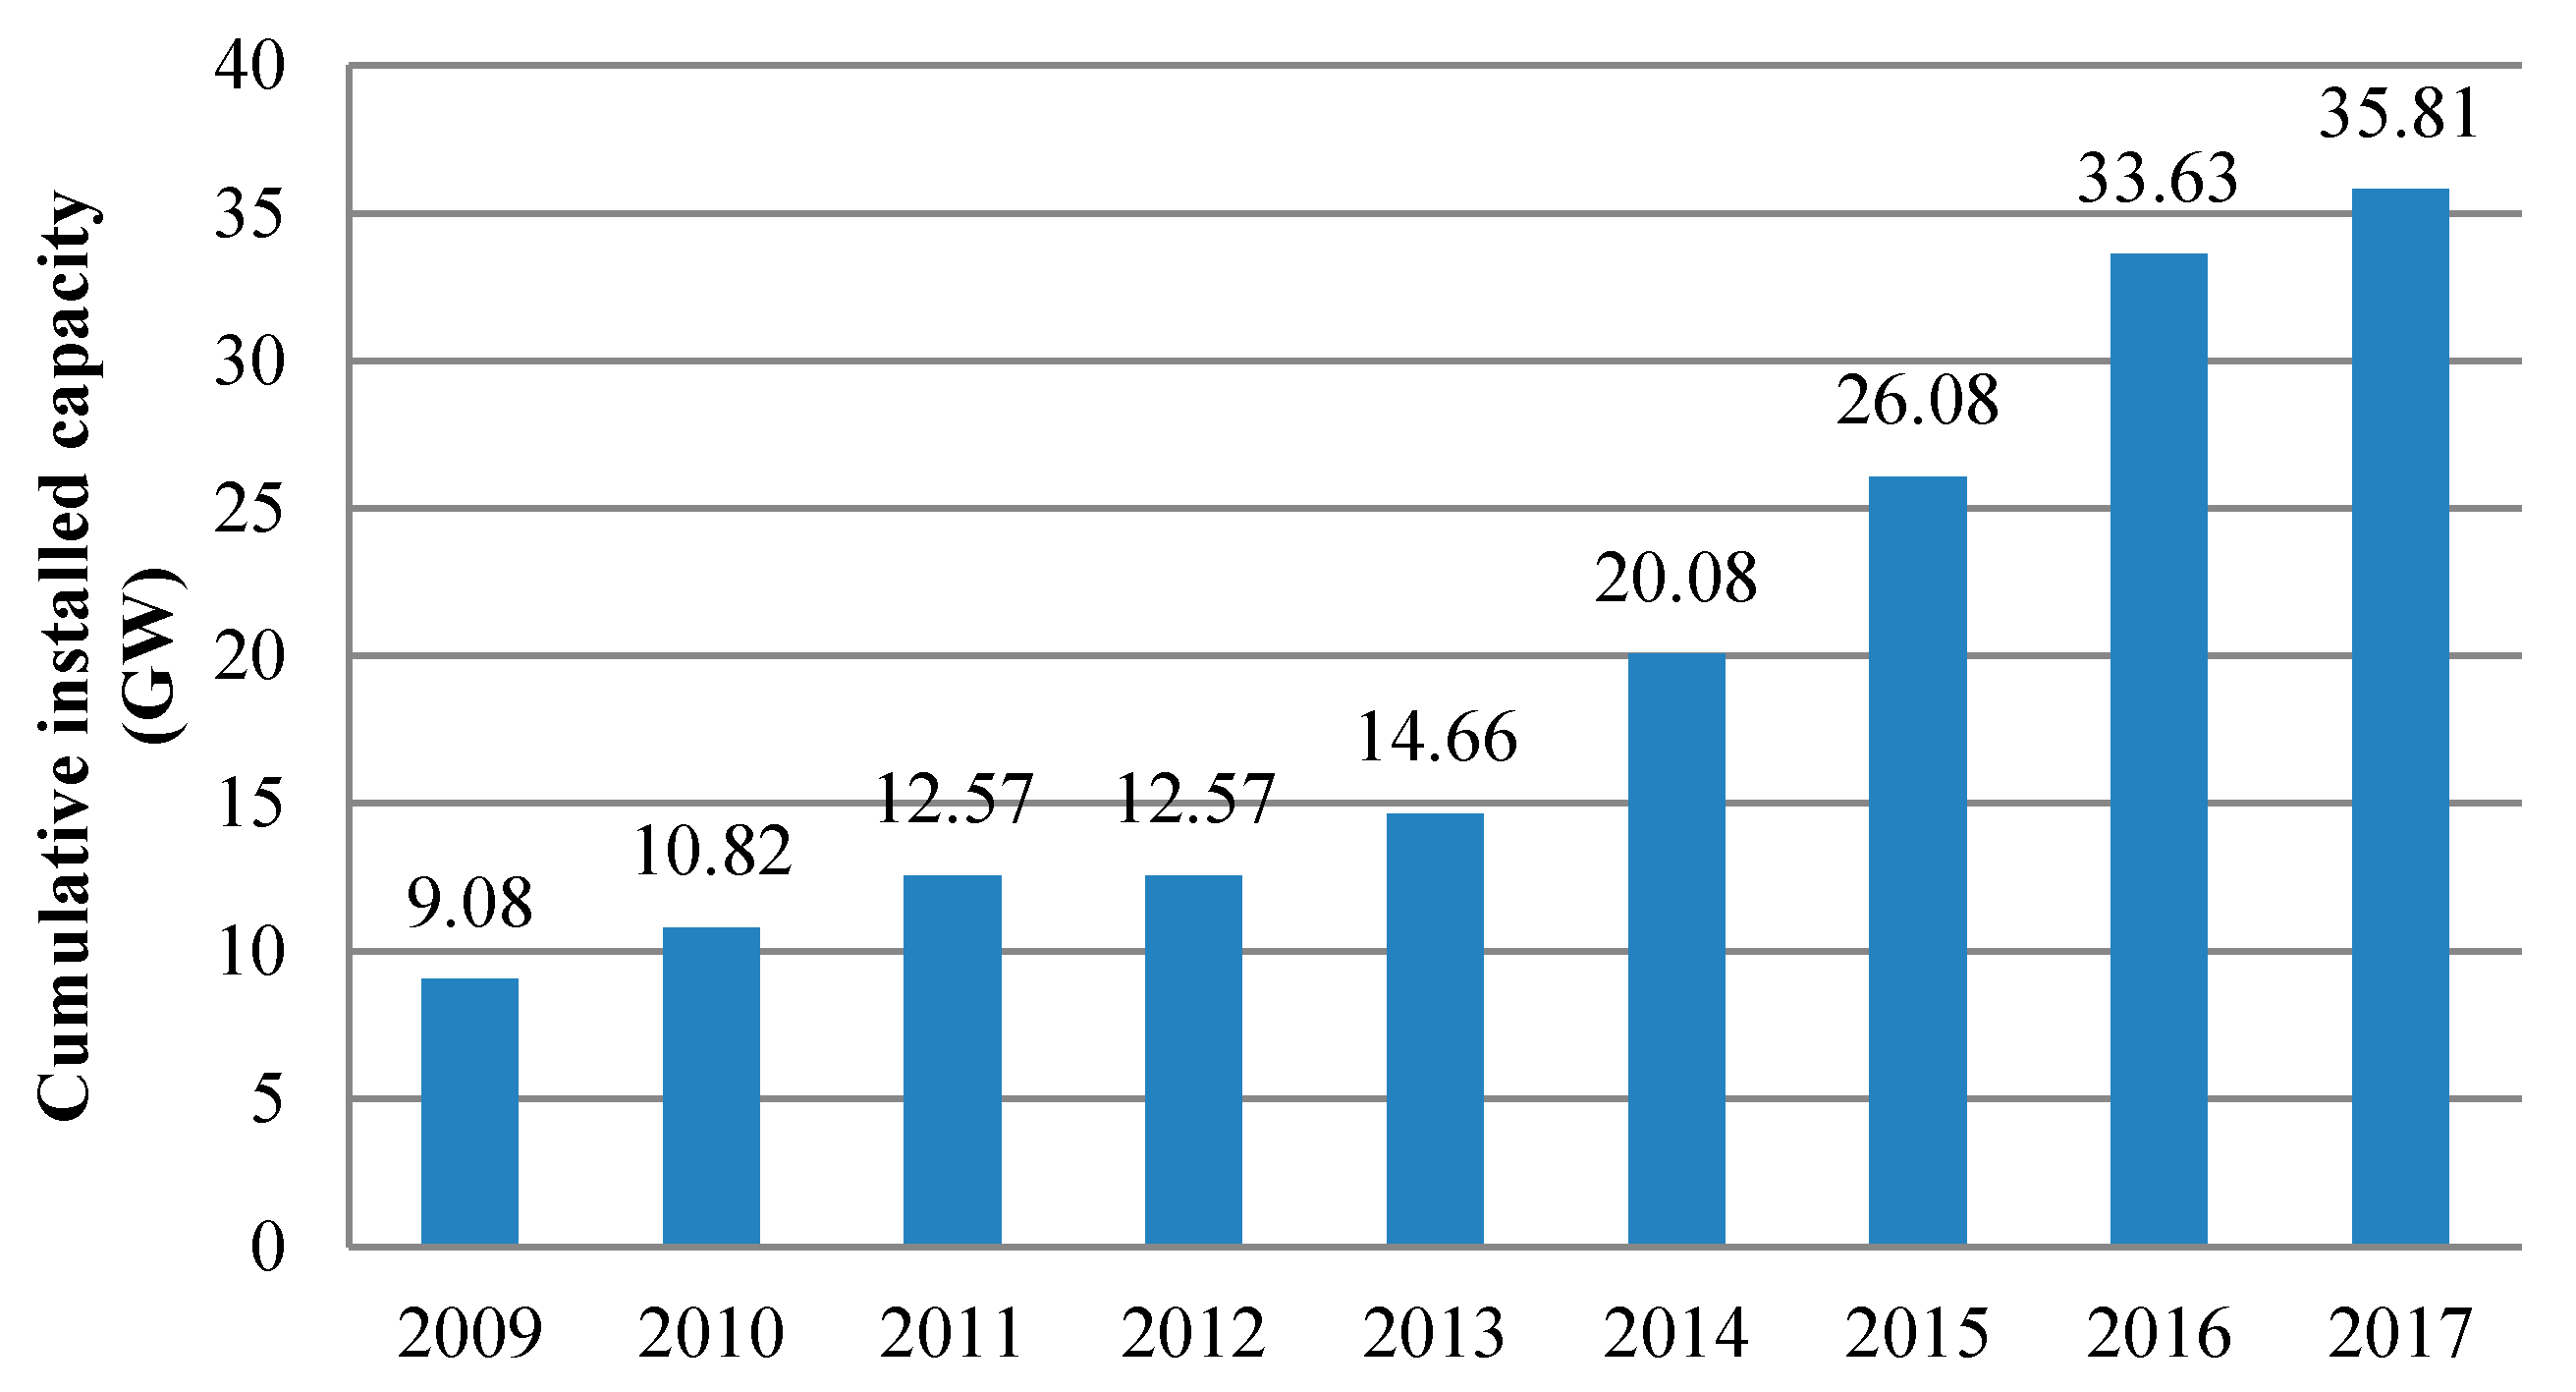
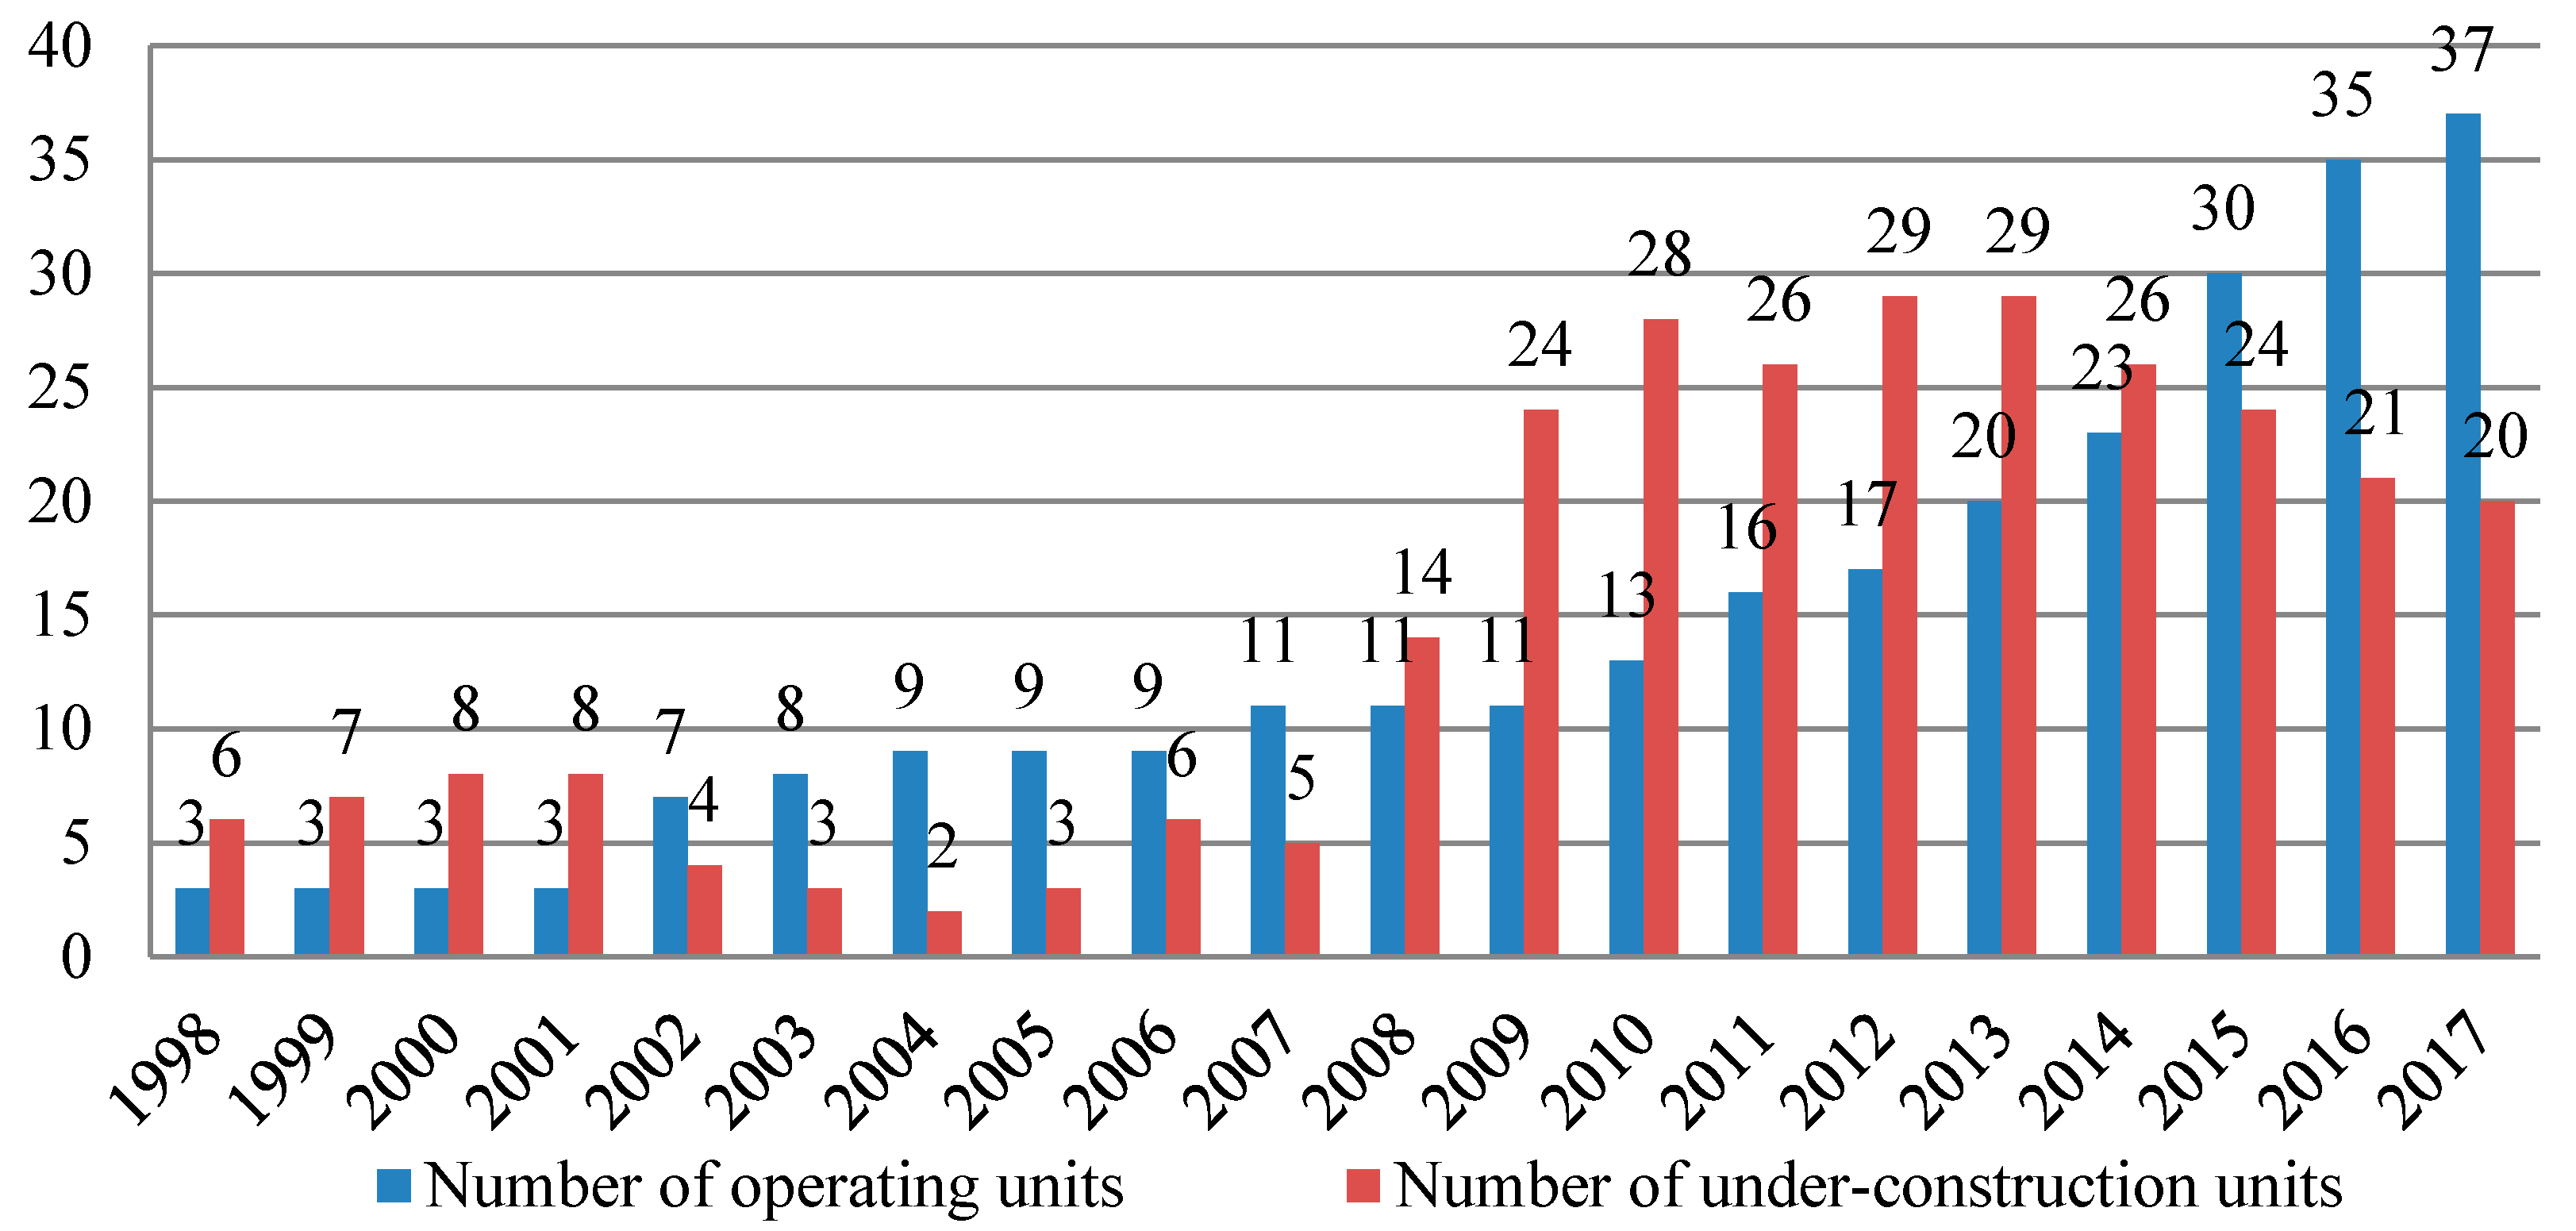
According to the China Nuclear Energy Association (CNEA) statistics, in recent years, the speed of commercialization was significantly faster than before. As shown in Figure 1 and Figure 2, as of the end of 2017, China has put into commercial operation 37 nuclear power reactors, with 35.81 GW capacity at operation, accounting for about 2% of total generation capacity [20].
At present, the enterprises with owners’ identities of nuclear power in China include China General Nuclear Power Corporation (CGN), China National Nuclear Corporation (CNNC) and State Power Investment Corporation (SPIC). The investment pattern of nuclear power is that the central enterprises hold controlling interest and the local state-owned enterprises participate in shares. China accounts for a large proportion of the new NPPs in the world. According to the 13th Five-Year Power Planning, the installed capacity of nuclear power in China will reach 58 GW by 2020 while capacity under construction will reach 30 GW [21]. According to “The Medium and Long term Development Plan of Nuclear Power”, by 2030, the installed capacity will reach 120–150 GW [22]. The report by BMI Research shows that China will vigorously develop nuclear power over the next 10 years, and the installed capacity is expected to nearly double to 100 GW. At present, the strong willingness to reduce coal power generation and to promote clean energy is the driving force of nuclear power. By 2026, China is expected to become the largest nuclear power developer, and coal’s share in total power supply will gradually decrease from the current 70% to slightly less than 54% [23]. The potential of nuclear power is enormous. On the one hand, the mandatory target of clean energy ratio is conducive to expanding the proportion of nuclear power. On the other hand, nuclear power is profitable due to its long service life and sufficient cash flow in the long run.
2.2. Low Share in Total Electricity Production
According to China Nuclear Energy Association (CNEA) statistics, in 2017, the electricity generation of nuclear power was 247.5 TWh, accounting for about 3.94% of total electricity generation, increased by 17.55% compared to 2016 levels (Figure 3). Compared with coal-fired power generation, nuclear power supply in 2017 is equivalent of saving 76.47 million tons standard coal (Mtce) and reducing CO2 emissions by 200.35 million tons, SO2 by 0.65 million tons, and NOx by 0.57 million tons [20].
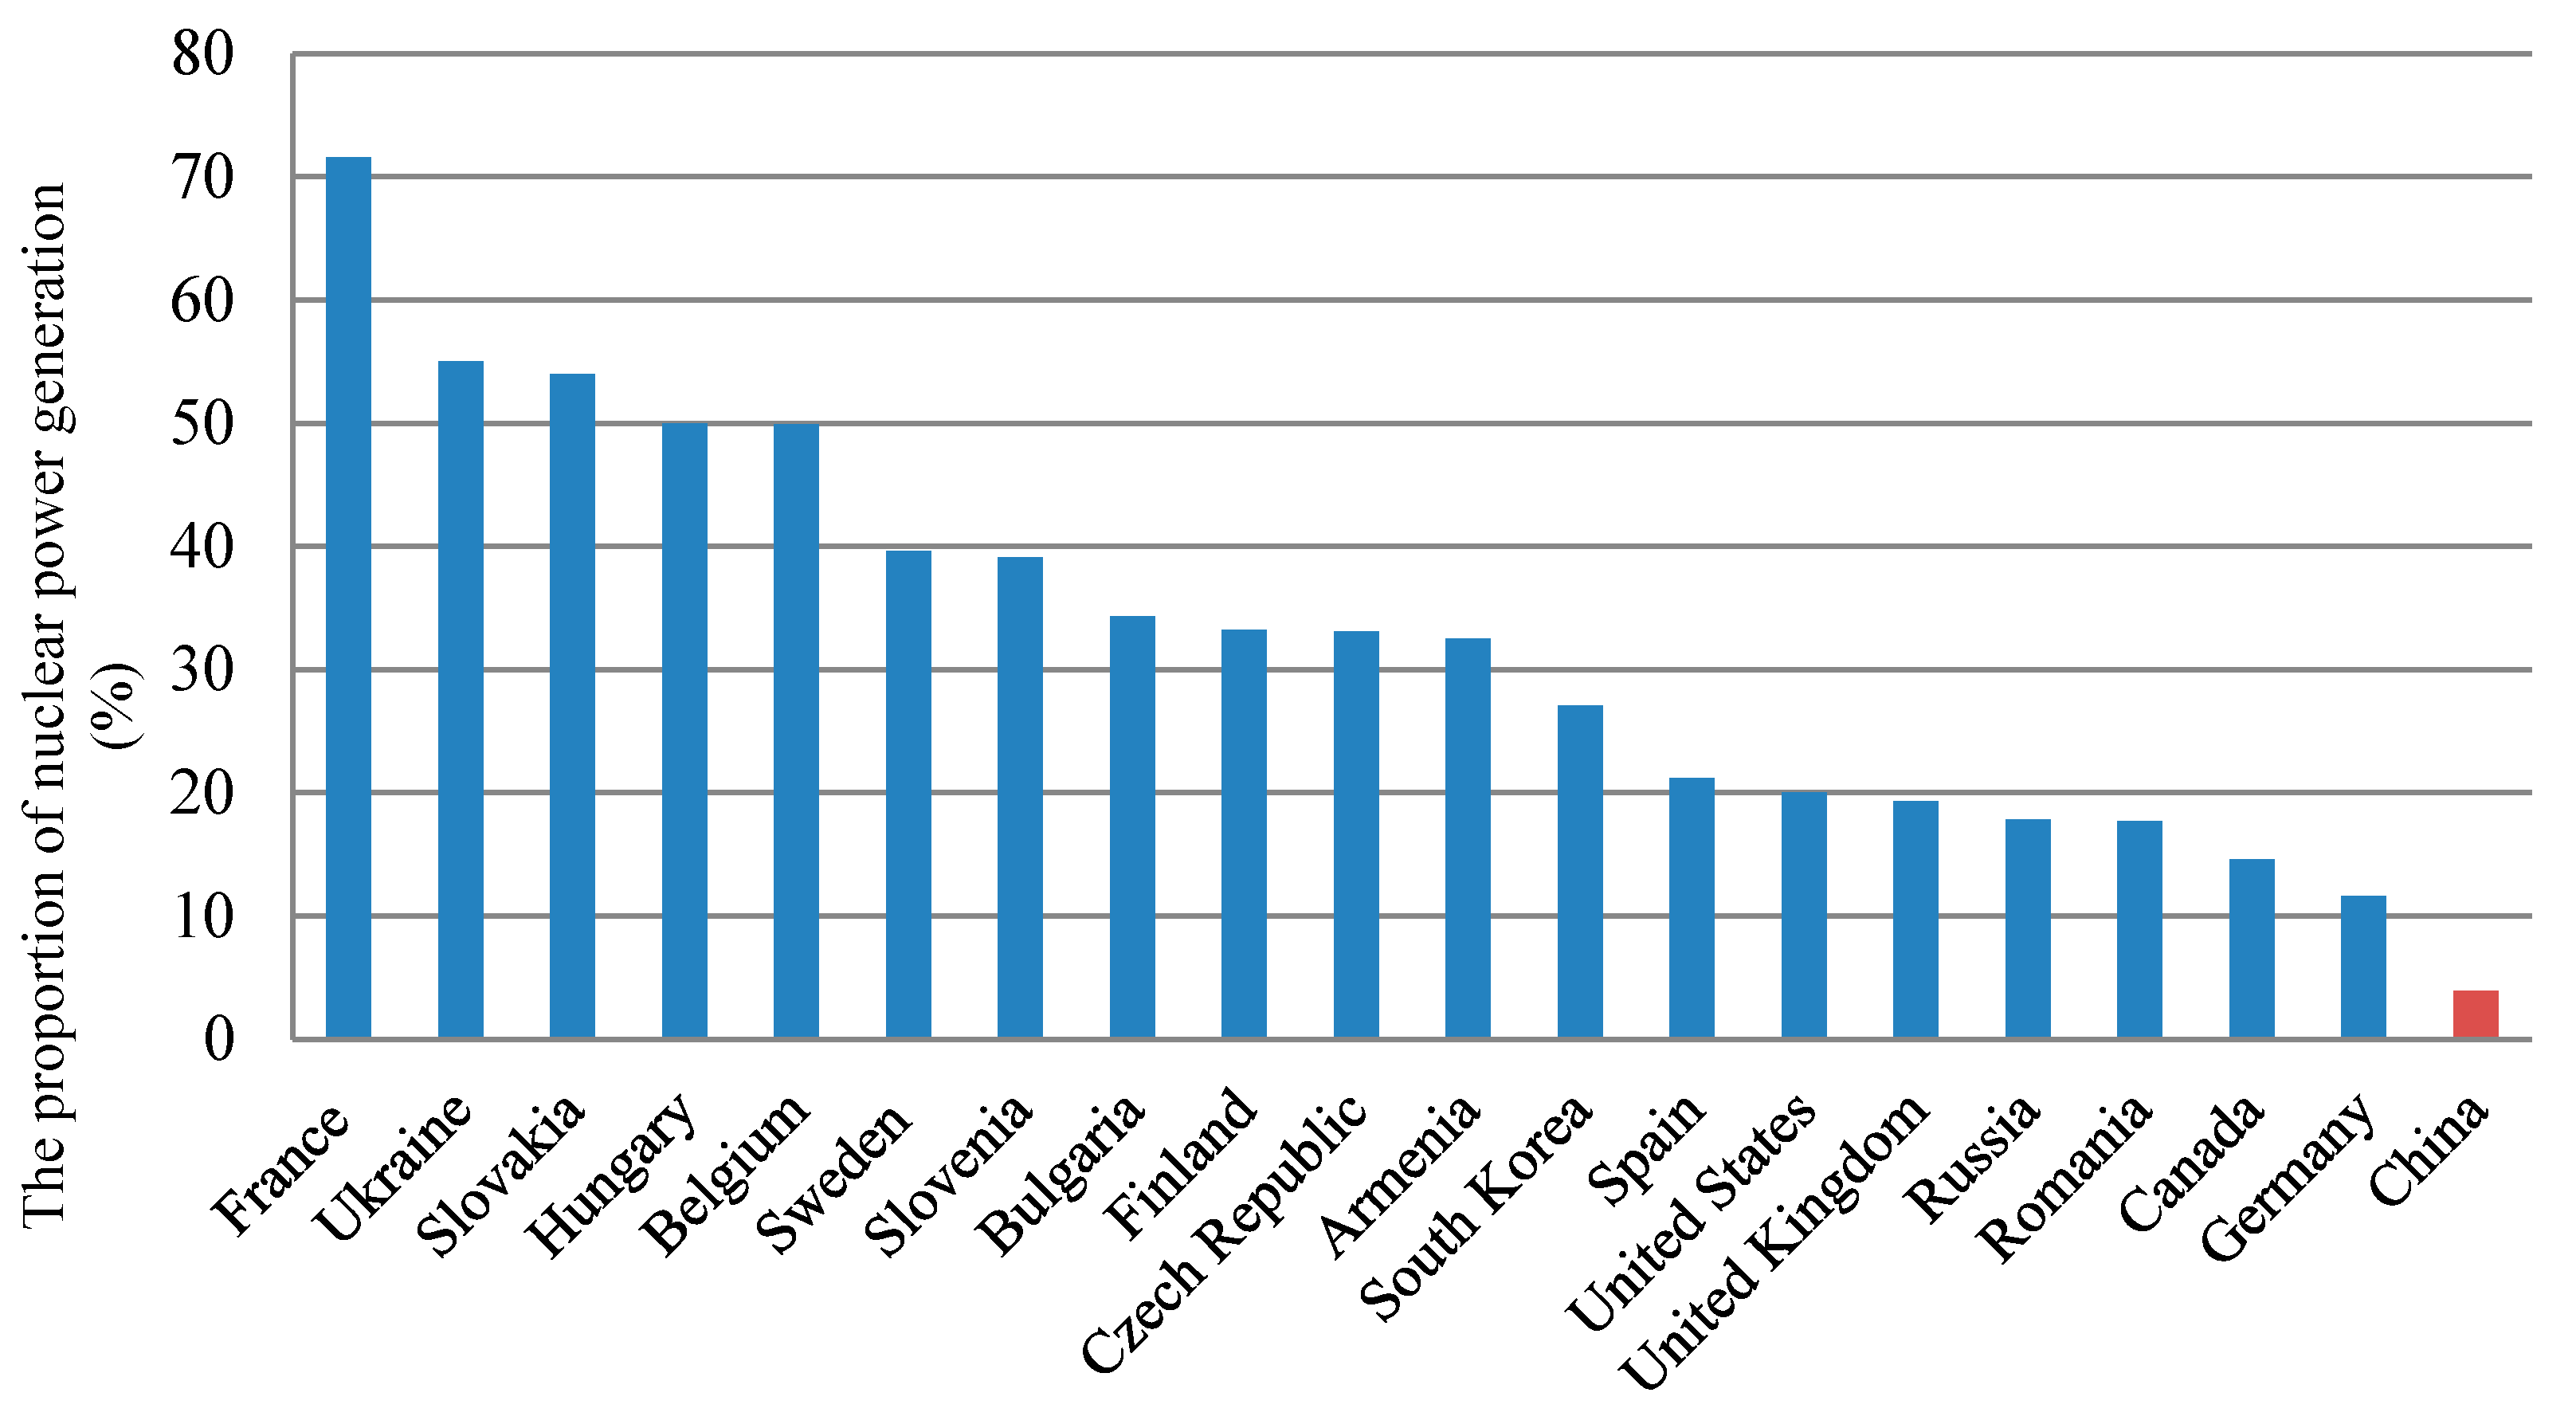
The share of nuclear in the fuel mix of power generation still has a wide gap with other countries. In 2016 and 2017, nuclear power accounted for 3.56% and 3.94% of power supply in China [20]. In 2017, there were 19 countries with share of nuclear power exceeding 10% (Figure 4), among which France has the highest nuclear share of 71.6%, followed by Ukraine and Slovakia at 55% and 54%, respectively [24] (Figure 4).
2.3. Largest Capacity under Construction in the World
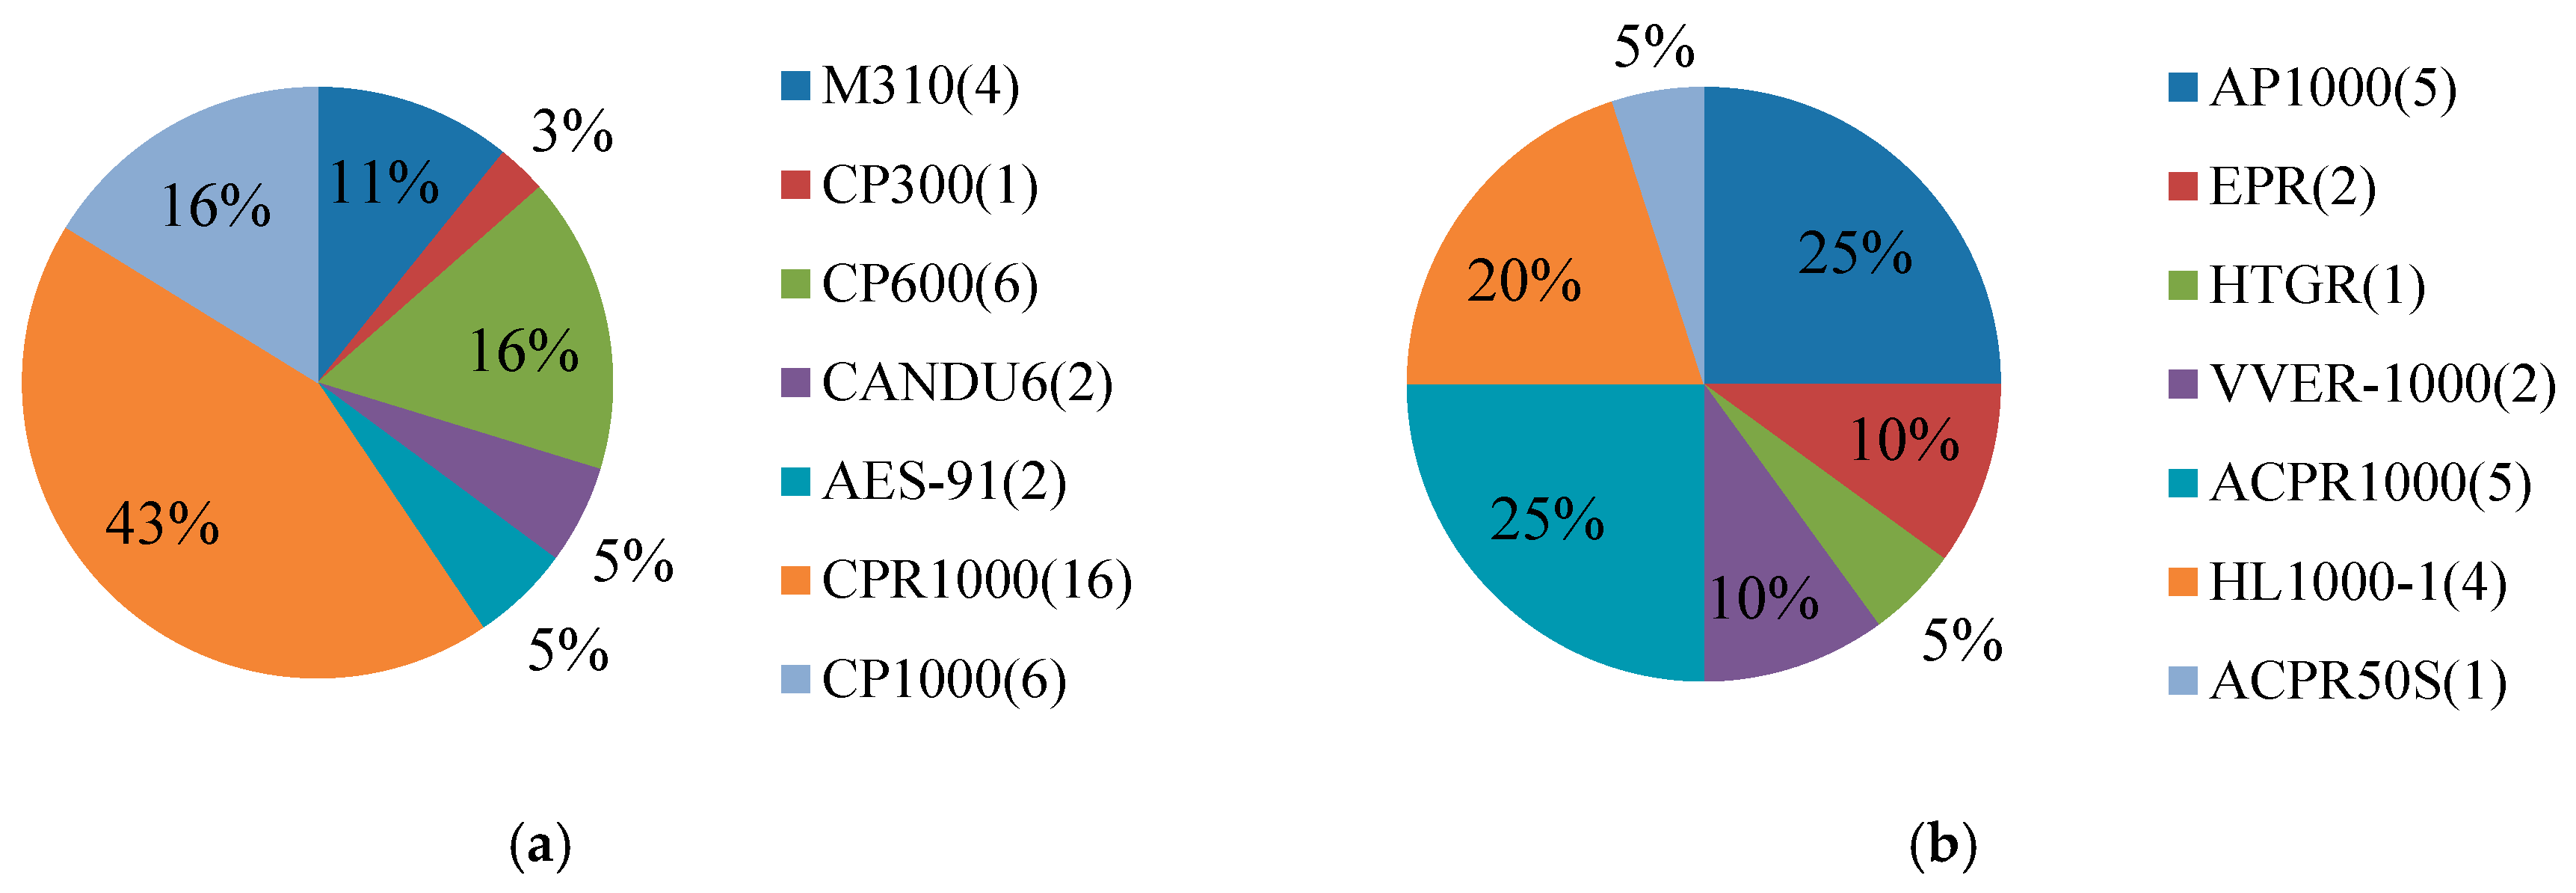
As of the end of 2017, there are 37 commercial operatiing reactors and 20 under-construction nuclear power reactors in China. The majority of reactors that have been commercialized are CNP series of the second generation and the second generation+ reactors, while the majority of reactors under construction are ACPR1000 and AP1000. There are 20–24 AP1000 power plants to be built in the 13th Five-Year Plan (FYP) period [25,26] (Figure 5).
At present, the second generation technology is quite mature, and the construction cycle of such a nuclear power plant is about five years. Among the third generation reactors under construction, the reactors in Sanmen, Haiyang and Taishan have entered the thermal test phase. The first one is expected to be commissioned in 2018. The total capacity of these reactors is 8.5 GW, accounting for about 64% of third generation reactors under construction [27].
According to the WNA data, as of 1 April 2018, 48 countries in the world are running 449 nuclear power reactors (Table 1), and 16 countries are constructing 57 nuclear power reactors. The capacity of 57 under-construction reactors is 61.64 GW, among which the top five are China (21.5 GW), South Korea (5.6 GW), the United Arab Emirates (UAE) (5.6 GW), India (4.3 GW), and Russia (3.6 GW), totaling of 39 reactors (40.6 GW), accounting for 66% of the total under-construction capacity [28].
2.4. Technology Import and Independent Innovation
In the early stages of development, China introduced and absorbed the overseas advanced technology to gradually achieve independent design and equipment localization. However, the variety of technology paths also resulted in issues with standardization, serialization and localization. Afterwards, the government began to accelerate independent design and equipment localization and thus entered a new stage of active development.
At this stage, China’s second generation nuclear power technology with independent design, manufacturing, construction and operation, as well as the equipment localization rate greatly improved, which laid a solid foundation for mastering the third generation technology, training core talent, and promoting the autonomy of nuclear power industry.
In 2007, China decided to use the idea of “introduction, digestion, absorption, re-innovation” for developing the third generation AP1000 design from the Westinghouse Electric Corporation (WEC). In April 2009, the world’s first AP1000 nuclear power unit started construction in Sanmen of Zhejiang Province. The initial design of the CAP1000 reactor reflects what has been learned from the independent design and deployment by Chinese firms of the AP1000 technology. At the same time, the initial design and implementation forms the standard design model for CAP1000 and provides a strong support and protection for the follow-up AP1000 independent construction and implementation [29].
China’s operating and under-construction reactors are mainly PWR, including CP series, AES-91, M310, CPR1000, AP1000, and EPR, and other technologies, including Candu6 heavy water reactor, high temperature gas cooled reactor (HTGR), etc. [30] (Table 2). At present, CNP1000 and CPR1000, as representative “second generation plus” reactors with completely independent intellectual property rights, comprise the majority of operable reactors and under-construction reactors in China. CPR1000 is the most frequently used technology by China in the under-construction reactors based on M310 technology, known as the “China improved PWR” with completely domestic manufactured main equipment.
In addition, independent nuclear plant construction capability continues to improve with the localization rate reaching 85%, forming the annual manufacturing capacity for eight sets of nuclear equipment. The nuclear power construction companies in China now have a comprehensive grasp of construction technology for a variety of reactor types and a variety of unit sizes, able to construct more than 30 nuclear power reactors at the same time [30].
In sum, China’s nuclear power technology is based on technology from France, the United States, and Russia. Three major nuclear power companies, namely China National Nuclear Corporation (CNNC), China Guangdong Nuclear Power Company (CGNPC), and State Power Investment Corporation (SPIC), have learned, absorbed and improved to form their own designs. Currently, the mainstream third generation designs include Hualong 1 (with independent intellectual property rights) of CNNC and CGNPC, AP1000 of SPIC (WEC’s intellectual property rights), and CAP1400 (with independent intellectual property rights). For the technology route options of China’s new reactors, firstly, 30 reactors select AP1000 technology, accounting for 48%; the second is for Hualong 1 with a total of 8 reactors, accounting for 13%; and the third is for ACPR1000 with 6 reactors, accounting for 10%. Thus, the mainstream nuclear power technology in the future will be AP1000. Of the 18 reactors planned for export, six reactors are Hualong 1, accounting for 33% of the total [31].
2.5. Nuclear Fuel and Spent Fuel Treatment
As the fuel for nuclear power generation, uranium resource and its efficiency are an issue that must be considered in advance for sustainable nuclear power development in China. Natural uranium resources are limited in production and are different from direct combustion of coal. Natural uranium must be mined, purified and converted, and then concentrated to nuclear fuel component factory for producing nuclear fuel. Therefore, the recycling of uranium resources is a strong guarantee for the long-term development of nuclear power.
In the power generation process, when the nuclear fuel fission cannot maintain a certain power level, spent fuel will be produced. The uranium content of this fuel is so low that it cannot sustain a nuclear reaction. The spent fuel, also known as irradiated nuclear fuel, is the nuclear fuel that has been irradiated and used, which contains a large amount of radioactive elements. If not handled properly, it will seriously affect the environment and the health of the people who contact them. Therefore, the spent fuel treatment of nuclear power industry is of great significance. At present, there are mainly two kinds of spent fuel treatment methods in the world. One is to treat spent fuel as nuclear waste for deep disposal directly without post-processing. Another is the use of a closed-loop treatment method to reprocess the spent fuel. One of the main purposes of spent fuel reprocessing is the resources recycling. Rolf Westgard, commissioner of the United States Nuclear Energy Institute, argued that only 5% of radioactive fission material in spent fuel needs to be stored, and the remaining 95% can be reused as a fuel for a new generation process through separation and extraction [32].
According to existing planning, nuclear power operation will bring forth 1000 tons of spent fuel annually by 2020. According to the current growth rate, 7500–10,000 tons of spent fuel will accumulate by 2020, and 20,000–25,000 tons by 2030 (Figure 6). With the large-scale development of nuclear power in China, the amount of spent fuel is increasing quickly [33]. In China, the spent fuel is temporarily stored in the self-built boron pools of nuclear power plant. However, the designed service life of the pools is 10 years. Currently, the spent fuel storage pools of most nuclear power plants are overload capacity. Thus, the country is facing the problem of how to solve the problem of spent fuel.
In July 2010, the government issued “Interim measures for the use of spent fuel treatment funds for NPPs”. The spent fuel treatment funds are collected according to the actual electricity sales of nuclear power plants which have been put into commercial operation for more than five years, with a levy rate of 0.026 yuan/KWh [35]. Thus far, the collected funds are 11.7 billion yuan, providing adequate financial input to carry out spent fuel transportation, storage, reprocessing and other works. Spent fuel reprocessing is beneficial to improve the uranium resource utilization. It is estimated that the utilization rate of uranium resources will be increased by about 60 times if the fast reactor and post-processing closed cycle can be realized. In addition, the volume and toxicity of radioactive waste can be significantly reduced. In recent years, the National Atomic Energy Agency (IAEA) has carried out several studies around the autonomous mastery of reprocessing technology for spent fuel, and has actively promoted the large-scale reprocessing process and key equipment R&D on the third generation nuclear power technology, providing an important guarantee for the improvement of reprocessing technology in China [33].
Now China’s spent fuel reprocessing, storage and transportation research have made positive progress. However, it is undeniable that, under the background of rapid development of nuclear power in China, the construction of spent fuel reprocessing capability lags behind. The spent fuel processing plant is a complex system with huge investment, long construction period (10 years) and other technical difficulties. China should further improve the regulatory standards for spent fuel reprocessing, and explore its own development path for spent fuel safety management and equipment manufacturing.
2.6. Project Siting and Public Concern
Scientific project siting is a prerequisite to ensure the safe operation of NPPs. International experiences show that the development of inland nuclear power is inevitable. Thus far, there are more than 20 provinces having carried out the siting work for NPPs in China. With the increasing scarcity of the site resources, the site selection is more complicated. There are few differences in the level of safety impacts between coastal and inland NPPs siting, but the problems faced by inland NPP sites on environmental impacts are far more complex. It is necessary to carry out site planning, investigation and evaluation work based on comprehensive analysis of the safety impact, environmental impact and the feasibility of implementing the contingency plans, among which special attention should be paid to the environmental impacts of inland NPPs siting.
The development of nuclear power is related to national economic development and people’s lives. In fact, after the nuclear accident in Fukushima, increasinng attention is focused on inland nuclear, and also triggered a new social unease. Actually, China has always kept close track of foreign regulatory standards to improve the domestic system on nuclear power and ensure that the whole process of siting, design, construction, operation and decommissioning is safe and reliable. The performance is reflected in the continuous improvement on the supervision basis and supervision mechanism. Based on the accumulated accident experience, the independence of regulatory system is further strengthened, and the matching degree between regulatory funding and unit scale is improved, and the monitoring equipment and information system have been continuously upgraded, and personnel qualification management has been strengthened.
From the legislative level, the country is making efforts to improve the legal system and ensure the healthy development of nuclear power [36]. In September 2016, NDRC and National Energy Administration (NEA) drafted the “Nuclear Power Management Regulations (draft)” for comments. According to the draft, before the construction of NPPs, social stability risk assessment should be conducted. Hearings or other means must be taken to consider public consent. Clearly, the country has adopted strict access system for controlling shareholder or actual controller of the nuclear power project [37].
2.7. Nuclear Technology Export
China’s nuclear technology export has contributed to China’s international cooperation of nuclear industry and the concrete implementation of “Belt and Road Initiatives (BRI)” [38]. Industry estimates also identify very promising potential on international market and job creation. At present, there are more than 40 countries planning the nuclear power construction, and reactors under planning are more than 300. Among them, 28 BRI countries have planned to develop nuclear power projects totaling 150 GW [39].
On 29 September 2016, CGNPC signed a package contract on UK new nuclear power projects with Electricite De France (EDF) and the UK government, and made a historic breakthrough in the “going out” of nuclear power. Among which, Bradwell B project will use “Hualong 1” design with independent intellectual property rights [40]. China has become the country with an independent third-generation nuclear power technology after the US, France, Russia and other countries.
At present, all the key equipment of Hualong 1, including main pump, steam generator, container and fuel element, have reached 90% of domestic manufacturing. There are over 300 enterprises participating in R&D and manufacturing [41]. Currently, the overseas projects for nuclear power are mostly linked to politics, such as the Pakistani project. Therefore, China has not yet obtained the overseas markets for nuclear power, and failed to export in a real sense. In overseas markets, the competitiveness of China’s nuclear power has not been shown. Many standards of China’s autonomous nuclear power have not yet been matched.
3. Short-Term Issues of Nuclear Power in China
3.1. Overcapacity and Deterioration in Utilization Hour
China’s economy has entered a period of new normal, and power consumption has also shown a deceleration trend. The power demand growth has slowed down significantly in 2014. Due to the declining industrial production, industrial restructuring, industrial transformation and upgrading, the electricity consumption increased by 1% [42] in 2015. In 2016 and 2017, the real economy has shown steady growth, and the electricity consumption increased by 5.0% and 6.6% separately. In contrast to the rise in power generation and on-grid electricity, currently. The largest challenge to China’s nuclear power is weak demand and poor utilization. According to China Electricity Council, in 2014, the national average utilization hour of nuclear reactors is 7489 h, down by 385 h since 2013 [42]. In 2015, the figure was 7350 h. In some nuclear plants, the utilization hour was less than 5000 h [43]. In 2016, the figure went down to 6987 h, a record low since the 1990s. In 2017, the figure went up to 7108 h, and the average utilization rate was 81.14% [44]. Nuclear plants at Fuqing (Fujian), Hongyanhe (Liaoning) and Changjiang (Hainan) are the reactors with lowest utilization hour, mainly due to weak power demand in these areas. Because Hongyanhe nuclear plant is located in the northeast with strong heating demand in the winter, and coal power overcapacity is very serious in the same region, most nuclear power reactors have to make way for combined heat and power generation (CHP) of thermal power. Hongyanhe plant has the lowest utilization rate in China. Except for factors such as refueling and overhaul, several nuclear plants including Changjiang 1, Hongyanhe 2–4, Ningde 4 and Fuqing 3 were confronted with issues of “reducing power load or temporarily shutting down as backup power according to dispatch orders” in 2017 [45]. It is very unusual considering the technical and economic characters of nuclear power (Figure 7).
3.2. Commercialization of Third Generation Technology and Learning Curve
At present, Shidao Bay HTGR nuclear plant in China is the world’s first commercial demonstration project of fourth generation technology. According to field survey, the unit investment cost of HTGR in the demonstration stage is as high as 40,000 yuan/KW, and it will be reduced to 30,000 yuan/KW with technology learning (Figure 8).
Sanmen plant in Zhejing is the first project in China to adopt AP1000 technology, and was commissioned in 2015. The unit investment cost of the first AP1000 reactor is 21,000 yuan/KW. With accumulated experience in equipment building and construction, the unit investment cost of subsequent reactors will gradually lower to 15,000 yuan/KW.
“Hualong 1” is the integration of ACP1000 and ACPR1000+ designs. On 25 May 2017, the first demonstration project of “Hualong 1” in the world, Fuqing nuclear power V unit, was successfully performed. According to field survey, the unit investment cost of the first reactor is 20,000 yuan/KW, and follow-up reactors will lower to 17,000 yuan/KW.
With learning by research and learning by doing, investment cost of third generation nuclear technology will continue to go down. The unit investment could decrease to 13,000 yuan/KW by 2030 [46]. Several factors contribute to cost reduction. The first is improvement in localization level driven by the batch construction, which will reduce the cost of key equipment as steam generator, the regulator and the main pump quickly. The second is standardization promoted by batch construction will drive down cost. The third is cost reduction of design fee and technology transfer fee. The fourth is active learning in early projects to shorten construction time. Finally, with scale effect, the unit investment cost comes down.
3.3. Power Market and Ancillary Service Obligation
The economic feasibility of an electricity generation project can be evaluated by various methods, but the equilibrium model of LCOE is the most frequently used when comparing electricity generation technologies or considering grid parities for emerging technologies. Making use of a life-cycle technique to estimate the LCOE, the expenses and sales revenues that occur in a future time have to be accounted for the present time value of money. This is done using discounted cash flow (DCF) techniques by calculating the present value of the cash flows by means of a discount rate. In this context, the LCOE is determined when the present value of the sum of the discounted revenues is equivalent to the discounted value of the sum of the costs during the economic lifetime of the system, that is:
Based on Equations (1)–(4), the complete calculation method of LCOE can be inferred as Equation (5):
where CAPEXn is the annual value of the initial capital expenditure, OPEXn is the annual operation expenditure, TAXn is the annual tax, Dn is the annual decommissioning and disposal cost, C is installed capacity, H is annual utilization hours, ou is own usage rate, N is service life of the plant, and r is discount rate. The key parameters for the economic analysis of nuclear power are shown in Table 3.
Renewable integration demands additional ancillary service in the power systems. In 2016, NEA approved a special pilot reform of regional ancillary services market in the northeast to ensure system reliability when integrating more renewable power in the power grid. According to the pilot reform, nuclear power will also assume part of the cost of ancillary service [47]. As the base-load, the nuclear power reactors in China do not participate in the grid peaking. Nuclear power requires flexible power supply such as pumped storage and gas power to participate in the auxiliary service, so the nuclear power plants need to pay the auxiliary service fee to these flexible power sources. According to the international experience, the paper assumed 7000 h annual utilization hour and 0.09 yuan/kWh fuel cost. The LCOE of nuclear power with ancillary services cost is estimated to increase by 0.01–0.02 yuan/KWh (1% of the nuclear power plant’s operating income). Based on Equation (5), using Excel software, the LCOE and the LCOE with ancillary service of nuclear power are shown in Table 4.
3.4. Short-Term Focus: Economics and Market Competitiveness
We then estimate the economics of nuclear power with prevailing advanced technology under new power market condition. The utilization hour of nuclear power is set at 7500 h, 7000 h and 6000 h, and the corresponding fuel cost is set at 0.08, 0.09 and 0.10 yuan/KWh. The LCOE of the first AP1000 reactor is estimated at 0.43, 0.46 and 0.53 yuan/KWh, while, for Hualong 1, the LCOE is 0.41, 0.45 and 0.52 yuan/KWh. The LCOE of the first HTGR reactor (Shandong) is estimated at 0.69, 0.74, and 0.88 yuan/KWh.
We then compare the LCOE of nuclear power with that of coal power. With average utilization hour of coal power in east China (4317 h) and current steam coal price (519 yuan/ton, 5000 Kcal/kg), the LCOE of coal power in the East China is estimated at 0.32 yuan/KWh and significantly lower than the cost of nuclear power (Table 5).
With the learning of nuclear power technology, its LCOE will be reduced to 0.32 yuan/KWh in the ideal conditions and comparable with coal power even without considering carbon cost. Therefore, in the long term, the economy of nuclear power continues to increase, and its competitiveness in the power market will continue to enhance.
This article focuses on comparing two base-load power supplies to highlight the importance of nuclear power in replacing coal power in the supply-side reform. Energy storage as complement to wind and solar might also be an option to support the power transition. Based on the authors’ literature review and field survey, the LCOE of wind power (0.4–0.5 yuan/kWh) and solar power (0.6–0.7 yuan/kWh) is relatively higher than nuclear power and coal power. In addition, the cost of energy storage technology is about 0.8–1.0 yuan/kWh and has not been commercialized. Thus, it is lacking in market competitiveness [48,49,50,51].
However, the question is the short-term market competitiveness. We assume three scenarios to study the project return of nuclear power in the near future. Based on Eqaution (6) and Table 6, the full investment IRR of GIII for three scenarios is shown in Table 7.
where IRR is the internal rate of return, FNPV (IRR) is the financial net present value of the discount rate by IRR, CI is the cash inflow, CO is the cash outflow, (CI-CO)t is the net cash flow at tth year, and n is the calculation period, including construction period and operation period.
With no surprise, because of the very high cost of fourth generation technology, HTGR has no positive economic return at the prevailing market environment. For AP1000 design, its IRR will be lower than industry return requirement (8%) with high possibility. The same conclusion may apply to Hualong 1# design at low utilization hour scenario.
Hence, in the near future, due to high investment cost and poor utilization rate, nuclear power is at disadvantage compared with coal power. If benchmarking price policy is to be implemented continually, the economic return of third generation nuclear power is still acceptable with high utilization rate. However, if the benchmarking price is cancelled, the economic return of nuclear power will be certainly unacceptable. Because nuclear power is capital intensive in investment and operation, without firm return expectation, new investment is unlikely to take place. Without sufficient new installation, the technology learning of nuclear power will be blocked.
The sensitivity analysis (Figure 10) of GIII for S1 reveals that, when the discount rate goes up by 1%, the full investment IRR will decline by 0.05%, and, when the discount rate decreases by 1%, the full investment IRR will increase by 0.06%.
4. Long-Term Prospective of Nuclear Power in China
4.1. Global Climate Change Policy
In 2016, China made many policy highlights in the field of green development. The leading group of deepening reform of the Communist Party of China (CPC) Central Committee held 12 meetings and introduced 19 reform programs on ecological civilization, marking the new era of China in environmental protection [53].
On 4 November 2016, the Paris Agreement came into effect, marking the opening of a new era of global climate governance and the action arrangements of global response to climate change after 2020. On the same day, China released a new national emissions reduction five-year program on greenhouse gas. China committed to peak its GHG emissions by 2030 and as early as possible.
On 1 June 2017, US President Trump announced that the US would withdraw from the Paris Agreement. The withdrawal of the US has caused serious setbacks in global efforts to tackle climate change, and the burden of reducing emissions and costs on China will increase. Therefore, countries around the world are concerned about the future evolution of the US energy and climate change policies. Even with uncertainty, global trend of clean energy development is unaltered and green development has come with consensus by sovereign nations.
4.2. Avoided Carbon Cost: Nuclear vs. CCS
With certainty in global climate change policy, China must find the least cost pathway of GHG abatement. Here, we define the avoided CO2 cost as the total cost incurred for CO2 emissions reduction. Because of the intermittency of renewable energy, the only technology that can replace coal power as the base load is nuclear power. The coal power can be subject to desulfurization and denitrification process, but carbon capture and storage (CCS) is the only option for coal power to achieve near-zero emissions of CO2. Thus, this paper considers the 1 GW USC unit with CCS facility for comparison. We assume roughly 60% increase in capital cost and the unit investment cost will increase by 2000 yuan/KW. The decarburization efficiency is set at 85%. Thus, the LCOE of USC + CCS is estimated at 0.53 yuan/KWh, or about 0.16 yuan/KWh higher than 1 GW USC without CCS. Under these assumptions, the avoided CO2 cost of CCS is about 750 yuan/ton.
Under the conditions of the unit investment cost at 17,000 yuan/KW and utilization hour at 7000 h, the LCOE of nuclear power is 0.40 yuan/KWh. Compared with the LCOE of 0.37 yuan/KWh for USC coal power, the cost increase translates into corresponding avoided CO2 cost at 214 yuan/ton. Therefore, nuclear power is an important choice for replacing coal power. In the long run, with technology learning, the unit investment cost and LCOE will decrease, and the avoided CO2 cost can be more competitive (Table 8).
4.3. The Role of Nuclear in China’s Energy Transition
China’s commitment to peaking carbon emissions around 2030 and China’s important role in global climate change will lead to great pressures on low-carbon or even zero-carbon energy system transition. China has made it clear that promoting the hydropower development, developing the nuclear power safely and efficiently, vigorously developing wind power, accelerating the development of solar power, and actively developing geothermal, biomass and ocean energy will be key options of China’s national energy policy. However, in terms of resource availability, hydropower will soon reach its upper limit, while renewable wind and PV energy alone is not able to provide reliable power supply. For biomass energy, the potential is limited. Therefore, from the perspective of entire power system, nuclear power has an important role in the transition.
5. Policy Implications
5.1. Standardized Technology Roadmap
China’s nuclear power has multiple technology routes and the technical standards are not unified. Because of the failure in system integration, the technology progress and localization process are blocked. Now AP1000, Hualong 1, HTGR, CAP1400, EPR, etc. are competing with each other and this fierce competition can have negative impact on technology learning in the nuclear power industry. The inconsistency of technology route has influenced on the nuclear power equipment manufacturing industry, which is the most critical part of the nuclear power industry chain. Different technical standards and different localization requirements caused the great difficulties for the future development planning of equipment manufacturing industry. With the increase in the installed capacity of nuclear power in China, the weak technical base of autonomous nuclear power and the decentralized R&D forces will gradually emerge. In addition, the internal competition in China’s nuclear power technology route has caused customers to feel distrust. However, the largest part of nuclear LCOE is the initial investment, so the most important measure is to reduce the unit investment cost by technical learning.
Standardization is the most effective way to reduce the investment cost. The government needs to timely develop related technology route guidelines, so that various NPPs can realize integrated optimization. Unified reactor type and batch production can make the construction process duplicable and cut down technical support and service cost. In addition, the scale effect of nuclear power generation can achieve intensive effects on equipment procurement, technical services and other aspects. Unified maintenance companies and technology centers can reduce the construction costs and operating costs, significantly reduce the LCOE of nuclear power and improve the market competitiveness. In addition, the unified technology path can also benefit Chinese enterprises in occupying a more favorable position in the international competition.
5.2. Public Financial Support of Technology Learning
Learning costs of developing new technology can be reflected in the government’s R&D investment policy, electricity tariff policy and finance tax policy so that a mechanism is in place for the commercialization of nuclear power. In the early commercialization stage, extra high cost will affect capital injection and scale expansion. Therefore, from the perspective of promoting the development of nuclear power, the government’s public finance fund can be used to support research, development and demonstration. By the leverage effect of government fund, social capital can be mobilized to finance nuclear power industry. A capacity payment mechanism for the first-kind reactors can be employed to lower capital cost and enhance the competitiveness of nuclear power. In this way, nuclear can escape the current dilemma and expand its capacity to further lower investment cost.
Finance and tax policy incentives are the policy instruments that must be taken in the early stage of new nuclear power project. During the repayment period, the generation cost of nuclear power is very high, but, after the repayment period, the generation cost is even lower than coal power. Therefore, for nuclear power, at the beginning of the repayment period, the tax should be as little as possible. In addition, for the income tax of the nuclear power equipment enterprises and NPPs, preferential tax can be used in reference to the standard of high-tech enterprises. It is noteworthy that the learning cost of pre-commercialization of nuclear power should be solved by public financial support, rather than higher benchmark price assumed by local governments where NPPs are located in.
5.3. Proper Positioning in Power Market
Nuclear power working as the base load is conducive in improving its fuel efficiency. In the operation process, the frequent and deep power regulation will reduce the reliability of the reactive control system, resulting in the inadequate fuel consumption to produce waste, and increase the difficulty and cost of waste processing. In addition, nuclear power as the base load is also conducive in promoting energy conservation and emissions reduction [56].
There are two typical modes of nuclear power operation in the world. France is a country with the largest nuclear share in its fuel mix. Due to shortage of other peak regulation resources, nuclear power reactors in France operate in a way of load-following. The other type is represented by the US, Canada and Japan. With a diversified mix of power sources, nuclear power reactors in these countries mainly operate as base load. In China, from the policy perspective, it should be clear that nuclear power is operating as base load to ensure high operational efficiency. However, due to the penetration of intermittent renewable energy such as wind power and PV, a market mechanism should be established to provide proper incentive for flexible resources. Nuclear power should be designed with as much load-following ability as possible. However, a balance is important in its operational efficiency and provision of system flexibility.
5.4. Mature Nuclear Industry Chain
The industry chain of nuclear power is long, mainly consisting of three parts: upstream (fuel assemblies and related components), midstream (nuclear island, conventional island and auxiliary equipment), and downstream (NPP operation and spent fuel treatment).
(1) Upstream supply of nuclear fuel and fuel components
Due to high correlation between nuclear power and national security, as well as high technology standards and requirements, China’s nuclear fuel and component supply industry is highly concentrated. Overall, China has a certain R&D and production capacity in the front-end nuclear fuel cycle. However, compared with developed countries, there is still a big gap in terms of technical capacity and fuel economy. In some key areas, China has not yet fully formed its own technology design capabilities, and some core technologies and components still rely on import. Therefore, China should actively promote the construction of large uranium base, and establish natural uranium resources protection system with domestic production, overseas development and international uranium trade to provide adequate supply.
(2) Midstream nuclear equipment production
China has basically grasped the third generation nuclear power, and the equipment production capacity has overtaken foreign advanced levels with annual production capacity of 6–8 nuclear power reactors. The acceleration of localization rate for nuclear power equipment has greatly reduced the construction cost of NPPs. However, there are still some technical bottlenecks in the manufacturing of nuclear power reactors. Therefore, the government should actively build the intensive manufacturing bases and industrial parks of nuclear power equipment to improve integration, form complete PWR manufacturing capacity and establish a better quality assurance system.
(3) Downstream nuclear power investment and operation
The operation of NPP is in an oligopoly position. At present, there are three NPP operators: CNNC, CGNPC and SPIC. On the other hand, the operation of NPPs is also facing security challenge. Currently, core technology competency in downstream nuclear waste and spent fuel reprocessing does not exist. A decade ago, China started the international cooperation on nuclear waste and spent fuel reprocessing, but the progress is very slow. The government should speed up the research and development on nuclear waste and spent fuel reprocessing technology, and formulate relevant standards and rules for nuclear safety operation.
5.5. Nuclear Safety and Public Concern
Nuclear safety is an important part of national security and an important area of environmental protection. Siting resources are very precious and the government should carefully promote the inland siting work and pay close attention to public concerns. Therefore, China should further improve the nuclear emergency system, standard system of laws and regulation, promote the construction of nuclear emergency infrastructure, strengthen nuclear emergency training and exercise, and deepen international exchanges and cooperation on nuclear emergency. In addition, it is very urgent to speed up the legislation of “nuclear safety law”.
6. Concluding Remarks
As a highly efficient energy source, nuclear power has become a major solution to solve the energy crisis, replace traditional fossil fuels and reduce environmental pollution. Through the analysis of short-term and long-term development trend of China’s nuclear power, this paper finds that, in the current situation of excess power, due to high investment cost, the decrease of utilization hour and additional cost of ancillary service obligations, the generation cost of third generation nuclear power will be significantly higher, and economic return will fall below the benchmark level, which negatively affects the investment enthusiasm in nuclear power. With the acceleration of technology learning, the nuclear power can be competitive with the coal power in 2030 with full market competitiveness. Further, the GHG reduction costs of nuclear power are more competitive than that of coal power + CCS, so nuclear power is an important option for China to achieve long-term low carbon energy transition. To ensure the long-term healthy development of China’s nuclear power, it is recommended to share the technical learning cost at the early commercialization stage through clean technology subsidies. Full consideration of the characteristics of nuclear power should be taken in the design of power market rules to ensure its efficient operation. The healthy development of nuclear power in China also depends on solid industrial system and nuclear safety legislation. Furthermore, the government should pay attention to spent fuel and its pollution. In addition, with the gradual maturation of various energy storage technologies, continuous reduction of energy storage costs, and gradual improvement of related policies, large-scale energy storage technologies can control the instability and discontinuity of wind power and solar power, and realize the safe and stable power supply. Thus, energy storage as complement to wind and solar power is a core technology option to nuclear for base power for achieving energy diversification.
Author Contributions
Y.X. and J.Y. conducted the analysis and drafted the paper; and J.K. collected the data for analysis.
Acknowledgments
The authors would like to thank the anonymous reviewers for their useful comments and suggestions. The work reported in the paper is funded by the National Natural Science Foundation of China (71673085); the Beijing Municipal Social Science Foundation (16YJB027); the Fundamental Research Funds for the Central Universities (2018ZD14); the General Project of Shanxi Soft Science Research Program (2017041003-5); and Shanxi Province Higher School Philosophy and Social Science Research Project (2017251); the Special Funded Project for Shanxi University of Finance and Economics (zx-201709).
Conflicts of Interest
The authors declare no conflict of interest.
References
- China Climate Change Info-Net. Ministry of Industry and Information Technology: China Has Become the Largest Carbon EMISSIONS accounted for More than 70% of the World. 2013. Available online: http://www.ccchina.gov.cn/Detail.aspx?newsId=41517&TId=57 (accessed on 5 June 2017).
- NDRC. National Response to Climate Change Planning. 2014. Available online: http://qhs.ndrc.gov.cn/gzdt/201411/t20141105_647419.html (accessed on 5 June 2017).
- Xinhua News Agency. The SECOND Meeting on Government Work Report of 12th National People’s Congress. 2014. Available online: http://news.xinhuanet.com/politics/2014-03/13/c_119756908.htm (accessed on 5 June 2017).
- People Network. China-U.S. Joint Presidential Statement on Climate Change. 2014. Available online: http://politics.people.com.cn/n/2014/1112/c70731-26010508.html (accessed on 5 June 2017).
- Li Keqiang: China Will Continue to Fulfil Its Commitment to the Paris Agreement. 2016. Available online: http://www.gov.cn/xinwen/2017-06/02/content_5199175.htm (accessed on 5 June 2017).
- Wu, Y. Public acceptance of constructing coastal/inland nuclear power plants in post-Fukushima China. Energy Policy 2017, 101, 484–491. [Google Scholar] [CrossRef]
- Wang, Y.; Ma, J.; Fang, Y. Generation III pressurized water reactors and China’s nuclear power. J. Zhejiang Univ.-Sci. A 2016, 17, 911–922. [Google Scholar] [CrossRef]
- Zeng, M.; Wang, S.; Duan, J.; Sun, J.; Zhong, P.; Zhang, Y. Review of nuclear power development in China: Environment analysis, historical stages, development status, problems and countermeasures. Renew. Sustain. Energy Rev. 2016, 59, 1369–1383. [Google Scholar]
- Guo, X.; Guo, X. Nuclear power development in China after the restart of new nuclear construction and approval: A system dynamics analysis. Renew. Sustain. Energy Rev. 2016, 57, 999–1007. [Google Scholar] [CrossRef]
- Kang, J.; Yao, M.; Zhu, Q. Research on construction period and cost change of nuclear power. Energy China 2016, 38, 25–29. [Google Scholar]
- Zhang, S.; Li, Q. The Development and Scale of the Nuclear Power in China under the Restraint of Low Carbon. China Popul. Resour. Environ. 2015, 25, 47–52. [Google Scholar]
- Cai, L.; Wang, S.; Liu, F. Research on Future Nuclear Power Development Space in China. Energy China 2016, 38, 25–31. [Google Scholar]
- Ou, Y. Development strategy and process of world nuclear power states and nuclear power development in China. China Nucl. Power 2008, 1, 118–125. [Google Scholar]
- Kang, J.; Yuan, J.; Hu, Z.; Xu, Y. Review on wind power development and relevant policies in China during the 11th Fie-Year-Plan period. Renew. Sustain. Energy Rev. 2012, 16, 1907–1915. [Google Scholar] [CrossRef]
- Yuan, J.; Zhao, C.; Yu, S.; Hu, Z. Electricity consumption and economic growth in China: Cointegration and co-feature analysis. Energy Econ. 2007, 29, 1179–1191. [Google Scholar] [CrossRef]
- Yuan, J.; Kang, J.; Yu, C.; Hu, Z. Energy conversation and emissions reduction in China---Progress and prospective. Renew. Sustain. Energy Rev. 2011, 15, 4334–4347. [Google Scholar] [CrossRef]
- Yuan, J.; Xu, Y.; Hu, Z.; Zhao, C.; Xiong, M.; Guo, J. Peak energy consumption and CO2 emissions in China. Energy Policy 2014, 68, 508–523. [Google Scholar] [CrossRef]
- Yuan, J.; Li, P.; Wang, Y.; Liu, Q.; Shen, X.; Zhang, K.; Dong, L. Coal power overcapacity and investment bubble in China during 2015–2020. Energy Policy 2016, 97, 136–144. [Google Scholar] [CrossRef]
- Analysis of the History and Present Situation of China’s Nuclear Power Development in 2016. 2016. Available online: http://www.askci.com/news/chanye/2016/03/17/16923rk5e.shtml (accessed on 15 April 2018).
- CNEA. The Latest Operation of National Nuclear Power. 2018. Available online: http://news.bjx.com.cn/html/20180131/877908.shtml (accessed on 14 April 2018).
- The Action Plan for Energy Development Strategy (2014–2020). 2014. Available online: http://www.nea.gov.cn/2014-12/03/c_133830458.html (accessed on 15 April 2018).
- China Industrial News. The Installed Capacity of Nuclear Power in China will Reach 150 GW in 2030. 2016. Available online: http://news.bjx.com.cn/html/20160615/742366.shtml (accessed on 15 April 2018).
- Sina Finance. BMI: China Is Expected to Become the Largest Nuclear Power Country by 2026. 2017. Available online: http://finance.sina.com.cn/stock/usstock/c/2017-01-31/doc-ifxzyxmt1657249.shtml (accessed on 15 April 2018).
- WNA. Nuclear Generation by Country. 2018. Available online: http://www.world-nuclear.org/information-library/facts-and-figures/nuclear-generation-by-country.aspx (accessed on 14 April 2018).
- China’s Industrial Information. The Electricity Generation, Installed Capacity and Units Statistics of Nuclear Power for China in 2016. 2016. Available online: http://www.chyxx.com/industry/201608/436575.html (accessed on 15 April 2018).
- Su, S.; Yuan, G.; Lin, W. The Global Nuclear Industry Development Report (2017); World Knowledge Press: Beijing, China, 2017. [Google Scholar]
- China’s Nuclear Power Industry Development Status and Development Prospects in 2017. 2018. Available online: http://www.chyxx.com/industry/201712/593075.html (accessed on 15 April 2018).
- WNA. World Nuclear Power Reactors & Uranium Requirements. 2017. Available online: http://www.world-nuclear.org/information-library/facts-and-figures/world-nuclear-power-reactors-and-uranium-requireme.aspx (accessed on 5 June 2017).
- Nuclear Power Technology: Independent Innovation Cast a Strong Country. 2012. Available online: http://news.bjx.com.cn/html/20120903/385017.shtml (accessed on 15 April 2018).
- China’s Nuclear Power Development History Review and Analysis of the Status Quo in 2016. 2016. Available online: http://power.in-en.com/html/power-2255571.shtml (accessed on 15 April 2018).
- China’s Nuclear Power Industry Development Prospects and Market Forecast in 2016. 2016. Available online: http://www.chyxx.com/industry/201608/436257.html (accessed on 15 April 2018).
- China Electric Power News. 2016. Available online: http://www.indaa.com.cn/shiye/201608/t20160815_1652628.html (accessed on 15 April 2018).
- China Electric Power News. The Total Spent Fuel in China to the 13th Five-Year Will Reach About 10,000 Tons. 2017. Available online: http://www.cpicorp.com.cn/zhxx/201702/t20170213_272689.htm (accessed on 15 April 2018).
- Li, Y.; Xiao, D.; Liu, X.; Qiu, S.; He, Z. Discussion on the present situation of spent fuel transportation in China. Radiat. Prot. 2016, 36, 31–39. [Google Scholar]
- MOF. Interim Measures for the Use of Spent Fuel Treatment Funds for Nuclear Power Plants. 2010. Available online: http://www.mof.gov.cn/zhengwuxinxi/caizhengwengao/2010nianwengao/wengao6/201009/t20100903_337280.html (accessed on 15 April 2018).
- Chen, Z. Critical Thinking of Site Selection and Environmental Safety Issues for Inland Nuclear Power Plant in China. South Energy Constr. 2015, 2, 28–33. [Google Scholar]
- China’s NEW Energy Network. Open for Comments of Nuclear Power Management Regulations. 2016. Available online: http://www.china-nengyuan.com/news/98875.html (accessed on 15 April 2018).
- Xinhua Network. The Improvement of China’s Independent Innovation Ability of nuclear Power and Export. 2015. Available online: http://news.xinhuanet.com/2015-12/09/c_128513023.htm (accessed on 15 April 2018).
- China Industrial News. The Vast Nuclear Power market SPACE along the Belt and Road Initiatives. 2016. Available online: http://www.cinn.cn/xw/chanj/356183.shtml (accessed on 15 April 2018).
- China News Network. The Main Project in the British of “The Most Expensive Nuclear Power Project” from China Has Started. 2017. Available online: http://www.chinanews.com/ny/2017/05-09/8219126.shtml (accessed on 15 April 2018).
- China Environmental News. “The Belt and Road Initiatives” Strategy Leads the Chinese Nuclear Power Enterprises “Going Out”. 2017. Available online: http://www.cenews.com.cn/qy/201705/t20170518_833811.html (accessed on 15 April 2018).
- CEC. The Operation Report of Electric Power Industry in 2014. 2015. Available online: http://www.cec.org.cn/guihuayutongji/gongxufenxi/dianliyunxingjiankuang/2015-02-02/133565.html (accessed on 15 April 2018).
- CEC. Forecast Analysis on National Electric Power Supply and Demand in 2016. 2016. Available online: http://www.cec.org.cn/yaowenkuaidi/2016-02-03/148763.html (accessed on 15 April 2018).
- China Energy News. Nuclear Power “Consumption” Remains to Be Solved. 2017. Available online: http://paper.people.com.cn/zgnyb/html/2017-02/13/content_1750144.htm (accessed on 15 April 2018).
- CNEA. 2018. Available online: http://www.caea.gov.cn/n6758881/n6758890/c6799735/content.html (accessed on 15 April 2018).
- Xu, Y.; Yuan, J.; Wang, J. Learning of Power Technologies in China: Staged Dynamic Two-Factor Modeling and Empirical Evidence. Sustainability 2017, 9, 861. [Google Scholar] [CrossRef]
- Northeast China Energy Regulatory Bureau of National Energy Administration. The Special Reform Pilot Work of Ancillary Services Market in the Northeast Officially Started. 2016. Available online: http://dbj.nea.gov.cn/nyjg/hyjg/201611/t20161124_2580781.html (accessed on 5 June 2017).
- Li, Y.; Li, Y.; Ji, P.; Yang, J. Development of energy storage industry in China: A technical and economic point of review. Renew. Sustain. Energy Rev. 2015, 49, 805–812. [Google Scholar] [CrossRef]
- Gao, R.; Choi, S.; Ko, W.I.; Kim, S. Economic potential of fuel recycling options: A lifecycle cost analysis of future nuclear system transition in China. Energy Policy 2017, 100, 526–536. [Google Scholar] [CrossRef]
- Zhao, C.; Zhang, W.; Wang, Y.; Liu, Q.; Guo, J.; Xiong, M.; Yuan, J. The economics of coal power generation in China. Energy Policy 2017, 105, 1–9. [Google Scholar] [CrossRef]
- Liu, C.; Wang, Y.; Zhu, R. Assessment of the economic potential of China’s onshore wind electricity. Resour. Conserv. Recycl. 2017, 121, 33–39. [Google Scholar] [CrossRef]
- NDRC. The Notice Concerning the Improvement of the Nuclear Power Tariff Mechanism. 2013. Available online: http://www.nea.gov.cn/2014-06/06/c_133388619.htm (accessed on 10 May 2018).
- China Economic Network. China’s Environmental Protection System Has Become the World’s Top Ten Environmental Hotspots in 2016. 2017. Available online: http://finance.china.com.cn/roll/20170407/4166403.shtml (accessed on 5 June 2017).
- Liu, Q.; Lei, Q.; Xu, H.; Yuan, J. China’s energy revolution strategy into 2030. Resour. Conserv. Recycl. 2018, 128, 78–89. [Google Scholar] [CrossRef]
- Xu, Y.; Yuan, J.; Xu, H. Dynamic Integrated Resource Strategic Planning Model: A Case Study of China’s Power Sector Planning into 2050. Sustainability 2017, 9, 1177. [Google Scholar] [CrossRef]
- China Energy Network. China’s Nuclear Power Unit Should not Be Involved in Peaking? 2016. Available online: http://www.china5e.com/news/news-954472-1.html (accessed on 5 June 2017).
Figure 1.
The installed capacity of nuclear power in 2009–2017 [20].
Figure 1.
The installed capacity of nuclear power in 2009–2017 [20].

Figure 2.
The operating reactors and under-construction reactors in China during 1998–2017 [20].
Figure 2.
The operating reactors and under-construction reactors in China during 1998–2017 [20].

Figure 3.
The electricity generation by nuclear power in China during 2009–2017 [20].
Figure 3.
The electricity generation by nuclear power in China during 2009–2017 [20].

Figure 4.
The proportion of nuclear power generation in 2017 [24].
Figure 4.
The proportion of nuclear power generation in 2017 [24].

Figure 5.
(a) The commercial operation reactors in China [25]; and (b) the under-construction reactors in China [25].

Figure 6.
The current and cumulative spent fuel production in 2013–2020 [34].
Figure 6.
The current and cumulative spent fuel production in 2013–2020 [34].

Figure 7.
The utilization hours of nuclear power reactors in 2017 [45].
Figure 7.
The utilization hours of nuclear power reactors in 2017 [45].

Figure 8.
Unit investment cost of nuclear technology in China. Source: This figure is compiled base upon authors’ literature review [10] and field survey.
Figure 8.
Unit investment cost of nuclear technology in China. Source: This figure is compiled base upon authors’ literature review [10] and field survey.

Figure 9.
The cost calculation for three scenarios.

Figure 10.
The sensitivity of discount rate to full investment IRR of GIII for S1.


Table 1.
Development status of nuclear power reactors around the world (as of 1 April 2018) [28].
Table 1.
Development status of nuclear power reactors around the world (as of 1 April 2018) [28].
| Country | Operable Reactors | Under-Construction Reactors | ||
|---|---|---|---|---|
| Number | Net Installed Capacity (MW) | Number | Net Installed Capacity (MW) | |
| USA | 99 | 99,647 | 2 | 2500 |
| France | 58 | 63,130 | 1 | 1750 |
| Japan | 58 | 63,130 | 1 | 1750 |
| China | 38 | 34,647 | 20 | 21,546 |
| Russia | 37 | 28,961 | 5 | 3634 |
| South Korea | 24 | 22,505 | 4 | 5600 |
| India | 22 | 6219 | 6 | 4350 |
| Canada | 19 | 13,553 | 0 | 0 |
| Ukraine | 15 | 13,107 | 0 | 0 |
| Germany | 7 | 9444 | 0 | 0 |
| UK | 7 | 9444 | 0 | 0 |
| UAE | 0 | 0 | 4 | 5600 |
| World | 449 | 394,137 | 57 | 61,640 |
Table 2.
Nuclear power technology pathway in China [31].
Table 2.
Nuclear power technology pathway in China [31].
| Technical Distinction | CNNC | CGNPC | SPIC | ||
|---|---|---|---|---|---|
| Second generation | Russia technology | Independent R&D CNP300 | France technology M310 | USA technology | |
| CNP600 | International advanced technology in the 90s | ||||
| Second generation plus | AES91 | CP1000 | CPR1000 | ||
| Third generation | ACP1000 | ACPR1000 | AP1000 | ||
| Hualong 1 | CAP1400 | ||||
Table 3.
Key parameters for the economic analysis of nuclear power.
| Parameter | Set Value | Parameter | Set Value |
|---|---|---|---|
| Own capital ratio | 80% | Insurance rate (%) | 0.25% |
| Loan period (years) | 40 | Maintenance rate | 2.5% |
| Loan interest rate | 6% | Workers (persons) | 600 |
| After-tax internal rate of return | 8% | Worker salary (yuan/yr) | 150,000 |
| Weighted average cost of capital | 6.4% | The growth rate of worker’s salary (%) | 6% |
| Service life (years) | 60 | Salary benefit adder (%) | 60% |
| Deprecation years | 40 | Cleaning and other operation rate (%) | 1% |
| Discount rate (%) | 8% | Fuel cost (yuan/kWh) | 0.08–0.10 |
| Value added tax | 17% | Education surcharge (central government) | 3% |
| Urban construction tax | 5% | Education surcharge (local government) | 1% |
Source: The data for CAPEX and OPEX are compiled base on the field survey, and the tax is based on the national policy.
Table 4.
The LCOE with ancillary service of nuclear power.
| Region/Type | Unit Investment Cost (Yuan/KW) | LCOE (Yuan/KWh) | LCOE with Ancillary Service (Yuan/KWh) |
|---|---|---|---|
| HTGR (Shandong) | 40,000 (First reactor in Shidao Bay) | 0.76 | 0.76–0.78 |
| 30,000 (Follow-up reactor) | 0.61 | 0.61–0.63 | |
| AP1000 (Zhejiang) | 21,000 (First reactor in Sanmen) | 0.48 | 0.48–0.50 |
| 15,000 (Follow-up reactor) | 0.39 | 0.37–0.38 | |
| Hualong 1 (Fujian) | 20,000 (First reactor in Fuqing) | 0.46 | 0.46–0.48 |
Table 5.
The LCOE of nuclear power and coal power in China.
| Technology | Region/Type | Unit Investment Cost (Yuan/KW) | Utilization Hour (h) | Fuel Price (yuan) | LCOE (yuan/KWh) |
|---|---|---|---|---|---|
| 1 GW USC | East China | 3400 | 4317 | 519 | 0.32 |
| Nuclear power | HTGR (Shandong) | 40,000 (First reactor in Shidao Bay) | 7500 | 0.08 | 0.71 |
| 7000 | 0.09 | 0.76 | |||
| 6000 | 0.1 | 0.88 | |||
| AP1000 (Zhejiang) | 21,000 (First reactor) | 7500 | 0.08 | 0.45 | |
| 7000 | 0.09 | 0.48 | |||
| 6000 | 0.1 | 0.55 | |||
| Hualong 1 (Fujian) | 20,000 (First reactor) | 7500 | 0.08 | 0.43 | |
| 7000 | 0.09 | 0.46 | |||
| 6000 | 0.1 | 0.54 |
Table 6.
The average income and expenses for three scenarios.
| Region/Type | Utilization Hour (h) | S1 (Million Yuan) | S2 (Million Yuan) | S3 (Million Yuan) | |||
|---|---|---|---|---|---|---|---|
| Income | Expense | Income | Expense | Income | Expense | ||
| HTGR (Shandong) | 7500 | 383 | 294 | 383 | 300 | 285 | 284 |
| 7000 | 357 | 297 | 357 | 303 | 266 | 288 | |
| 6000 | 306 | 304 | 306 | 310 | 228 | 295 | |
| AP1000 (Zhejiang) | 7500 | 383 | 190 | 383 | 193 | 285 | 185 |
| 7000 | 357 | 194 | 357 | 197 | 266 | 188 | |
| 6000 | 306 | 201 | 306 | 204 | 228 | 191 | |
| Hualong 1 (Fujian) | 7500 | 383 | 185 | 383 | 188 | 285 | 179 |
| 7000 | 357 | 188 | 357 | 191 | 266 | 183 | |
| 6000 | 306 | 195 | 306 | 198 | 228 | 190 | |
Scenario 1: The policy of benchmarking on-grid price for nuclear power will persist. The tariff is 0.43 yuan/KWh [52]. Scenario 2: In addition to the benchmarking price, nuclear power will assume the extra cost of ancillary service obligations. Scenario 3: In power market, nuclear power will have to compete with coal power and take the same price as coal power. The cost calculation for three scenarios is shown in Figure 9.
Table 7.
The full investment IRR of GIII for three scenarios.
| Region/Type | Utilization Hour (h) | Full Investment IRR | ||
|---|---|---|---|---|
| S1 | S2 | S3 | ||
| HTGR (Shandong) | 7500 | 3.88% | 2.99% | 0.32% |
| 7000 | 2.96% | 2.04% | −0.61% | |
| 6000 | 0.93% | −0.99% | −2.77% | |
| AP1000 (Zhejiang) | 7500 | 13.39% | 12.15% | 8.67% |
| 7000 | 12.10% | 10.85% | 7.56% | |
| 6000 | 9.41% | 8.15% | 5.19% | |
| Hualong 1 (Fujian) | 7500 | 14.30% | 13% | 9.41% |
| 7000 | 12.96% | 11.67% | 8.27% | |
| 6000 | 10.17% | 9.16% | 5.84% | |
Table 8.
Avoided CO2 cost of USC and Nuclear power.
| 1 GW USC | 1 GW USC + CCS | Nuclear Power | |
|---|---|---|---|
| Unit investment cost (yuan/KW) | 3600 | 3600 + 2000 | 17,000 |
| Utilization hour | 5000 | 5000 | 7000 |
| Heat rate (generation) (gce/KWh) | 270 | 270 | - |
| Energy penalty | - | 30% | - |
| Decarbonization efficiency | - | 85% | - |
| LCOE (yuan/KWh) | 0.37 | 0.53 | 0.4 |
| Avoided CO2 cost (yuan/ton) | - | 750 | 214 |
Note: gce = 1 g of standard coal equivalent.
| GDP Growth Rate (%) | Electricity Demand Growth Rate (%) | Installed Capacity of Nuclear Power (GW) | Electricity Generation of Nuclear Power (TWh) | The Proportion of Nuclear Power Generation (%) | |
|---|---|---|---|---|---|
| 2015 | 7.20% | 1.00% | 26.43 | 169 | 3% |
| 2016 | 6.80% | 5.00% | 33.63 | 210.5 | 3.56% |
| 2017 | 6.60% | 6.60% | 34.73 | 247.5 | 3.94% |
| 2020 | 6.10% | 5.50% | 53 | 345–396 | 4.4–5.1% |
| 2025 | 5.30% | 4.00% | 120 | 780–900 | 8.5–9.8% |
| 2030 | 4.70% | 2.00% | 190 | 1235–1425 | 12.8–14.8% |
© 2018 by the authors. Licensee MDPI, Basel, Switzerland. This article is an open access article distributed under the terms and conditions of the Creative Commons Attribution (CC BY) license (http://creativecommons.org/licenses/by/4.0/).
Share and Cite
MDPI and ACS Style
Xu, Y.; Kang, J.; Yuan, J. The Prospective of Nuclear Power in China. Sustainability 2018, 10, 2086. https://doi.org/10.3390/su10062086
AMA Style
Xu Y, Kang J, Yuan J. The Prospective of Nuclear Power in China. Sustainability. 2018; 10(6):2086. https://doi.org/10.3390/su10062086
Chicago/Turabian StyleXu, Yan, Junjie Kang, and Jiahai Yuan. 2018. "The Prospective of Nuclear Power in China" Sustainability 10, no. 6: 2086. https://doi.org/10.3390/su10062086
Note that from the first issue of 2016, this journal uses article numbers instead of page numbers. See further details here.