Short-Term Performance of Sustainable Silica Fume Mortars Exposed to Sulfate Attack
by
 , and
, and
José Marcos Ortega
1,2,* ,
,
María Dolores Esteban
2,
Mark Williams
3,
Isidro Sánchez
1 and
Miguel Ángel Climent
1
1
Departamento de Ingeniería Civil, Universidad de Alicante, Ap. Correos 99, 03080 Alicante, Spain
2
Departamento de Ingeniería Civil, Urbanismo y Aeroespacial, Escuela de Arquitectura, Ingeniería y Diseño, Universidad Europea, c/Tajo s/n, Villaviciosa de Odón, 28670 Madrid, Spain
3
Engineeria, 7 Ridgmount Street, London WC1E 7AE, UK
*
Author to whom correspondence should be addressed.
Sustainability 2018, 10(7), 2517; https://doi.org/10.3390/su10072517
Submission received: 28 June 2018
/
Revised: 13 July 2018
/
Accepted: 13 July 2018
/
Published: 18 July 2018
(This article belongs to the Special Issue Sustainable Cementitious Materials for the Construction Industry)
Abstract
:Nowadays, the reuse of wastes is essential in order to reach a more sustainable environment. The cement production results in CO2 emissions which significantly contribute to anthropogenic greenhouse gas emissions. One way to reduce them is by partially replacing clinker by additions, such as silica fumes or other wastes. On the other hand, the pore structure of cementitious materials has a direct influence on their service properties. One of the most popular techniques for characterizing the microstructure of those materials is mercury intrusion porosimetry. In this work, this technique has been used for studying the evolution of the pore network of mortars with different percentages of silica fume (until 10%), which were exposed to aggressive sodium and magnesium sulfate solutions up to 90 days. Between the results of this technique, intrusion-extrusion curves and logarithms of differential intrusion volume versus pore size curves were studied. This characterization of the pore network of mortars has been complemented with the study of their compressive strength and their steady-state ionic diffusion coefficient obtained from samples’ resistivity. Generally, silica fume mortars showed different performance depending on the aggressive condition, although the greatest deleterious effects were observed in the medium with presence of both magnesium and sodium sulfates.
1. Introduction
Nowadays, the use of additions in the cement production as clinker replacement has become very popular [1,2,3,4,5,6] because they provide several environmental benefits such as the reduction of CO2 emissions produced along the cement manufacture. Furthermore, most of these additions are residues which come from other industrial sectors. Therefore, their reuse also constitutes a benefit by itself.
One of the most used active additions is silica fume [7,8,9,10]. On one hand, it has been established by various authors that silica fume addition results in an improvement in durability-related characteristics such as permeability [11,12,13], electrical resistivity [14,15] and chloride diffusivity [16,17,18]. These parameters are of fundamental importance as they affect the corrosion of reinforcing steel, which many authors consider to be the most severe pathology affecting reinforced concrete structures [19].
On the other hand, sulfate attack is another pathology which could produce a deleterious effect in cement-based materials and structures [20,21], such those in contact with aggressive soils and waters. The classic harmful effects of this attack (ettringite and gypsum formation) are associated with the sulfate anion. It has been suggested that among the most typical associated cations, calcium and sodium are innocuous, while magnesium is aggressive [19]. The chemical reactions produced by the sodium sulfate attack are shown in Equations (1) and (2). The reaction of Equation (2) produces the formation of expansive ettringite crystals.
Ca(OH)2 + Na2SO4 + 2H2O → CaSO4·2H2O + 2NaOH
3CaO·Al2O3 + 3CaSO4·2H2O + 26H2O → 3CaOAl2O33CaSO4·32H2O
The chemical reactions produced by the magnesium ion are shown in Equations (3) and (4). The reaction shown in Equation (3) results in the formation of magnesium hydroxide, or brucite, and is not greatly deleterious as calcium hydroxide does not contribute much to the strength of the hardened cement paste. The reaction shown in Equation (4) is referred to as decalcification henceforth, and results in a severe loss of compressive strength due to the conversion of conglomerate calcium silica hydrate (C-S-H) gels into non-conglomerate magnesium silica hydrates (M-S-H) [22,23,24].
Mg2+ + Ca(OH)2→ Mg(OH)2 + Ca2+
Mg2+ + C-S-H → M-S-H + Ca2+
In relation to silica fume addition, it has been well documented that this addition increases resistance to sulfate ion attack, due to the consumption of portlandite during the pozzolanic reaction [25,26]. Then, as less portlandite is available to react with sulfate ions, fewer expansive reaction products (gypsum and ettringite) are formed. Other authors have observed experimentally that these results entailed a substantial reduction in expansion and a lower loss of compressive strength in silica fume blended cements [25,26,27].
However, when the associated cation is magnesium, the addition of silica fume has been shown to result in greater deterioration [26,28,29]. It has been agreed that this is a result of the lower availability of portlandite, which reacts with magnesium to form a double layer of brucite and gypsum, which was experimentally observed by Lee et al., 2005 [26]. This forms a barrier to the ingress of sulfate and magnesium ions, and additionally means that fewer magnesium ions are available to react with the hardened cement paste’s calcium silica hydrate gels (so-called “decalcification”) [26]. The latter reaction is far more damaging, as the resulting magnesium silica hydrate gels are non-conglomerate. Decalcification therefore results in the disintegration of the hardened cement paste and an important loss of compressive strength.
Whereas the effects of reactions involving the sulfate anion have been extensively studied, the microstructural changes produced in the pore network have received less attention, especially in terms of porosity and pore size distribution. Furthermore, the current literature available does not consider the effects of microstructure deterioration resulting from exposure to either sulfate or magnesium ions on durability characteristics and mechanical properties, although some authors have noted small decreases in porosity during the initial phases of sulfate ion attack [30].
Then, the purpose of the present paper is to investigate the effect of exposure to magnesium and sodium sulfate solutions on the pore network of sustainable mortars containing silica fume, compared to mortars prepared with ordinary Portland cement without additions, using several results provided by mercury intrusion porosimetry technique. This characterization of the pore network of the mortars has been complemented with the study of their compressive strength and their steady-state ionic diffusion coefficient indirectly obtained from samples’ resistivity.
2. Materials and Methods
2.1. Sample Preparation and Curing
Three types of mortars were analyzed. For all of them the cement used was a high early strength type, belonging to European cement class CEM I 42.5 R [31]. The first type of mortar had no addition of silica fume (referred to as 0% silica fume mortar hereafter), and it was used as a pattern for performance. Apart from that, two mortars in which 5% and 10% of cement was replaced with silica fume were also studied (designated as 5% silica fume and 10% silica fume mortars respectively from now on). The silica fume used was not densified, with 90.78% of its particles under 1 µm and an average particle diameter of 0.67 µm. The chemical composition of the materials is shown in Table 1. The fine aggregate to binder ratio was 3:1 and the water to binder ratio was 0.5, as prescribed by standard UNE-EN 196-1 [32]. Cylindrical (10 cm diameter and 15 cm height) and prismatic (4 cm × 4 cm × 16 cm) specimens were made. The samples were cured for 7 days in a temperature and humidity controlled chamber at 20 °C and 95% relative humidity (RH) [33,34]. Following this period they were de-molded, cut to shape as required, and introduced into the corresponding sulfate solution. In particular, the cylindrical specimens were cut in 2 cm thick slices, and the prismatic samples were divided in three identical elements whose dimensions were 4 cm × 4 cm × 5.3 cm. The samples were tested at different times, until 90 days of contact with the sulfate solutions.
2.2. Sulfate Solutions
The specimens were exposed to three sulfate solutions. The sulfate solutions used consisted of combinations of reagent grade magnesium sulfate (MgSO4) and sodium sulfate (Na2SO4) dissolved in distilled water, and changed once after 45 days. The content in sulfate and magnesium ions present in each solution is shown in Table 2. Each solution is denominated by the percentage by weight of dissolved sulfates. The volume of solutions was approximately 4 times the volume of the samples, as is suggested by the ASTM C 1012-04 standard [35]. Finally, the relatively high concentration of sulfate (15%) was chosen for speeding up the harmful effects produced by this aggressive ion, in order to note them at short exposure times.
2.3. Mercury Intrusion Porosimetry
A porosimeter model AUTOPORE IV 9500 of Micromeritics (Norcross, GA, USA) was used. The apparatus allowed the determination of the volume of pores with an accessible diameter of 5 nm to 900 µm. The samples were taken from slices with 2 cm thickness, and they were dried in an oven at 50 °C during 7 days before the test. Two measurements were performed for each material, solution and testing age. The intrusion-extrusion curves, the curves logarithm of differential intrusion volume versus pore size and the median pore diameter were analyzed [36,37,38,39]. The tests were made at 21 and 90 days of exposure to the different studied solutions.
2.4. Determination of Steady-State Ionic Diffusion Coefficient from Resistivity of Sample Obtained Using Impedance Spectroscopy
The electrical resistivity measurement of a cement-based material is an indirect method to assess their pore connectivity and determine the ionic steady-state diffusion coefficient DS [40]. Here, the electrical resistivity was calculated from the electrical resistance of the specimens immersed in the sulfate solutions, using the non-destructive impedance spectroscopy technique [41,42,43]. This technique has successfully been used in several previous authors’ researches for characterizing the pore network of cement-based materials with silica fume [44] and other active additions [45].
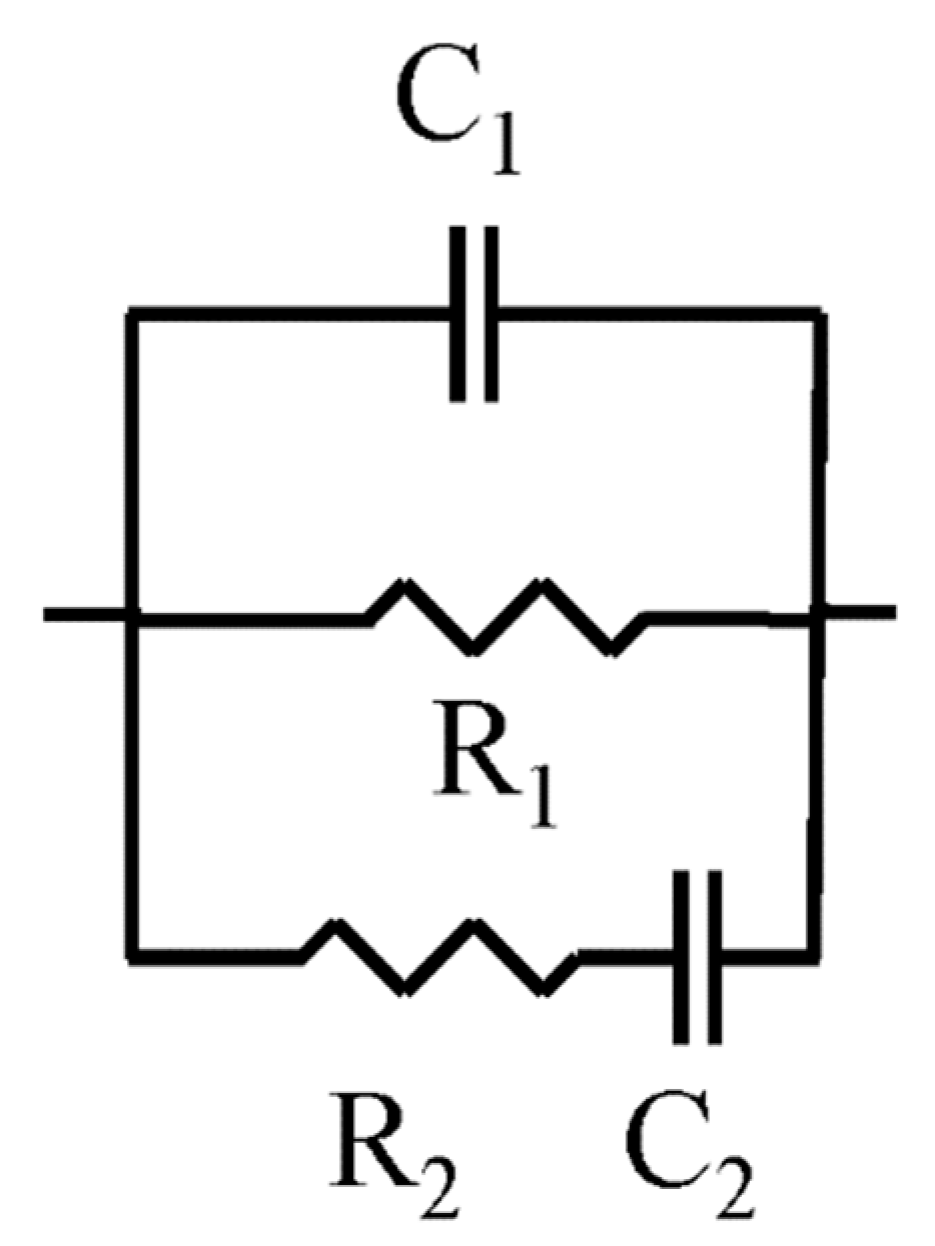
In the current work, the impedance measurements were carried out in 2 cm thick slices using an impedance analyzer Agilent 4294A (Agilent Technologies, Kobe, Japan), capable of capacitance measurements in the 10−14–0.1 F range, with a maximum resolution of 10−15 F. Circular copper electrodes with a flexible graphite contact surface and a diameter of 8 cm were used, and measurements were taken over a frequency range of 100 Hz to 100 MHz. The electrodes were placed in direct contact with the samples during measurement. The obtained spectra were fitted to the equivalent circuit proposed by Cabeza et al. [42] (see Figure 1) using a simplex algorithm, described elsewhere [46]. One of the circuital elements is the resistance R1 (see Figure 1), which is associated with pores that cross the sample. This resistance R1 is equivalent to the electrical resistance of the sample [47,48].
The steady-state ionic diffusion coefficient (Ds) was calculated according to the expression proposed by Andrade et al. [40], shown in Equation (5), in which the coefficient Ds is expressed in m2/s, and the electrical resistivity ρ in Ω·m.
For each mortar type and solution four different samples were tested. The variation in steady-state ionic coefficient was followed up to 90 days of exposure to the sulfate solutions.
2.5. Compressive Strength
The compressive strength was determined according to the Spanish standard UNE-EN 196-1 [32], in prisms of dimensions 4 cm × 4 cm × 5.3 cm. This parameter is commonly used in literature for analysing the performance of cement-based materials against sulfate attack [26,29,49]. Three different samples were tested for each mortar type and solution. This parameter was obtained at 21 and 90 days of exposure to the sulfate solutions.
3. Results and Discussion
3.1. Mercury Intrusion Porosimetry
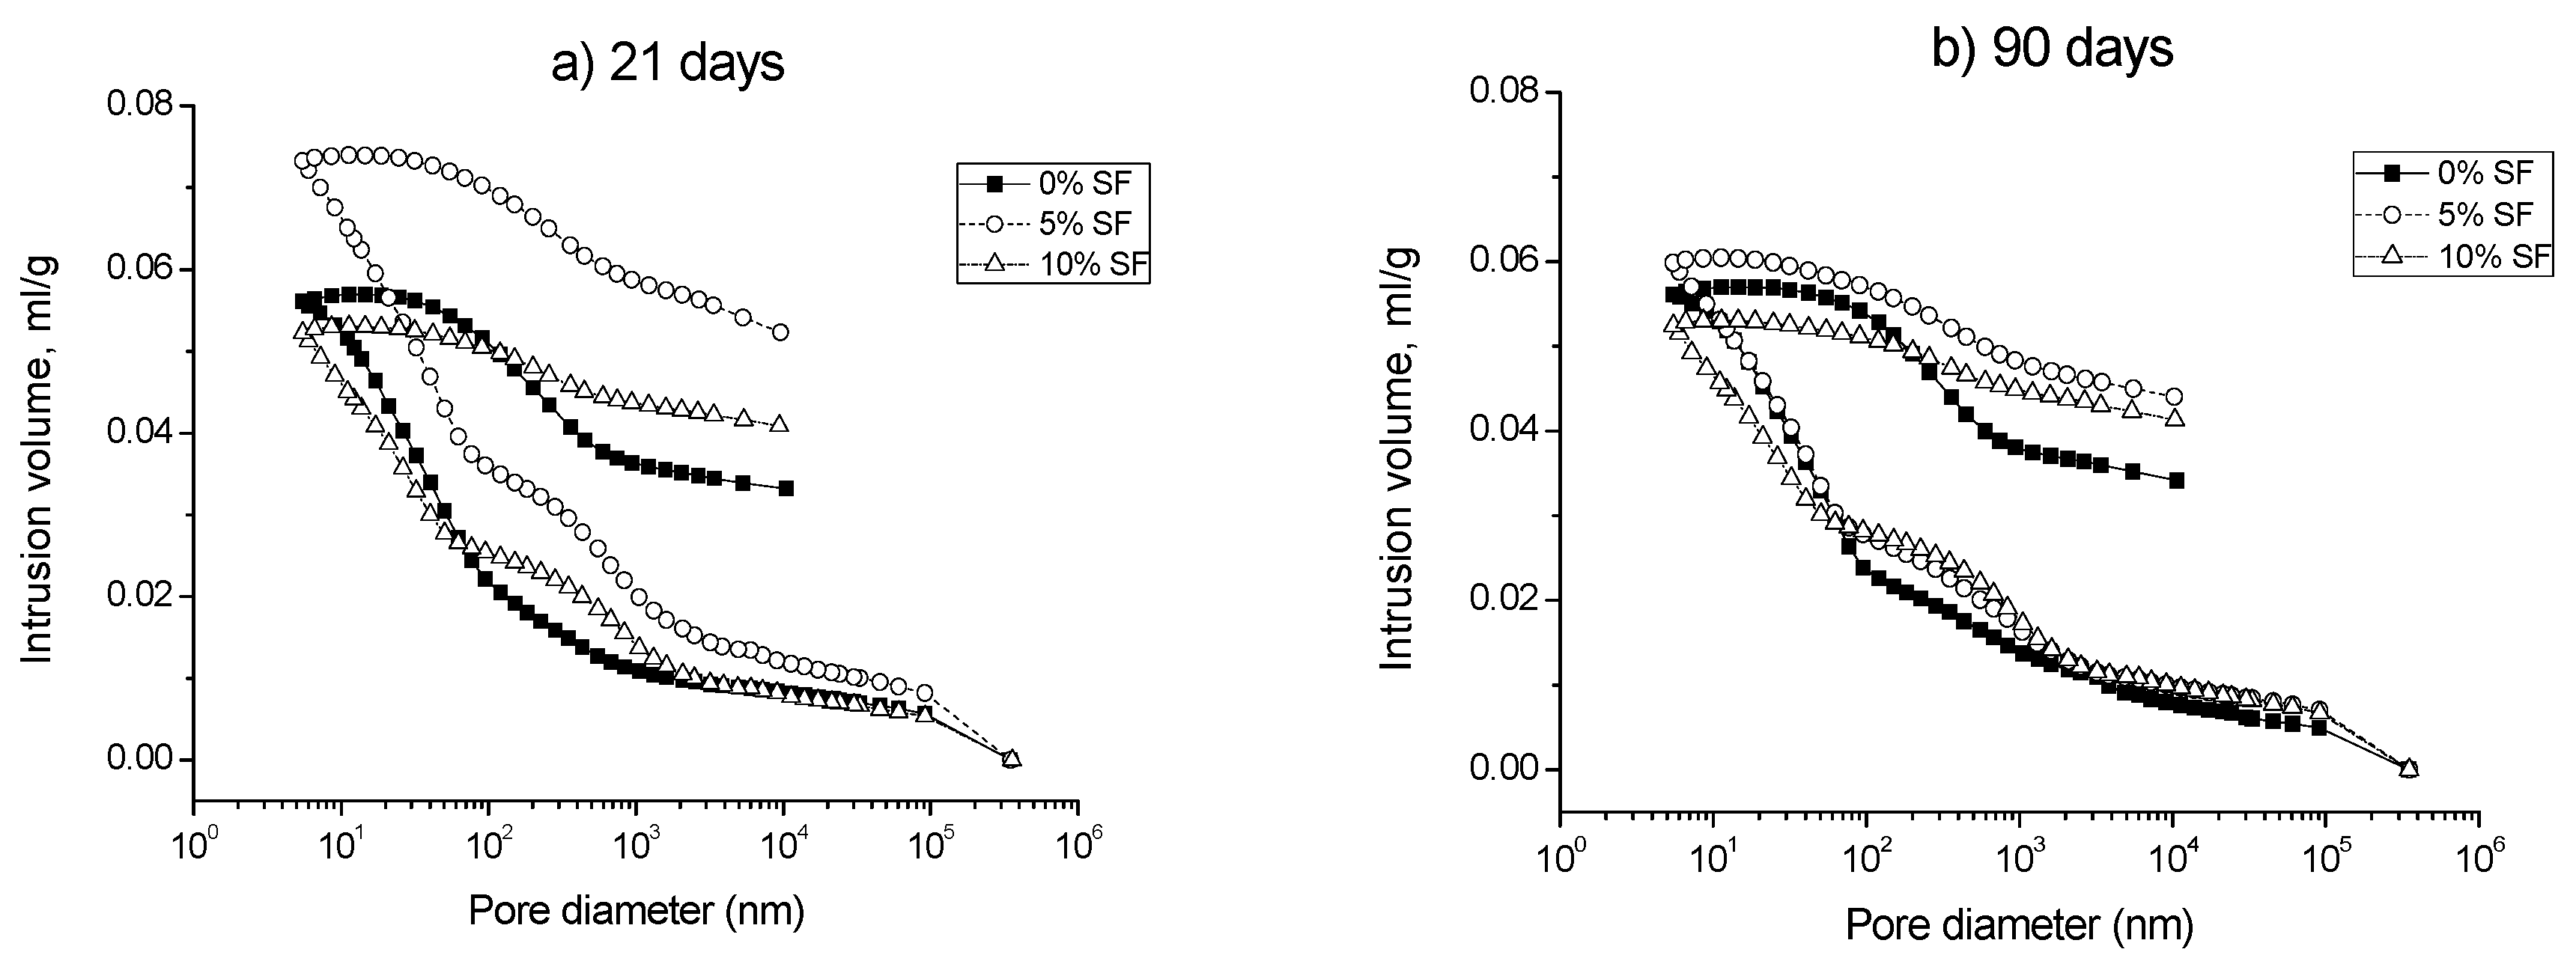
The intrusion-extrusion curves for samples exposed to the 15% Na2SO4 solution obtained at 21 and 90 days are shown in Figure 2a,b respectively, and their median pore diameters can be observed in Table 3 and Figure 3. It may be noted that in the 0% silica fume samples, the total intrusion volume increased very slightly with exposure period, increasing by less than 1% from 21 days to 90 days exposure, see Figure 2. For the median pore diameter, an increase was observed. Some variations were also observed in the values recorded in the 5% and 10% silica fume samples. For 5% silica fume specimens, a slight increase in the total intrusion volume has been noted, as well as for the median pore diameter. In the case of 10% silica fume samples, the total intrusion volume slightly decreased from 21 to 90 days, and the median pore diameter rose in this period. The lowest increase of this parameter between 21 and 90 days has been observed for 10% silica fume specimens, followed by 5% silica fume ones. On the other hand, for the 15% Na2SO4 solution the highest increase of the median pore diameter along the studied period corresponded to 0% silica fume samples.
The intrusion-extrusion curves for samples exposed to the mixed solution at 21 and 90 days are shown in Figure 4a,b respectively, and their median pore diameters can be observed in Table 3 and Figure 3. The total intrusion volume was relatively unaffected by exposure to this 7.5% MgSO4 + 7.5% Na2SO4 solution in the 0% and 10% silica fume samples, and that a reduction was observed with exposure period in the 5% silica fume samples. A reduction of the median pore diameter was observed for 5% silica fume specimens. On the other hand, this parameter increased for 0% and 10% silica fume ones, being this rise very important for the last type of samples.
Regarding the samples exposed to the 15% MgSO4 solution, their intrusion-extrusion curves at 21 and 90 days can be observed in Figure 5a,b respectively, while their median pore diameters are included in Table 3 and Figure 3. Scarce differences were observed between the different types of studied samples in relation the total intrusion volume. However, the median pore diameter rose with time for all the studied samples, and this increase is higher the greater is the content of silica fume, being especially noticeable for specimens with a 10% content of this addition.
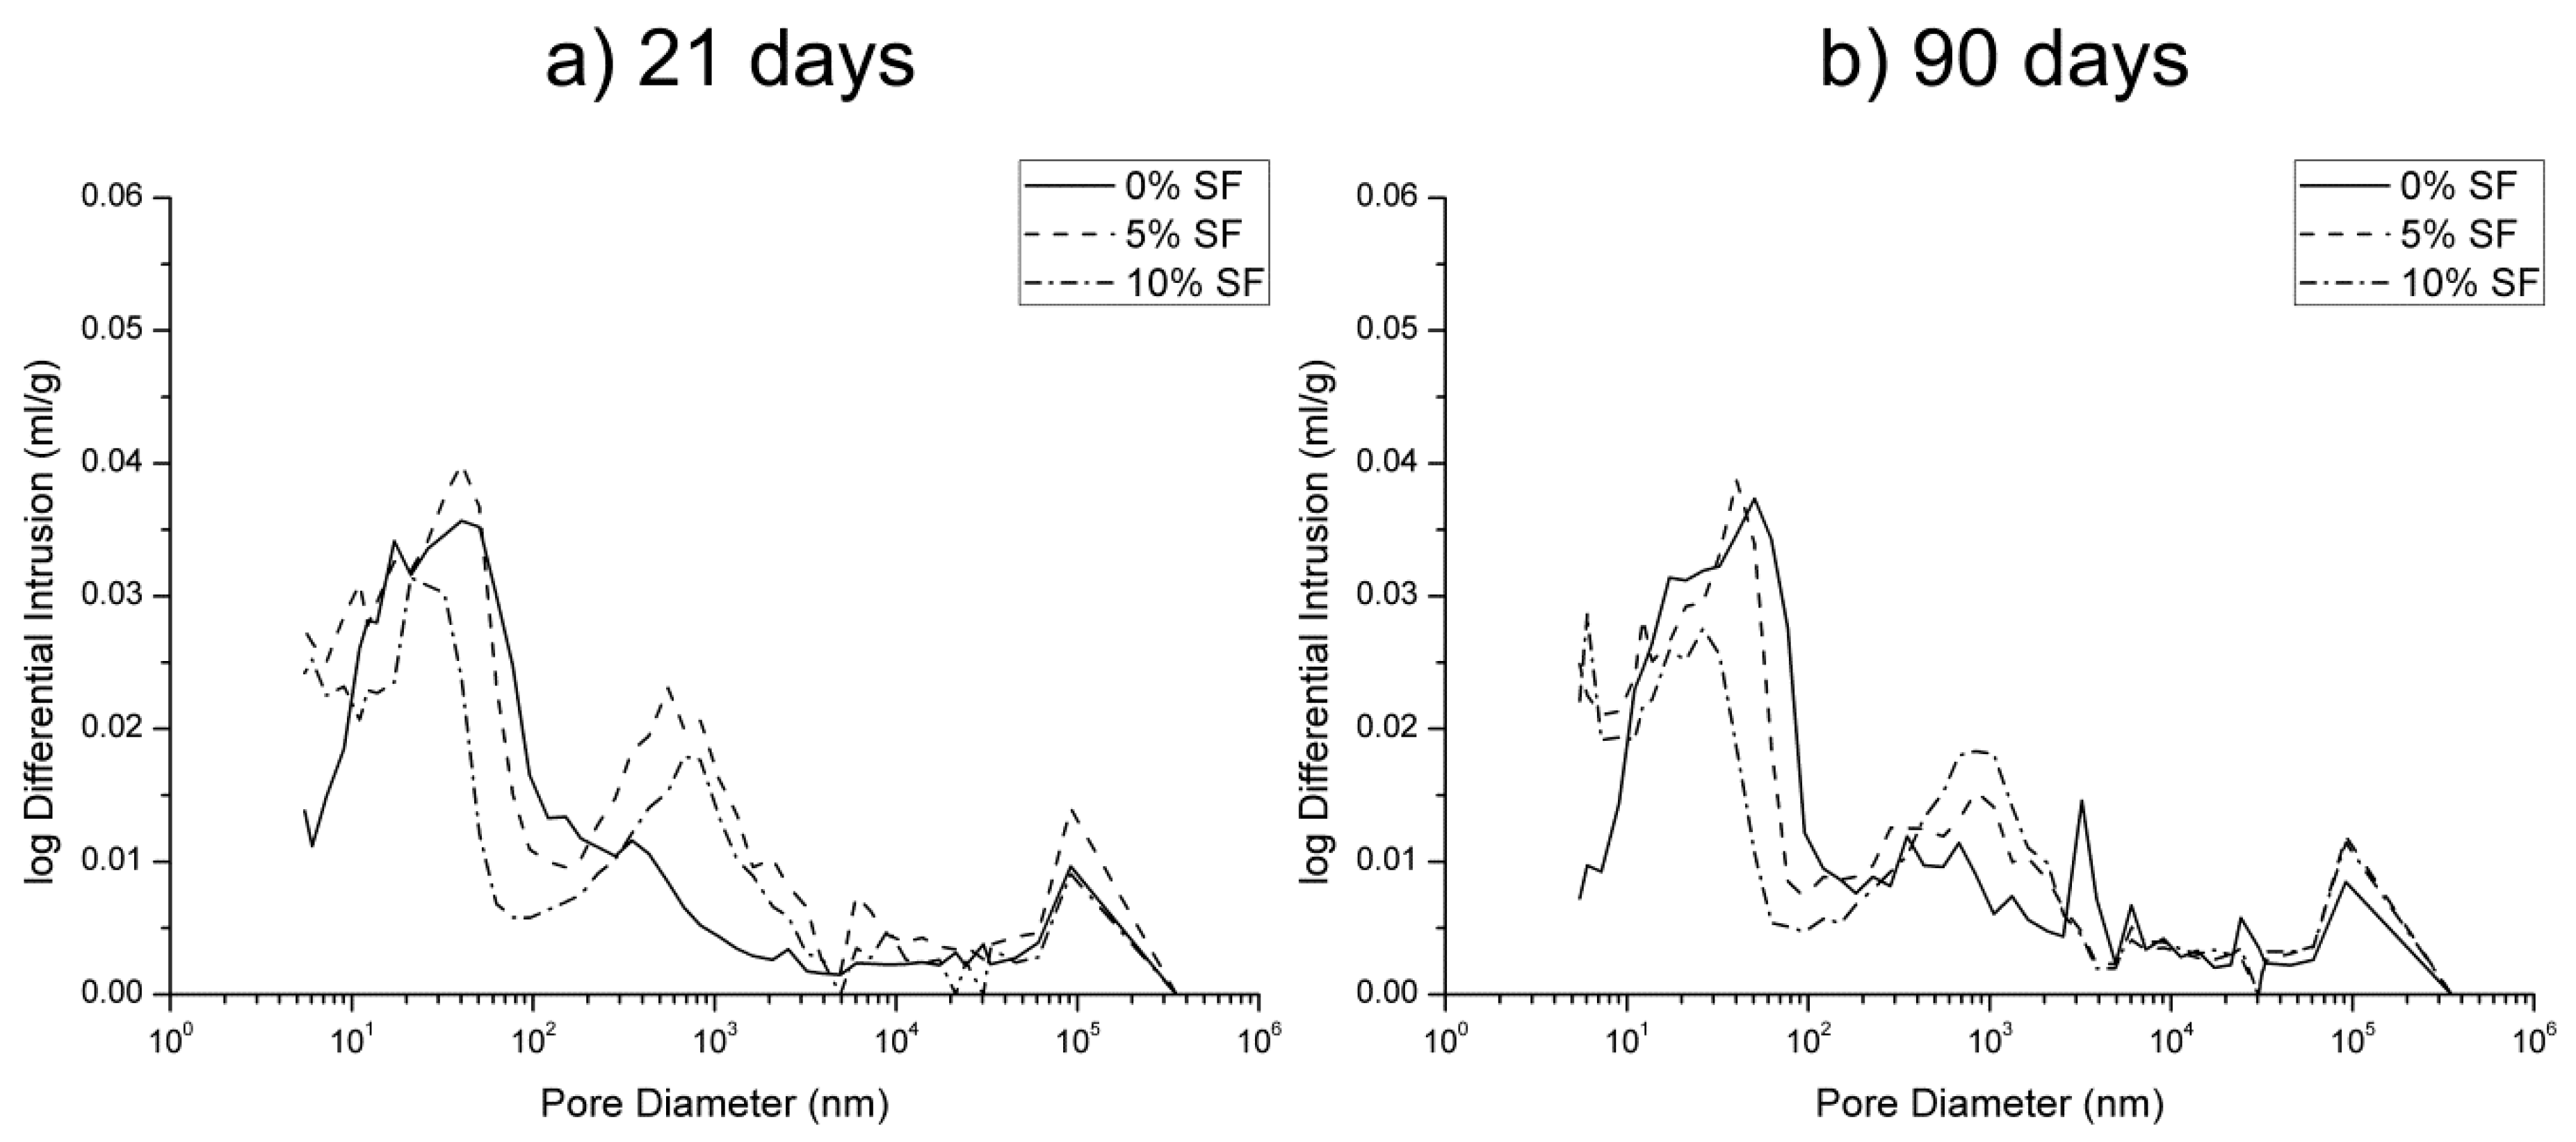
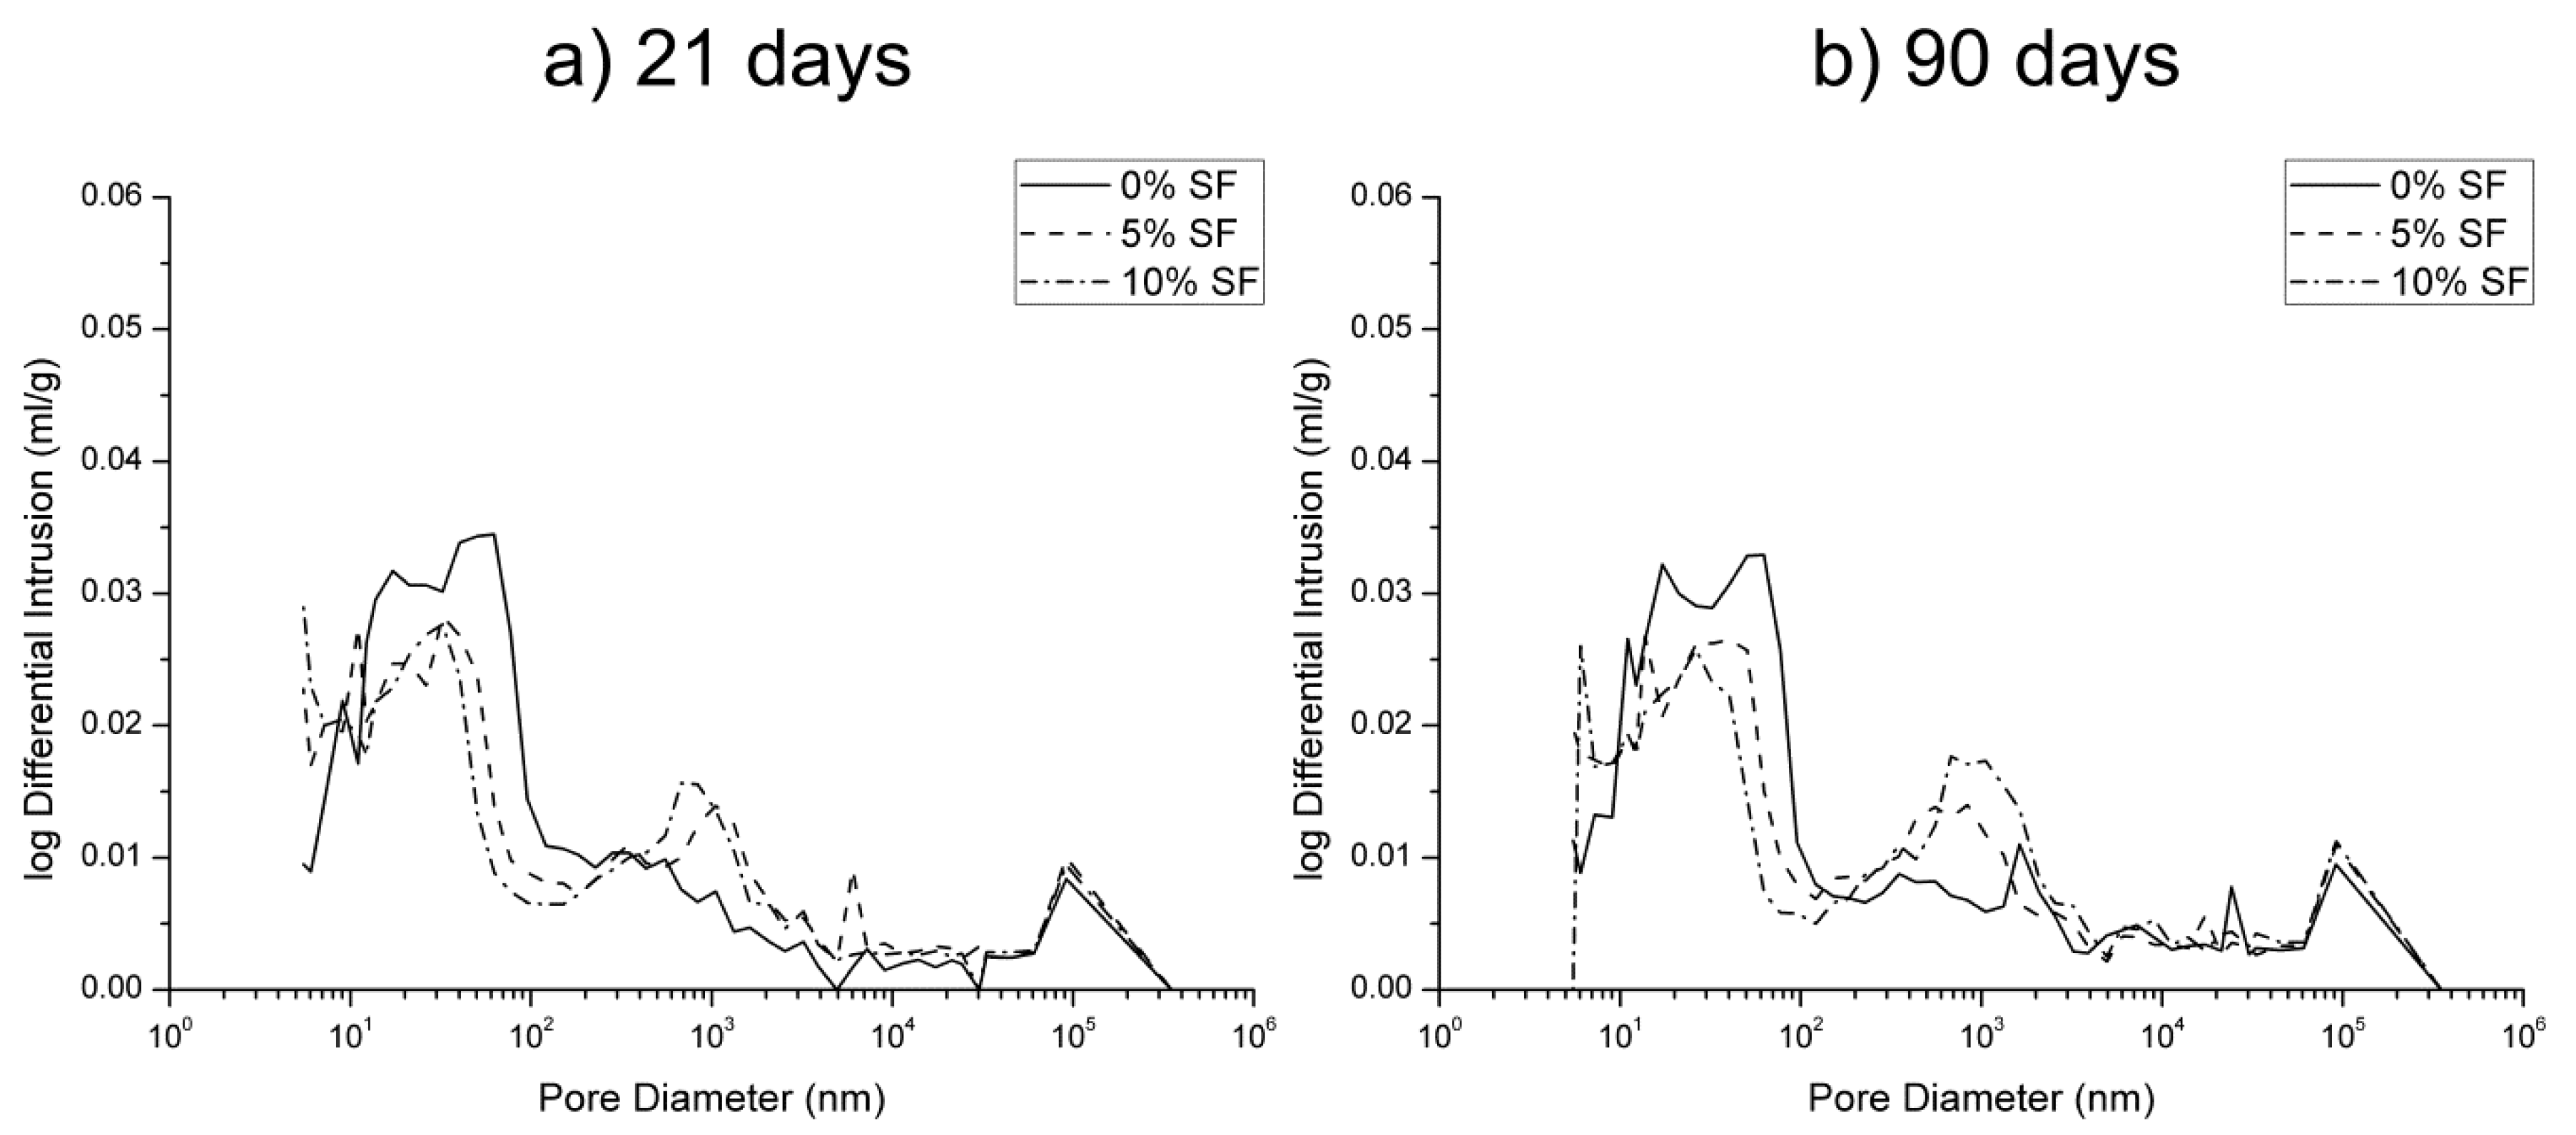
The curves logarithm of differential intrusion volume versus pore size obtained for the samples exposed to the 15% Na2SO4 solution at 21 and 90 days are presented in Figure 6a,b respectively. In the 0% silica fume samples, the principal effect appears to be on the pore family whose centre is at around 2 × 101 nm. At 90 days, a widening of this pore family may be observed and now the main peak of this family is around 102 nm. This would indicate a loss of pore refinement for 0% silica fume samples which could be due to the development of sulfate attack [44]. At 21 days the samples containing silica fume both showed two peaks in the range 101–102 nm, which merged in one peak at 90 days, whose diameter was lower than that noted for 0% silica fume specimens. This result is consistent with the established idea that samples containing silica fume show a more refined pore structure, and in agreement with results presented by other authors [13,16,50]. Furthermore, in view of the differential intrusion volume, the samples containing 10% silica fume appear not to have been greatly affected between 21 and 90 days exposure, while the 5% silica fume sample showed a greater volume of pores present in the above-mentioned pore family.
In Figure 7a,b it can be observed the curves logarithm of differential intrusion volume versus pore size obtained for the samples exposed to the mixed solution obtained at 28 and 90 days respectively. From this figure, the principal pore family (between 101 and 102 nm) for the 0% silica fume samples was relatively unaffected, although the main peak in the previously mentioned range moved to higher diameters from 21 to 90 days, and a small peak appeared at approximately 3 × 10³ nm. For samples containing silica fume, apart from the family in the range 101 and 102 nm, a prominent pore family centered at around 103 nm was observed, which was not registered in the samples exposed to the 15% Na2SO4 solution. This would mean that the microstructure of silica fume mortars would be more affected by the exposure to the mixed solution than by the sodium sulfate one, as suggested the loss of pore refinement indicated by this new pores family with higher diameter. Slight changes have been noted in the pore families observed for silica fume specimens from 21 days to 90 days, although it may be observed that the 10% silica fume samples’ principal pore family showed a small decrease.
In relation to the curves logarithm of differential intrusion volume versus pore size noted for the samples exposed to the 15% MgSO4 solution, they are depicted in Figure 8a,b for 21 and 90 exposure days. They overall showed similarities to those observed for the mixed solution. For 0% silica fume samples, the main pores family was again in the interval 101−102 nm, although at 90 days a noticeable peak appeared approximately at 2 × 10³ nm, as happened for the mixed solution. For 5% and 10% silica fume specimens the same prominent pore family at around 103 nm was present and it slightly increased in size between 21 and 90 days exposure. This appears to suggest that the formation of this pore family resulted from the deterioration processes associated with the magnesium ion [26,29], as it was not observed in the samples exposed to the 15% Na2SO4 solution. Regarding the main peak of the range 101−102 nm for the silica fume mortars, it slightly displaced to greater pore sizes between 21 and 90 days, which would show the deleterious effects of the MgSO4 solution in their microstructure [28,29].
3.2. Steady State Ionic Diffusion Coefficient
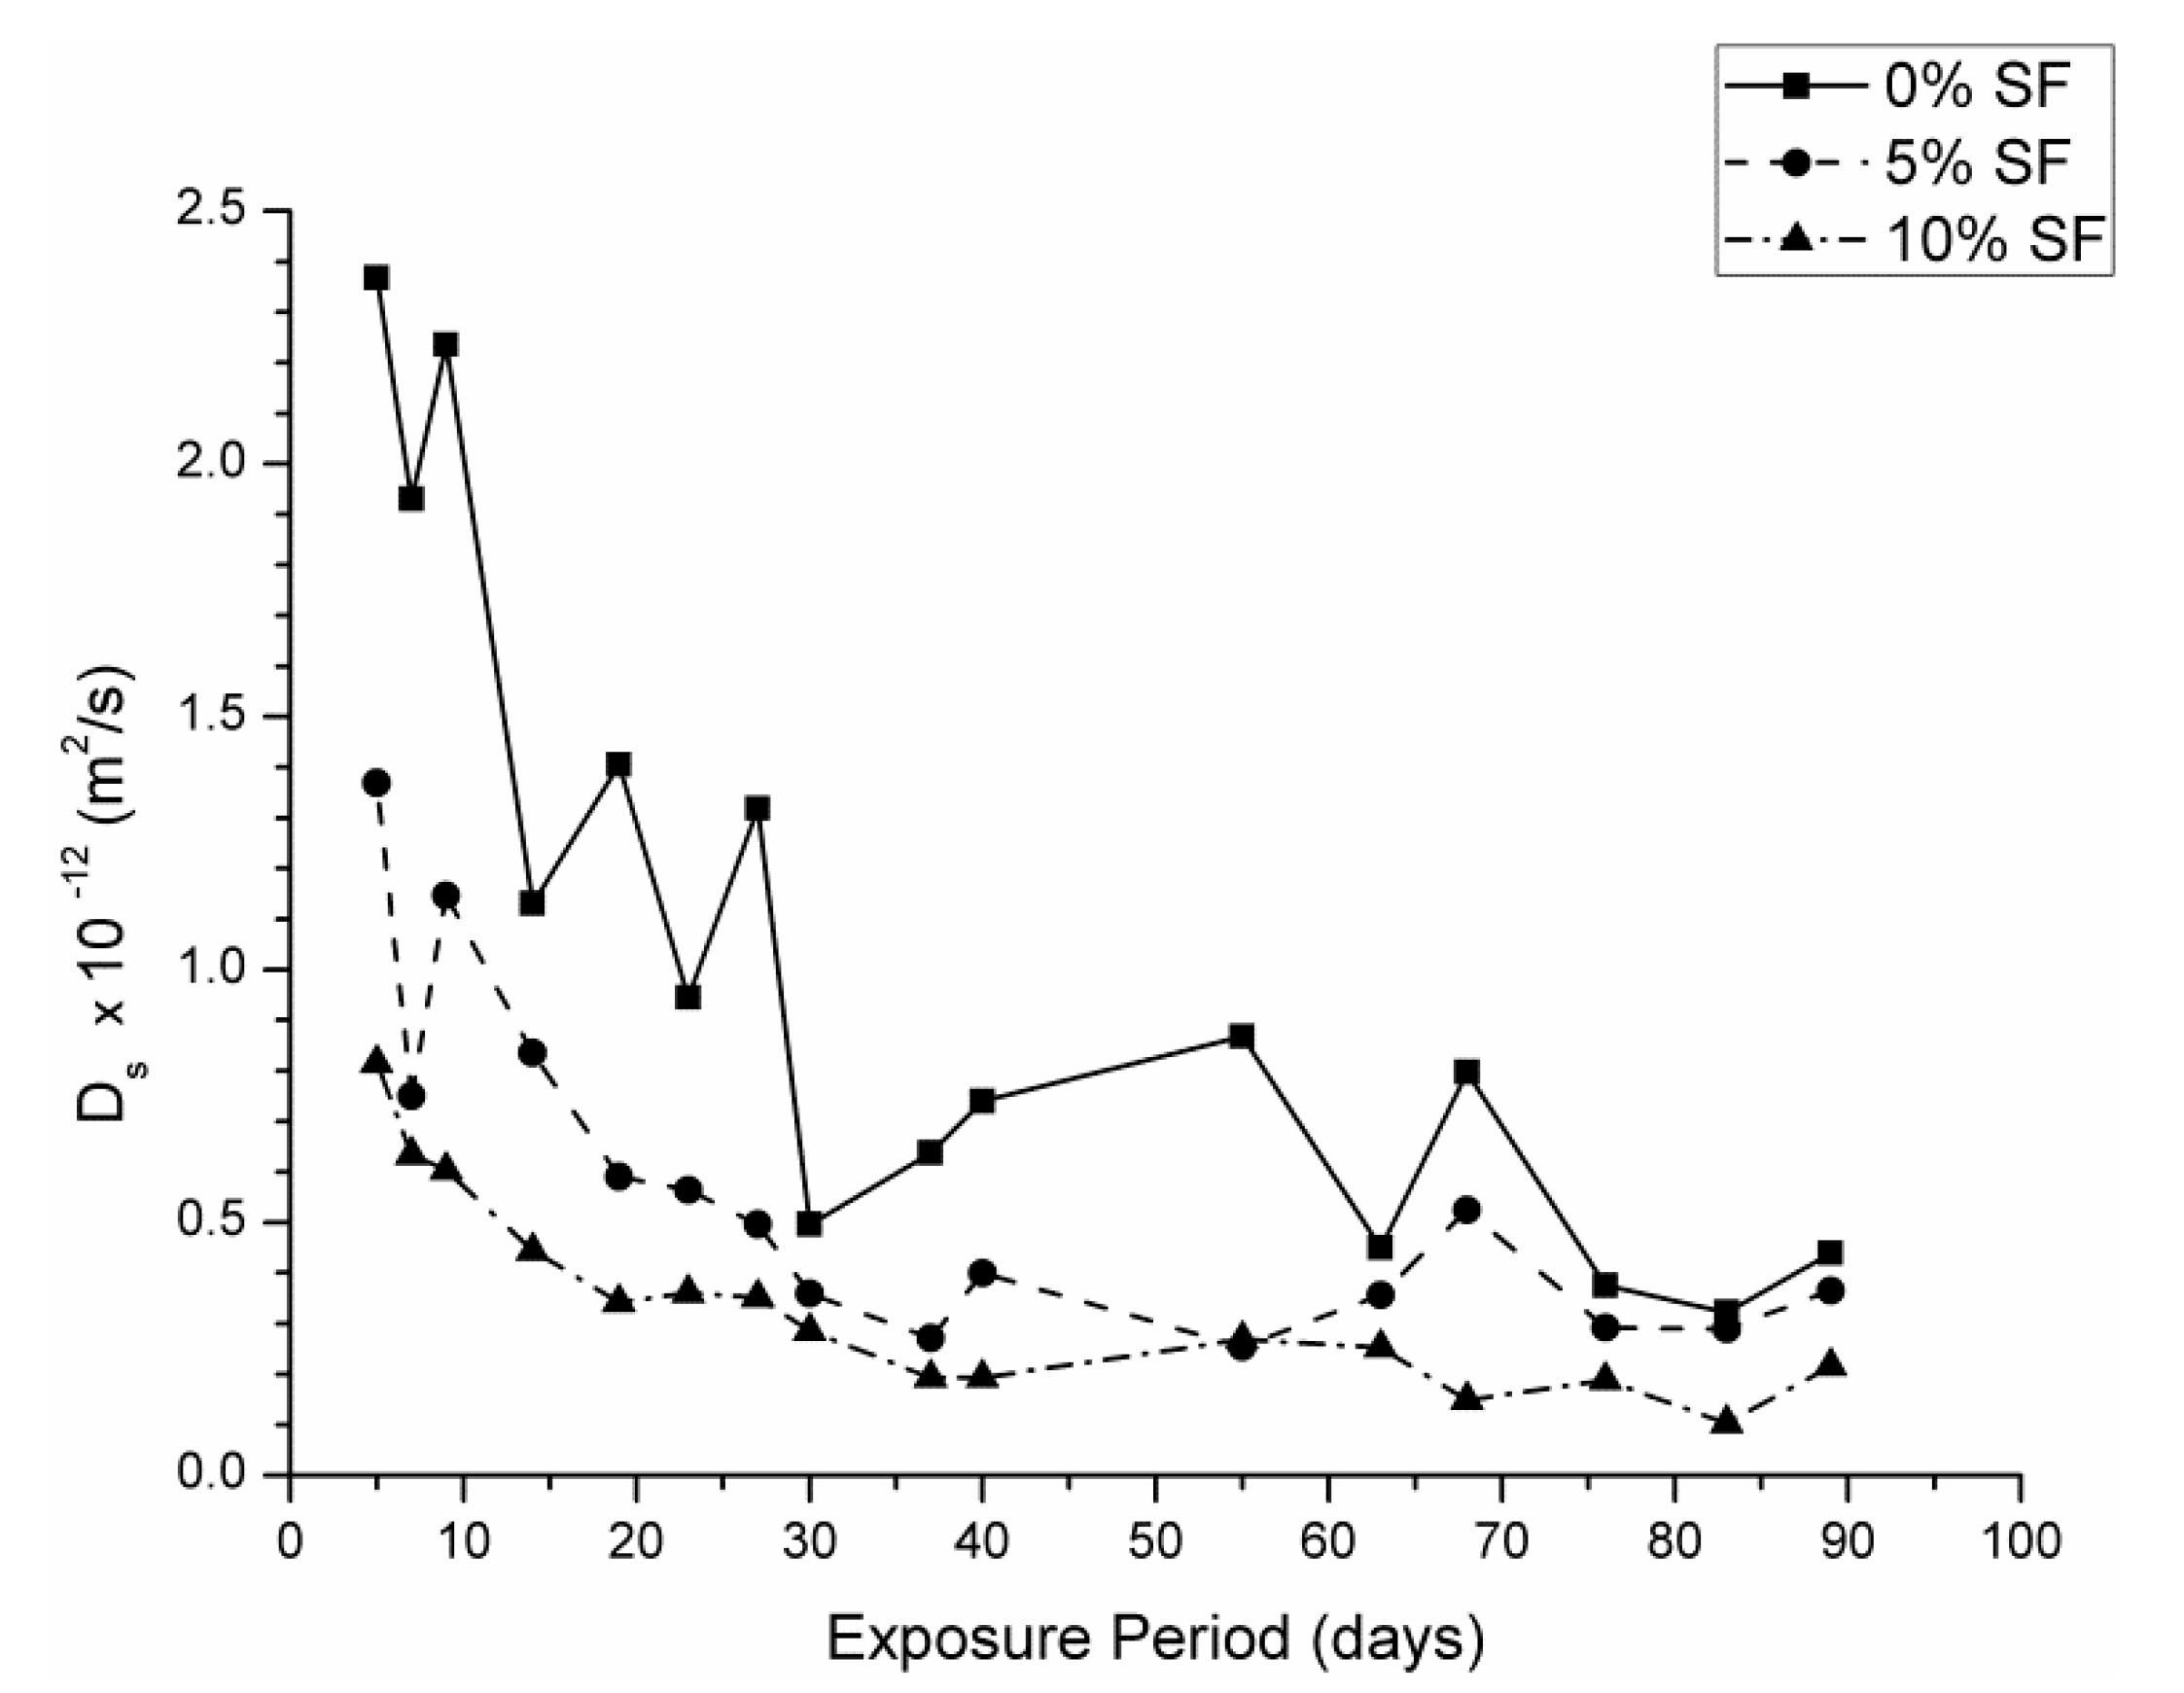
The changes with time in the steady state ionic diffusion coefficient (Ds) measured in samples exposed to the 15% Na2SO4 solution can be observed in Figure 9. This figure shows firstly that, in agreement with the published literature discussed previously [16,17,18], the steady state ionic diffusion coefficient (Ds) decreased with silica fume content. Additionally, exposure to the 15% Na2SO4 solution appears not to have produced any increase in Ds, which suggests that the sulfate resistance of the samples containing silica fume was high. In fact, the silica fume samples showed a relatively constant reduction in Ds, which may have been linked to the continued pozzolanic reaction of the silica fume present. No increase in Ds was observed in the 0% silica fume samples, implying that sulfate attack did not affect this parameter, at least during the relatively short time period studied.
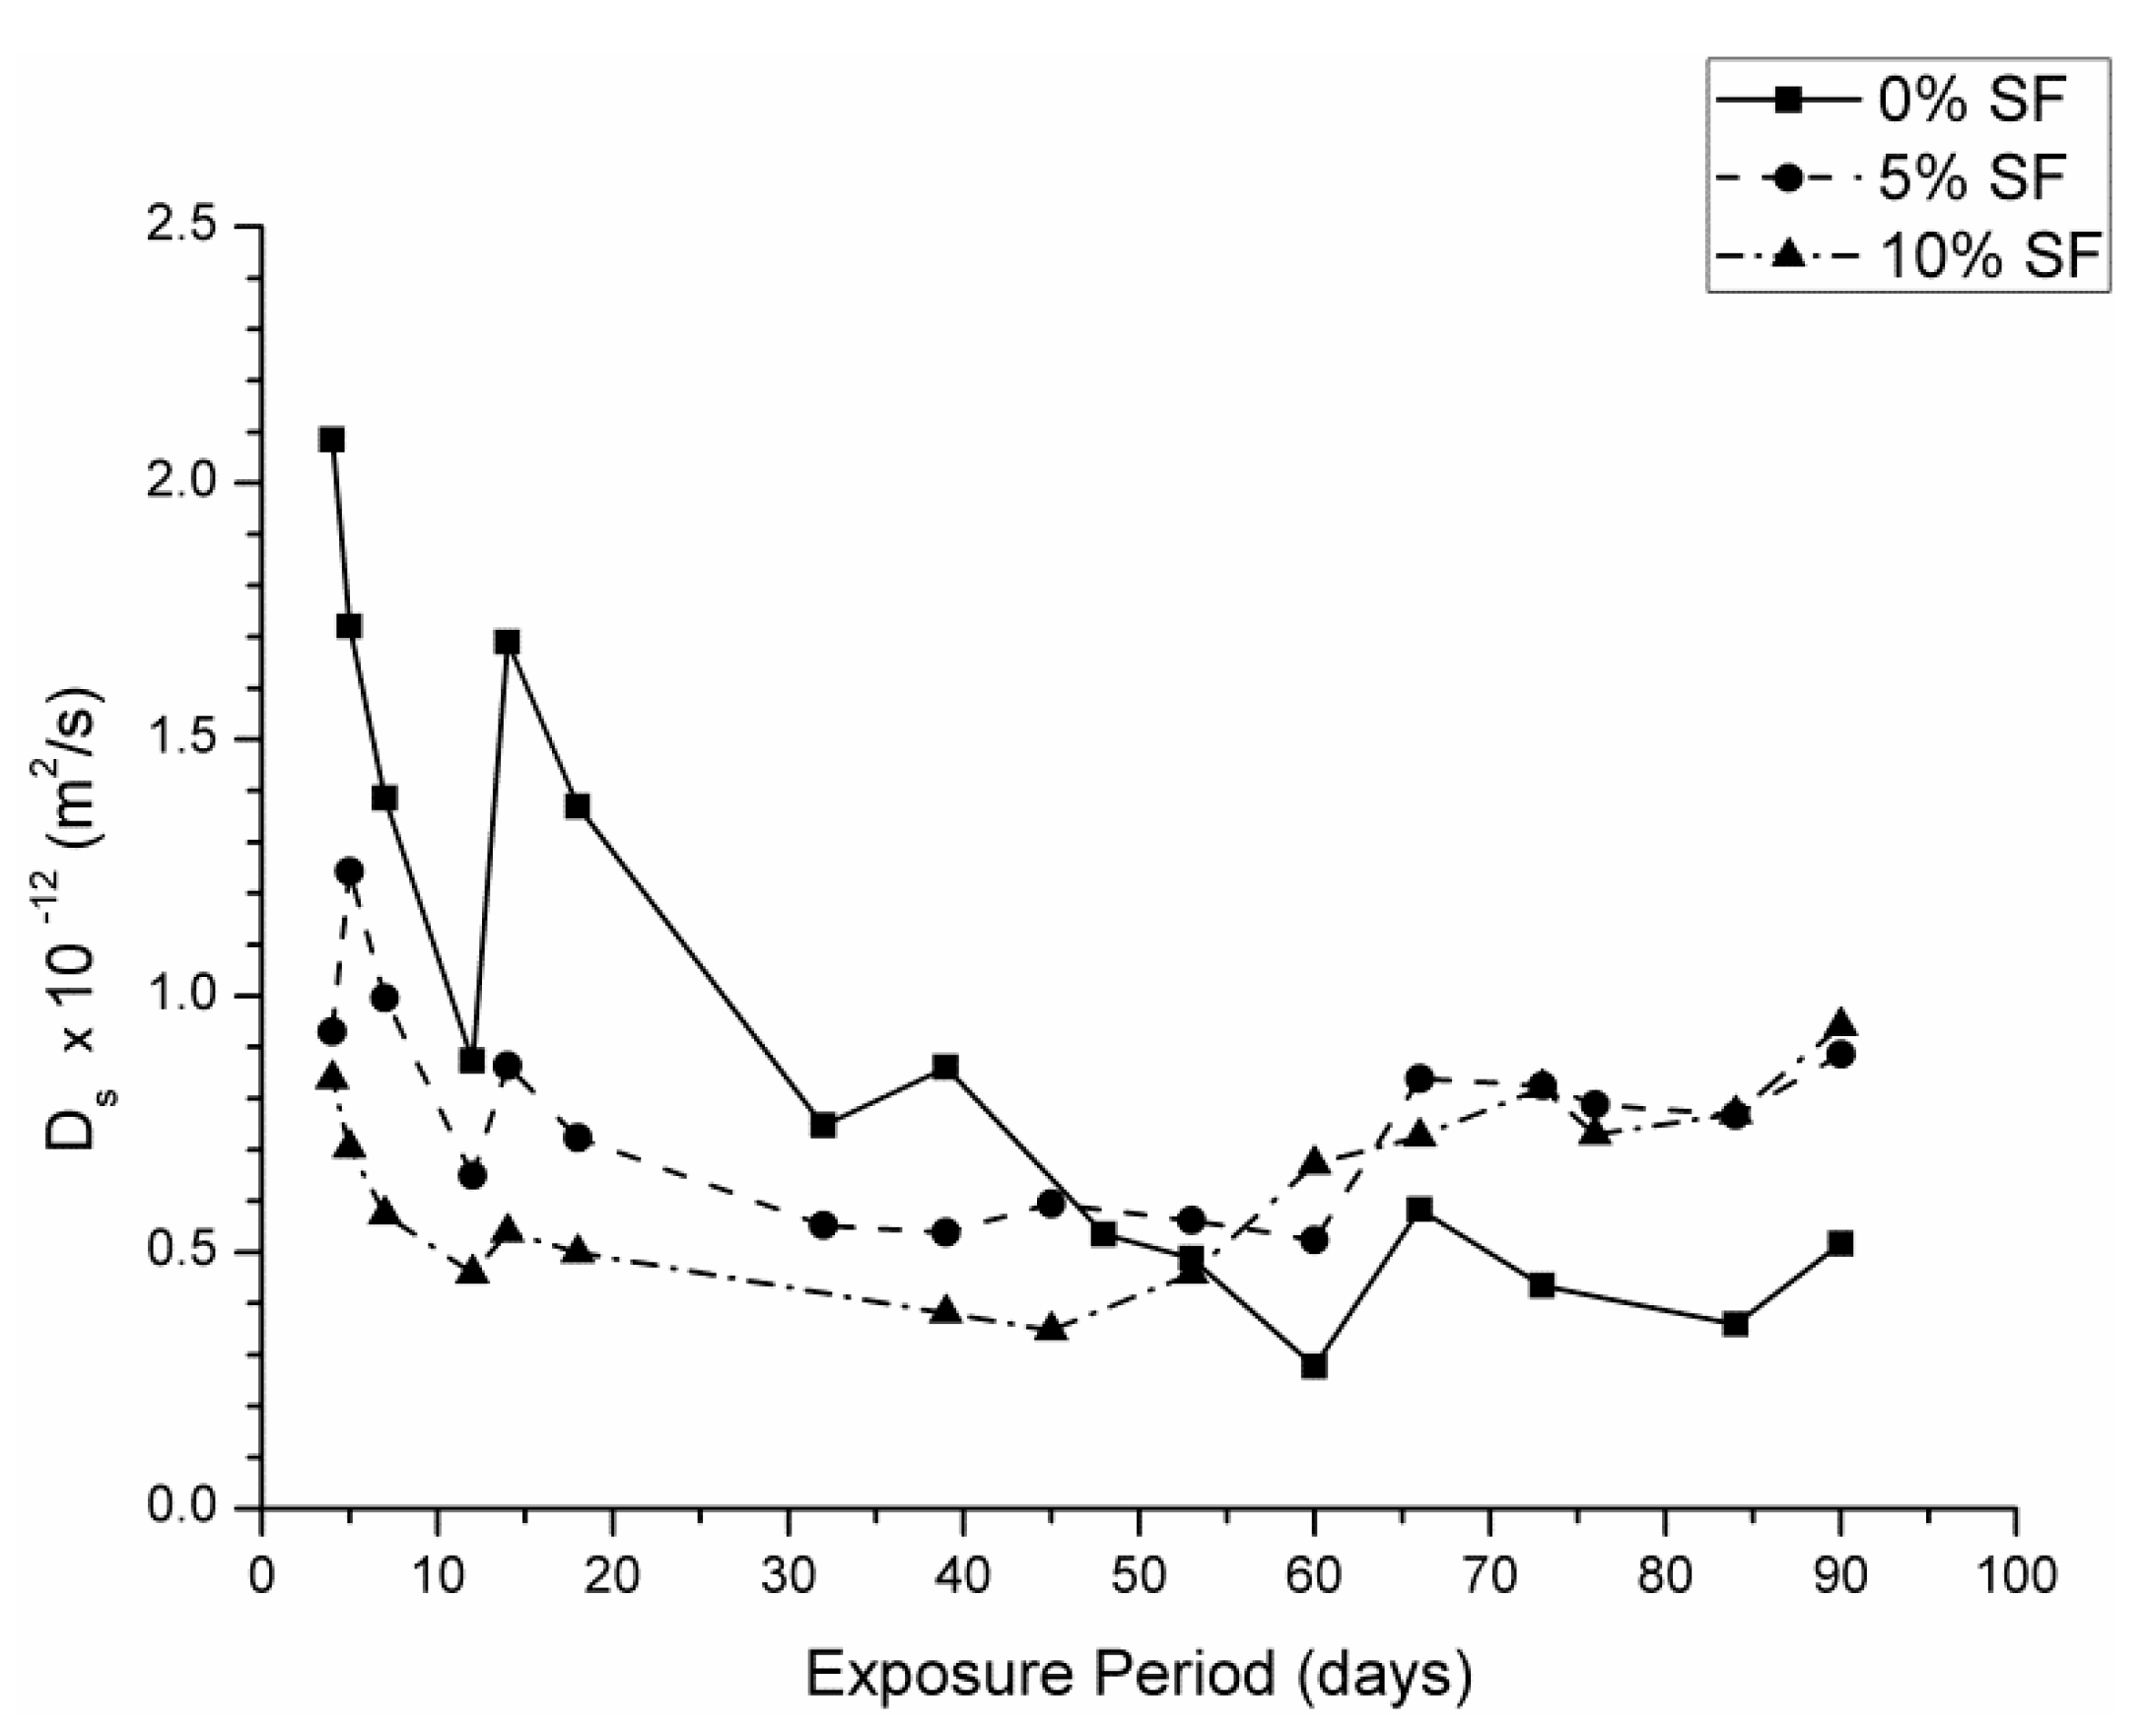
Regarding the 7.5% MgSO4 + 7.5% Na2SO4 solution, it may be observed from Figure 10 that the samples containing 0% silica fume show a similar reduction in Ds to that observed in the 15% Na2SO4 solution. This may be as a result of the formation of a double layer of brucite and gypsum, as discussed previously [26]. However, both the samples containing 5% and 10% silica fume showed an increase in Ds after an initial decrease (probably associated with the initial pozzolanic hydration of the silica fume). This suggests that exposure to the 7.5% MgSO4 + 7.5% Na2SO4 solution resulted in deterioration in these samples, which could be very severe in the long-term. It may be noted, for instance, that in the 10% silica fume sample, Ds was greater by the end of the exposure period than the initial value recorded at a sample age of 11 days (4 days exposure).
This deterioration was likely a result of decalcification reactions, as observed by other authors [22,23,24]. The conversion of C-S-H gels to non-conglomerate M-S-H gels within the pore network would plausibly have the effect of dissolving hardened cement paste, decreasing the tortuosity of the pore network and increasing the porosity. As such, it may be inferred that exposure to magnesium ions increases ionic diffusivity in samples containing silica fume. It is also significant that by the end of the test period, the values of Ds measured in the samples containing silica fume were almost double those measured in the sample containing Portland cement only.
However, the results of the steady state ionic diffusion coefficient (Ds) measured in the samples exposed to the 15% MgSO4 solution, presented in Figure 11, somewhat conflict with the idea that it is purely the action of the magnesium ion that causes an increase in Ds. Despite the fact that the samples shown in that figure were exposed to the 15% MgSO4 solution with the highest concentration of magnesium ions (see Table 2), the value of Ds remained relatively constant in the 5% silica fume samples, and in the 10% silica fume samples it increased only slightly with exposure period compared to the lowest Ds value noted. This appears to suggest that changes in the ionic diffusivity in silica fume samples are not directly proportional to the concentration of magnesium ions present. It would hence appear that the deterioration mechanism is more complex than previously assumed.
The 0% silica fume samples exposed to the 15% MgSO4 solution showed a relatively constant decrease in Ds. It may be noted that in all of the solutions, the values of Ds were very similar by the end of the exposure period, despite some differences in the initial values. These results appear to suggest that in non-blended cements, sulfate attack does not result in significant changes in the steady state ionic diffusion coefficient. However, it should be noted that the solutions used were extremely concentrated and the test period was short (90 days), and as such further research is necessary to confirm this assertion.
3.3. Compressive Strength
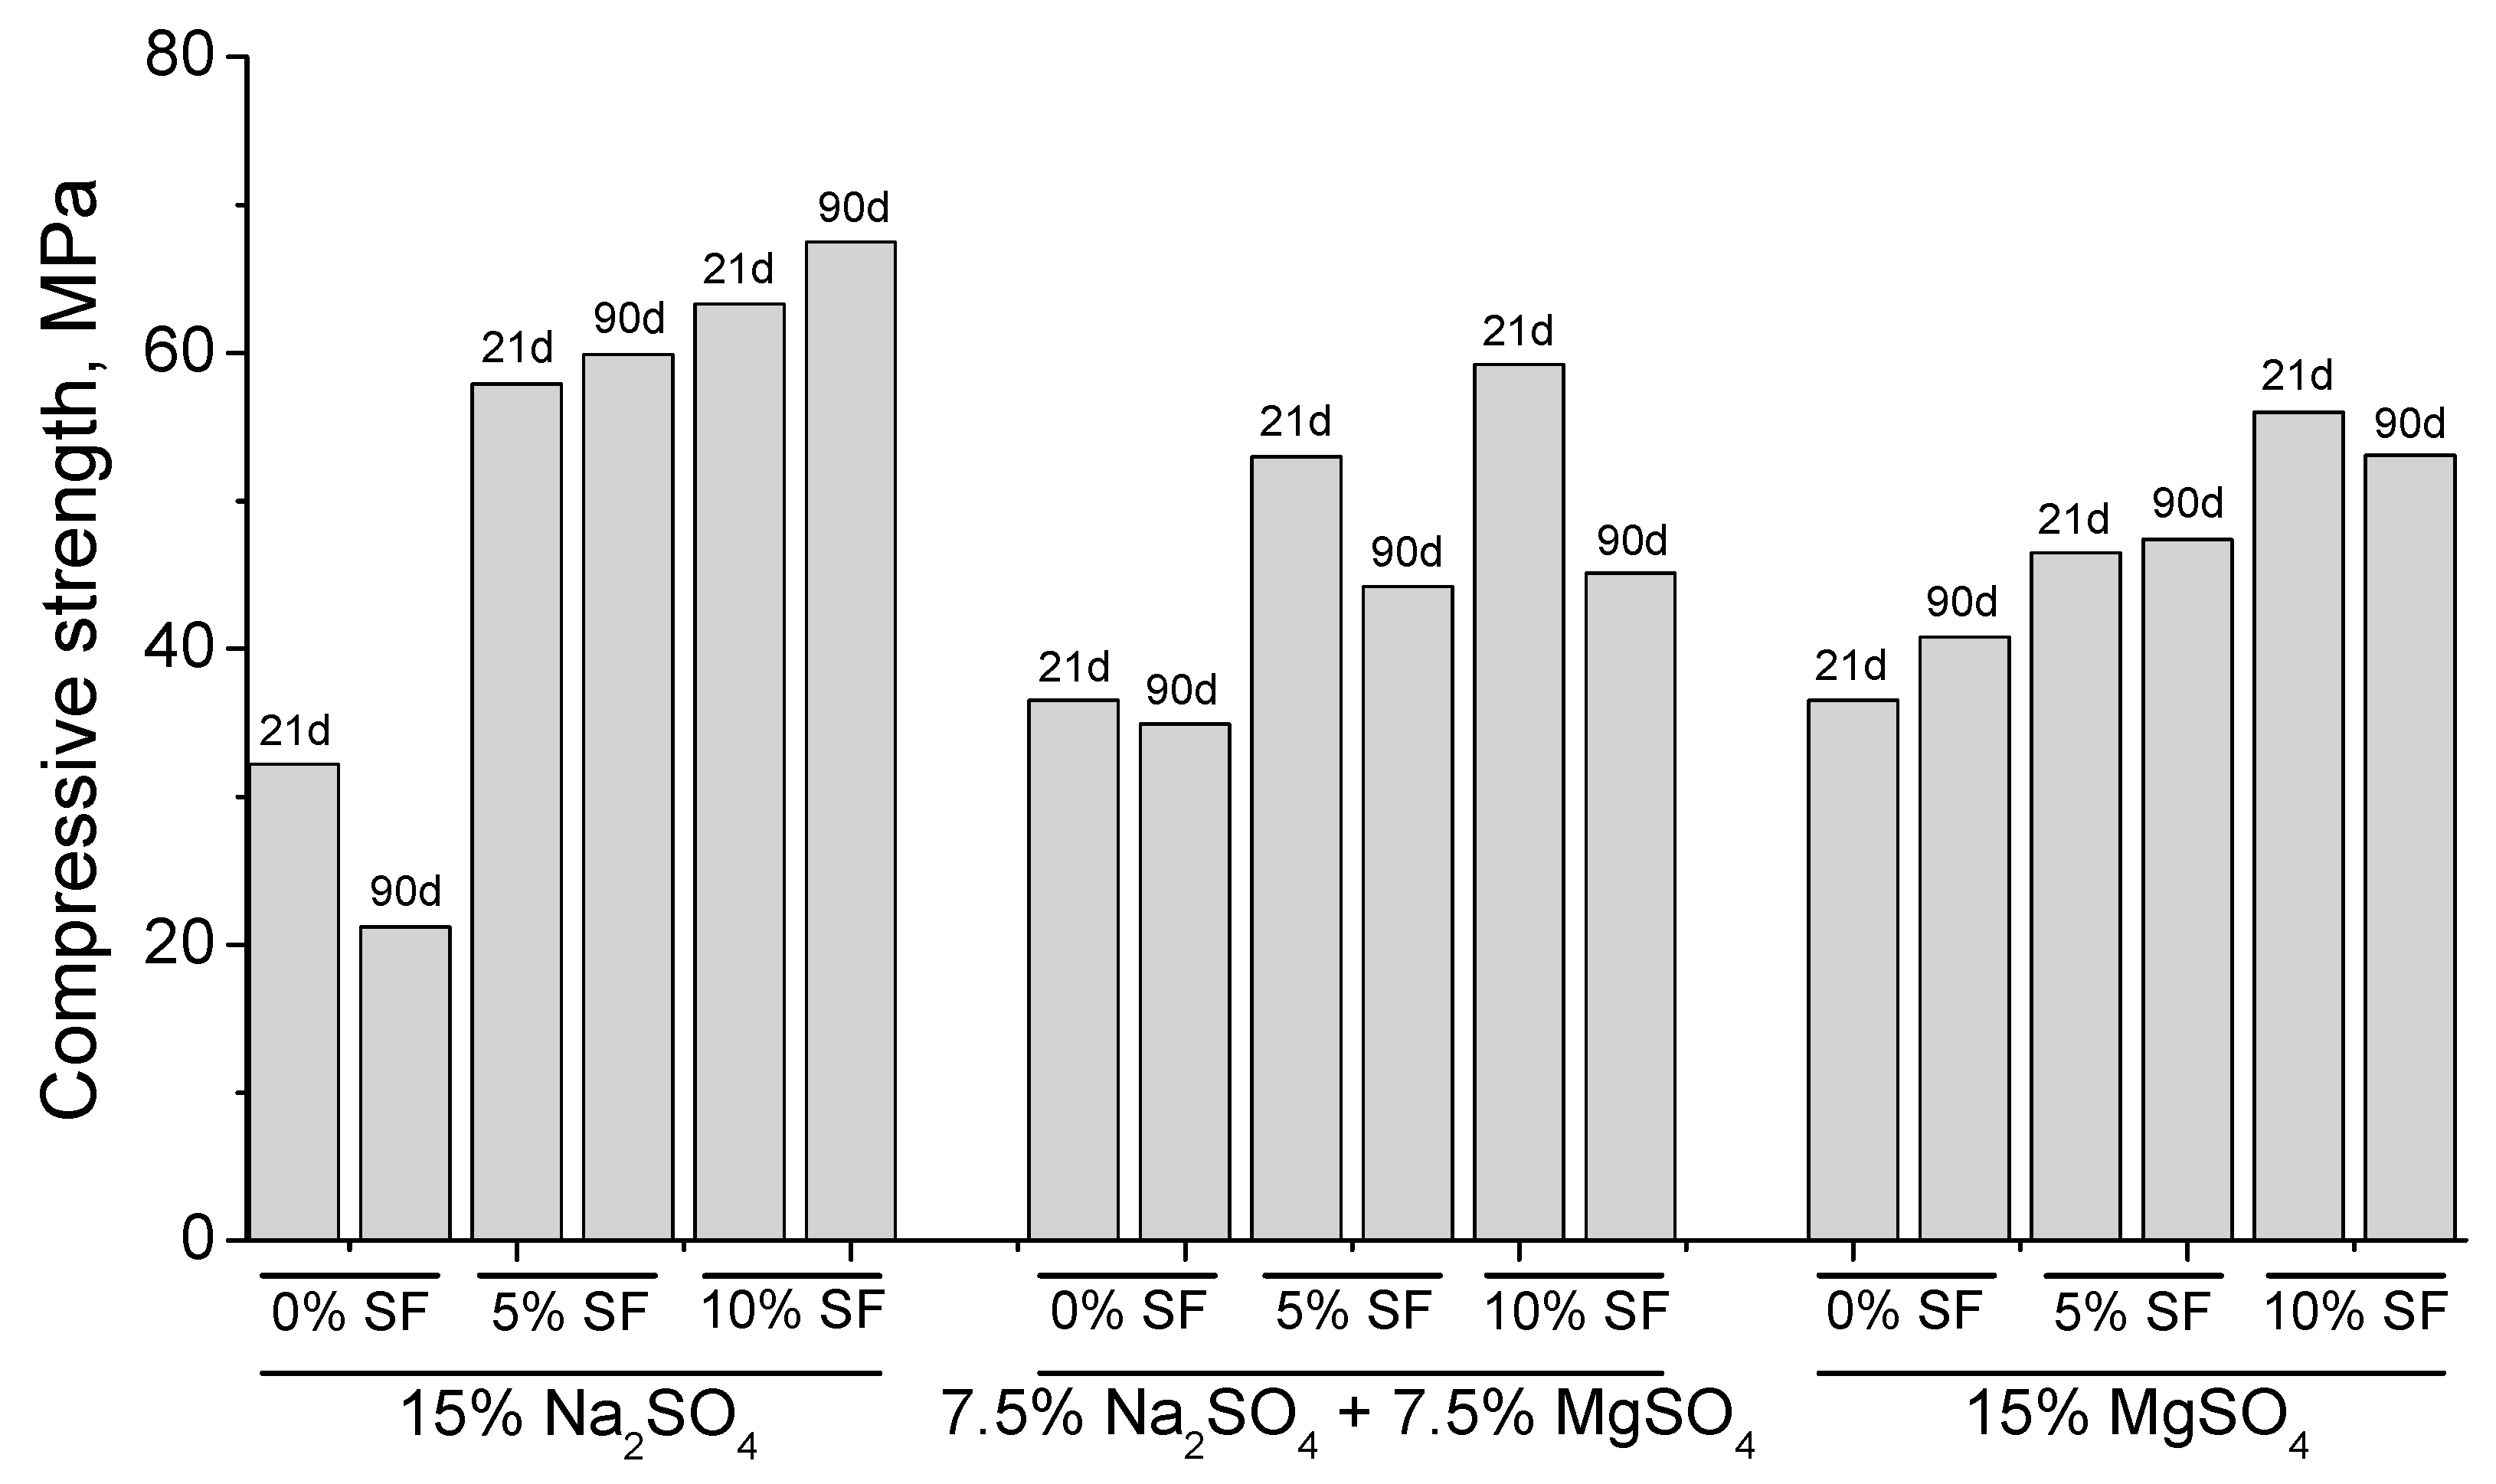
The compression strength results and its variation in percentage between 21 and 90 exposure days are shown in Table 4 and Figure 12 for all the samples and solutions studied. In that table, it may be observed that exposure to the Na2SO4 solution did not result in any substantial reduction in compressive strength in the samples containing both 5% and 10% silica fume, even this parameter slightly increased for them, but a significant reduction of 34.4% was observed in the 0% silica fume samples. This correlates well with data available in current literature [25,26,28,51], and is probably due to the silica fume samples having substantially less portlandite available for reaction with the sulfate ions present in solution, as discussed previously.
It may be inferred from the compressive strength results that exposure to the 7.5% MgSO4 + 7.5% Na2SO4 solution resulted in severe deterioration (likely due to decalcification [22,23,24]) in both of the samples containing silica fume. However, the samples without silica fume showed relatively little deterioration in terms of compressive strength. In addition, the results of this parameter suggests that in the samples containing 0% silica fume, exposed to the 15% MgSO4 solution resulted in least deterioration of all samples. In fact, there was actually an increase in compressive strength.
Despite the total concentration of magnesium ions being highest in the 15% MgSO4 solution, the loss of compressive strength observed in the silica fume samples was not as severe as that which occurred in those exposed to the 7.5% MgSO4 + 7.5% Na2SO4 solution (see Table 4). This suggests that the deterioration mechanism responsible for the reduction in compressive strength in the silica fume samples does not depend solely on the concentration of magnesium ions present. It also appears that the extent of deterioration in the samples containing silica fume was less than that observed by other authors using weaker MgSO4 solutions [16,29,52]. It is hence possible that the use of a more concentrated solution and a shorter test period does not produce the same results.
4. Conclusions
The main conclusions that can be drawn from the previously discussed results can be summarized as follows:
- (1)
- The pore structure of 0% silica fume samples exposed to sodium sulfate solution was less refined compared to 5% and 10% silica fume ones. This would indicate that the silica fume inclusion improves the resistance to sodium sulfate attack in mortars.
- (2)
- The microstructure of silica fume mortars was more affected by the exposure to the mixed 7.5% MgSO4 + 7.5% Na2SO4 solution than by the sodium sulfate one, as suggested the loss of pore refinement indicated by the appearance of a new pore family with higher diameter. A similar result has been noted for magnesium sulfate solution.
- (3)
- The steady state ionic diffusion coefficient decreases with silica fume content, and appears not to be affected by exposure to sodium sulfate solutions.
- (4)
- In silica fume samples exposed to magnesium sulfate solutions, a substantial increase in ionic diffusivity accompanies a loss in compressive strength, suggesting that dissolution type reactions take place in these samples pore network. This attack was more severe in the 7.5% MgSO4 + 7.5% Na2SO4 solution, which implies that magnesium content alone does not determine the severity of attack.
Author Contributions
J.M.O. and M.W. wrote the paper. J.M.O., M.W. and I.S. performed the experiments. M.D.E. and M.Á.C. supervised the research work and revised the paper. All the authors contributed to conceive and design the experiments, and to analyze and discuss the results.
Funding
The fee for publishing this open access paper has been provided by the R&D Center of Excellence in Architecture, Engineering and Design of European University (Spain). The research work included in the paper has been financially supported by the University of Alicante (Spain) through project GRE13-25.
Acknowledgments
The authors wish to thank Cementos Portland Valderrivas S.A. and Grupo Ferroatlántica, S.A. for providing the cement and silica fume (respectively) used in this study.
Conflicts of Interest
The authors declare no conflict of interest.
References
- Demirboğa, R. Thermal conductivity and compressive strength of concrete incorporation with mineral admixtures. Build. Environ. 2007, 42, 2467–2471. [Google Scholar] [CrossRef]
- Ganjian, E.; Pouya, H.S. The effect of Persian Gulf tidal zone exposure on durability of mixes containing silica fume and blast furnace slag. Constr. Build. Mater. 2009, 23, 644–652. [Google Scholar] [CrossRef]
- Ponikiewski, T.; Gołaszewski, J. The effect of high-calcium fly ash on selected properties of self-compacting concrete. Arch. Civ. Mech. Eng. 2014, 14, 455–465. [Google Scholar] [CrossRef]
- Ortega, J.M.; Sánchez, I.; Climent, M.A. Impedance spectroscopy study of the effect of environmental conditions in the microstructure development of OPC and slag cement mortars. Arch. Civ. Mech. Eng. 2015, 15, 569–583. [Google Scholar] [CrossRef]
- Glinicki, M.; Jóźwiak-Niedźwiedzka, D.; Gibas, K.; Dąbrowski, M. Influence of Blended Cements with Calcareous Fly Ash on Chloride Ion Migration and Carbonation Resistance of Concrete for Durable Structures. Materials 2016, 9, 18. [Google Scholar] [CrossRef] [PubMed]
- Ortega, J.M.; Sánchez, I.; Climent, M.A. Influence of Environmental Conditions on Durability of Slag Cement Mortars. In Proceedings of the 2nd International Conference on Sustainable Construction Materials and Technologies, Ancona, Italy, 28–30 June 2010; pp. 277–287. [Google Scholar]
- Nochaiya, T.; Wongkeo, W.; Chaipanich, A. Utilization of fly ash with silica fume and properties of Portland cement–fly ash–silica fume concrete. Fuel 2010, 89, 768–774. [Google Scholar] [CrossRef]
- Estokova, A.; Kovalcikova, M.; Luptakova, A.; Prascakova, M. Testing Silica Fume-Based Concrete Composites under Chemical and Microbiological Sulfate Attacks. Materials 2016, 9, 324. [Google Scholar] [CrossRef] [PubMed]
- Xu, W.; Lo, Y.T.; Wang, W.; Ouyang, D.; Wang, P.; Xing, F. Pozzolanic Reactivity of Silica Fume and Ground Rice Husk Ash as Reactive Silica in a Cementitious System: A Comparative Study. Materials 2016, 9, 146. [Google Scholar] [CrossRef] [PubMed]
- Behfarnia, K.; Farshadfar, O. The effects of pozzolanic binders and polypropylene fibers on durability of SCC to magnesium sulfate attack. Constr. Build. Mater. 2013, 38, 64–71. [Google Scholar] [CrossRef]
- Chung, D.D.L. Improving cement-based materials by using silica fume. J. Mater. Sci. 2002, 37, 673–682. [Google Scholar] [CrossRef]
- ACI Committee 234. Guide for the Use of Silica Fume in Concrete (ACI 234R-06); American Concrete Institute: Farmington Hills, MI, USA, 2006; 63p. [Google Scholar]
- Hooton, R.D. Permeability and pore structure of cement pastes containing fly ash, slag and silica fume. In Blended Cements, ASTM Special Technical Publication 897; Frohnsdorff, G., Ed.; American Society for Testing Materials: West Conshohocken, PA, USA, 1986; pp. 128–143. [Google Scholar]
- Wolsiefer, J.T. Silica fume concrete: A solution to steel reinforcement corrosion in concrete. In Utilization of Industrial By-Products for Construction Materials; ASCE: Reston, VA, USA, 1993; pp. 15–29. [Google Scholar]
- Dotto, J.M.R.; Abreu, A.G.D.; Dal Molin, D.C.C.; Müller, I.L. Influence of silica fume addition on concretes physical properties and on corrosion behaviour of reinforcement bars. Cem. Concr. Compos. 2004, 26, 31–39. [Google Scholar] [CrossRef]
- Poon, C.S.; Kou, S.C.; Lam, L. Compressive strength, chloride diffusivity and pore structure of high performance metakaolin and silica fume concrete. Constr. Build. Mater. 2006, 20, 858–865. [Google Scholar] [CrossRef]
- Gjorv, O.E. Effect of condensed silica fume on steel corrosion in concrete. ACI Mater. J. 1995, 92, 591–598. [Google Scholar]
- Ramezanianpour, A.A.; Malhotra, V.M. Effect of curing on the compressive strength, resistance to chloride-ion penetration and porosity of concretes incorporating slag, fly ash or silica fume. Cem. Concr. Compos. 1995, 17, 125–133. [Google Scholar] [CrossRef]
- Neville, A. The confused world of sulfate attack on concrete. Cem. Concr. Res. 2004, 34, 1275–1296. [Google Scholar] [CrossRef]
- Rehman, A.U.; Qudoos, A.; Kim, H.G.; Ryou, J.-S. Influence of titanium dioxide nanoparticles on the sulfate attack upon ordinary Portland cement and slag-blended mortars. Materials 2018, 11. [Google Scholar] [CrossRef]
- Yu, C.; Sun, W.; Scrivener, K. Mechanism of expansion of mortars immersed in sodium sulfate solutions. Cem. Concr. Res. 2013, 43, 105–111. [Google Scholar] [CrossRef]
- Al-Amoudi, O.S.B. Performance of 15 reinforced concrete mixtures in magnesium-sodium sulphate environments. Constr. Build. Mater. 1995, 9, 149–158. [Google Scholar] [CrossRef]
- Baghabra Al-Amoudi, O.S. Attack on plain and blended cements exposed to aggressive sulfate environments. Cem. Concr. Compos. 2002, 24, 305–316. [Google Scholar] [CrossRef]
- Ganjian, E.; Pouya, H.S. Effect of magnesium and sulfate ions on durability of silica fume blended mixes exposed to the seawater tidal zone. Cem. Concr. Res. 2005, 35, 1332–1343. [Google Scholar] [CrossRef]
- Al-Dulaijan, S.U.; Maslehuddin, M.; Al-Zahrani, M.M.; Sharif, A.M.; Shameem, M.; Ibrahim, M. Sulfate resistance of plain and blended cements exposed to varying concentrations of sodium sulfate. Cem. Concr. Compos. 2003, 25, 429–437. [Google Scholar] [CrossRef]
- Lee, S.T.; Moon, H.Y.; Swamy, R.N. Sulfate attack and role of silica fume in resisting strength loss. Cem. Concr. Compos. 2005, 27, 65–76. [Google Scholar] [CrossRef]
- Hooton, R.D. Influence of silica fume replacement of cement on physical properties and resistance to sulfate attack, freezing and thawing, and alkali-silica reactivity. ACI Mater. J. 1993, 90, 143–151. [Google Scholar]
- Cohen, M.D.; Bentur, A. Durability of Portland cement-Silica fume pastes in magnesium sulfate and sodium sulfate solutions. ACI Mater. J. 1988, 85, 148–157. [Google Scholar]
- Türker, F.; Aköz, F.; Koral, S.; Yüzer, N. Effects of magnesium sulfate concentration on the sulfate resistance of mortars with and without silica fume. Cem. Concr. Res. 1997, 27, 205–214. [Google Scholar] [CrossRef]
- Santhanam, M.; Cohen, M.D.; Olek, J. Mechanism of sulfate attack: A fresh look. Part 1: Summary of experimental results. Cem. Concr. Res. 2002, 32, 915–921. [Google Scholar] [CrossRef]
- Asociación Española de Normalización y Certificación (AENOR). UNE-EN 197-1:2011. Composición, Especificaciones y Criterios de Conformidad de Los Cementos Comunes; AENOR: Madrid, Spain, 2011; p. 30. (In Spanish) [Google Scholar]
- Asociación Española de Normalización y Certificación (AENOR). UNE-EN 196-1:2005. Métodos de Ensayo de Cementos. Parte 1: Determinación de Resistencias Mecánicas; AENOR: Madrid, Spain, 2005; p. 36. (In Spanish) [Google Scholar]
- Ortega, J.M.; Esteban, M.D.; Rodríguez, R.R.; Pastor, J.L.; Ibanco, F.J.; Sánchez, I.; Climent, M.A. Long-Term Behaviour of Fly Ash and Slag Cement Grouts for Micropiles Exposed to a Sulphate Aggressive Medium. Materials 2017, 10, 598. [Google Scholar] [CrossRef] [PubMed]
- Ortega, J.M.; Esteban, M.D.; Rodríguez, R.R.; Pastor, J.L.; Sánchez, I. Microstructural Effects of Sulphate Attack in Sustainable Grouts for Micropiles. Materials 2016, 9, 11. [Google Scholar] [CrossRef]
- ASTM. Standard Test Method for Length Change of Hydraulic-Cement Mortars Exposed to a Sulfate Solution ASTM C 1012-04; ASTM International: Wesk Conshohocken, PA, USA, 2004; p. 6. [Google Scholar]
- Diamond, S. Mercury porosimetry. Cem. Concr. Res. 2000, 30, 1517–1525. [Google Scholar] [CrossRef]
- Diamond, S. Aspects of concrete porosity revisited. Cem. Concr. Res. 1999, 29, 1181–1188. [Google Scholar] [CrossRef]
- Ortega, J.M.; Pastor, J.L.; Albaladejo, A.; Sánchez, I.; Climent, M.A. Durability and compressive strength of blast furnace slag-based cement grout for special geotechnical applications. Mater. Constr. 2014, 64. [Google Scholar] [CrossRef] [Green Version]
- Ortega, J.M.; Ferrandiz, V.; Antón, C.; Climent, M.A.; Sánchez, I. Influence of curing conditions on the mechanical properties and durability of cement mortars. In Materials Characterisation IV: Computational Methods and Experiments; Mammoli, A.A., Brebbia, C.A., Eds.; WIT Press: Southampton, UK, 2009; pp. 381–392. [Google Scholar] [CrossRef]
- Andrade, C.; Alonso, C.; Arteaga, A.; Tanner, P. Methodology based on the electrical resistivity for the calculation of reinforcement service life. In Proceedings of the 5th CANMET/ACO International Conference on Durability of Concrete, Supplementary Papers; Malhotra, V.M., Ed.; American Concrete Institute: Barcelona, Spain, 2000; pp. 899–915. [Google Scholar]
- Sánchez, I.; Nóvoa, X.R.; de Vera, G.; Climent, M.A. Microstructural modifications in Portland cement concrete due to forced ionic migration tests. Study by impedance spectroscopy. Cem. Concr. Res. 2008, 38, 1015–1025. [Google Scholar] [CrossRef]
- Cabeza, M.; Merino, P.; Miranda, A.; Nóvoa, X.R.; Sanchez, I. Impedance spectroscopy study of hardened Portland cement paste. Cem. Concr. Res. 2002, 32, 881–891. [Google Scholar] [CrossRef]
- Ortega, J.M.; Sánchez, I.; Climent, M.A. Impedance spectroscopy study of the effect of environmental conditions on the microstructure development of sustainable fly ash cement mortars. Materials 2017, 10. [Google Scholar] [CrossRef]
- Ortega, J.M.; Esteban, M.D.; Rodríguez, R.R.; Pastor, J.L.; Ibanco, F.J.; Sánchez, I.; Climent, M.A. Influence of Silica Fume Addition in the Long-Term Performance of Sustainable Cement Grouts for Micropiles Exposed to a Sulphate Aggressive Medium. Materials 2017, 10, 890. [Google Scholar] [CrossRef] [PubMed]
- Pastor, J.L.; Ortega, J.M.; Flor, M.; López, M.P.; Sánchez, I.; Climent, M.A. Microstructure and durability of fly ash cement grouts for micropiles. Constr. Build. Mater. 2016, 117, 47–57. [Google Scholar] [CrossRef] [Green Version]
- Keddam, M.; Takenouti, H.; Nóvoa, X.R.; Andrade, C.; Alonso, C. Impedance measurements on cement paste. Cem. Concr. Res. 1997, 27, 1191–1201. [Google Scholar] [CrossRef]
- Ortega, J.M.; Sánchez, I.; Antón, C.; De Vera, G.; Climent, M.A. Influence of environment on durability of fly ash cement mortars. ACI Mater. J. 2012, 109, 647–656. [Google Scholar]
- Ortega, J.M.; Sánchez, I.; Climent, M.A. Durability related transport properties of OPC and slag cement mortars hardened under different environmental conditions. Constr. Build. Mater. 2012, 27, 176–183. [Google Scholar] [CrossRef]
- Bonakdar, A.; Mobasher, B. Multi-parameter study of external sulfate attack in blended cement materials. Constr. Build. Mater. 2010, 24, 61–70. [Google Scholar] [CrossRef]
- Duan, P.; Shui, Z.; Chen, W.; Shen, C. Effects of metakaolin, silica fume and slag on pore structure, interfacial transition zone and compressive strength of concrete. Constr. Build. Mater. 2013, 44, 1–6. [Google Scholar] [CrossRef]
- Aköz, F.; Türker, F.; Koral, S.; Yüzer, N. Effects of sodium sulfate concentration on the sulfate resistance of mortars with and without silica fume. Cem. Concr. Res. 1995, 25, 1360–1368. [Google Scholar] [CrossRef]
- Al-Dulaijan, S.U. Sulfate resistance of plain and blended cements exposed to magnesium sulfate solutions. Constr. Build. Mater. 2007, 21, 1792–1802. [Google Scholar] [CrossRef]
Figure 1.
Equivalent circuit used for the fitting of the impedance spectra obtained using the contacting method, in which the resistance R1 is associated with pores that cross the sample.
Figure 1.
Equivalent circuit used for the fitting of the impedance spectra obtained using the contacting method, in which the resistance R1 is associated with pores that cross the sample.

Figure 2.
Intrusion-extrusion curves at 21 days (a) and 90 days (b) of exposure to the 15% Na2SO4 solution for mortars prepared using ordinary Portland cement without addition (0% SF), and for those with a content of 5% (5% SF) and 10% (10% SF) of silica fume.
Figure 2.
Intrusion-extrusion curves at 21 days (a) and 90 days (b) of exposure to the 15% Na2SO4 solution for mortars prepared using ordinary Portland cement without addition (0% SF), and for those with a content of 5% (5% SF) and 10% (10% SF) of silica fume.
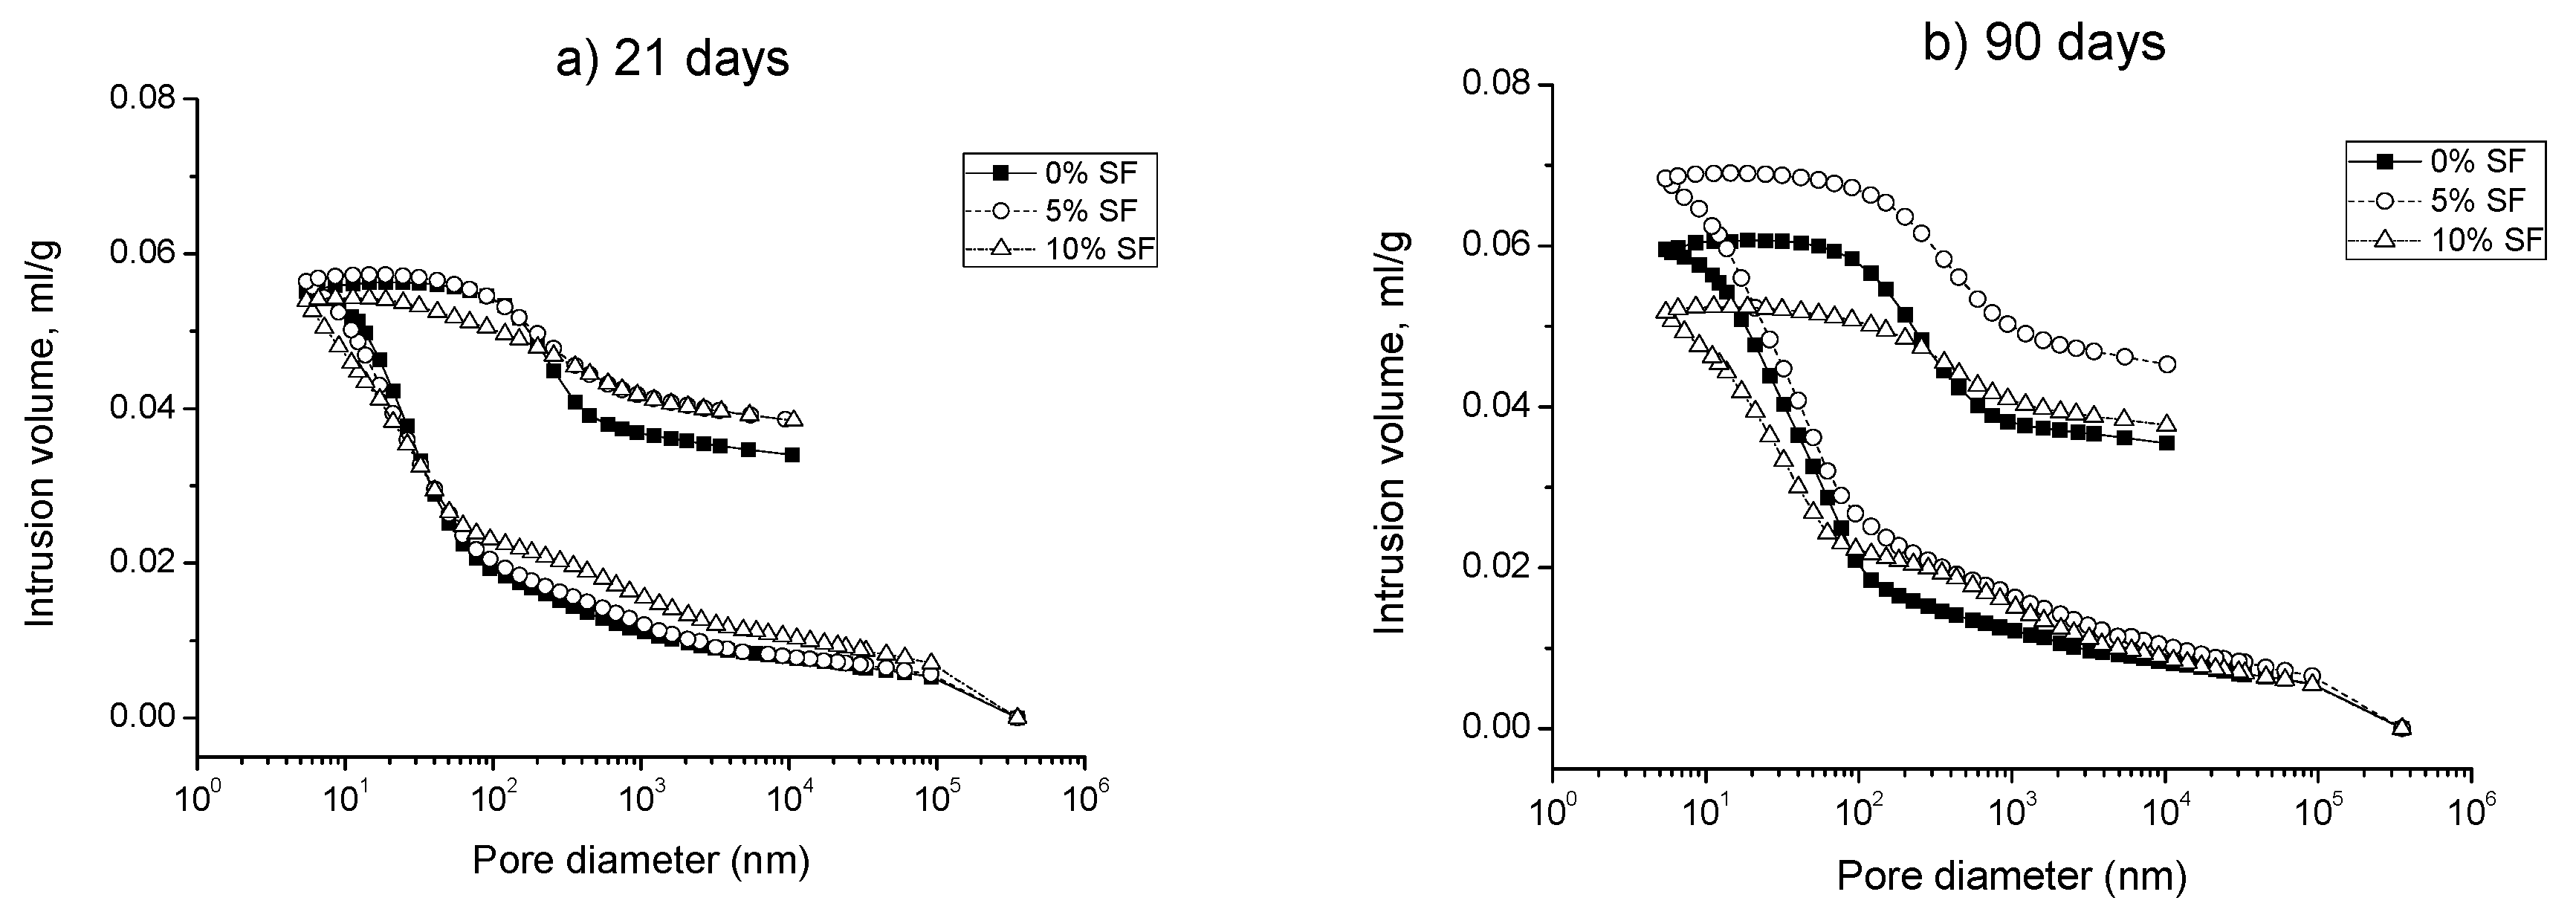
Figure 3.
Median pore diameter obtained for the studied mortars and sulfate aggressive media.
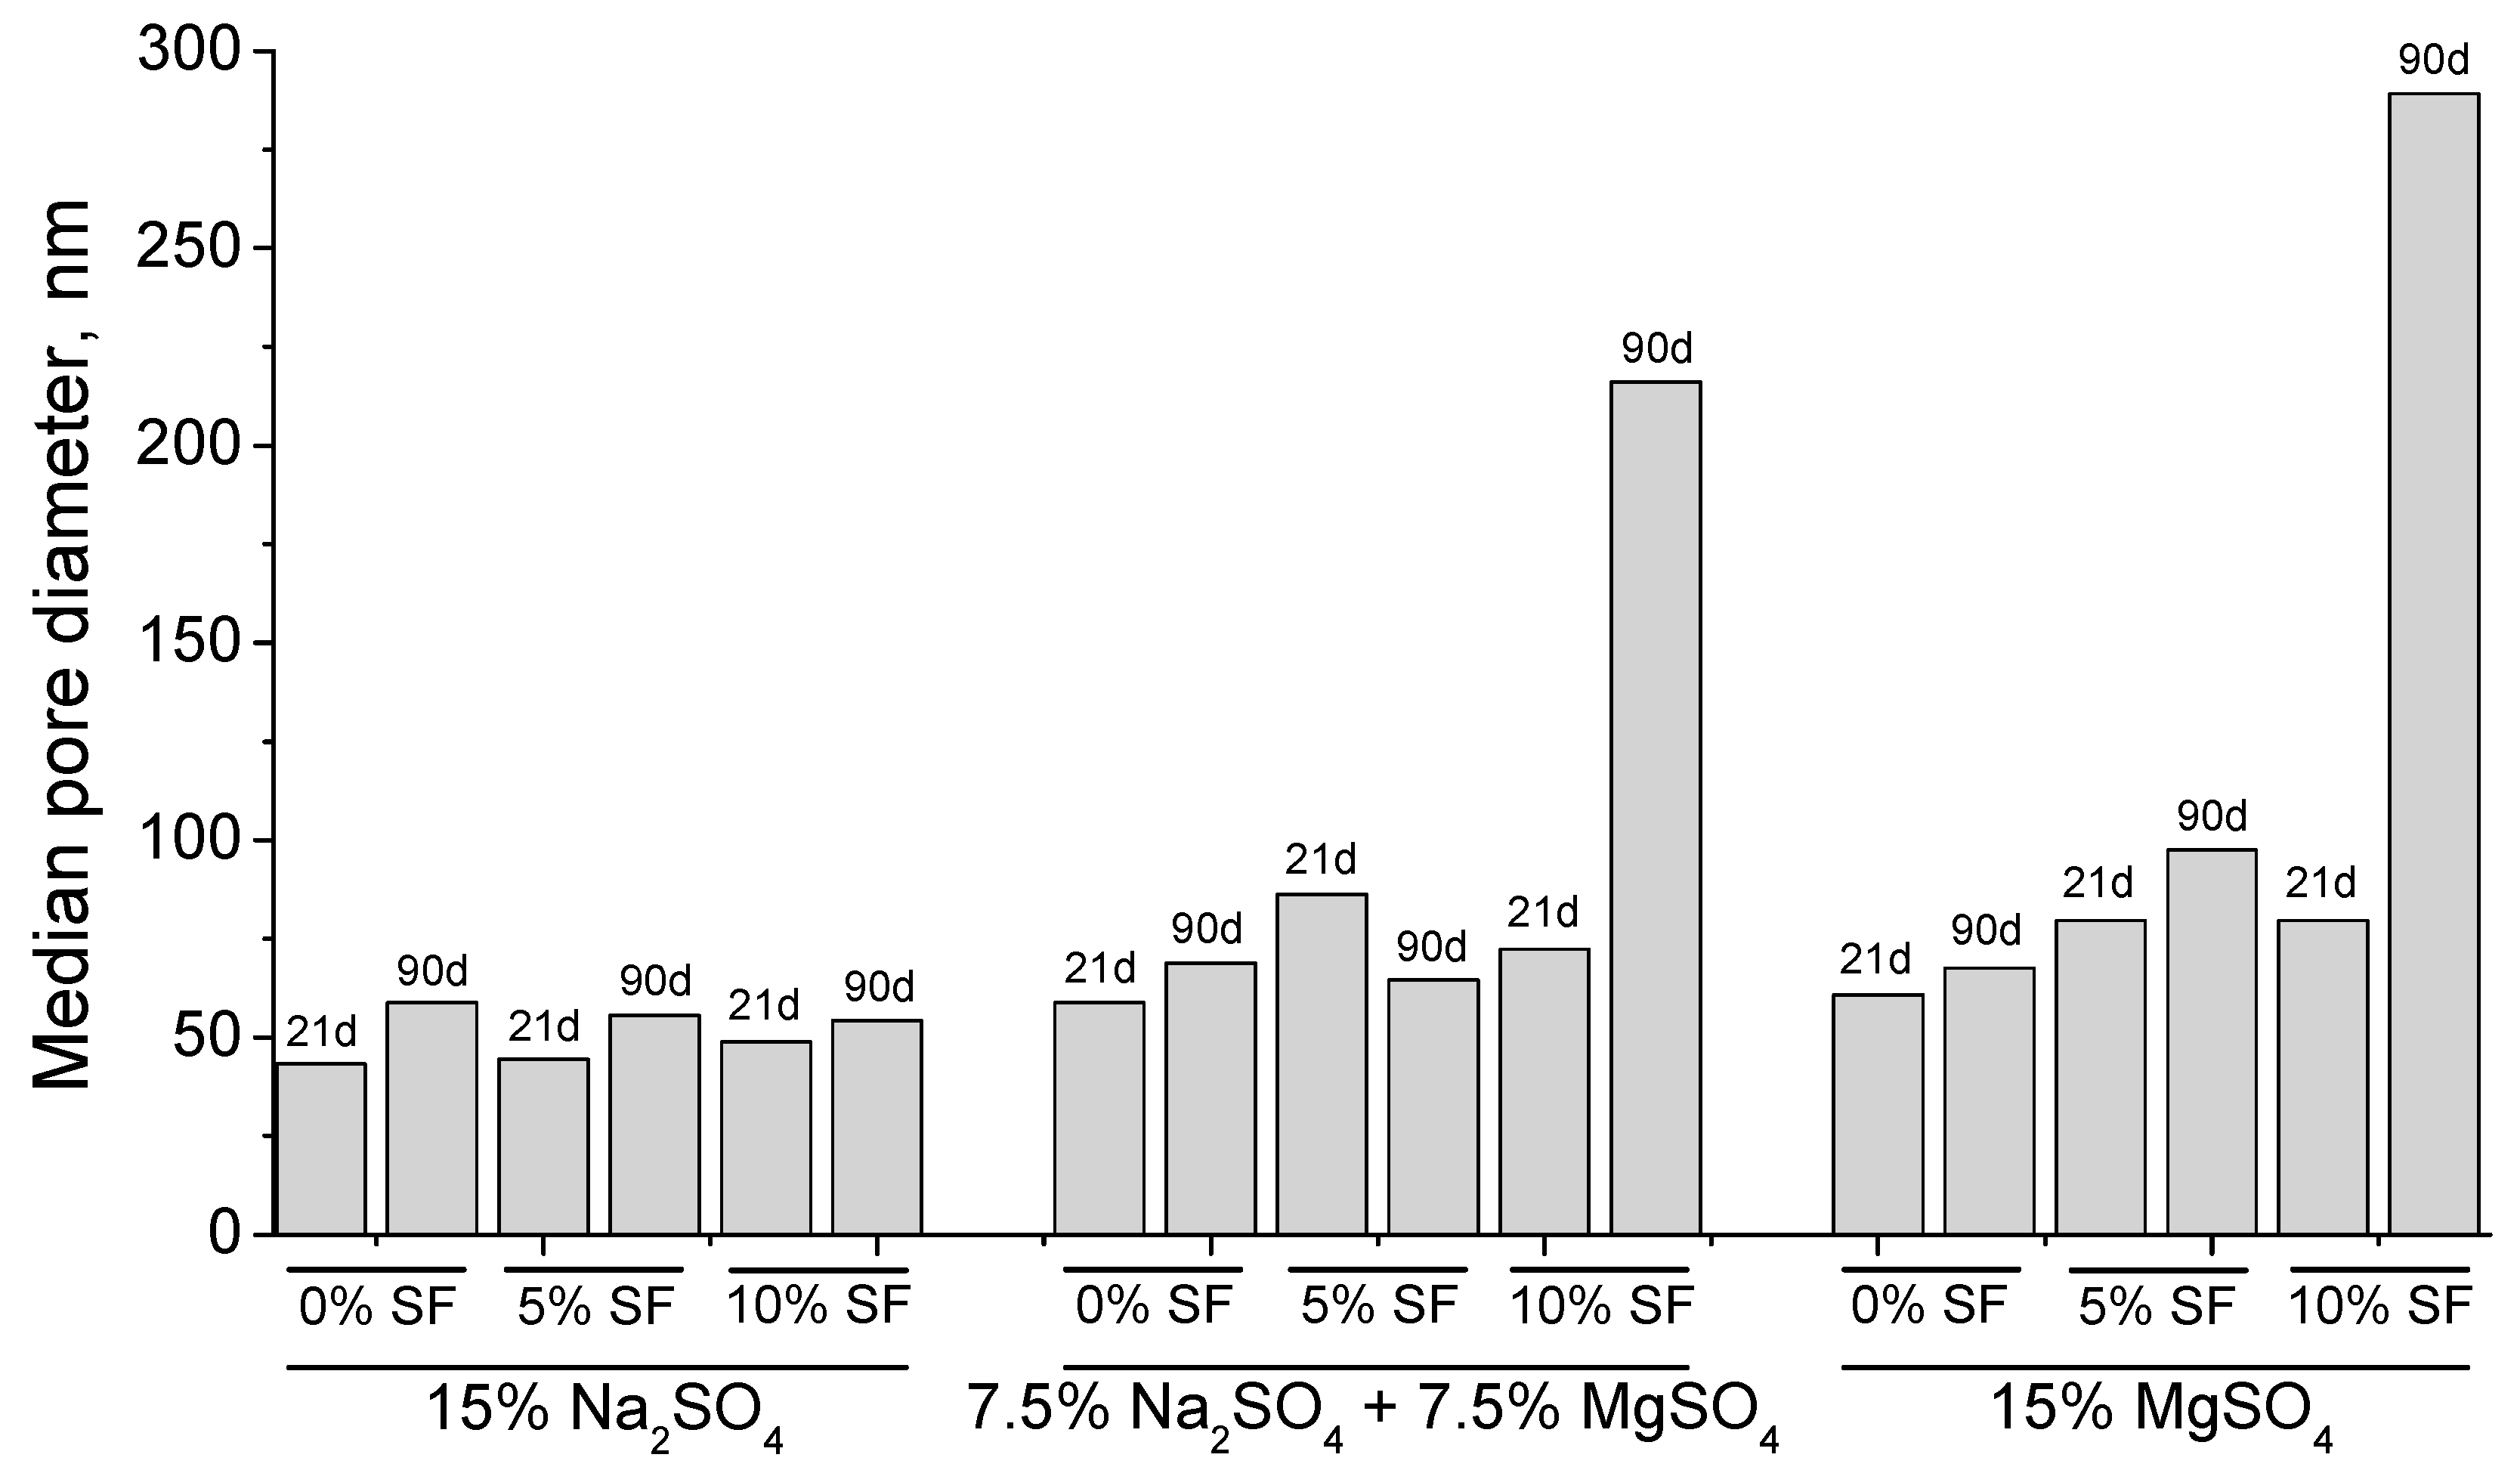
Figure 4.
Intrusion-extrusion curves at 21 days (a) and 90 days (b) of exposure to the mixed solution (7.5% Na2SO4 + 7.5% MgSO4) for the analysed mortars.
Figure 4.
Intrusion-extrusion curves at 21 days (a) and 90 days (b) of exposure to the mixed solution (7.5% Na2SO4 + 7.5% MgSO4) for the analysed mortars.

Figure 5.
Intrusion-extrusion curves at 21 days (a) and 90 days (b) of exposure to the 15% MgSO4 solution for the studied mortars.
Figure 5.
Intrusion-extrusion curves at 21 days (a) and 90 days (b) of exposure to the 15% MgSO4 solution for the studied mortars.
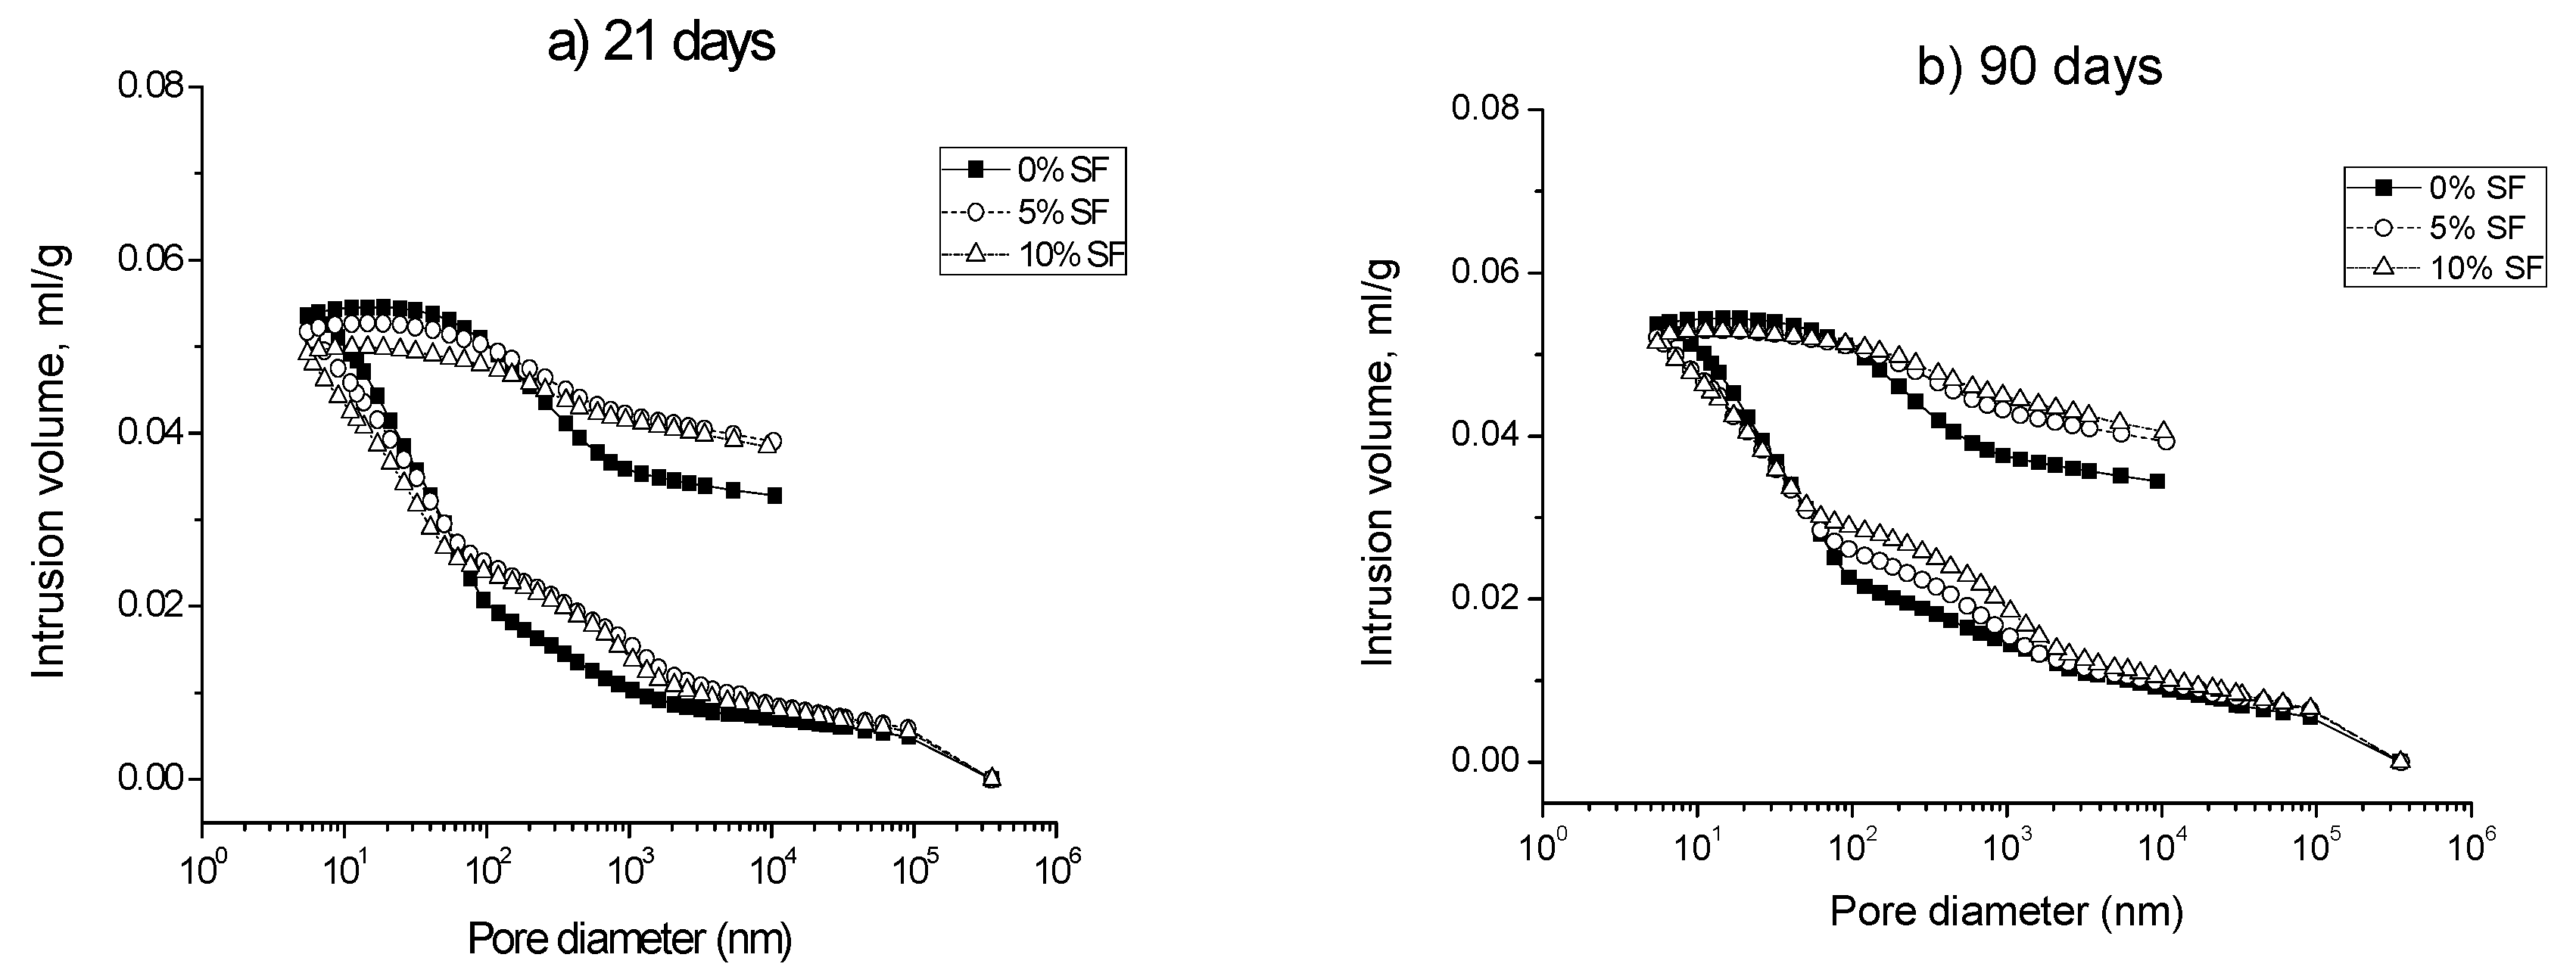
Figure 6.
Curves logarithm of differential intrusion volume versus pore size obtained at 21 days (a) and 90 days (b) of exposure to the 15% Na2SO4 solution.
Figure 6.
Curves logarithm of differential intrusion volume versus pore size obtained at 21 days (a) and 90 days (b) of exposure to the 15% Na2SO4 solution.
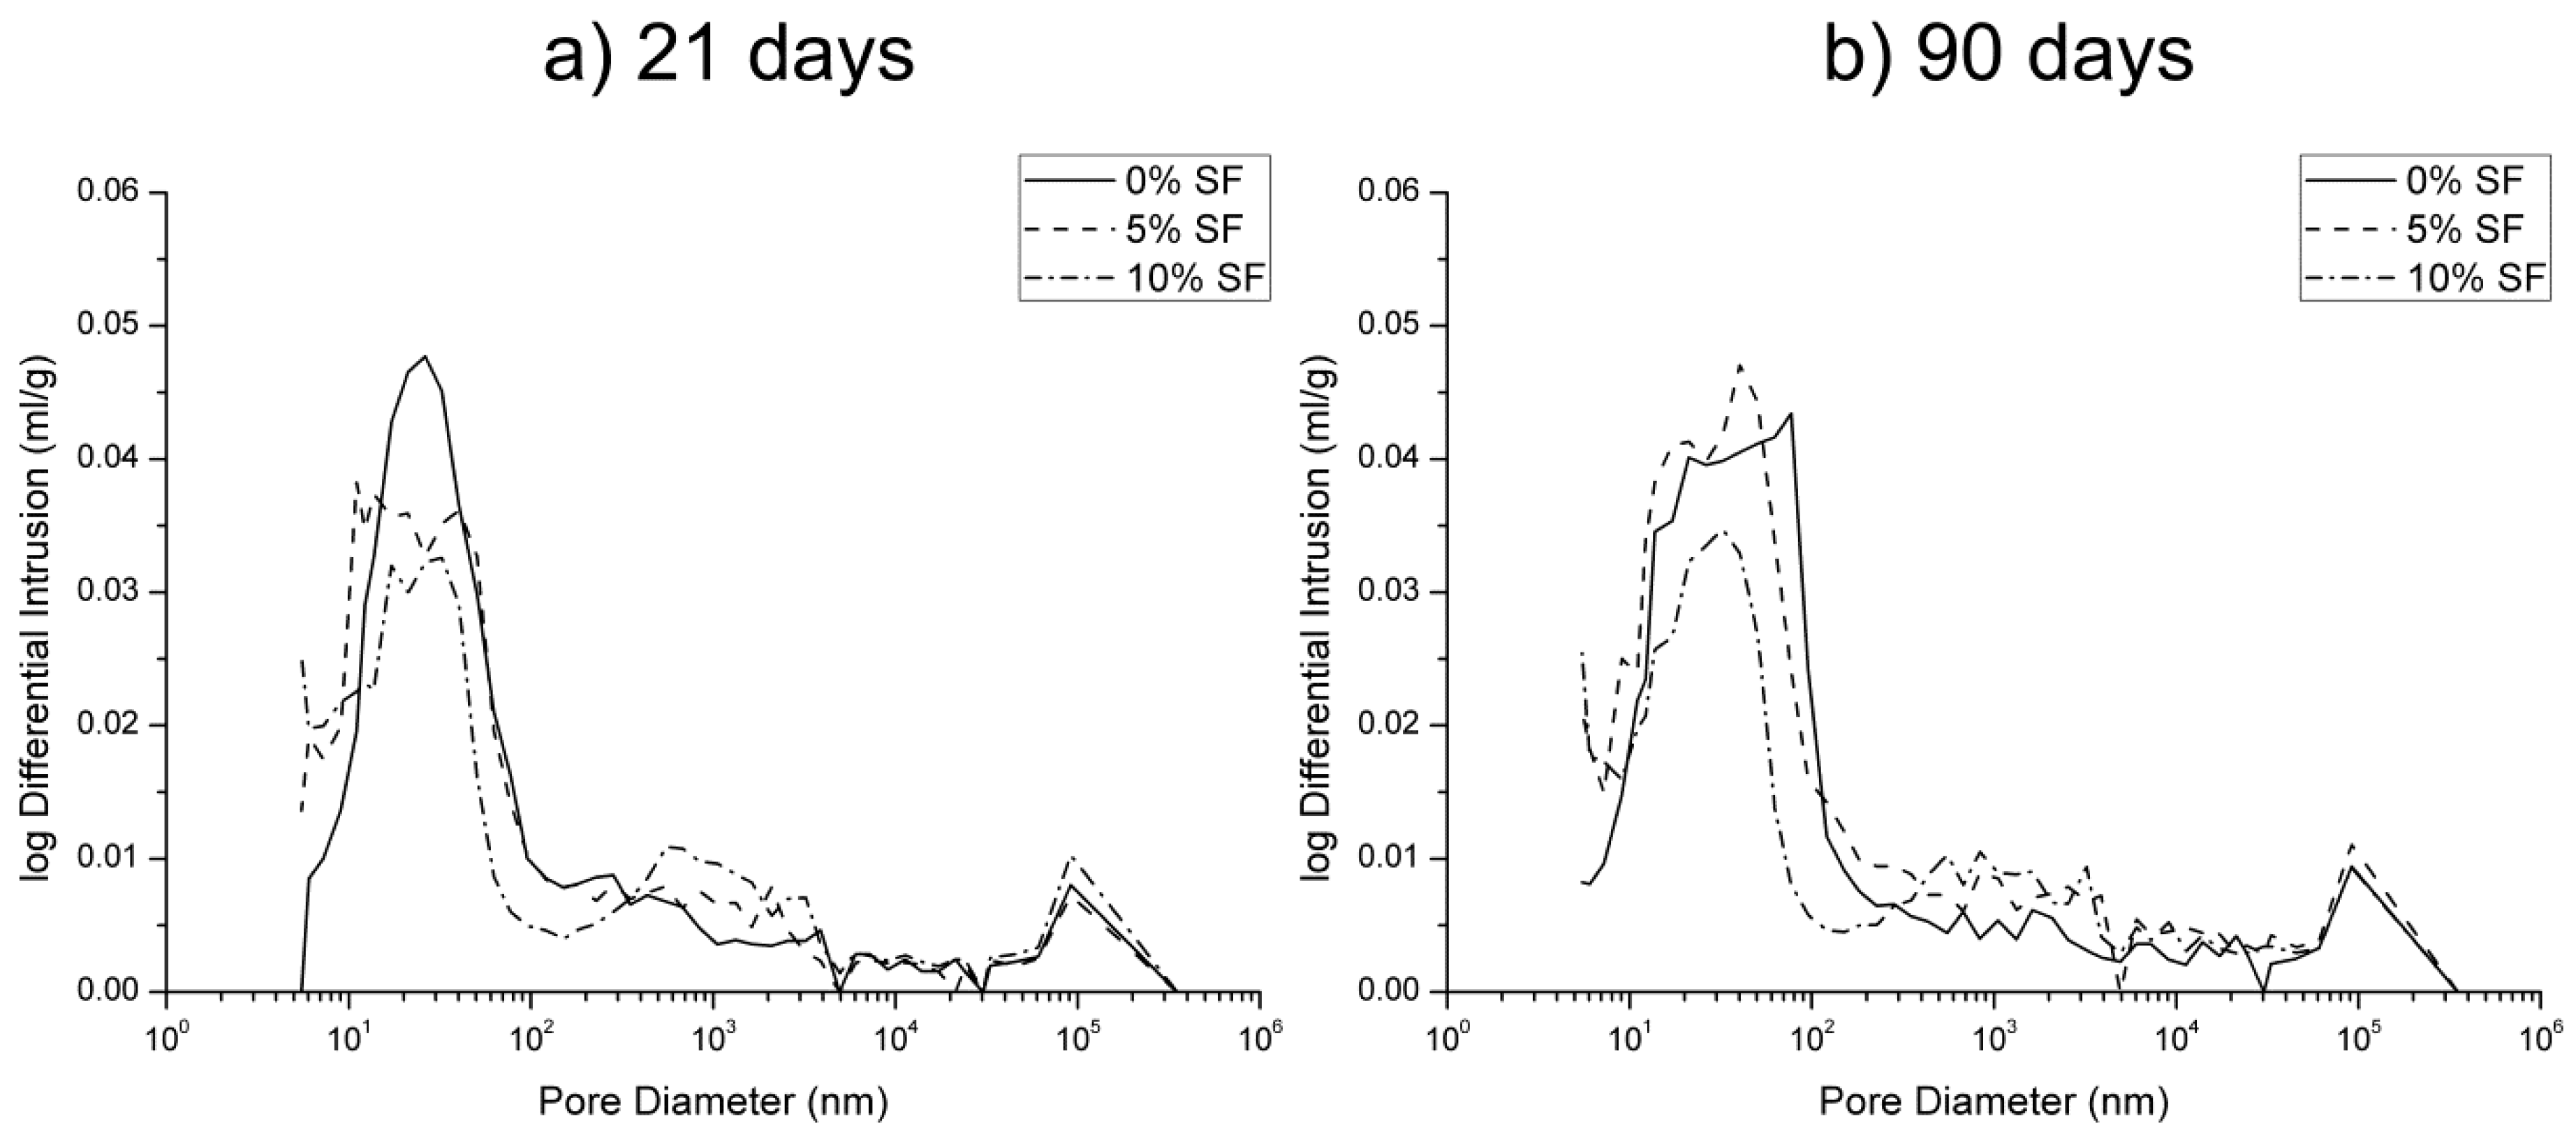
Figure 7.
Curves logarithm of differential intrusion volume versus pore size showed by the studied mortars at 21 days (a) and 90 days (b) of exposure to the mixed solution.
Figure 7.
Curves logarithm of differential intrusion volume versus pore size showed by the studied mortars at 21 days (a) and 90 days (b) of exposure to the mixed solution.

Figure 8.
Curves logarithm of differential intrusion volume versus pore size obtained at 21 days (a) and 90 days (b) of exposure to the 15% MgSO4 solution.
Figure 8.
Curves logarithm of differential intrusion volume versus pore size obtained at 21 days (a) and 90 days (b) of exposure to the 15% MgSO4 solution.

Figure 9.
Variation in the steady-state ionic diffusion coefficient (Ds) measured in samples exposed to the 15% Na2SO4 solution.
Figure 9.
Variation in the steady-state ionic diffusion coefficient (Ds) measured in samples exposed to the 15% Na2SO4 solution.

Figure 10.
Variation in the steady state ionic diffusion coefficient (Ds) measured in samples exposed to the mixed solution.
Figure 10.
Variation in the steady state ionic diffusion coefficient (Ds) measured in samples exposed to the mixed solution.

Figure 11.
Variation in the steady state ionic diffusion coefficient (Ds) measured in samples exposed to the 15% MgSO4 solution.
Figure 11.
Variation in the steady state ionic diffusion coefficient (Ds) measured in samples exposed to the 15% MgSO4 solution.
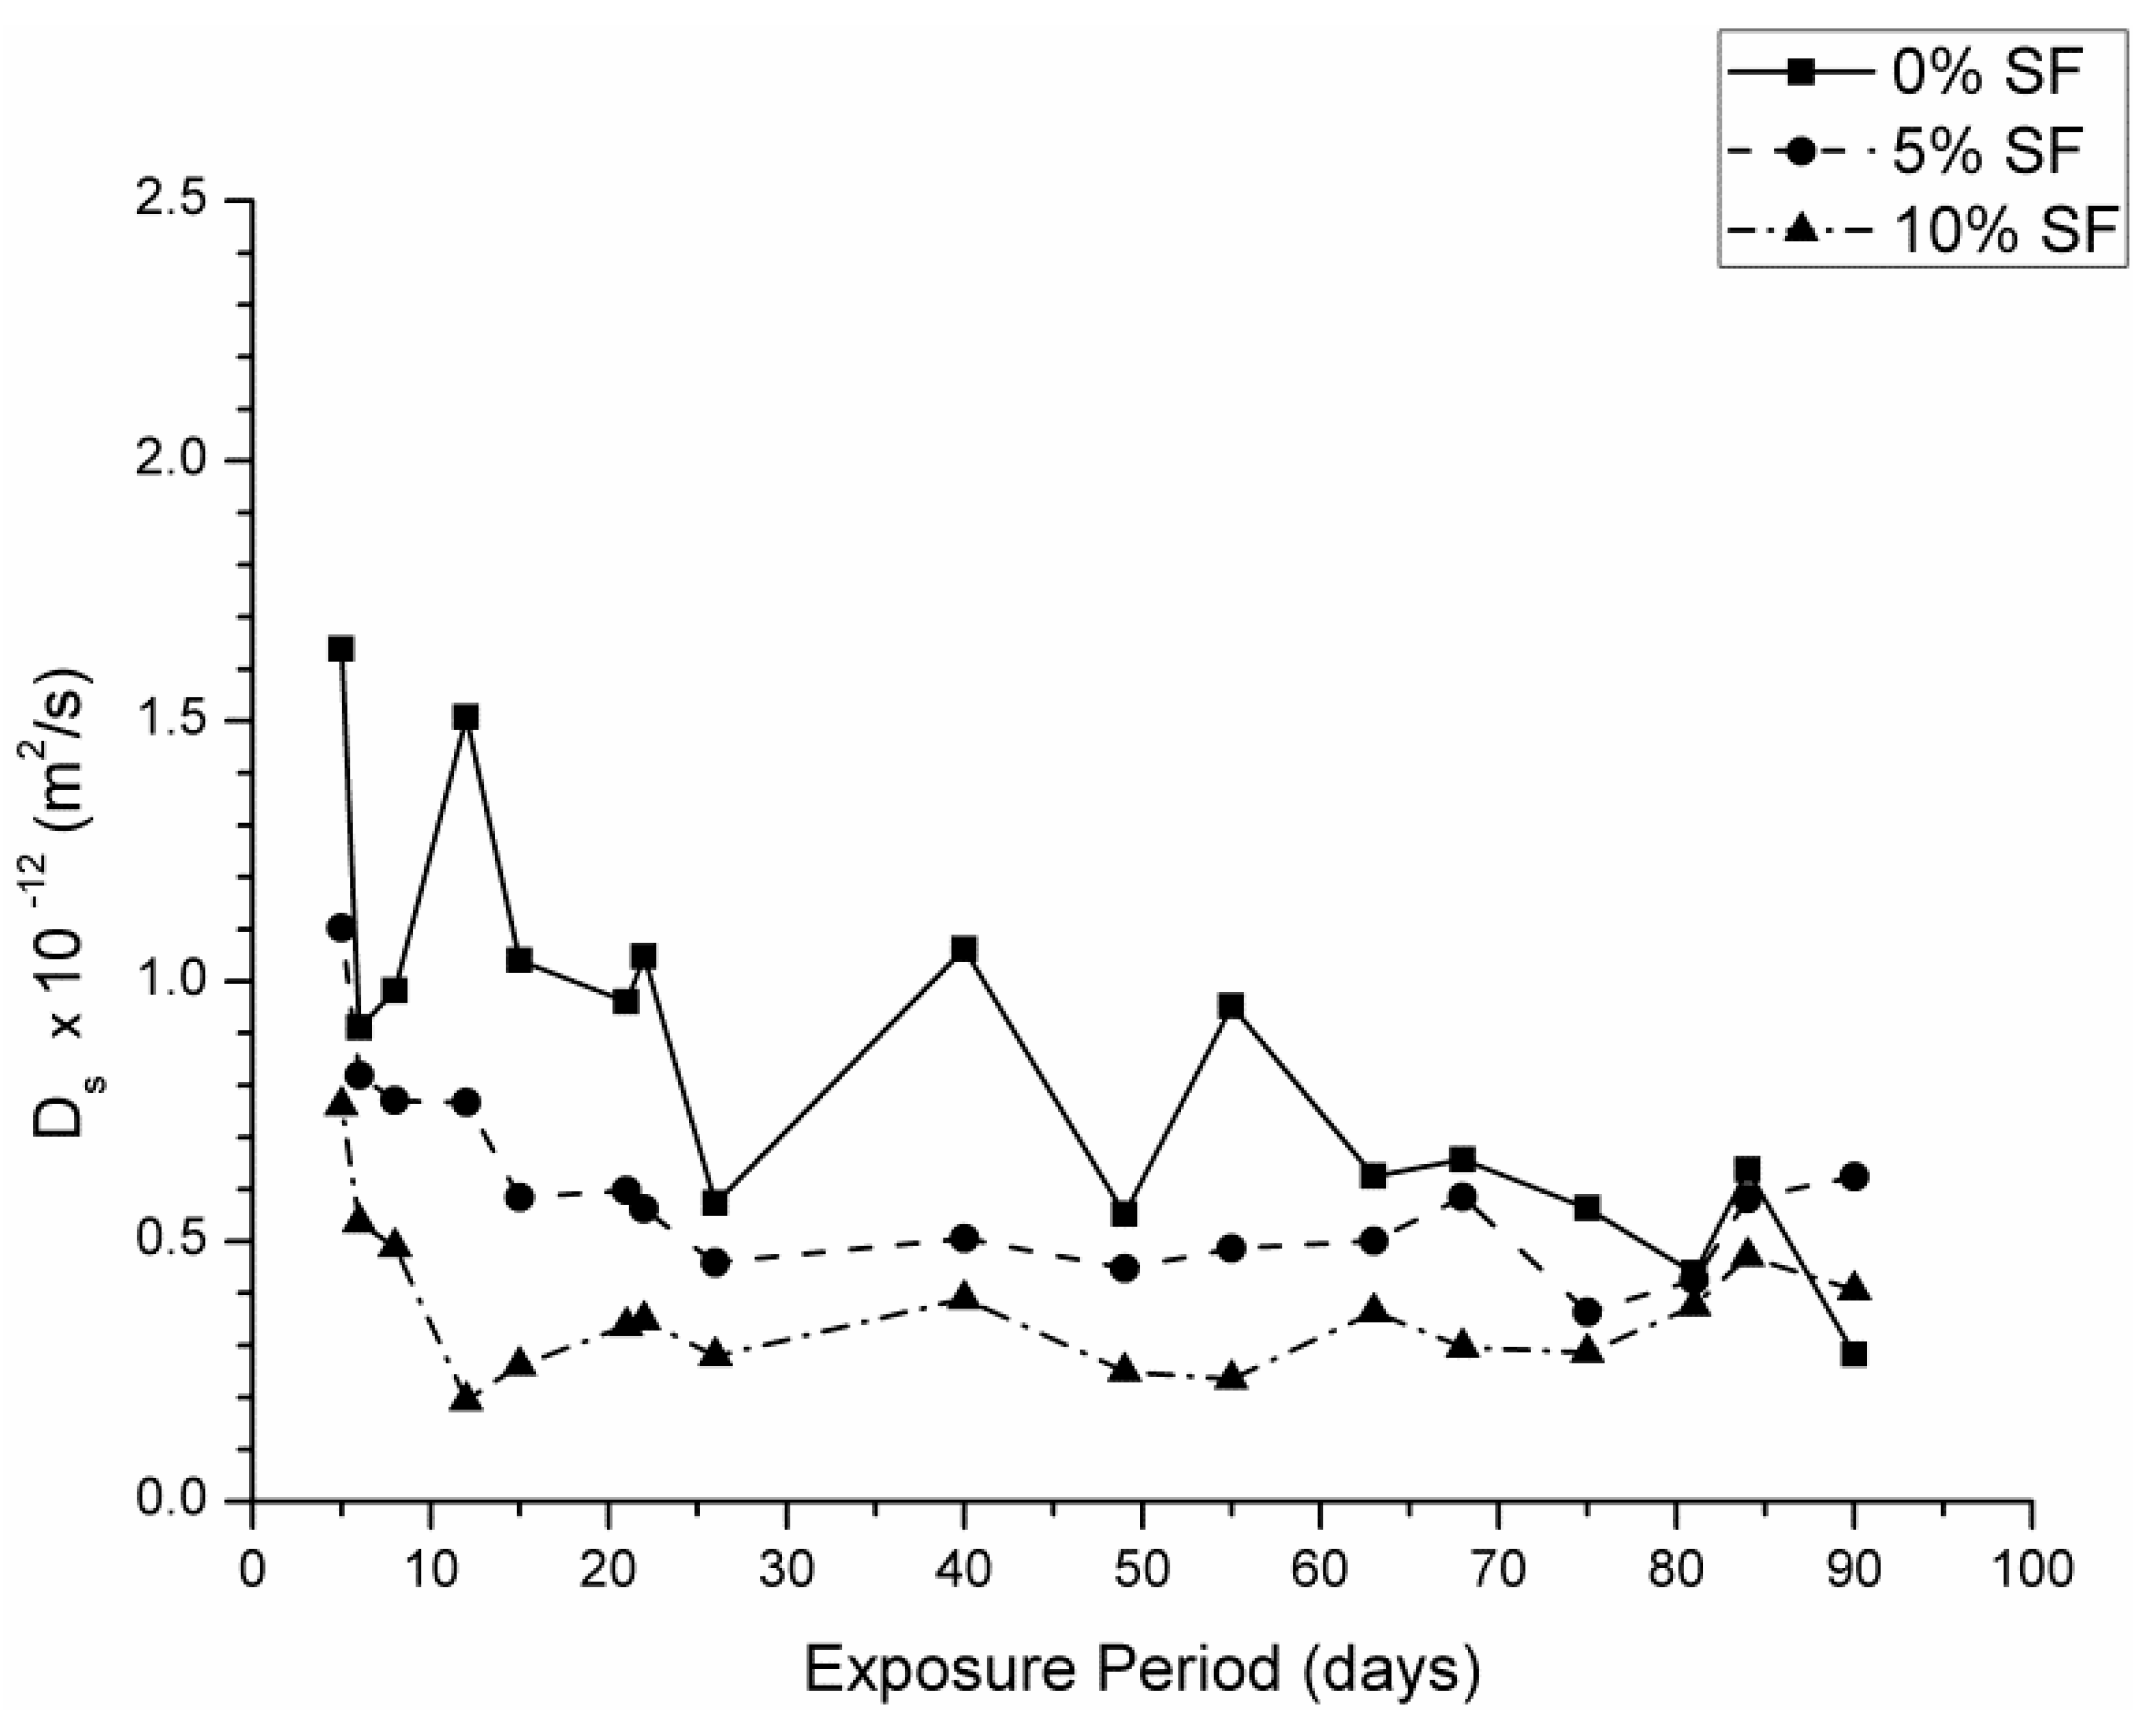
Figure 12.
Compressive strength evolution for analyzed samples and aggressive sulfate solutions.


Table 1.
Chemical composition of the cement and silica fume.
| Compound | CEM I 42.5R (%) | Silica Fume (%) |
|---|---|---|
| CaO | 64.5 | 0.4 |
| SiO2 | 20.0 | 94.1 |
| Al2O3 | 5.7 | 0.3 |
| Fe2O3 | 2.5 | 0.1 |
| SO3 | 3.2 | 0.1 |
| MgO | 0.9 | 0.3 |
| Na2O | 0.1 | 0.6 |
| K2O | 1.0 | 0.6 |
Table 2.
Content in aggressive ions and ratio of magnesium to sulfate ions in the sulfate solutions used.
Table 2.
Content in aggressive ions and ratio of magnesium to sulfate ions in the sulfate solutions used.
| Solution Name | Mg2+ (g/L) | Na+ (g/L) | SO42− (g/L) | Mass Ratio Mg2+/SO42− | Mass Ratio Na+/SO42− | Mg2+ (mol/L) | Na+ (mol/L) | SO42− (mol/L) | Molar Ratio Mg2+/SO42− | Molar Ratio Na+/SO42− |
|---|---|---|---|---|---|---|---|---|---|---|
| 15% Na2SO4 | 0 | 48.558 | 101.442 | 0 | 0.479 | 0 | 1.056 | 1.056 | 0 | 1.000 |
| 7.5% MgSO4 + 7.5% Na2SO4 | 15.145 | 24.279 | 110.576 | 0.136 | 0.220 | 0.622 | 0.529 | 1.151 | 0.540 | 0.460 |
| 15% MgSO4 | 30.290 | 0 | 119.710 | 0.253 | 0 | 1.246 | 0 | 1.246 | 1.000 | 0 |
Table 3.
Median pore diameter (nm) measured for the studied mortars.
| Mortar Type | 15% Na2SO4 Solution | Mixed Solution | 15% MgSO4 Solution | ||||||
|---|---|---|---|---|---|---|---|---|---|
| 21 Days | 90 Days | Variation | 21 Days | 90 Days | Variation | 21 Days | 90 Days | Variation | |
| 0% SF | 43.3 | 58.8 | 35.8% | 58.8 | 68.8 | 17.0% | 60.8 | 67.5 | 11.0% |
| 5% SF | 44.4 | 55.6 | 25.2% | 86.3 | 64.6 | −25.1% | 79.7 | 97.5 | 22.3% |
| 10% SF | 48.8 | 54.3 | 11.3% | 72.3 | 216.1 | 198.9% | 79.6 | 289.2 | 263.3% |
Table 4.
Compressive strength (MPa) results obtained for the studied mortars.
| Mortar Type | 15% Na2SO4 Solution | Mixed Solution | 15% MgSO4 Solution | ||||||
|---|---|---|---|---|---|---|---|---|---|
| 21 Days | 90 Days | Variation | 21 Days | 90 Days | Variation | 21 Days | 90 Days | Variation | |
| 0% SF | 32.3 | 21.2 | −34.4% | 36.5 | 34.9 | −4.4% | 36.5 | 40.8 | 11.8% |
| 5% SF | 57.9 | 59.9 | 3.5% | 53.0 | 44.2 | −16.6% | 46.2 | 47.4 | 2.6% |
| 10% SF | 63.3 | 67.5 | 6.6% | 59.2 | 45.1 | −23.8% | 56.0 | 53.1 | −5.2% |
© 2018 by the authors. Licensee MDPI, Basel, Switzerland. This article is an open access article distributed under the terms and conditions of the Creative Commons Attribution (CC BY) license (http://creativecommons.org/licenses/by/4.0/).
Share and Cite
MDPI and ACS Style
Ortega, J.M.; Esteban, M.D.; Williams, M.; Sánchez, I.; Climent, M.Á. Short-Term Performance of Sustainable Silica Fume Mortars Exposed to Sulfate Attack. Sustainability 2018, 10, 2517. https://doi.org/10.3390/su10072517
AMA Style
Ortega JM, Esteban MD, Williams M, Sánchez I, Climent MÁ. Short-Term Performance of Sustainable Silica Fume Mortars Exposed to Sulfate Attack. Sustainability. 2018; 10(7):2517. https://doi.org/10.3390/su10072517
Chicago/Turabian StyleOrtega, José Marcos, María Dolores Esteban, Mark Williams, Isidro Sánchez, and Miguel Ángel Climent. 2018. "Short-Term Performance of Sustainable Silica Fume Mortars Exposed to Sulfate Attack" Sustainability 10, no. 7: 2517. https://doi.org/10.3390/su10072517
Note that from the first issue of 2016, this journal uses article numbers instead of page numbers. See further details here.