Abstract
Given the increase in consumers’ preferences for coffee, it is becoming important to understand their decision-making processes in the coffee chain context. To deepen the understanding of sustainable outcomes in this context, this study investigates the role of dedication- and constraint-based mechanisms in forming consumers’ repurchase and positive word-of-mouth (WOM) intentions, two critical sustainable outcomes. We examined the effects of coffee quality, the quality of the physical environment, and service quality in accelerating the formation of dedication-based factors. Moreover, this study offers an in-depth understanding of the enablers of perceived switching costs. Data collected from 238 university students that frequently visit coffee chains were empirically tested against the proposed theoretical framework by using structural equation modeling. The results confirm that both dedication- and constraint-based factors substantially predict consumers’ sustainable outcomes in the coffee chain context. Brand image and perceived switching costs play an important role in enhancing consumers’ repurchase and positive WOM intentions compared with customer satisfaction. Coffee quality is significantly associated with both customer satisfaction and brand image, whereas the quality of the physical environment and service quality are only significantly associated with brand image. Habit is found to be the key enabler of perceived switching costs, while loyalty programs have no significant impact on perceived switching costs.
1. Introduction
Since the early 2000s, the coffee chain industry has endured fierce competition because of the emergence of global coffee chains such as Starbucks, Costa Coffee, and Coffee Bean. This intense competition has forced coffee chains to establish long-term relationships and build switching barriers to retain existing customers. Long-term relationships between consumers and service providers are essential to surviving in a highly competitive service marketplace [1,2]. Consumer retention reduces marketing costs and enhances revenue and profitability by increasing consumption levels [3,4]. Thus, service providers are eager to manage consumers’ service experiences. A number of studies on hospitality management have examined the determinants of consumers’ sustainable outcomes, with most focusing on finding the key antecedents of consumers’ repurchase or revisit intention [5,6]. Evidence from prior studies shows that loyal consumers not only revisit a target place but also help recruit more consumers through positive word-of-mouth (WOM) referrals [7,8]. Moreover, given the proliferation of social networking services such as Facebook, Instagram, and blogs, consumers tend to spread information about products and services and share opinions with friends. In the coffee chain context, understanding the mechanisms shaping consumers’ positive WOM behaviors in addition to their repurchase intentions is thus helpful for coffee chains to establish service operation guidelines and marketing campaigns. Therefore, to further the understanding of consumers’ sustainable outcomes in the coffee chain context, this study investigates the antecedents of two critical sustainable outcomes: repurchase and positive WOM intentions.
A great deal of research has studied the effect of consumer satisfaction on sustainable outcomes in the service industry. According to expectation disconfirmation theory [9,10], consumer satisfaction is a function of the disconfirmation arising from the discrepancy of initial expectations and perceived performance. Satisfied consumers form a repurchase intention and share positive WOM, whereas dissatisfied consumers stop subsequent visits and spread negative WOM. Hence, consumer satisfaction is regarded as the key factor to building and maintaining long-term customer relationships. Brand image is also regarded as a key predictor of consumers’ decision-making in the service industry [11,12]. In particular, the intangible characteristics of the service industry may enhance the crucial role of brand image in customers’ decision-making processes because they heavily depend on tangible cues such as interior design, atmosphere, and brand name [13,14]. In the highly competitive service market, service organizations try to establish a distinctive image that differentiates them from competitors to shape favorable attitudes toward their brands [15]. Hence, this study posits that consumer satisfaction and brand image are key elements of the dedication-based mechanism. Although brand image plays an important role in determining consumers’ sustainable outcomes, whether brand image significantly influences these two critical sustainable outcomes is unclear. Thus, to bridge these gaps in the literature, this study also explores the relationships among brand image, customer satisfaction, and the two sustainable outcomes in the coffee chain context.
A number of studies on hospitality management have examined the effect of service experiences on consumers’ decision-making. Customers judge service experiences on the basis of functional, mechanic, and humanic cues [16,17]. Functional cues are related to the technical quality of the service. In the coffee chain context, customers want to drink a flavorful coffee served at an appropriate temperature; thus, functional cues are essential to generate a positive attitude toward service experiences. Mechanic cues are nonhuman components in the service environment consisting of facility and atmosphere factors. The physical environment can powerfully affect customers’ attitudes, service evaluation, and behaviors. In the coffee chain setting, the atmosphere, such as the café’s interior and layout, provides distinctive stimuli to customers that enable them to establish positive attitudes toward the coffee chain. Humanic cues are related to employees’ service performance, including tone of voice and empathy. Employees’ effort and service performance contribute to forming a positive brand image and thus customer satisfaction. In the coffee chain context, a friendly smile and sincere greeting can play an important role in creating a superior customer experience [18]. In the coffee chain context, coffee quality, atmosphere, and service quality may enhance consumer satisfaction and establish a positive brand image. However, few studies have investigated these three perspectives of service experiences in relation to consumer satisfaction and brand image in the coffee chain context. From the dedication-based mechanism perspective, this study thus posits that coffee quality, the quality of the physical environment, and service quality are vital components of service experiences in developing consumer satisfaction and brand image.
Some researchers have pointed out that sustainable outcomes can be affected by both dedication- and constraint-based mechanisms, as some consumers may revisit certain restaurants or coffee chains because of constraints rather than dedication [3,19]. The constraint-based mechanism makes it costly to transfer to another product or service, thereby “locking in” customers. Several studies have shown that this mechanism is captured by perceived switching costs, which are related to the economic, social, or psychological investment that locks consumers into certain services [3,20]. In the coffee chain context, perceived switching costs play an important role in developing sustainable outcomes, because most coffee chains provide reward programs to lock consumers in. Once consumers become familiar with the coffee aroma and facilities of their frequently visited coffee chains, they hesitate to visit an alternative brand. This study investigates the effects of perceived switching costs on consumers’ sustainable outcomes in the coffee chain context. Moreover, it examines the key determinants of perceived switching costs. Loyalty programs are an effective tool to increase consumers’ perceptions of switching costs and build enduring relationships [21,22]. Switching to other service providers may involve forgoing cumulative points and expending effort and time collecting and using points [23]. By contrast, several studies have shown the vital effect of habit on forming perceived switching costs. Kim et al. [24] revealed that perceived switching costs are significantly affected by learning and habit in the context of mobile messenger applications. Since transferring to other service providers may require additional information processing, habitual consumption leads customers to stay with the current service provider [25]. In the coffee chain context, habit may play an important role in developing perceived switching costs since visiting certain coffee chains is a daily routine. Thus, this study posits that loyalty programs and habit are the main factors forming perceived switching costs concerning coffee chains.
This study contributes to the hospitality management literature in several ways. First, it clarifies the role of dedication- and constraint-based mechanisms in shaping consumers’ sustainable outcomes. It compares the relative effects of key factors on both repurchase and positive WOM intentions, two critical sustainable outcomes. Second, this study examines the relative importance of three components of service experiences on customer satisfaction and brand image. Finally, it empirically tests the role of loyalty programs and habit on the formation of perceived switching costs. This study uses structural equation modeling (SEM) to analyze data from 238 university students who frequently visit coffee chains. The findings offer service managers and practitioners several insights into customers’ sustainable outcomes. Understanding the antecedents of consumers’ intentions to repurchase and recommend coffee chains can help service managers increase positive WOM and revenue. The findings will help service managers generate distinctive customer experiences by stimulating the key elements of service experiences. Moreover, service managers and practitioners can form and develop consumers’ perceptions of switching costs by stimulating their significant and prominent enablers.
2. Theoretical Background
2.1. Dedication- and Constraint-Based Mechanisms
In a highly competitive service environment, long-term relationships with consumers help service providers improve revenue and reduce marketing costs. Loyal consumers not only continually repurchase a target service but also help recruit more consumers via positive WOM referrals. According to social exchange theory, long-term relationships between consumers and service providers are developed by dedication- and constraint-based mechanisms [19]. Dedication-based mechanisms are related to the desire to establish long-term relationships, whereas constraint-based mechanisms are associated with forces that constrain consumers from maintaining relationships regardless of the perceived benefits. While the dedication/constraint model provides comprehensive information about consumers’ sustainable outcomes, most studies on hospitality management have only focused on dedication-based factors such as consumer satisfaction and brand image, as it is hard to capture the impacts of constraint-based factors. However, the dedication-based mechanism alone cannot fully capture consumers’ decision-making processes since constraint-based factors create a “lock-in” and reduce consumers’ interests in alternatives [3]. Szymanski and Henard [26] found that consumer satisfaction accounts for less than 25% of the variance in repurchase intention.
Several studies have shown that constraint-based mechanisms are captured by perceived switching costs or calculative commitment [20,27]. Sui and Baloglu [27] demonstrated the significant effects of dedication- and constraint-based mechanisms on consumers’ sustainable outcomes in the casino industry. Lu et al. [28] investigated the role of service value and switching barriers on customers’ behavioral intentions in a passenger transportation service. They posited perceived switching costs and alternative attractiveness as key elements of switching barriers. Baloglu et al. [29] developed a theoretical model integrating both constraint-based factors such as perceived switching costs and loyalty programs and dedication-based factors such as trust and emotional commitment to understand consumer loyalty toward casinos. Lin et al. [30] showed that the dedication/constraint model accounts for considerable variance in customer loyalty in the telecommunication industry. Indeed, they demonstrated that customer loyalty is more strongly related to constraint-based factors than to dedication-based factors. Table 1 summarizes studies applying the dedication/constraint model in various service and hospitality industries. In the coffee chain context, although most studies pay attention to the effects of dedication-based factors such as consumer satisfaction and brand image, some consumers are likely to retain relationships with coffee chain because of loyalty programs and habitual consumption.

Table 1.
Studies of dedication-based and constraint-based mechanisms.
2.2. Research Model and Hypotheses
Figure 1 illustrates the research model. The theoretical framework is based on dedication- and constraint-based mechanisms that predict consumers’ sustainable outcomes in the coffee chain context. This study posits that customer satisfaction and brand image are dedication-based factors, whereas perceived switching costs is the constraint-based factor. This study also investigates the relative effects of service experience components on consumers’ sustainable outcomes. Moreover, it clarifies the role of loyalty programs and habit in developing perceived switching costs.
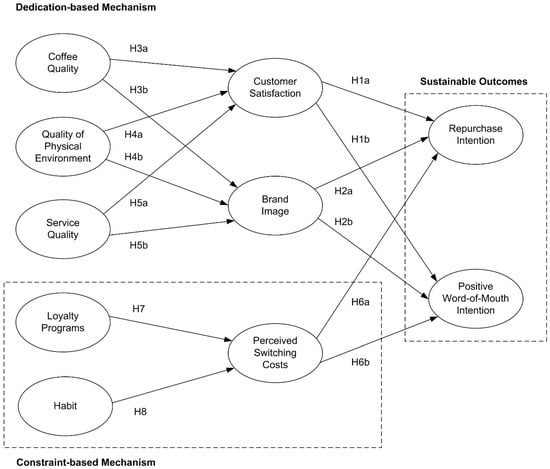
Figure 1.
Research model.
2.2.1. Dedication-Based Mechanisms
Consumer satisfaction is defined as an ex-post evaluation of cumulative consumer experience with a target product or service [10]. According to the dedication/constraint model [9,19], the dedication-based mechanism is associated with perceived benefits including consumer satisfaction, which plays a key role in forming a consumer’s sustainable outcomes [35]. Consumer satisfaction is an affective and evaluative response that can capture actual performance and expectation discrepancies [10]. Consumers are satisfied with a target service when the actual performance meets or exceeds expectations. Several studies have shown the explorative power of consumer satisfaction in enhancing consumers’ sustainable outcomes [1,6]. In the service profit chain, the higher the customer satisfaction, the higher the customer loyalty. Satisfied consumers are more likely to form enduring and long-term relationships with a particular coffee chain than are unsatisfied ones. Thus, consumer satisfaction is expected to be a critical determinant of consumers’ repurchase and positive WOM intentions.
Hypothesis 1a (H1a).
Consumer satisfaction positively influences repurchase intention.
Hypothesis 1b (H1b).
Consumer satisfaction positively influences positive WOM intention.
Brand image is defined as “consumers’ perceptions about a brand as reflected by the brand associations held in their memories” [36]. The favorability of brand image can reduce quality risks and simplify customers’ purchase decisions [12,13]. Thus, managing a distinct brand image is a significant business strategy for service managers, which in turn influences customer loyalty and sustainable outcomes [37]. Several studies on hospitality management have shown that brand image affects customer repurchase intention and consumer loyalty significantly [11]. A coffee chain’s image may thus have a large impact on sustainable outcomes. Hence, generating and maintaining a differentiated brand image is a critical mission of coffee chains. In particular, the effective management of brand image is significant for generating sustainable outcomes because of the exponentially growing number of coffee chains. Customers who have a favored brand image tend to believe that their preferred coffee chain offers high-quality coffee and service, which leads to a higher attitude toward the certain coffee chain and greater behavioral intention. Moreover, a favorable brand image ultimately results in greater consumer intention to repurchase and spread positive WOM.
Hypothesis 2a (H2a).
Brand image positively influences repurchase intention.
Hypothesis 2b (H2b).
Brand image positively influences positive WOM intention.
Coffee quality, a fundamental attribute of coffee chains, is included in the functional cue of service experiences. Coffee quality is influenced by freshness, aroma, flavor, and temperature [17,18]. Consumers’ perceptions of coffee quality influence their decisions to patronize a coffee chain and spread positive. The positive assessment of coffee freshness, aroma, and temperature may enhance consumer satisfaction with a coffee chain. Further, consumers’ evaluations of the superiority and excellence of coffee quality may influence the brand image of a coffee chain. Excellent consumer experiences with a flavorful coffee reinforce a positive image of the coffee chain.
Hypothesis 3a (H3a).
Coffee quality positively influences consumer satisfaction.
Hypothesis 3b (H3b).
Coffee quality positively influences brand image.
The quality of the physical environment is defined as customers’ emotional responses to the service environment [38]. Although coffee quality plays a critical role in coffee chain success, excellent coffee quality alone is insufficient [18]. Mechanic clues are a vital factor in services marketing since the intangibility of services leads customers to rely on tangibles to assess their service experiences [16,17]. Han and Ryu [6] examined the effects of artifacts, spatial layout, and ambient conditions on consumers’ sustainable outcomes in full-service restaurants. Their findings indicated that customers’ perceptions of physical factors strengthen consumer satisfaction. Moreover, several studies have shown that the physical environment of hotels and restaurants strengthens brand image [13,14]. In the coffee chain context, physical factors such as interior design, layout, and facilities are significant cues for judging service quality. Consumers consciously sense the physical surroundings when visiting a restaurant or coffee chain. Pleasing physical surroundings may determine the degree of customer satisfaction and brand image.
Hypothesis 4a (H4a).
Quality of the physical environment positively influences consumer satisfaction.
Hypothesis 4b (H4b).
Quality of the physical environment positively influences brand image.
Service quality refers to the cognitive evaluation of the services provided by employees and service providers [16]. Service quality can capture a consumer’s subjective responses to objects based on service employees’ attitudes and performance during service delivery [17]. Delivering excellent service by courteous employees leads to a superior customer experience. Several studies show the significant role of service quality on customer satiation as well as brand image in restaurants, hotels, and banking [39]. In the coffee chain environment, customers evaluate not only coffee quality but also the service provider’s attitude and performance during service delivery [18]. Service quality is thus a core determinant of customer satisfaction and can help strengthen brand image. In this regard, consumers’ perceptions of service quality play a critical role in establishing long-term relationships with coffee chains.
Hypothesis 5a (H5a).
Service quality positively influences consumer satisfaction.
Hypothesis 5b (H5b).
Service quality positively influences brand image.
2.2.2. Constraint-Based Mechanisms
Perceived switching costs refer to consumers’ perceptions of the money, time, and psychological efforts required to transfer from one service provider to an alternative [20]. Switching costs include not only financial but also emotional and psychological investments [40,41]. Most consumers are motivated to stay with a current service provider to reduce switching costs. Previous works on service management have shown that perceived switching costs enhance consumers’ loyalty beyond what is explained by dedication-based factors [28]. Sui and Baloglu [27] found that trust and switching costs are mediated through emotional commitment, which in turn influences consumer loyalty. Kim et al. [42] showed that perceived switching costs significantly influence continuance commitment in the hotel industry. Lin et al. [30] showed that constraint-based factors more strongly influence customer loyalty than does customer satisfaction. Thus, perceived switching costs positively influence repurchase intention and positive WOM intention by discouraging customers from transferring to other coffee chains.
Hypothesis 6a (H6a).
Perceived switching costs positively influence repurchase intention.
Hypothesis 6b (H6b).
Perceived switching costs positively influence positive WOM intention.
Loyalty programs can enhance calculative emotional commitment and perceived switching costs [22,27]. In the hotel industry, for example, loyalty programs such as Marriot Rewards and Hilton Honors Program help consumers develop a sense of being locked into the hotel brand. Tanford et al. [22] found that loyalty programs in the hotel industry make consumers resistant to switching by increasing perceived switching costs. Moreover, several service and hospitality brands such as Harrah and Starbucks perform customer relationship marketing campaigns to provide customized services based on loyalty programs. Coffee chains also try to develop consumers’ perceived switching costs by using reward or loyalty programs. For example, in Starbucks, once customers register and load a Starbucks Card, rewards are automatically added to their accounts whenever they purchase. Starbucks executives have pointed to their reward program as a key factor in revenue growth. Consumers are thus likely to avoid changing coffee chains because they want to collect and use points. Thus, loyalty programs may play a vital source in developing consumers’ perceptions of switching costs about a frequently visited coffee chain.
Hypothesis 7.
Loyalty programs positively influence perceived switching costs.
Habit refers to a repeated and routine behavioral pattern that automatically occurs without conscious awareness [43]. Consumers are known as cognitive misers in that they tend to minimize the amount of cognitive load when decided on a specific task [44]. If consumers are faced with a familiar environmental or situational cues, they often automatically engage in habitual or routine choice rather than cognitive and conscious decision-making processes [45]. Thus, the habitual consumption of a service is regarded as a major enabler of perceived switching costs. Woisetschläger et al. [25] revealed the significant effect of habit on switching costs in the newspaper industry. Kim et al. [24] found that habitual behaviors increase the level of perceived switching costs in mobile messenger applications. Given the number of decisions involved across people’s lives, it is hard for individuals to allocate substantial cognitive effort and time to each decision. Thus, decisions regarding small budget items such as coffee or food may be affected by habitual choice behavior, which requires less information-processing effort and time.
Hypothesis 8.
Habit positively influences perceived switching costs.
3. Research Methodology
3.1. Instrument Development
The measurement items in this study were derived from previously validated studies in hospitality management. The questionnaire was modified to suit the coffee chain context. The questionnaire was divided into three sections. In the first section, respondents were asked what brand of coffee chain they often patronized. The second section included questions that measure the constructs in the proposed theoretical model. Each measurement item corresponding to the constructs was measured on a seven-point Likert-type scale (1 = strongly disagree, 7 = strongly agree). The last section included demographic information such as age, gender, and monthly average consumption expenses. Before conducting the survey, the questionnaire was reviewed by three researchers in the hospitality management domain to check problems with content, wording, and question ambiguity. The modified questionnaire was then pilot-tested on 25 university students. All constructs were found to have reliability through a verification of Cronbach’s alpha values, which were all above the accepted 0.7 level of reliability. Appendix A lists the survey items.
3.2. Data Collection
The empirical data for this study were collected through a paper-based survey. The questionnaires were administered to university students in South Korea, and were distributed and gathered from 5 to 10 June 2016. This study obtained 253 responses, although it discarded 15 incomplete respondents; therefore, 238 responses with experience of visiting coffee chains in the past month were selected as the final sample. As shown in Table 2, the number of male and female respondents was nearly equal. Respondents’ ages ranged from 18 to 45 years, with a mean age of 21.47 years and a standard deviation of 2.93 years. Table 2 presents respondents’ demographic details.
Table 2.
Profile of respondents.
3.3. Data Analysis
The research model was tested by using the maximum likelihood estimator of LISREL 8.80. This analysis technique is particularly efficient for a research model with multiple independent and dependent constructs. Multiple measures were used to calculate the fit between the model and data, such as normed chi-square (χ2/df), Tucker-Lewis index (TLI), critical function index (CFI), normed fit index (NFI), and root mean square error of approximation (RMSEA) [46].
4. Results
4.1. Measurement Model
As shown in Table 3, the measurement model provided a proper fit to the data, according to the goodness-of-fit. Firstly, to verify convergent validity, this study investigated the factor loading values of the measurements of the research model, as shown in Table 3. Convergent validity is acceptable if the factor loading value is 0.60 or higher [47]. In this study, the lowest item loading was 0.63 (REI3), satisfying convergent validity. Second, to check the reliabilities of the constructs, the composite reliability (CR) and average variance extracted (AVE) values were assessed. Reliability is acceptable if the CR value exceeds 0.70 and if the AVE value exceeds 0.50 [48]. As shown in Table 3, all factors have acceptable values. Third, to examine discriminant validity, the AVE values of the individual factors were compared with the shared variances between the factors. Table 4 indicates that the diagonal contains the square root of the AVE values. All AVE values were higher than those of the off-diagonal elements in the corresponding rows and columns, which confirmed discriminant validity. Lastly, to check common method bias in self-reported survey research, this study conducted Harman’s single-factor test. If common method variance does exist, a single factor will account for the majority of the covariance among measures [49]. The poor model fit ( = 5694.40, df = 464, /df = 12.72, TLI = 0.69, CFI = 0.71, NFI = 0.68, RMSEA = 0.218) suggests that common method bias is unlikely to be a serious concern in this study.
Table 3.
Scale reliabilities.
Table 4.
Correlation matrix and discriminant assessment.
4.2. Structural Model
As shown in Table 5, the structural model was also found to fit the data well according to the goodness-of-fit indices. SEM was conducted to test the hypothesized relationships among the constructs. Overall, the theoretical framework accounted for 34% of repurchase intention variance and 36% of positive WOM intention variance. Figure 2 presents the analysis results.
Table 5.
Summary of the results.
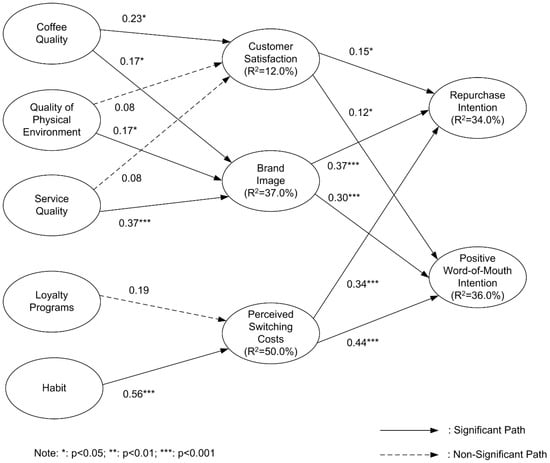
Figure 2.
Analysis results.
Consumer satisfaction significantly influences both repurchase intention and positive WOM intention, providing empirical support for H1a and H1b, respectively. Brand image also has a significant effect on repurchase intention and positive WOM intention. Therefore, H2a and H2b were supported. Coffee quality was found to significantly influence customer satisfaction and brand image; hence, H3a and H3b were supported. However, the quality of the physical environment and service quality had an insignificant effect on consumer satisfaction, rejecting H4a and H5a. These two dimensions of quality significantly influenced brand image, thus supporting H4b and H5b. Perceived switching costs were found to play a significant role in forming both repurchase and positive WOM intentions, thus supporting H6a and H6b. However, loyalty programs were not significantly associated with perceived switching costs, while habit had a significant effect on them. Therefore, H7 was not supported, while H8 was supported. Table 5 summarizes the results.
5. Discussion
5.1. Summary of the Results
Drawing upon the dedication/constraint model, this study describes why consumers continue to repurchase from certain coffee chains and resist transferring to a rival. The theoretical framework asserts that consumers’ sustainable outcomes are determined by both dedication-based and constraint-based factors. The analysis results find that dedication-based and constraint-based factors act as independent antecedents of the formation of consumers’ sustainable outcomes. Among the dedication-based factors, brand image has a stronger effect on both consumers’ repurchase and positive WOM intentions than consumer satisfaction. This finding implies that generating and maintaining a differentiated brand image is a powerful way of enhancing consumers’ sustainable outcomes. Perceived switching costs also explain a considerable amount of the variance in consumers’ repurchase and positive WOM intentions in the coffee chain context.
The results also show that coffee quality is positively associated with both customer satisfaction and brand image. This finding implies that coffee quality accelerates the positive attitude toward a target coffee chain and thus serves as a key antecedent to shaping consumer satisfaction and brand image. However, contrary to prior expectations, consumers’ perceptions of the quality of the physical environment and service quality do not significantly affect consumer satisfaction. Although consumers generally evaluate service experiences based on functional, mechanic, and humanic cues, the atmosphere of a coffee chain and employee capability do not significantly influence consumer satisfaction in this context owing to the homogeneous and undifferentiated physical environment and employee service performance across coffee chain brands. The results indicate that both physical environment quality and service quality are positively associated with brand image. Consumers with higher perceptions of the quality of physical environment and service quality have a higher positive feeling about certain coffee chains, leading to greater intentions to repurchase and recommend. Thus, this study contributes to the service management literature by identifying the role of three components of service experience in the coffee chain context.
Finally, this study explored the key enablers of perceived switching costs. It found that loyalty programs had no significant effect on the formation of switching costs concerning certain coffee chains. Liu [50] showed that loyalty programs do not prompt consumers to change their purchase behaviors. This finding implies that most loyalty programs in coffee chains look alike and have similar reward benefits, thus reducing their effectiveness. However, in line with Kim et al. [24], habit significantly influenced consumers’ switching costs in the coffee chain context. Ye and Potter [51] also showed that users’ habits of choosing an incumbent product or service impede their intentions to switch. These results confirm that habit plays a vital role in the formation of the perceived switching costs of coffee chains.
5.2. Theoretical Implications
One major contribution of this study is its confirmation of the effect of dedication- and constraint-based mechanisms on consumers’ sustainable outcomes in the coffee chain context. The presented findings show that consumers’ sustainable outcomes are shaped by two mechanisms: (a) consumer satisfaction and brand image of the coffee chain, as formed by the prospect of a long-term and enduring relationship, and (b) perceived switching costs, which make it hard for the consumer to switch to other coffee chains. Hence, by adapting the dedication-based and constraint-based framework, this study advances the understanding of consumers’ decision-making processes in the coffee chain context. By assessing the chi-square difference test ( 22.3, p < 0.01), this study finds that perceived switching costs offer a considerable amount of explanatory power for consumers’ sustainable outcomes. In addition, Table 6 shows the difference of and Cohen’s kappa.
Table 6.
Difference of and Cohen’s kappa.
Second, this study examined the role of brand image in consumers’ sustainable outcomes. In the coffee chain context, Tu et al. [2] showed that brand image significantly affects customer loyalty. This study also reveals that brand image significantly influences consumers’ intentions to repurchase and positive WOM. Moreover, brand image has a greater explanatory power than consumer satisfaction on consumers’ sustainable outcomes, because the impact of brand image strengthens with the direct consumer experience of the coffee chain [52]. The presented results showed that the relationship between brand image and repurchase intention was stronger (p < 0.05) than that between customer satisfaction and repurchase intention. Further, brand image was a stronger predictor of positive WOM intention (p < 0.05) than was customer satisfaction.
Third, the study sheds light on the impacts of the qualities of coffee, physical environment, and service on dedication-based factors. Several studies have identified functional, mechanic, and humanic cues as vital components of service experiences. Jin et al. [13] examined the effects of the quality of the physical environment and food quality on brand image and customer satisfaction. They found that both the quality of the physical environment and food quality affect brand image. Chen et al. [53] investigated restaurant-specific stimuli such as food, atmosphere, and service quality in the context of luxury restaurants. They found that such stimuli significantly influence customers’ emotions during service encounters, which, in turn, affect behavioral intentions. However, in contrast to the literature, the presented results revealed different effects of these three quality elements on customer satisfaction and brand image in the coffee chain environment. Customers regard service quality as a key attribute or service experience in evaluating consumer satisfaction, while the excellent quality of coffee, the physical environment, and service leads to a differentiated brand image. This study thus clarified the different roles of these three service dimensions on customer satisfaction and brand image in the coffee chain context.
Lastly, this study offers an in-depth understanding of the enablers of perceived switching costs. This study found that loyalty or reward programs do not generate consumers’ perceptions of switching costs. This finding supports Mattila’s [54] results that such programs fail to explain customer loyalty. Meyer-Waarden and Benavent [21] also demonstrated that consumers only slightly change their buying patterns after they join loyalty programs in the grocery retail context. This study thus confirms the salient power of habit in explaining perceived switching costs. Customers tend to stay with frequently visited coffee chains when the attractiveness of alternatives decreases and switching costs increase. Consumers are also likely to repurchase and spread positive WOM about their current coffee chain rather than transfer to an alternative chain based on routine choice.
5.3. Managerial Implications
The results of this study provide coffee chain managers with insight into how to improve consumers’ sustainable outcomes. First, this study suggests that consumers’ sustainable outcomes are shaped by well-managed dedication- and constraint-based mechanisms. Therefore, the optimal strategy for coffee chains is to both offer excellent service to customers and increase switching costs. In particular, the results advise service managers and practitioners to focus on developing a distinctive brand image among dedication-based factors, which has a greater impact on consumers’ repurchase and recommendation intentions than consumer satisfaction. A distinctive brand image is a source of information at the point of visit since it reduces quality risks and simplifies the complexity of customers’ decision-making processes. Once customers perceive positive feelings about a certain brand, they remain loyal to the coffee chain and recommend it to others. Although most coffee chains have similar beverages and ambience, a premium brand image is thus a key driver of the development of long-term relationships with consumers. Thus, coffee chain managers should try to differentiate their chains from competitors by establishing a distinctive and premium brand image.
Another practical implication is that understanding the prominent determinants of dedication-based factors can help coffee chain managers enhance consumer satisfaction and brand image. Excellent services evoke positive feelings toward the chain, which leads to long-term relationships with consumers. Studies of hospitality management have shown that consumers regard products, employee services, and the physical environment as key attributes of service experiences. To strengthen relationships with consumers, coffee chain managers must thus recognize the different role of the three components of service experiences. In this context, coffee quality is essential to enhance consumer service experience. To assure coffee quality, Starbucks and Coffee Bean deliver structured training programs for supervisors to train and develop baristas. These training programs help employees learns coffee-related skills and provide the knowledge required to baristas and managers. Of tangible service perceptions, customers expect comfortable seating, lighting, and a warm atmosphere to strengthen brand identification. Thus, coffee chain managers should try to create a welcoming and familiar environment for customers. Further, because consumers continuously compare the available coffee chains and choose those with better service qualities, coffee chain managers must also allocate resources to enhancing service quality and thus brand image. Moreover, they could develop operation manuals and train employees to prevent service failures and improve service quality.
The last practical implication is that understanding the prominent role of perceived switching costs can help coffee chain managers manipulate their switching barriers. To retain consumers, managers should manage such costs. The higher the perceived switching costs, the more likely customers are to stay with their preferred coffee chain. By developing habitual consumption, coffee chains can discourage customers from switching. Launching mobile applications for orders and payments could also help customers visit certain brands frequently. For example, Starbucks has developed a mobile application for payments and personalized orders. More than eight million customers had downloaded this mobile application by 2014, helping increase revenue by 11%. Thus, coffee chain managers should try to increase switching costs by developing habitual consumption patterns. Mobile applications offer several benefits such as increasing customers’ switching barriers and enhancing consumers’ orders and payments.
6. Limitations
Although this study reveals several theoretical and practical implications, it has some limitations. First, the theoretical model was tested based on a sample of university students, typically in their 20s. Although consumers in their 20s and 30s comprise the major customers of coffee chains, these findings may not be generalized across general consumers. Therefore, a more comprehensive sample considering age, income, and geographic dispersion would ensure external validity and enhance the generalizability of the results. Further study is thus necessary to re-analyze the hypotheses by using more comprehensive sample data. Second, since the data were gathered in only one county, interpretation of the findings should be made with caution. Consumers’ cultural background and characteristics might influence their decision-making processes in the coffee chain context. Accordingly, additional studies need to consider these cultural characteristics to understand how different consumers associate their perceptions and sustainable outcomes. Finally, some previous works on hospitality management have considered perceived switching costs to be a moderator between perception and behavioral intention. Han and Ryu [7], for example, found that switching costs significantly moderate the path from consumer satisfaction to positive WOM intention. Further research is thus necessary to analyze the moderating effects of perceived switching costs to better understand their role in consumers’ sustainable outcomes.
Acknowledgments
This study was supported by the 2018 Yeungnam University Research Grant.
Conflicts of Interest
The authors declare no conflict of interest.
Appendix A. List of Model Constructs and Items.
Repurchase intention is derived from Chaudhuri and Holbrook [11].
- REI1: I will keep buying this brand in the future.
- REI2: I would like to come back to stores of this brand in the future.
- REI3: I will consider repurchasing this brand in the future.
- REI4: I intend to increase my purchase of this brand in the future.
Positive WOM intention is derived from Chaudhuri and Holbrook [11].
- PWI1: I would recommend this brand to my friends or others.
- PWI2: I encourage my friends or others to buy this brand.
Customer satisfaction is derived from Bhattacherjee [9].
- How do you feel about your overall buying experience with this brand?
- CUS1: Very displeased/very pleased
- CUS2: Very frustrated/very contented
- CUS3: Absolutely terrible/absolutely delighted
Brand image is derived from Wang [33].
- BRI1: This brand is successful and self-confident.
- BRI2: This brand is persuasive and shrewd.
- BRI4: This brand is open and responsive to consumers.
Coffee quality is derived from Chen and Hu [18].
- COQ1: The quality of coffee at this brand is consistently high during each visit.
- COQ2: This brand offers coffee with excellent freshness.
- COQ3: This brand offers coffee that may or may not have good flavor.
- COQ4: This brand at this brand offers coffee with appropriate temperature.
Quality of physical environment is derived from Ryu et al. [14].
- QPE1: The stores at this brand have a visually attractive interior design and decor.
- QPE2: The stores at this brand have music and illumination appropriate for its atmosphere.
- QPE3: The stores and their equipment are thoroughly clean.
- QPE4: Employees are neat and well dressed.
Service quality is derived from Ryu et al. [14].
- SEQ1: Employees at this brand serve me beverages exactly as I ordered them.
- SEQ2: Employees at this brand provide prompt and quick service.
- SEQ3: Employees at this brand are always willing to help me.
- SEQ4: Employees at this brand make me feel comfortable in dealing with them.
Perceived switching costs are derived from Jones et al. [41].
- PSC1: I feel somewhat locked into using this brand.
- PSC2: I feel sort of stuck with this brand.
- PSC3: Some aspects of my life would be affected if I stop buying this brand now.
- PSC4: To stop buying this brand would require considerable personal sacrifice.
Habit is derived from Limayem et al. [45].
- HAB1: Buying this brand has become a habitual act.
- HAB2: I buy this brand automatically.
- HAB3: When I want to drink a cup of coffee, I buy this brand first.
- HAB4: Buying this brand is natural to me.
References
- Hennig-Thurau, T.; Gwinner, K.P.; Gremler, D.D. Understanding relationship marketing outcomes: An integration of relational benefits and relationship quality. J. Serv. Res. 2002, 4, 230–247. [Google Scholar] [CrossRef]
- Tu, Y.T.; Wand, C.M.; Chang, H.C. Corporate brand image and customer satisfaction on loyalty: An empirical study of Starbucks Coffee in Taiwan. J. Soc. Dev. Sci. 2012, 3, 24–32. [Google Scholar]
- Kim, S.S.; Son, J.Y. Out of dedication or constraint? A dual model of post-adoption phenomena and its empirical test in the context of online services. MIS Q. 2009, 33, 49–70. [Google Scholar] [CrossRef]
- Reichheld, F.F.; Sasser, W.E., Jr. Zero defections: Quality comes to services. Harv. Bus. Rev. 1990, 68, 105–111. [Google Scholar] [PubMed]
- Han, H.; Back, K.J.; Barrett, B. Influencing factors on restaurant customers’ revisit intention: The roles of emotions and switching barriers. Int. J. Hosp. Manag. 2009, 28, 563–572. [Google Scholar] [CrossRef]
- Han, H.; Ryu, K. The roles of the physical environment, price perception, and customer satisfaction in determining customer loyalty in the restaurant industry. J. Hosp. Tour. Res. 2009, 33, 487–510. [Google Scholar] [CrossRef]
- Han, H.; Ryu, K. Key factors driving customers’ word-of-mouth intentions in full-service restaurants: The moderating role of switching costs. Cornell Hosp. Q. 2012, 28, 1–14. [Google Scholar] [CrossRef]
- Durna, U.; Dedeoglu, B.B.; Balikçioglu, S. The role of servicescape and image perceptions of customers on behavioral intentions in the hotel industry. Int. J. Contemp. Hosp. Manag. 2015, 27, 1728–1748. [Google Scholar] [CrossRef]
- Bhattacherjee, A. Understanding information systems continuance: An expectation-confirmation model. MIS Q. 2001, 25, 351–370. [Google Scholar] [CrossRef]
- Oliver, R.L. Cognitive, affective, and attribute bases of the satisfaction response. J. Consum. Res. 1993, 20, 418–430. [Google Scholar] [CrossRef]
- Chaudhuri, A.; Holbrook, M.B. The chain of effects from brand trust and brand affect to brand performance: The role of brand loyalty. J. Mark. 2001, 65, 81–93. [Google Scholar] [CrossRef]
- Jalilvand, M.R.; Samiei, N. The effect of electronic word of mouth on brand image and purchase intention. Mark. Intell. Plan. 2012, 30, 460–476. [Google Scholar] [CrossRef]
- Jin, N.; Lee, S.; Huffman, L. Impact of restaurant experience on brand image and customer loyalty: Moderating role of dining motivation. J. Travel Tour. Mark. 2012, 29, 532–551. [Google Scholar] [CrossRef]
- Ryu, K.; Lee, H.R.; Kim, W.G. The influence of the quality of the physical environment, food, and service on restaurant image, customer perceived value, customer satisfaction, and behavioral intentions. Int. J. Contemp. Hosp. Manag. 2012, 24, 200–223. [Google Scholar] [CrossRef]
- Manhas, P.S.; Tukamushaba, E.K. Understanding service experience and its impact on brand image in hospitality sector. Int. J. Hosp. Manag. 2015, 45, 77–87. [Google Scholar] [CrossRef]
- Berry, L.L.; Carbone, L.P.; Haeckel, S.H. Managing the total customer experience. MIT Sloan Manag. Rev. 2002, 43, 85–89. [Google Scholar]
- Wall, E.A.; Berry, L.L. Combined effects of the physical environment and employee behavior on customer perception of restaurant service quality. Cornell Hosp. Q. 2007, 48, 59–69. [Google Scholar] [CrossRef]
- Chen, P.T.; Hu, H.H. How determinant attributes of service quality influence customer-perceived value: An empirical investigation of the Australian coffee outlet industry. Int. J. Contemp. Hosp. Manag. 2010, 22, 535–551. [Google Scholar] [CrossRef]
- Bendapudi, N.; Berry, L.L. Customers’ motivations for maintaining relationships with service providers. J. Retail. 1997, 73, 15–37. [Google Scholar] [CrossRef]
- Jones, M.A.; Mothersbaugh, D.L.; Beatty, S.E. Switching barriers and repurchase intentions in services. J. Retail. 2000, 76, 259–274. [Google Scholar] [CrossRef]
- Meyer-Waarden, L.; Benavent, C. Grocery retail loyalty program effects: Self-selection or purchase behavior change? J. Acad. Mark. Sci. 2009, 37, 345–358. [Google Scholar] [CrossRef]
- Tanford, S.; Raab, C.; Kim, Y. The influence of reward program membership and commitment on hotel loyalty. J. Hosp. Tour. Res. 2010, 34, 1–29. [Google Scholar] [CrossRef]
- Wirtz, J.; Mattila, A.S.; Lwin, M.O. How effective are loyalty reward programs in driving share of wallet? J. Serv. Res. 2007, 9, 327–334. [Google Scholar] [CrossRef]
- Kim, B.; Kang, M.; Cho, H. Determinants of post-adoption behaviors of mobile communications applications: A dual-model perspective. Int. J. Hum.-Comput. Interact. 2014, 30, 547–559. [Google Scholar] [CrossRef]
- Woisetschläger, D.M.; Lentz, P.; Evanschitzky, H. How habits, social ties, and economic switching barriers affect customer loyalty in contractual service settings. J. Bus. Res. 2011, 64, 800–808. [Google Scholar] [CrossRef]
- Szymanski, D.M.; Henard, D.H. Customer satisfaction: A meta-analysis of the empirical evidence. J. Acad. Mark. Sci. 2001, 29, 16–35. [Google Scholar] [CrossRef]
- Sui, J.J.; Baloglu, S. The role of emotional commitment in relationship marketing: An empirical investigation of a loyalty model for casinos. J. Hosp. Tour. Res. 2003, 27, 470–489. [Google Scholar] [CrossRef]
- Lu, T.; Tu, R.; Jen, W. The role of service value and switching barriers in an integrated model of behavioural intentions. Total Qual. Manag. 2011, 22, 1071–1089. [Google Scholar] [CrossRef]
- Baloglu, S.; Zhong, Y.Y.; Tanford, S. Casino loyalty: The influence of loyalty program, switching costs, and trust. J. Hosp. Tour. Res. 2014, 24. [Google Scholar] [CrossRef]
- Lin, T.C.; Huang, S.L.; Hsu, C.J. A dual-factor model of loyalty to IT products—The case of smartphones. Int. J. Inf. Manag. 2015, 35, 215–228. [Google Scholar] [CrossRef]
- Hu, H.H.; Huang, C.T.; Chen, P.T. Do reward programs truly build loyalty for lodging industry? Int. J. Hosp. Manag. 2010, 29, 128–135. [Google Scholar]
- Kim, H.W.; Gupta, S. Investigating customer resistance to change in transaction relationship with an internet vendor. Psychol. Mark. 2012, 29, 257–269. [Google Scholar] [CrossRef]
- Zhou, T.; Lu, Y. Examining post-adoption usage of mobile services from a dual perspective of enablers and inhibitors. Int. J. Hum.-Comput. Interact. 2012, 27, 1177–1191. [Google Scholar] [CrossRef]
- Kim, T.; Kim, W.G.; Kim, H.B. The effects of perceived justice on recovery satisfaction, trust, word-of-mouth, and revisit intention in upscale hotels. Tour. Manag. 2009, 30, 51–62. [Google Scholar] [CrossRef]
- Hossain, M.A.; Kim, M. Does multidimensional service quality generate sustainable use intention for Facebook? Sustainability 2018, 10, 2283. [Google Scholar] [CrossRef]
- Keller, K.L. Conceptualizing, measuring, and managing customer-based brand equity. J. Mark. 1993, 57, 1–22. [Google Scholar] [CrossRef]
- Wang, C.W. Service quality, perceived value, corporate image, and customer loyalty in the context of varying levels of switching costs. Psychol. Mark. 2010, 27, 252–262. [Google Scholar] [CrossRef]
- Bitner, M.J. Servicescapes: The impact of physical surroundings on customers and employees. J. Mark. 1992, 56, 57–71. [Google Scholar] [CrossRef]
- Hu, Y.C.; Lee, P.C.; Chuang, Y.S.; Chiu, Y.J. Improving the sustainable competitiveness of service quality within air cargo terminals. Sustainability 2018, 10, 2319. [Google Scholar] [CrossRef]
- Sharma, N.; Patterson, P.G. Switching costs, alternative attractiveness and experience as moderators of relationship commitment in professional, consumer services. Int. J. Serv. Ind. Manag. 2000, 11, 470–490. [Google Scholar] [CrossRef]
- Jones, M.A.; Reynolds, K.E.; Mothersbaugh, D.L.; Beatty, M.S. The positive and negative effects of switching costs on relational outcomes. J. Serv. Res. 2007, 9, 335–355. [Google Scholar] [CrossRef]
- Kim, Y.; Cho, M.H.; Han, H. Testing the model of hotel chain frequency program members’ loyalty intentions. Asia Pac. J. Tour. Res. 2014, 19, 35–60. [Google Scholar] [CrossRef]
- Triandis, H.C. Attitude and Attitude Change; Wiley & Sons: New York, NY, USA, 1971. [Google Scholar]
- Liu, B.Q.; Goodhue, D.L. Two worlds of trust for potential e-commerce users: Humans as cognitive misers. Inf. Syst. Res. 2012, 23, 1246–1262. [Google Scholar] [CrossRef]
- Limayem, M.; Hirt, S.G.; Cheung, C.M.K. How habit limits the predictive power of intention: The case of information systems continuance. MIS Q. 2007, 31, 705–738. [Google Scholar] [CrossRef]
- Browne, M.; Cudeck, R. Alternative ways of assessing model fit. In Testing Structural Equation Models; Bollen, K.A., Long, J.S., Eds.; Sage: Newbury Park, CA, USA, 1993; pp. 136–162. [Google Scholar]
- Hair, J.; Anderson, R.; Tatham, R.B. Multivariate Data Analysis; Prentice Hall: Upper Saddle River, NJ, USA, 1998. [Google Scholar]
- Fornell, C.; Larcker, D.F. Evaluating structural equation models with unobservable variables and measurement error. J. Mark. Res. 1981, 18, 39–50. [Google Scholar] [CrossRef]
- Podsakoff, P.M.; MacKenzie, S.B.; Lee, J.Y.; Podsakoff, N.P. Common method biases in behavioral research: A critical review of the literature and recommended remedies. J. Appl. Psychol. 2003, 88, 879–903. [Google Scholar] [CrossRef] [PubMed]
- Liu, Y. The long-term impact of loyalty programs on consumer purchase behavior and loyalty. J. Mark. 2007, 71, 19–35. [Google Scholar] [CrossRef]
- Ye, C.; Potter, R. The role of habit in post-adoption switching of personal information technologies: An empirical investigation. Commun. Assoc. Inf. Syst. 2011, 28, 585–610. [Google Scholar]
- Meng, X.L.; Rosenthal, R.; Rubin, D.B. Comparing correlated correlation coefficients. Psychol. Bull. 1992, 111, 172–175. [Google Scholar] [CrossRef]
- Chen, A.; Peng, N.; Hung, K.P. The effects of luxury restaurant environments on diners’ emotions and loyalty. Int. J. Contemp. Hosp. Manag. 2015, 27, 236–260. [Google Scholar] [CrossRef]
- Mattila, A.S. How affective commitment boosts guest loyalty and promotes frequent-guest programs. Cornell Hosp. Q. 2006, 47, 174–181. [Google Scholar] [CrossRef]
© 2018 by the author. Licensee MDPI, Basel, Switzerland. This article is an open access article distributed under the terms and conditions of the Creative Commons Attribution (CC BY) license (http://creativecommons.org/licenses/by/4.0/).