Article

Evaluation of Long-Term SOC and Crop Productivity within Conservation Systems Using GFDL CM2.1 and EPIC

1
Department of Natural Resources and Environmental Design, North Carolina A&T State University, Greensboro, NC 27411, USA
2
Department of Biological and Agricultural Engineering, University of Arkansas, Fayetteville, AR 72701, USA
3
Civil, Architectural & Environmental Engineering, North Carolina A&T State University, Greensboro, NC 27411, USA
4
Texas A&M AgriLife Research, Blackland Research and Extension Center, Temple, TX 76502, USA
5
Center for Agricultural and Rural Development, Iowa State University, Ames, IA 50011-1054, USA
6
Sustainable Intensification Innovation Lab, Kansas State University, Manhattan, KS 66506, USA
7
Department of Agricultural Economics and Agribusiness, University of Arkansas, Fayetteville, AR 72701, USA
8
Department of Soil Science, Faculty of Agronomy, Royal University of Agriculture, Phnom Penh 12401, Cambodia
*
Author to whom correspondence should be addressed.
Sustainability 2018, 10(8), 2665; https://doi.org/10.3390/su10082665
Submission received: 27 June 2018 / Revised: 15 July 2018 / Accepted: 25 July 2018 / Published: 29 July 2018

Abstract

:
Will soil organic carbon (SOC) and yields increase for conservation management systems in tropical zones in response to the next 100 years? To answer the question, the Environmental Policy Integrated Climate (EPIC) model was used to study the effects of climate change, cropping systems, conservation agriculture (CA) and conservation tillage management practices on SOC and crop productivity in Kampong Cham, Cambodia. The EPIC model was successfully calibrated and validated for crop yields, biomass, SOC and nitrogen based on field data from a five-year field experiment. Historical weather (1994–2013) was used for baseline assessment versus mid-century (2046–2064) and late-century (2081–2100) climate projections generated by the Geophysical Fluids Dynamics Laboratory (GFDL) CM2.1 global climate model. The simulated results showed that upland rice yield would increase the most under the B1 scenario in mid-century for all treatments, followed by soybean and maize. Cassava yield only increased under CA treatment when cultivated as a continuous primary crop. Carbon sequestration was more sensitive to cropping systems and crop rotation than climate change. The results indicated that the rotated CA primary crop (maize) systems should be prioritized for SOC sequestration as well as for increasing crop productivity. In addition, rice systems may increase SOC compared to soybean and cassava.

1. Introduction

Cambodia, one of the least-developed countries in Asia, has 80% of the population living in rural areas and 65% relying on agriculture [1,2,3]. Agriculture accounts for 40% of the GDP [1]; rice, maize, soybean, cassava, soybean and sesame comprise the majority of agricultural production [4]. Cambodia is characterized by extreme poverty [5,6] due to many factors such as environmental degradation and low agricultural productivity [6,7]. Additionally, Cambodia is highly vulnerable to climate change as evidenced by increasing frequency of floods and drought [8,9]. The Cambodian Government has developed a strategic plan to mitigate climate change for the period 2014–2023, in which agriculture is considered as a vulnerable sector [10]. However, no concrete guidance was provided as to which agricultural practices and cropping systems should be adopted to overcome the adverse effects of future climate shifts.
Conservation tillage (CT) and conservation agriculture (CA), which follow three primary principles [11] we call McD principles: M–Minimum soil disturbance (no-till), c–continuous mulch and D–Diversity by crop rotation and inter-cropping with cover crops, have been proven to increase yield [12,13,14,15], reduce soil erosion [16,17,18,19], improve soil health [20,21,22,23] and increase soil organic carbon (SOC) [24,25,26,27,28,29,30,31]. Increased SOC sequestration can improve soil health and result in corresponding improved crop productivity [32,33]. However, the adoption of CA or CT must be continuous because alternating CT with conventional tillage undermines the potential to sequester SOC under CT [34,35]. CA is a sustainable approach to alleviate climate change impacts [20,24]. Han et al. [36] reported that increased organic carbon input was the most efficient way to increase SOC sequestration, and that climate conditions were one of the key factors that drove SOC sequestration and accumulation rate. Thus, CA and CT adoption may support agricultural adaptation efforts in Cambodia by reducing soil erosion, improving soil health and increasing productivity.
Modeling is proven to be an alternative approach to predicting the long-term impacts of different cropping systems and practices on SOC sequestration and crop productivity in Cambodia and other tropical regions, due to limitations in available SOC data. Many studies have reported using the Environmental Policy Integrated Climate (EPIC) model [37] to evaluate the long-term impacts of climate change, cropping systems and/or tillage practices on crop productivity [38,39,40,41,42] and SOC levels [43,44,45,46]. Overall, these studies found that: (1) SOC increased in response to CT implementation but that conventional tillage adoption resulted in decreased SOC, and (2) crop yields might or might not increase depending on soil type, crops and land condition, but that CT resulted in more stable yields in extreme weather conditions. However, little is known about the long-term impact of CA and CT in rice, soybean and cassava systems on clay soil in the tropics, especially in Cambodia. Thus, the objective of this study is to evaluate the combined long-term impacts of climate change, cropping systems, CT and CA practices on crop yields and SOC sequestration using the EPIC model. The short- and long-term goals of the study are (1) to provide scientific evidence to promote appropriate practices and cropping systems in Cambodia and in tropical regions in general to improve soil health and crop productivity, (2) to evaluate the potential of CT and CA for climate change mitigation and for improving crop productivity, (3) to improve policy, education efforts, and innovative research that can result in reduced environmental degradation and improved crop production for tropical conditions.

2. Materials and Methods

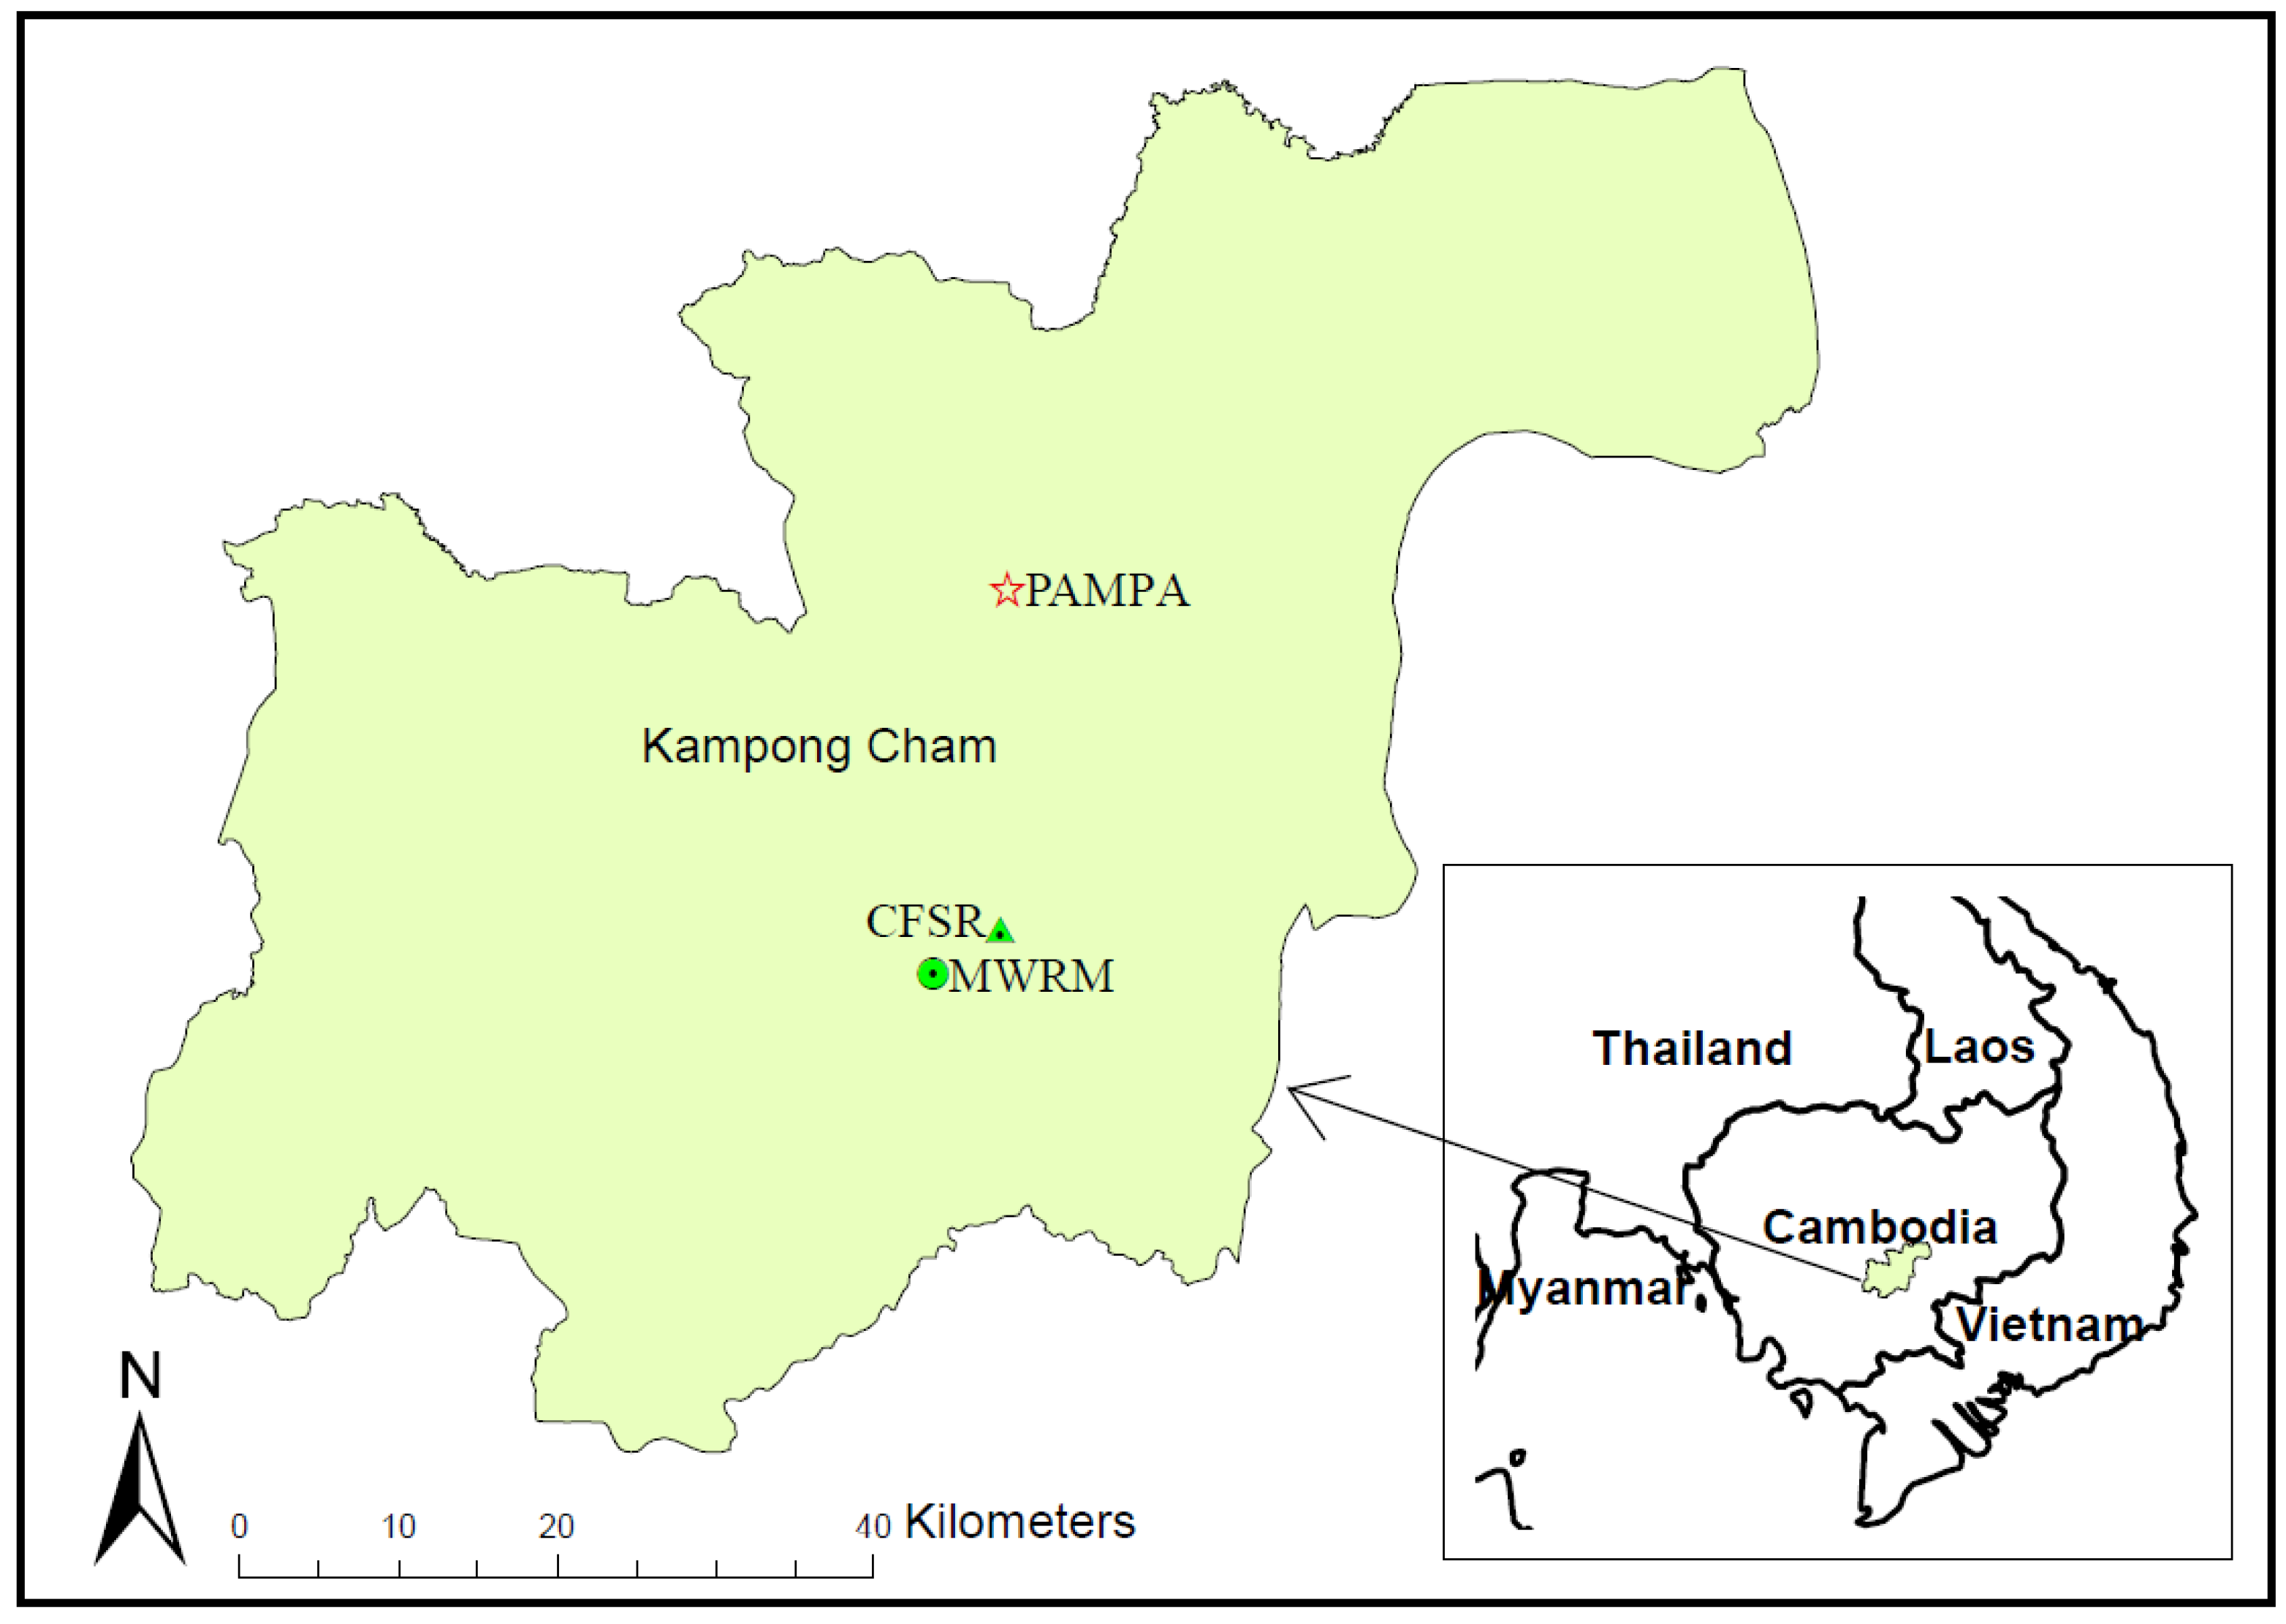
2.1. Experimental Site

The Programme d’Actions Multi-Pays en Agroécologie (PAMPA) site is located in Bos Knor Commune, Chamkar Leu District, Kampong Cham Province, Cambodia (Figure 1). The mean annual minimum and maximum temperature are 24 and 33 °C and the mean annual precipitation is 1988 mm for the 1979 to 2013 period, based on data collected from the Ministry of Water Resources and Meteorology (MWRM) and the Climate Forecast System Reanalysis (CFSR) (Figure 1) [47,48]. The MWRM data consisted of daily precipitation, maximum and minimum temperature and relative humidity data for the time period of 2000 to 2013. Thus, those data were used in EPIC for that 14-year time period. The CFSR data, which manifests very similar precipitation characteristics as compared to the MWRM data, was used for the initial part of the spin-up simulation period (1982 to 1999) as described further in Section 2.3. The soil type is heavy clay (73% clay and 26% silt), and was classified as an Oxisol per the U.S. Department of Agriculture (USDA) Soil Taxonomy or a Farralsol based on the United Nations Food and Agriculture Organization (FAO) Soil Classification [49].

2.2. Experimental Design

Field data were collected from 36 plots of twelve treatments and three replications in a randomized complete block design within each cropping system. Each treatment was applied within a 0.03 ha plot. The CT treatments were disk-plowed twice to a depth of 15 to 20 cm before planting, and all crop and weed residues were retained and incorporated into the soil. Three primary cropping systems of upland rice, soybean and cassava, which were planted in rows, were managed with CT, CA1, CA2, or CA3 treatments (Table 1). The CT treatments, namely CTR, CTS and CTC were based on continuous cultivation of the respective primary upland rice (R), soybean (S) or cassava (C) crop, plus a corresponding secondary crop: mung bean–upland rice, sesame–soybean, and/or cassava (monocrop).
The secondary crops were planted in the early monsoon season (from early April to late June) and before planting of the primary crops in the main monsoon season (from July to early November), with the exception that cassava was planted in the early monsoon season and harvested around February of the following year. Sesame and soybean were sown manually, whereas the rest were sown with a 2-row no-till planter. The CA1 treatments were continuously planted with the primary crop, while the CA2&3 treatments, which are referred to as “rotated primary crop (maize)”, featured the rotation of the primary crops with maize during the main monsoon months (Table 1).
All of the CA treatments included the cultivation of a cover crop (stylo, millet, sorghum and/or sunn hemp) as secondary crop and intercropped with the main crops. A cover crop (usually millet) was sowed during the early monsoon season. A roller implement was typically used 30 to 40 days before the primary and maize crops were planted in the main monsoon season, that effectively terminated the cover crop by rolling over the cover crop biomass. The cover crop biomass was then spread on the surface for ground cover before planting of the primary and maize crops. Then, another cover crop (usually stylo) was broadcasted in the middle of inter-rows at 0, 15 and 35 days after the sowing of maize, cassava or upland rice, respectively, and 30 days before harvesting soybean. Stylo was planted during the main monsoon and normally grew through the dry season of the following year. Depending on the density of the stylo growth, millet, sorghum and/or sunn hemp were then inter-cropped for 60 to 75 days to improve the soil cover before sowing the main crops.
Fertilizers (Table A2) were applied by hand as a basal application with thermo phosphate (i.e., 16% P2O5, 31% CaO, and 16% MgO) before planting in early April, and potassium chloride (KCl; 60% K2O) as applied only to cover crops in mid-May [50]. A top dressing of urea (46% N) and potassium chloride (KCl; 60% K2O) was applied to the main crops.

2.3. EPIC Model Description, Calibration and Validation

The WinEPIC0810 Version 6.0 (AgriLife Researc, Blackland Research and Extension Center. Temple, TX. https://blackland.tamu.edu/models/) (last updated on 16 February 2016) is a Windows-based version of the EPIC model, which was originally developed by the USDA-Agricultural Research Service (ARS) and currently maintained by Texas A&M AgriLife Blackland Research & Extension Center (BREC). The EPIC model is widely used by researchers and government agencies to optimize crop management, maximize crop yield and profit, and identify impacts of agricultural practices on soil erosion, SOC and water quality [38,51,52,53,54,55,56,57,58,59,60,61,62].
For this activity, the five-year (2009 to 2013) cropping pattern and management (land preparation, planting, harvesting and fertilizing) for each treatment in Table 1 were used as input for the five-year EPIC simulations and repeated for the 100-year predictions. The soil properties used as the initial soil input (Table A1) were based on data obtained from soil tests conducted in early 2009 before the experiment was initiated, plus data obtained at the end of initialization runs (from 1982 to 2008) for unknown parameters that were not available in the 2009 soil test [50]. Finally, the initial SOC and organic N concentration at the end of the initialization runs were modified to match the values of SOC and organic N measured in 2009. A spin-up run of 27 years (1982–2008) was used to stabilize the model before the simulation of the investigated period. Local average yields were used to ensure that the yields simulated during the spin-up period were reasonable. After this stage, the model was successfully calibrated (2009 to 2011) and validated (2012 to 2013) for the primary experiment period (2009 to 2013) for crop yields and SOC stocks up to 100 cm depth in each of the cropping systems [50,53,63]. The R2 values ranged from 0.62 to 0.88 for each upland rice, soybean, cassava, and maize yields [63]. The biomass of each individual crop, including cover crops, were satisfactorily replicated with all of the points close to the 1:1 curve [53] and the percent bias (PBIAS) within the 25% limit as suggested by [52], except for cassava (−27%) and maize (−36%) [50,63]. The SOC R2 of each treatment within each cropping system ranged from 0.65 to 0.99 (p < 0.001) and the percent bias (PBIAS) ≤ 13% [53].

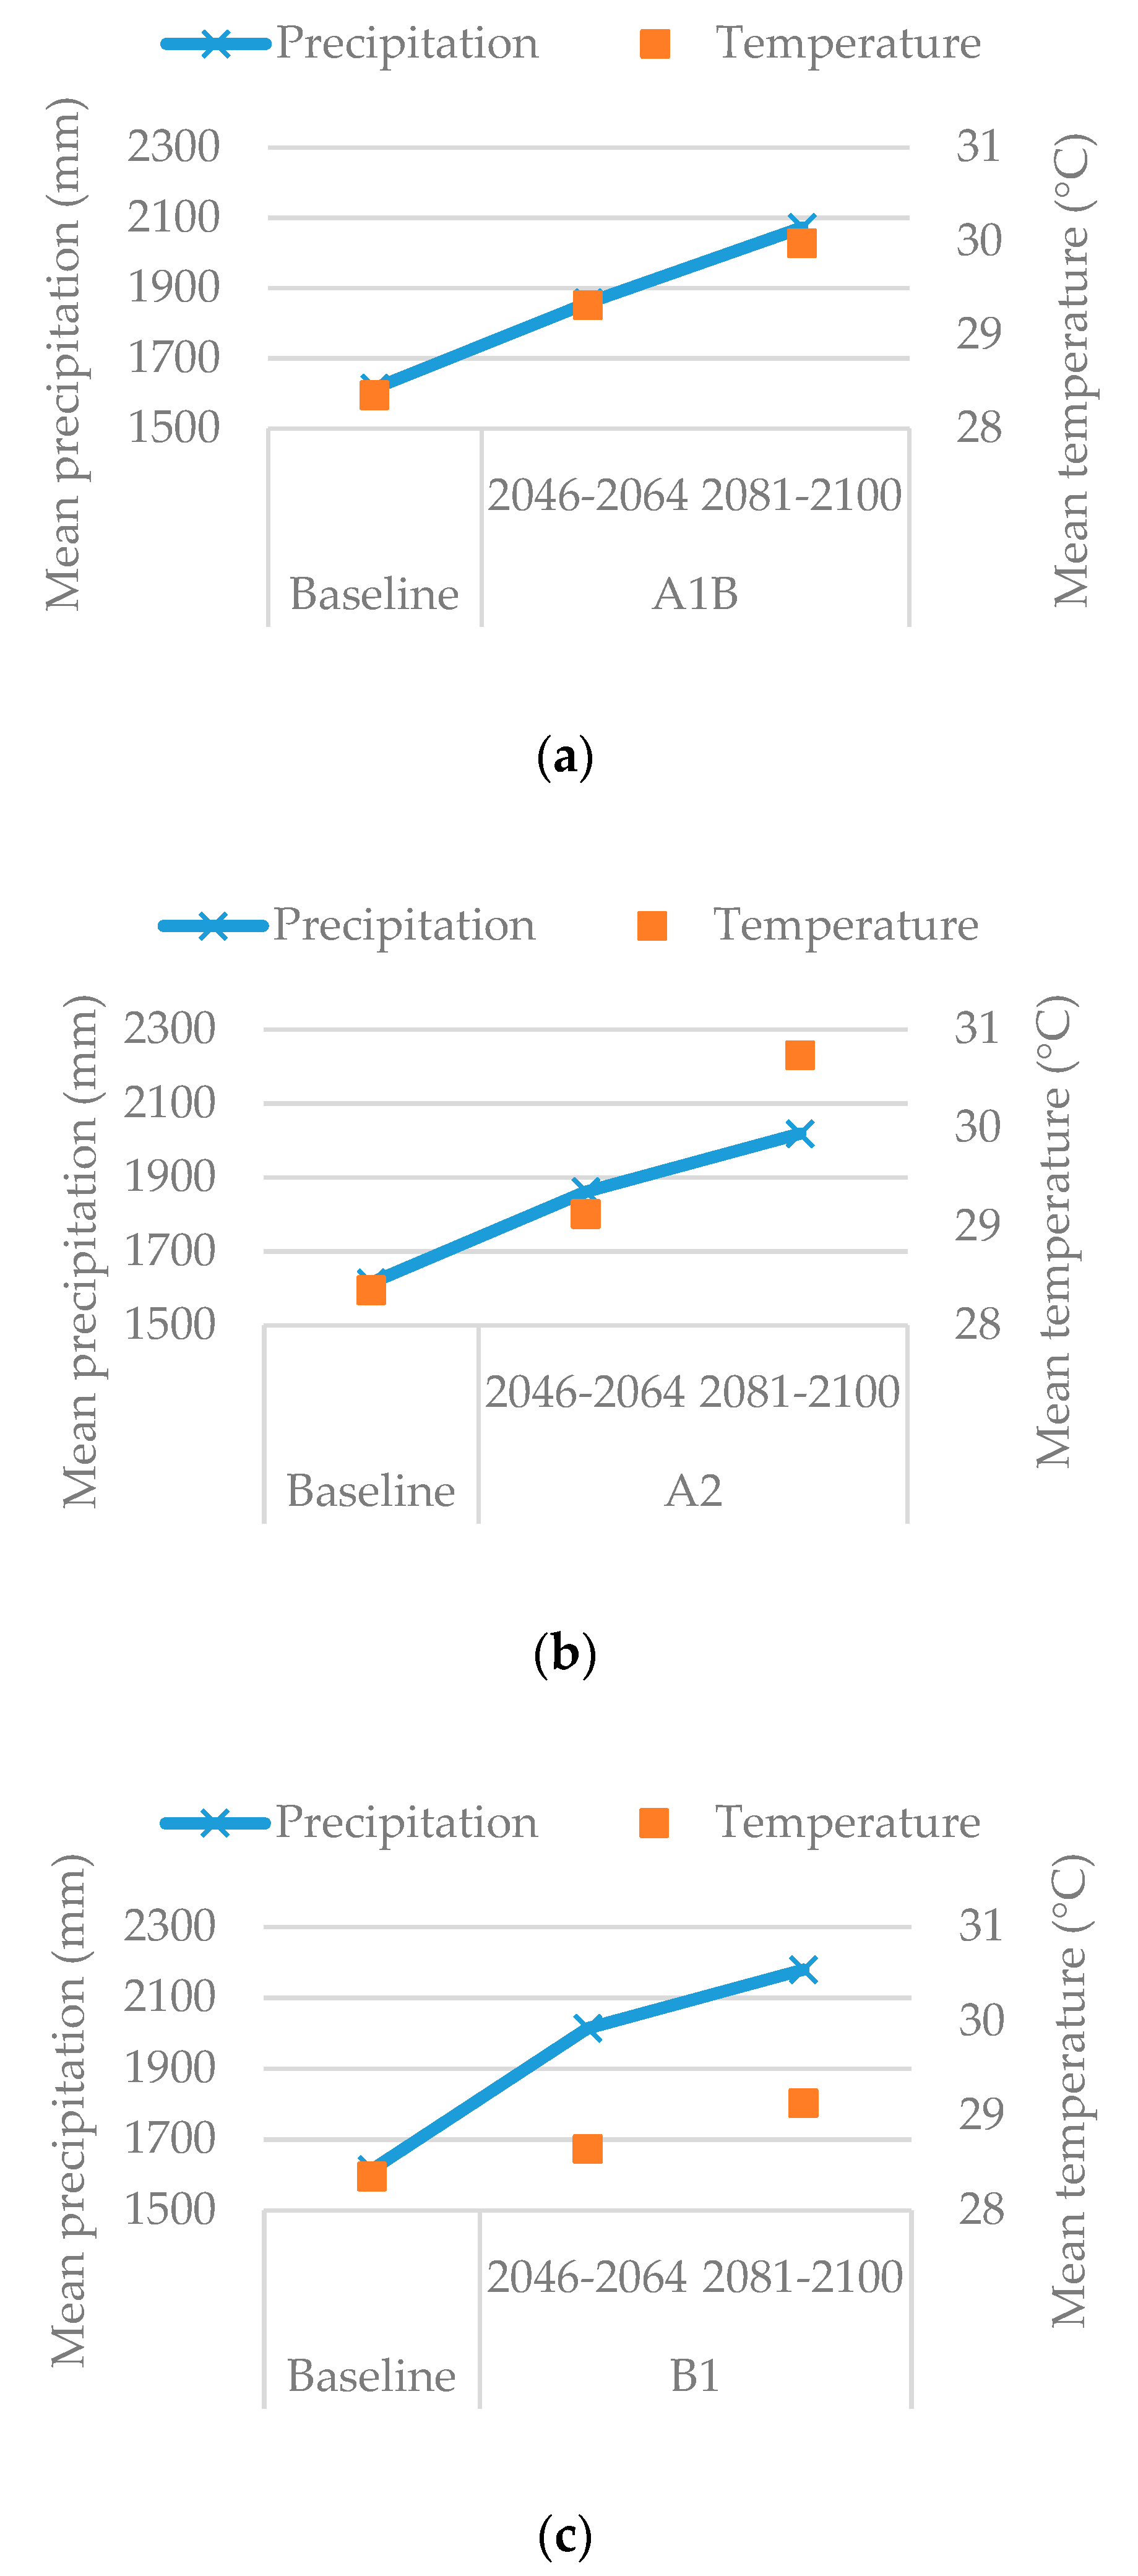
2.4. Baseline and Climate Change Projections

Six daily weather parameters are used in EPIC: maximum and minimum temperature, precipitation, relative humidity, wind speed, and solar radiation. These parameters can be either input directly or generated internally in the model. In this study, the baseline climatic conditions were derived from historical data from 1994 to 2013. All input daily weather parameters for the period 1994 to 1999 were obtained from the CFSR data [48]. The daily minimum and maximum air temperature, relative humidity and precipitation data for the period 2000 to 2013 were obtained from MWRM [47]. Daily solar radiation and wind speed were downloaded from the CFSR data and incorporated into the MWRM station data, after a data quality and consistency check [50].
The projected daily weather data that included all six parameters were downloaded from the downscaled General Circulation Models (GCM) simulations (CMIP3), developed by the Nature Conservancy for the World Bank [64]. These GCM projection daily outputs were only available for selected time periods, such as mid-century (2046 to 2064), rather than for extended time periods (e.g., entire twenty-first century). These data also did not include projected future CO2 changes, which required using a constant atmospheric CO2 concentration throughout the analyses.
The outputs of eight available GCMs were downloaded, which included selected future climate projection periods but did not include baseline (contemporary climate) projections. The average monthly precipitation of the future projections was compared with the baseline climate record, to ascertain which GCMs most accurately replicated the historical monsoonal precipitation patterns. The outputs of GFDL CM2.1 were selected because the total monthly precipitation and overall precipitation patterns most closely replicated baseline precipitation characteristics (Figure 2). Two time horizons were chosen to analyze for the GFDL CM2.1 climate change projections: (1) 2046 to 2064, which represents mid-century climate, and (2) 2081 to 2100, which represents late-century climate. Three emission scenarios, A2, A1B and B1, were chosen among those included in the Intergovernmental Panel on Climate Change CMIP3 emission scenarios [65]. The A2 scenario has the greatest greenhouse gas emission, followed by A1B and B1 [66]. These three climate projections generated by the GFDL CM2.1 model were used to create the future weather scenario input files required by the EPIC model.
The late-century climate is characterized by more severe climate change than the corresponding mid-century period. In particular, the late-century climate manifested higher precipitation from May to August and increased average temperatures of about 0.5, 0.7 and 1.6 °C, for B1, A1B and A2, respectively, compared to the mid-century climate (Figure 2). The B1 scenario consistently resulted in the least projected temperature change, while the greatest increase in average temperatures occurred for the A1B scenario during the mid-century climate (1.1 °C), and for the A2 scenario during the late-century climate (2.5 °C). Peak average monthly temperature increases of up to 3.8 °C during the dry months were also found for the A2 scenario during the late-century climate.
The lack of complete century-long climate records for the baseline and climate projection scenarios posed a limitation regarding evaluating the long-term impacts of the climate interaction with the cropping systems (Table 1) on SOC and crop yields. Thus, synthetic 100-year climate records were created by repeating the 20-year baseline and 20-year climate scenarios for five successive 20-year periods. It is recognized that these 100-year records do not reflect actual 100-year projected climate trends generated by the GFDL CM2.1 model for the A2, A1B and B1 scenarios; i.e., in actuality the climate trends would begin with baseline conditions and then gradually shift to mid-century and ultimately late-century conditions. However, this approach allowed a basis of comparing the cropping system SOC and crop yield impacts between the historical baseline climate and the two future climate conditions over a 100-year period.

3. Results and Discussion

3.1. Climate Change and Management Practice Effects on Crop Yields

In comparison to the baseline climate, the predicted future yields were generally highest during the first 20-year simulation for mid-century climate conditions (Figure 3) and, conversely, the lowest during the complete 100-year simulation of the late-century climate (Figure 4). The B1 scenario consistently resulted in the highest yields, with the greatest average estimated yield increases of 12% for upland rice in all treatments, 11% for soybean with CT and CA1 treatments, and 16% for cassava in combination with the CA1 treatment during the first 20 years for projected mid-century climate conditions (Figure 3a). This result is likely due to an average precipitation increase of about 400 mm per year and small average temperature increase (<0.5 °C) for the mid-century climate scenario, relative to the baseline scenario. The increase in precipitation resulted in beneficial effects to all of the simulated plants because all of the cropping systems are rainfed. In contrast, the greatest predicted yield reduction for all of the primary crops was due to the A2 scenario with late-century climate during the 100-year simulation (Figure 4a). The high temperatures predicted within the A2 scenario apparently negatively impacted yields of all crops in this tropical region. Ray et al. [67] analyzed current global weather conditions and found that more than 60% of maize, rice, wheat and soybean yield variation can be explained by climate variability. The authors further stated that 32% of rice yield variability globally can be explained by year-to-year climate variability, specifically due to precipitation in South Asia and temperature in Southeast and East Asia.
The highest maize yields consistently occurred within the simulated upland rice cropping systems in all climate conditions as compared to maize grown within the soybean and cassava cropping systems. The highest mean maize yield (4.9 t ha−1) over the 100-year period was predicted within the rice cropping systems, followed by maize in the soybean systems (4.3 t ha−1) and cassava cropping systems (4.0 t ha−1). During the first 20 years, the predicted maize yield increased by 8% within the rice and cassava systems, and 6% within the soybean systems, in response to all of the mid-century climate change scenarios (Figure 3b). The greatest predicted increased maize yield (10%) within the first 20 years that occurred within the B1 scenario in the mid-century climate was higher than the increase estimated in other studies [42,44,68]. However, the predicted overall mean maize yields over the entire 100-year simulation decreased within the respective rice, soybean and cassava cropping systems by 9%, 20% and 26% in response to the mid-century climate conditions and by 16%, 26% and 33% due to the late-century climate conditions (Figure 4b).
Similar negative impacts of climate change on maize yield in Central Italy were also found by Farina et al. [44] based on EPIC simulations performed to assess the influence of climate change on crop productivity and SOC dynamics. Similarly, Xiong et al. [42] used the EPIC model and predicted a reduction of global maize yield by 4 to 10% in the mid-century climate and 6 to 30% in the late-century climate in response to severe climate change. Predicted increased future temperatures have also been found to cause shortened crop growth cycles, decreased radiation interception and CO2 assimilation, which in turn resulted in reduced biomass and yields [44,69]. This may have been due to the inability to account for increasing atmospheric CO2 concentrations in this study.
The EPIC simulations also showed that the management practices impacted primary crop yields differently within the projected future climate change scenarios, as compared with the baseline during the first 20 years. Upland rice yields were found to increase by 7% on average for all scenarios in the mid-century climate, but decreased by 7% due to the late-century climate effects, for both CA and CT treatments (Figure 3a). The average soybean yields were predicted to increase by 6% for continuous soybean (CT and CA1 treatments) and 3% for soybean rotated with maize (CA2&3), due to the mid-century climate conditions. However, the estimated average soybean yields decreased by 5% and 8% for continuous soybean and rotated soybean (maize), in response to the late-century climate. The mean cassava yield increased the most in the CA1 (11%), followed by CA2&3 (4%) and CT treatments (1%), when simulated within the mid-century climate. These findings are consistent with those reported by Fasinmirin and Reichert [70], who found that NT with mulch residue produced higher cassava yield than tilled treatments. All of the average predicted cassava yields decreased due to the effects of the late-century climate scenarios, with the smallest yield reduction occurring within the CA1 treatment (13%) versus the greatest yield reduction within the CT management (18%). These results suggest that CA could help stabilize crop yields in potential future severe weather conditions for the clay soil simulated in this study. In general, the CA2&3 treatments resulted in 1% higher upland rice yield and 3% lower soybean yield, versus the continuous primary crop (CT and CA1 treatments) during the first 20 years of simulation. The CA1 treatment resulted in approximately 7 and 10% higher cassava yield as compared to the CA2&3 and CT treatments, respectively, during the same time period.
During the overall 100-year simulation, the CA2&3 rice, soybean and cassava cropping systems were predicted to result in weaker average yields relative to most of the CA1 and CT treatment yields (Figure 4a). The CA2&3 treatments resulted in about 3% lower upland rice yield than the CT and CA1 treatments. Similar results were found for the estimated cassava yields within the CA2&3 treatments, which were 2% and 11% lower than the cassava yields estimated for the respective CA1 and CT treatments. However, the CA2&3 treatments were predicted to provide 4% higher and 6% lower soybean yields relative to the CA1 and CT treatments, indicating that the CA2&3 treatment approach could be beneficial for soybean production within some conditions of projected future climate. In our simulation for the more severe late-century climate change conditions, upland rice showed the lowest yield reduction followed by soybean and then cassava. This would indicate that the rice cropping systems investigated here would perform in a more stable manner versus the simulated soybean and cassava cropping systems, when stressed by projected future climate shifts.

3.2. Other Effects on Crop Yields

The predicted yield reduction for the CA treatments as compared to the CT treatments during the 100-year simulation was most likely due to more severe phosphorus stress that occurred within the CA treatments during the final 30 years of the simulation across all of the cropping systems and climate scenarios. In addition, the amount of fertilizer applied each year was fixed for the 100-year simulations and based on the 5-year management of the experimental site, which likely led to inadequate amounts of phosphorus being applied to each crop. This phosphorus fertilization scheme was used due to current limitations in the EPIC auto-phosphorus fertilization routine; use of that routine can result in over-application of phosphorus because the model does not provide constraints on the maximum level of phosphorus that is applied. The most severe phosphorus stress levels were simulated for the cassava and soybean cropping systems, relative to the rice cropping systems. The phosphorus requirements for cassava are also greater than the respective phosphorus needs of soybean and upland rice, because cassava is a root crop and is harvested after 10 to 11 months. Thus, cassava is even more susceptible to phosphorus stress than the other primary crops. Overall, the CA2&3 treatments had greater phosphorus stress than the CA1 treatments. Different types of cover crops were planted in the CA2&3 treatments and the primary crops were rotated with maize; thus, the same amount of phosphorus applied might not meet the needs of all the crops. Also, it is possible that too much biomass accumulated in the CA2&3 treatments could lead to nutrient imbalances of nitrogen or phosphorus, which was also reported by Patrick et al. [71].

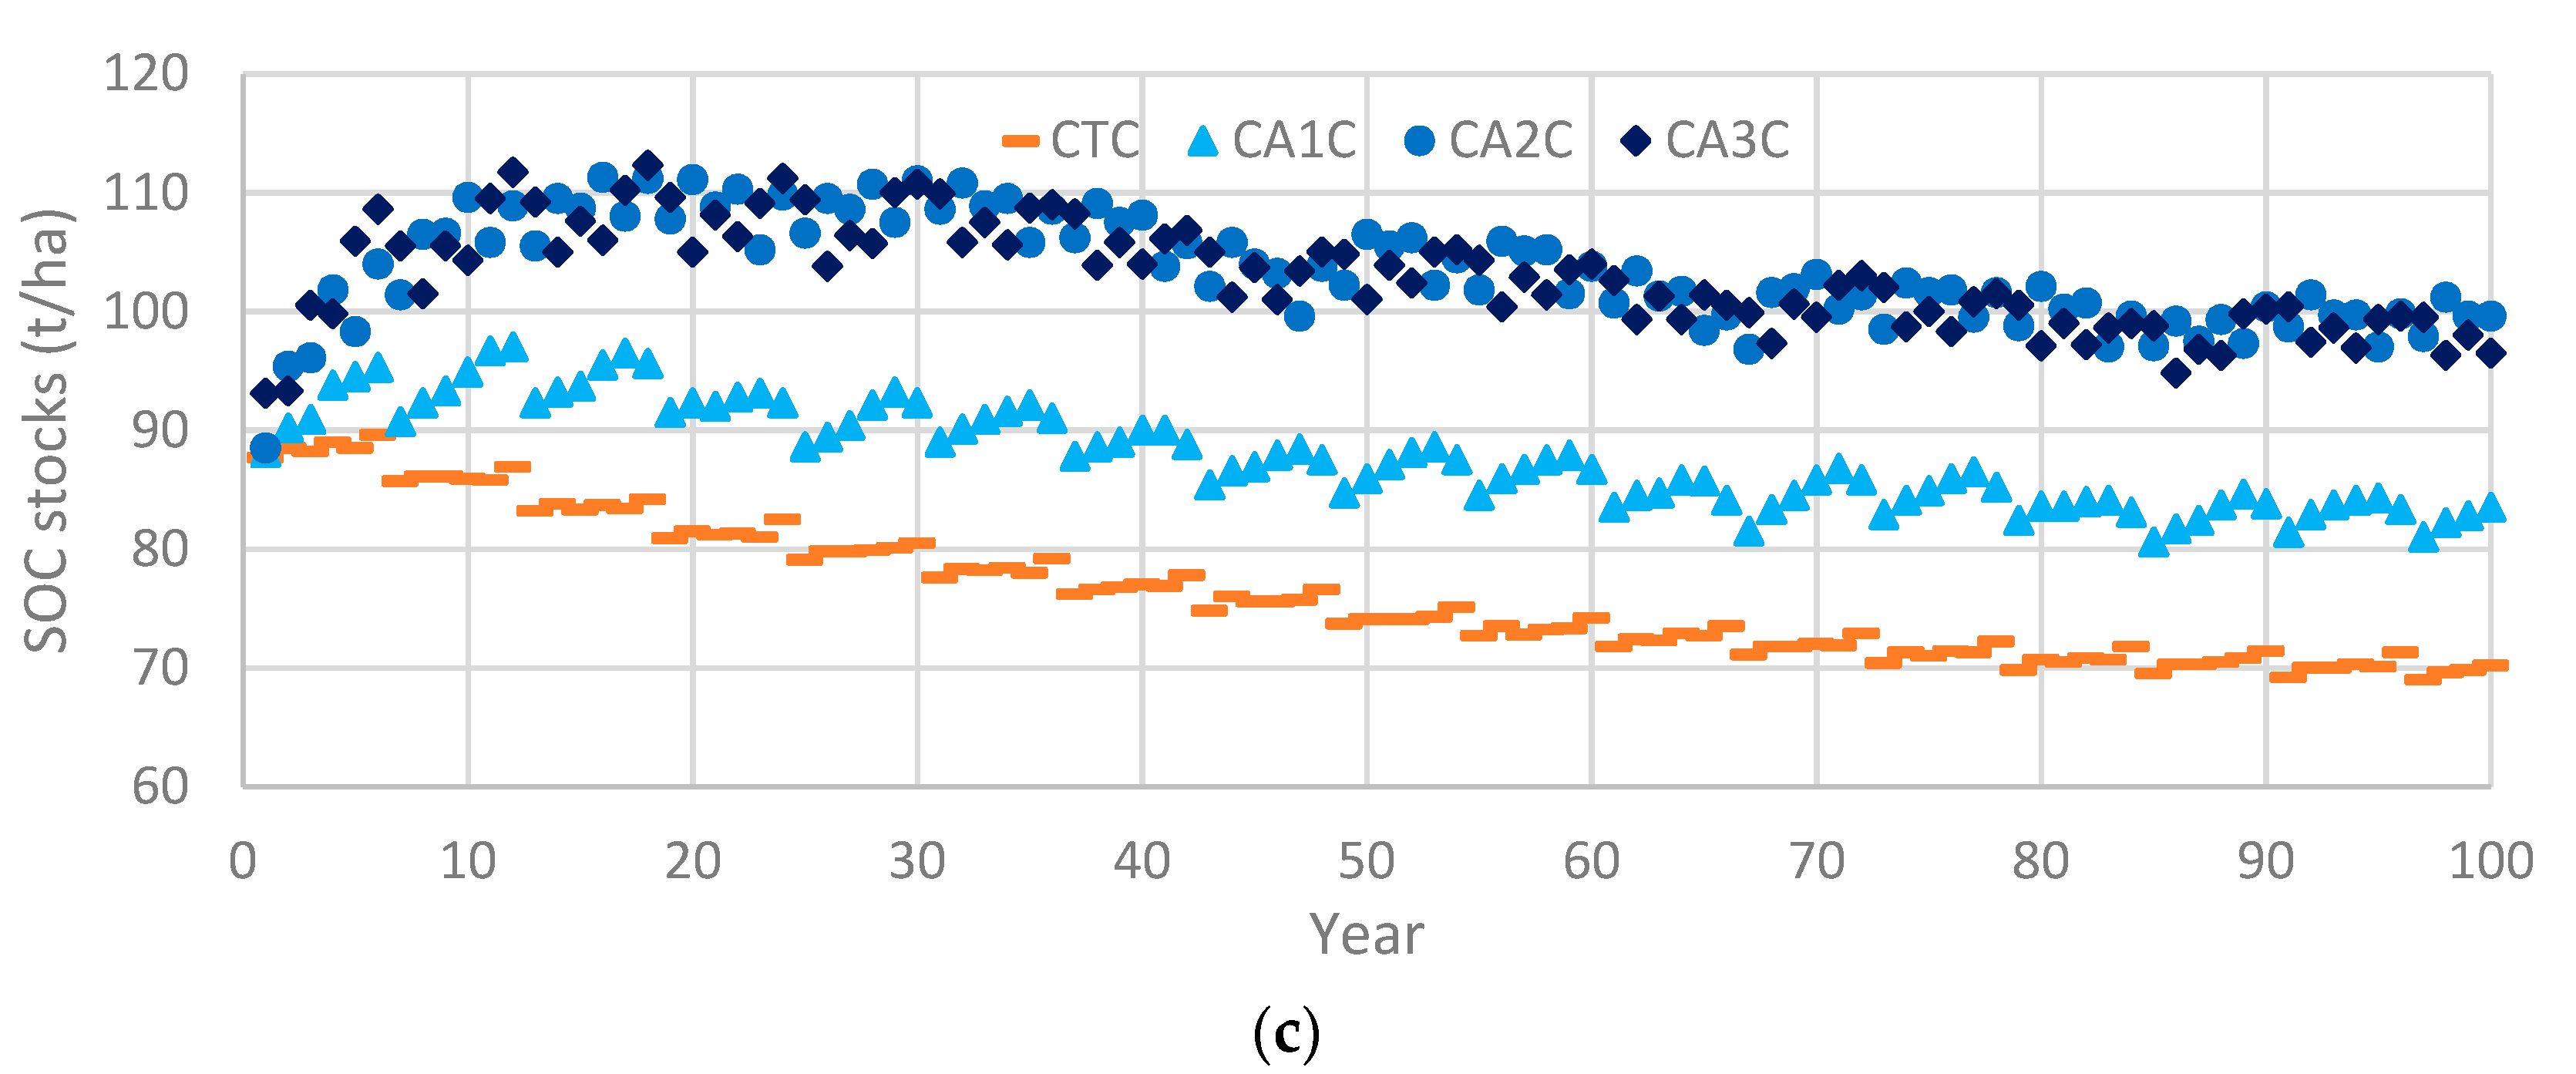
3.3. Climate Change and Management Practice Effects on SOC Stocks

Management practices and crop rotation affected SOC more than climate change. The SOC stocks (0–100 cm depth) were greatest for the rotated primary crop (maize) CA2&3 treatments, followed by the continuous primary crop CA1 and CT treatments for all of the cropping systems (Figure 5). The CA2&3 treatments sequestered about 13 and 40 Mg C ha−1 more than the CA1 and CT treatments, respectively, for the rice cropping systems (Figure 5a). The total annual predicted SOC stocks of the soybean systems contained about 7 and 25 Mg ha−1 more SOC for the CA2&3 treatments as compared to the CA1 and CT treatments, respectively (Figure 5b). Similarly, the long-term cassava system simulations indicated that the CA2&3 treatments accumulated 15 and 27 Mg C ha−1 more SOC versus the CT and CA1 treatments, respectively (Figure 5c). Crop diversification in the CA2&3 systems has the potential to accumulate more SOC than continuous cropping systems as demonstrated in this study. Thierfelder et al. [72] also found that crop rotation and legume inter-cropping could increase SOC, yield, soil moisture and infiltration. Powlson et al. [20] performed a meta-analysis of 47 studies in the tropics and found that cropping systems that are characterized by CA (with the three McD principles) can result in greater amounts of SOC relative to CT-based cropping systems. Powlson et al. [20] explained that CA with crop diversification could improve SOC sequestration levels by increasing photosynthesis and thus increasing C transferred from atmosphere to soil.
The Mann–Kendall Trend Analysis [73,74] showed that SOC stocks up to 100 cm depth (Figure 5) significantly increased only for the CA1R and CA3R treatments, had no trend for the CA2R treatment, and significantly decreased for the rest of the treatments during the 100-year simulation. However, during the first 20 years, SOC stocks significantly decreased for all CT treatments and significantly increased for all CA treatments, except the CA1C treatment with no trend.
Our comparisons between the initial SOC and the average SOC sequestered during the 100-year baseline climate simulations consistently showed that the CA2&3 treatments accumulated the most SOC while CT consistently lost SOC (Figure 6). Overall, the rice cropping systems accumulated the most SOC for the long-term baseline climate; the CA2&3 and CA1 treatments sequestered 14 and 29% more SOC over the 100-year period. The simulated soybean CA1 and CA2&3 treatments resulted in increased long-term SOC levels of 1% and 8%, respectively. In contrast, the predicted average SOC increased by 14% for the CA2&3 treatments and diminished by 3% in the CA1 treatments for the long-term cassava systems. In contrast, the average SOC over the 100-year simulation period consistently decreased by 18%, 19% and 16% in upland rice, soybean and cassava cropping systems, respectively, for the CT treatments (Figure 6). Overall, the rice cropping systems accumulated the most SOC (25% on average), while the cassava and soybean systems released SOC by an average of 4% and 10%, respectively.
To evaluate the impact of climate change on SOC cycling, we compared the percentage of SOC change during the first 20 years versus the entire 100-year simulation period (Figure 7) for each climate scenario relative to baseline climate conditions. The results consistently showed that when there was no phosphorus stress, the implementation of CA-based cropping systems resulted in predicted increased SOC. However, the adoption of CT treatments generally resulted in decreased SOC levels, especially in the context of more severe late-century climate change conditions. In general, all of the predicted SOC changes due to climate change impacts were ≤4.5%. This finding once again confirmed that the management practices and crop rotations would influence SOC sequestration more than current projected climate change at the PAMPA site, which is consistent with several previous studies [44,75,76]. The overall effects of climate change on SOC were essentially negligible across all of the simulated cropping systems.
Several limitations need to be considered regarding the simulation experiments reported here. First, the 100-year simulations were compiled using fixed 20-year weather sequences for all climate scenarios, which does not reflect typical projected long-term climate patterns. Second, a fixed CO2 default value was used for all simulations. Third, a fixed 5-year management period was repeated throughout the 100-year simulation, which ignored potential future cropping system adaptations due to projected shifts in climate, as well as possible market price shifts that might affect crop choice and crop rotation.

4. Conclusions

Cropping management was the key factor that influenced increased SOC. CA practices with maize rotation should be promoted for Cambodian tropical systems because of the greater potential SOC sequestration that can occur as compared to CT systems. Soil tests should be taken to determine the amount of fertilizer needed, which should be adjusted accordingly to ensure improved crop biomass and yield production. Cover crops should also be fertilized when needed to maintain full biomass coverage for the CA systems and sufficient nutrients for the main crops.
Moreover, because the results obtained from this work pointed out that the possible climate change represented by the A2 scenario can lead to the largest yield reduction for the main crops, adaptation strategies should be investigated in order to provide farmers the possibility to reduce the negative impact of the climate change and keep the crop yield stable.

Author Contributions

Conceptualization, K.N.L. and M.R.R.; Methodology, K.N.L., M.K.J., M.R.R. and D.Q.T.; Software, K.N.L., J.J. and L.D.; Validation, K.N.L., J.J. and L.D.; Formal Analysis, K.N.L. and D.Q.T.; Investigation, K.N.L.; Resources, K.N.L., M.R.R. and L.H.; Data Curation, K.N.L.; Writing-Original Draft Preparation, K.N.L. and D.Q.T.; Writing-Review & Editing, K.N.L., P.W.G., M.K.J., L.D., D.Q.T., M.R.R. and L.H.; Visualization, K.N.L. and M.R.R.; Supervision, M.K.J., M.R.R. and J.J.; Project Administration, M.R.R.; Funding Acquisition, M.R.R.

Funding

This research is made possible by the generous support of the American people through support by the United States Agency for International Development Feed the Future Innovation Labs for Collaborative Research on: Sustainable Intensification (Cooperative Agreement No. AID-OAA-L-14-00006, Kansas State University), and Sustainable Agriculture and Natural Resources Management (Cooperative Agreement No. EPP-A-00-04-00013-00, Virginia Tech); and USDA NIFA (SPECA, 1890 Capacity Building Grant, NCSU, and Evans-Allen). The contents are the sole responsibility of the authors and do not necessarily reflect the views of USAID, USDA or the United States Government. Input data and experimental information are also supported by grants from the PAMPA, French Agency for Development, Ministry of Foreign affairs and French Global Environment Funds. We are grateful for Dr. Keith Schimmel, Energy and Environmental Systems program director for financial support as well.

Acknowledgments

We would like to thank the General Directorate of Agriculture (GDA) of the Ministry of Agriculture, Forestry and Fisheries of the Royal Government of Cambodia for providing logistic support and long-term land allocation for this experimental site. We would like to thank Stéphane Boulakia, Rada Kong and Vira Leng for providing technical support for the plot management to input into the EPIC model.

Conflicts of Interest

The founding sponsors had no role in the design of the study; in the collection, analyses, or interpretation of data; in the writing of the manuscript, and in the decision to publish the results.

Appendix A

Table A1. Initial soil properties (2009) used for EPIC soil input at PAMPA site.
Main CropDepth (cm)pHBD (g cm−3)C.E.C. (cmol kg−1)P (g t−1)K+ (g t−1)WOC * (%)WN * (g t−1)Sand (%)Silt (%)Rock (%)
Upland Rice0–105.31.1738763501.4016160.129.41.0
10–205.31.2435712111.3115170.127.60.9
20–405.41.1629691760.8411390.124.90.7
40–1004.51.1223621160.517620.122.40.6
Soybean0–105.21.2427844031.4017180.129.91.3
10–205.31.2626792731.3815250.129.11.2
20–405.31.2223762090.8510200.126.00.7
40–1004.51.1124691170.547730.121.60.6
Cassava0–105.31.229953641.4015540.228.51.1
10–205.31.2330912381.3815260.127.30.9
20–405.31.2325911850.9112580.125.30.7
40–1004.51.0826831260.548520.121.00.6
Note. BD: bulk density; C.E.C.: cation exchange capacity was determined by summation of potential acidity and exchangeable bases (Ca+, Mg+, K+); P: initial labile phosphorus; K+: exchangeable potassium; g t−1—gram per tonnes; WOC—organic carbon concentration; WN—initial organic nitrogen concentration; * parameter calibrated via initialization simulations to obtain the desired initial SOC, the rest were obtained from soil test in 2009; obtained from Hok et al. [49] and modified by [53].
Table A2. Annual mineral fertilizer rates applied to crops during the five-year experimented period (2009–2013) at PAMPA site.
Elemental FertilizerMain CropsAnnual Fertilization (kg ha−1)
20092010 to 2013
Phosphorus (P)All crops3514
Nitrogen (N)Upland Rice
Soybean
Cassava
Maize
69
23
92
92
46
23
69
69
Potassium (K)Upland Rice
Soybean
Cassava
Maize
75
75
75
75
25
50
75
25
P: elemental phosphorus from thermo phosphate (i.e., 16% P2O5, 31% CaO, and 16% MgO); N: elemental nitrogen from urea (46% N); K: elemental potassium from KCl (60% K2O).

References

  1. Dyoulgerov, M.; Bucher, A.; Zermoglio, F.; Forner, C. Climate risk and adaptation country profile: Cambodia. In Solomon Islands: Vulnerability, Risk Reduction and Adaptation to Climate Change. Global Facility for Disaster Reduction and Recovery; The World Bank Group: Washington, DC, USA, 2011. [Google Scholar]
  2. Worldstat. Cambodia. Available online: http://en.worldstat.info/Asia/Cambodia/Land (accessed on 30 February 2017).
  3. USAID. Cambodia Agriculture and Food Security. Available online: https://www.usaid.gov/cambodia/agriculture-and-food-security (accessed on 10 May 2018).
  4. Thomas, T.S.; Ponlok, T.; Bansok, R.; Lopez, T.D.; Chiang, C.; Phirun, N.; Chhun, C. Cambodian Agriculture: Adaptation to Climate Change Impact; International Food Policy Research Institute (IFPRI): Washington, DC, USA, 2013. [Google Scholar]
  5. Pheav, S. Land use and land degradation situation in Cambodia, and possible solutions. In Proceedings of the MARCO-FFTC Joint International Seminar on Management and Remediation Technologies of Rural Soils Contaminated by Heavy Metals and Radioactive Materials, Food and Fertilizer Technology Center (FFTC), Taichung, Taiwan, 22–26 September 2014; pp. 175–204. [Google Scholar]
  6. Guttal, S. New and old faces of hunger: Cambodia, Timor Leste, and food crises. Review 2009, 32, 61–89. [Google Scholar]
  7. Saing, C.H.; Hem, S.; Ouch, C. Foreign Investment in Agriculture in Cambodia; CDRI Working Paper Series No. 60; CDRI: Phnom Penh, Cambodia, 2012. [Google Scholar]
  8. Ministry of Environment. Cambodia National Adaptation Programme of Action (NAPA) Official Document—October 2006; Ministry of Environment: Phnom Penh, Cambodia, 2006; p. 125.
  9. Wight, E. Droughts, Flooding, Disease: The Reality of a Cambodia That Has Been Hit by Climate Change. Available online: https://www.phnompenhpost.com/7days/droughts-flooding-disease-reality-cambodia-has-been-hit-climate-change (accessed on 29 July 2018).
  10. NCCC. Cambodia Climate Change Strategic Plan 2014–2023 by National Climate Change Committee (NCCC); Royal Government of Cambodia: Phnom Penh, Cambodia, 2013; p. 42.
  11. FAO. What Is Conservation Agriculture? Available online: http://www.fao.org/ag/ca/1a.html (accessed on 15 February 2014).
  12. Boulakia, S.; Chabierski, S.; Kou, P.; San, S.; Kong, R.; Leng, V.; Sar, V.; Chhit, K.; Séguy, L. Conservation agriculture as an alternative to plough-based cassava cropping in the upland borders of kampong Cham, Cambodia: Preliminary results of extension. In Proceedings of the 3rd International Conference on Conservation Agriculture in Southeast Asia, Hanoi, Vietnam, 10–15 December 2012; p. 282. [Google Scholar]
  13. Zhang, X.; Li, H.; He, J.; Wang, Q.; Golabi, M.H. Influence of conservation tillage practices on soil properties and crop yields for maize and wheat cultivation in Beijing, China. Soil Res. 2009, 47, 362–371. [Google Scholar] [CrossRef]
  14. Hilger, T.; Keil, A.; Lippe, M.; Panomtaranichagul, M.; Saint-Macary, C.; Zeller, M.; Pansak, W.; Vu Dinh, T.; Cadisch, G. Soil conservation on sloping land: Technical options and adoption constraints. In Sustainable Land Use and Rural Development in Southeast Asia: Innovations and Policies for Mountainous Areas; Fröhlich, H.L., Schreinemachers, P., Stahr, K., Clemens, G., Eds.; Springer: Berlin, Germany, 2013; pp. 229–279. [Google Scholar]
  15. Doanh, L.Q.; Tuan, H.D. Conservation agriculture on sloping lands in northern mountainous regions of Vietnam. In Proceedings of the Regional Workshop on Conservation Agriculture, Phonsavan, Laos, 28 October–1 November 2008; pp. 27–36. [Google Scholar]
  16. Van Pelt, R.S.; Hushmurodov, S.X.; Baumhardt, R.L.; Chappell, A.; Nearing, M.A.; Polyakov, V.O.; Strack, J.E. The reduction of partitioned wind and water erosion by conservation agriculture. Catena 2017, 148, 160–167. [Google Scholar] [CrossRef]
  17. Prosdocimi, M.; Tarolli, P.; Cerdà, A. Mulching practices for reducing soil water erosion: A review. Earth-Sci. Rev. 2016, 161, 191–203. [Google Scholar] [CrossRef]
  18. Putte, A.; Govers, G.; Diels, J.; Gillijns, K.; Demuzere, M. Assessing the effect of soil tillage on crop growth: A meta-regression analysis on european crop yields under conservation agriculture. Eur. J. Agron. 2010, 33, 231–241. [Google Scholar] [CrossRef]
  19. Govaerts, B.; Verhulst, N.; Castellanos-Navarrete, A.; Sayre, K.D.; Dixon, J.; Dendooven, L. Conservation agriculture and soil carbon sequestration: Between myth and farmer reality. Crit. Rev. Plant Sci. 2009, 28, 97–122. [Google Scholar]
  20. Powlson, D.S.; Stirling, C.M.; Thierfelder, C.; White, R.P.; Jat, M.L. Does conservation agriculture deliver climate change mitigation through soil carbon sequestration in tropical agro-ecosystems? Agric. Ecosyst. Environ. 2016, 220, 164–174. [Google Scholar] [CrossRef]
  21. Dusserre, J.; Raveloson, H.; Michellon, R.; Gozé, E.; Auzoux, S.; Sester, M. Conservation agriculture cropping systems reduce blast disease in upland rice by affecting plant nitrogen nutrition. Field Crop. Res. 2017, 204, 208–221. [Google Scholar] [CrossRef]
  22. Verhulst, N.; Govaerts, B.; Verachtert, E.; Castellanos-Navarrete, A.; Mezzalama, M.; Wall, P.; Deckers, J.; Sayre, K.D. Conservation agriculture, improving soil quality for sustainable production systems. In Advances in Soil Science: Food Security and Soil Quality; CRC Press: Boca Raton, FL, USA, 2010; pp. 137–208. [Google Scholar]
  23. Hok, L.; de Moraes Sá, J.C.; Reyes, M.; Boulakia, S.; Tivet, F.; Leng, V.; Kong, R.; Briedis, C.; da Cruz Hartman, D.; Ferreira, L.A.; et al. Enzymes and c pools as indicators of c build up in short-term conservation agriculture in a savanna ecosystem in cambodia. Soil Tillage Res. 2018, 177, 125–133. [Google Scholar] [CrossRef]
  24. Lal, R. Sequestering carbon and increasing productivity by conservation agriculture. J. Soil Water Conserv. 2015, 70, 55A–62A. [Google Scholar] [CrossRef]
  25. Lal, R.; Delgado, J.; Groffman, P.; Millar, N.; Dell, C.; Rotz, A. Management to mitigate and adapt to climate change. J. Soil Water Conserv. 2011, 66, 276–285. [Google Scholar] [CrossRef] [Green Version]
  26. Demessie, A.; Singh, B.R.; Lal, R. Soil carbon sequestration: Ethiopia. In Encyclopedia of Soil Science, 3rd ed.; Lal, R., Ed.; Taylor & Francis: Oxford, UK, 2017; Volume III, pp. 2066–2072. [Google Scholar]
  27. Ella, V.B.; Reyes, M.R.; Mercado, A., Jr.; Ares, A.; Padre, R. Conservation agriculture increases soil organic carbon and residual water content in upland crop production systems. Eurasian J. Soil Sci. 2016, 5, 24–29. [Google Scholar] [CrossRef]
  28. de Moraes Sá, J.C.; Lal, R.; Cerri, C.C.; Lorenz, K.; Hungria, M.; de Faccio Carvalho, P.C. Low-carbon agriculture in south America to mitigate global climate change and advance food security. Environ. Int. 2017, 98, 102–112. [Google Scholar]
  29. Bhattacharyya, R.; Kundu, S.; Pandey, S.C.; Singh, K.P.; Gupta, H.S. Tillage and irrigation effects on crop yields and soil properties under the rice–wheat system in the Indian Himalayas. Agric. Water Manag. 2008, 95, 993–1002. [Google Scholar] [CrossRef]
  30. Naresh, R.K.; Singh, S.P.; Dwivedi, A.; Sepat, N.K.; Kumar, V.; Ronaliya, L.K.; Kumar, V.; Singh, R. Conservation agriculture improving soil quality for sustainable production systems under smallholder farming conditions in north west India: A review. Int. J. Life Sci. Biotechnol. Pharm. Res. 2013, 2, 151–213. [Google Scholar]
  31. Paudel, M.; Sah, S.K.; McDonald, A.; Chaudhary, N.K. Soil organic carbon sequestration in rice-wheat system under conservation and conventional agriculture in western Chitwan, Nepal. World J. Agric. Res. 2014, 2, 1–5. [Google Scholar] [CrossRef]
  32. Lal, R. Enhancing crop yields in the developing countries through restoration of the soil organic carbon pool in agricultural lands. Land Degrad. Dev. 2006, 17, 197–209. [Google Scholar] [CrossRef]
  33. Palm, C.; Blanco-Canqui, H.; DeClerck, F.; Gatere, L.; Grace, P. Conservation agriculture and ecosystem services: An overview. Agric. Ecosyst. Environ. 2014, 187, 87–105. [Google Scholar] [CrossRef] [Green Version]
  34. Kurkalova, L.A.; Tran, D.Q. Is the use of no-till continuous or rotational? Quantifying tillage dynamics from time-ordered spatially aggregated data. J. Soil Water Conserv. 2017, 72, 131–138. [Google Scholar] [CrossRef]
  35. Conant, R.T.; Easter, M.; Paustian, K.; Swan, A.; Williams, S. Impacts of periodic tillage on soil c stocks: A synthesis. Soil Tillage Res. 2007, 95, 1–10. [Google Scholar] [CrossRef]
  36. Han, P.; Zhang, W.; Wang, G.; Sun, W.; Huang, Y. Changes in soil organic carbon in croplands subjected to fertilizer management: A global meta-analysis. Sci. Rep. 2016, 6, 27199. [Google Scholar] [CrossRef] [PubMed]
  37. Williams, J.R.; Jones, C.A.; Dyke, P.T. The epic model and its application. In Proceedings of the International Symposium on Minimum Data Sets for Agrotechnology Transfer, Patancheru, India, 21–26 March 1983; pp. 111–121. [Google Scholar]
  38. Rinaldi, M.; Luca, D.D. Application of epic model to assess climate change impact on sorghum in southern Italy. Ital. J. Agron. 2012, 7, 74–85. [Google Scholar] [CrossRef]
  39. Niu, X.; Easterling, W.; Hays, C.J.; Jacobs, A.; Mearns, L. Reliability and input-data induced uncertainty of the epic model to estimate climate change impact on sorghum yields in the U.S. Great plains. Agric. Ecosyst. Environ. 2009, 129, 268–276. [Google Scholar] [CrossRef]
  40. Bhattarai, M.D.; Secchi, S.; Schoof, J. Projecting corn and soybeans yields under climate change in a corn belt watershed. Agric. Syst. 2017, 152, 90–99. [Google Scholar]
  41. Strauss, F. Modeling Climate Change and Impacts on Crop Production in Austria Dissertation; University of Natural Resources and Life Sciences: Vienna, Austria, 2012. [Google Scholar]
  42. Xiong, W.; Skalský, R.; Porter, C.H.; Balkovič, J.; Jones, J.W.; Yang, D. Calibration-induced uncertainty of the epic model to estimate climate change impact on global maize yield. J. Adv. Model. Earth Syst. 2016, 8, 1358–1375. [Google Scholar]
  43. Bhattarai, M.D.; Secchi, S.; Schoof, J. An analysis of the climate change mitigation potential through soil organic carbon sequestration in a corn belt watershed. Environ. Manag. 2016, 59, 77–86. [Google Scholar]
  44. Farina, R.; Seddaiu, G.; Orsini, R.; Steglich, E.; Roggero, P.P.; Francaviglia, R. Soil carbon dynamics and crop productivity as influenced by climate change in a rainfed cereal system under contrasting tillage using epic. Soil Tillage Res. 2011, 112, 36–46. [Google Scholar] [CrossRef]
  45. Strauss, F.; Schmid, E.; Moltchanova, E.; Formayer, H.; Wang, X. Modeling climate change and biophysical impacts of crop production in the Austrian Marchfeld region. Clim. Chang. 2012, 111, 641–664. [Google Scholar] [CrossRef]
  46. Arunrat, N.; Pumijumnong, N.; Phinchongsakuldit, A. Estimating soil organic carbon sequestration in rice paddies as influenced by climate change under scenario A2 and B2 of an i-EPIC model of Thailand. EnvironmentAsia 2014, 7, 65–80. [Google Scholar]
  47. MWRM. Weather Data Bought from Ministry of Water Resources and Meteorology (MWRM), Cambodia; Ministry of Water Resources and Meteorology: Phnom Penh, Cambodia, 2016.
  48. GWDS. Global Weather Data for Swat. Available online: http://globalweather.tamu.edu/ (accessed on 2 June 2015).
  49. Hok, L.; de Moraes Sá, J.C.; Boulakia, S.; Reyes, M.; Leng, V.; Kong, R.; Tivet, F.E.; Briedis, C.; Hartman, D.; Ferreira, L.A.; et al. Short-term conservation agriculture and biomass-c input impacts on soil c dynamics in a savanna ecosystem in Cambodia. Agric. Ecosyst. Environ. 2015, 214, 54–67. [Google Scholar] [CrossRef]
  50. Le, K.N. Soil Organic Carbon Modeling with the Epic Model for Conservation Agriculture and Conservation Tillage Practices in Cambodia. Ph.D. Thesis, North Carolina Agricultural and Technical State University, Greensboro, NC, USA, 2017. [Google Scholar]
  51. BREC. Winepic. Available online: http://epicapex.tamu.edu/epic/winepic/ (accessed on 15 March 2014).
  52. Wang, X.; Williams, J.R.; Gassman, P.W.; Baffaut, C.; Izaurralde, R.C.; Jeong, J.; Kiniry, J.R. EPIC and APEX: Model use, calibration, and validation. Trans. ASABE 2012, 55, 1447–1462. [Google Scholar] [CrossRef]
  53. Le, K.N.; Jha, M.K.; Reyes, M.R.; Jeong, J.; Doro, L.; Gassman, P.W.; Hok, L.; de Moraes Sá, J.C.; Boulakia, S. Evaluating carbon sequestration for conservation agriculture and tillage systems in Cambodia using the epic model. Agric. Ecosyst. Environ. 2018, 251, 37–47. [Google Scholar] [CrossRef]
  54. Arunrat, N.; Pumijumnong, N. Evaluation of erosion productivity impact calculator (EPIC) model for nitrogen losses in rice paddy of Thailand. Asian J. Agric. Res. 2014, 8, 70–83. [Google Scholar]
  55. Billen, N.; Röder, C.; Gaiser, T.; Stahr, K. Carbon sequestration in soils of SW-Germany as affected by agricultural management—Calibration of the EPIC model for regional simulations. Ecol. Model. 2009, 220, 71–80. [Google Scholar] [CrossRef]
  56. Causarano, H.J.; Doraiswamy, P.C.; McCarty, G.W.; Hatfield, J.L.; Milak, S.; Stern, A.J. Epic modeling of soil organic carbon sequestration in croplands of Iowa. J. Environ. Qual. 2008, 37, 1345–1353. [Google Scholar] [CrossRef] [PubMed]
  57. Zhang, X.; Guo, H.; Wang, R.; Lin, D.; Gao, Y.; Lian, F.; Wang, J.A. Identification of the most sensitive parameters of winter wheat on a global scale for use in the epic model. Agron. J. 2017, 109, 58–70. [Google Scholar] [CrossRef]
  58. Xiong, W.; Balkovič, J.; van der Velde, M.; Zhang, X.; Izaurralde, R.C.; Skalský, R.; Lin, E.; Mueller, N.; Obersteiner, M. A calibration procedure to improve global rice yield simulations with EPIC. Ecol. Model. 2014, 273, 128–139. [Google Scholar] [CrossRef]
  59. Abrahamson, D.A.; Causarano, H.J.; Williams, J.R.; Norfleet, M.L.; Franzluebbers, A.J. Predicting soil organic carbon sequestration in the southeastern United States with epic and the soil conditioning index. J. Soil Water Conserv. 2009, 64, 134–144. [Google Scholar] [CrossRef]
  60. Doraiswamy, P.C.; McCarty, G.W.; Hunt, E.R., Jr.; Yost, R.S.; Doumbia, M.; Franzluebbers, A.J. Modeling soil carbon sequestration in agricultural lands of Mali. Agric. Syst. 2007, 94, 63–74. [Google Scholar] [CrossRef]
  61. Yue, Y.; Li, J.; Ye, X.; Wang, Z.; Zhu, A.-X.; Wang, J.-A. An EPIC model-based vulnerability assessment of wheat subject to drought. Nat. Hazard. 2015, 78, 1629–1652. [Google Scholar] [Green Version]
  62. Gaiser, T.; Barros, I.D.; Sereke, F.; Lange, F.-M. Validation and reliability of the EPIC model to simulate maize production in small-holder farming systems in tropical sub-humid West Africa and semi-arid Brazil. Agric. Ecosyst. Environ. 2010, 135, 318–327. [Google Scholar] [CrossRef]
  63. Le, K.N.; Jeong, J.; Reyes, M.R.; Jha, M.K.; Gassman, P.W.; Doro, L.; Hok, L.; Boulakia, S. Evaluation of the performance of the epic model for yield and biomass simulation under conservation systems in Cambodia. Agric. Syst. 2018. under review. [Google Scholar]
  64. CMIP3. Climate Change Data for Swat (cmip3). Texas A&M University, 2016. Available online: http://cmip.tamu.edu/cmip (accessed on 30 January 2016).
  65. IPCC. IPCC Special Report Emissions Scenarios; Cambridge University Press: Cambridge, UK, 2000; p. 608. [Google Scholar]
  66. ESS. Climate Change Scenarios: IPCC Story Lines, Models, Downscaling. Available online: http://www.ess.co.at/METEO/CCS.html (accessed on 10 May 2016).
  67. Ray, D.K.; Gerber, J.S.; MacDonald, G.K.; West, P.C. Climate variation explains a third of global crop yield variability. Nat. Commun. 2015, 6, 5989. [Google Scholar] [CrossRef] [PubMed] [Green Version]
  68. Araya, A.; Girma, A.; Getachew, F. Exploring impacts of climate change on maize yield in two contrasting agro-ecologies of Ethiopia. Asian J. Appl. Sci. Eng. 2015, 4, 26–36. [Google Scholar]
  69. Bassu, S.; Brisson, N.; Durand, J.-L.; Boote, K.; Lizaso, J.; Jones, J.W.; Rosenzweig, C.; Ruane, A.C.; Adam, M.; Baron, C.; et al. How do various maize crop models vary in their responses to climate change factors? Glob. Chang. Biol. 2014, 20, 2301–2320. [Google Scholar] [CrossRef] [PubMed] [Green Version]
  70. Fasinmirin, J.T.; Reichert, J.M. Conservation tillage for cassava (manihot esculenta crantz) production in the tropics. Soil Tillage Res. 2011, 113, 1–10. [Google Scholar] [CrossRef]
  71. Patrick, M.; Tenywa, J.S.; Ebanyat, P.; Tenywa, M.M.; Mubiru, D.N.; Basamba, T.A.; Leip, A. Soil organic carbon thresholds and nitrogen management in tropical agroecosystems: Concepts and prospects. J. Sustain. Dev. 2013, 6, 31–43. [Google Scholar] [CrossRef]
  72. Thierfelder, C.; Cheesman, S.; Rusinamhodzi, L. Benefits and challenges of crop rotations in maize-based conservation agriculture (CA) cropping systems of southern Africa. Int. J. Agric. Sustain. 2013, 11, 108–124. [Google Scholar] [CrossRef]
  73. Kendall, M.G. Rank Correlation Methods, 4th ed.; Charles Griffin: London, UK, 1975. [Google Scholar]
  74. Mann, H.B. Nonparametric tests against trend. Econometrica 1945, 13, 245–259. [Google Scholar] [CrossRef]
  75. Lugato, E.; Berti, A. Potential carbon sequestration in a cultivated soil under different climate change scenarios: A modelling approach for evaluating promising management practices in north-east Italy. Agric. Ecosyst. Environ. 2008, 128, 97–103. [Google Scholar] [CrossRef]
  76. Thomson, A.M.; Izaurralde, R.C.; Rosenberg, N.J.; He, X. Climate change impacts on agriculture and soil carbon sequestration potential in the Huang-Hai plain of china. Agric. Ecosyst. Environ. 2006, 114, 195–209. [Google Scholar] [CrossRef]
Figure 1. PAMPA experimental site in Kampong Cham, Cambodia.
Sustainability 10 02665 g001
Figure 2. Annual total precipitation and annual mean temperature in the baseline (1994–2013) and climate change scenarios with mid-century (2046–2064) and late-century (2081–2100) climate conditions with three scenarios (a) A1B, (b) A2 and (c) B1 in the GFDL CM2.1 model.
Sustainability 10 02665 g002
Figure 3. (a) Primary crop and (b) maize yield change between each emission scenario and the baseline during the first 20 years for treatments: CT represents conservation tillage with continuous primary crops: upland rice (R), soybean (S) or cassava (C); CA1 represents conservation agriculture with continuous primary crops; CA2R and CA3R represent conservation agriculture with rotated primary crops with maize during monsoon season.
Sustainability 10 02665 g003
Figure 4. (a) Primary crop and (b) maize yield change between each emission scenario and the baseline during for treatments: CT represents conservation tillage with continuous upland rice, soybean or cassava; CA1 represents conservation agriculture with continuous upland rice, soybean or cassava; and CA2&3 represent conservation agriculture with rotated upland rice, soybean or cassava with maize during monsoon season.
Sustainability 10 02665 g004
Figure 5. Baseline simulated SOC stocks (0–100 cm depth) of (a) upland rice (R), (b) soybean (S), and (c) cassava (C) cropping systems in which CT represents conservation tillage with continuous primary crops; CA1 represents conservation agriculture with continuous primary crops; CA2R and CA3R represent conservation agriculture with rotated primary crops with maize during monsoon season.
Sustainability 10 02665 g005aSustainability 10 02665 g005b
Figure 6. Baseline SOC change after 100 years compared to the initial SOC at 100 cm depth in which CT represents conservation tillage with continuous primary crops of upland rice (R), soybean (S) or cassava (C); CA1 represents conservation agriculture with continuous primary crops; CA2R and CA3R represent conservation agriculture with rotated primary crops with maize during monsoon season.
Sustainability 10 02665 g006
Figure 7. Percent SOC change under each climate change scenario compared to the baseline during (a) the first 20-year and (b) 100-year simulation in which CT represents conservation tillage with continuous primary crops; CA1 represents conservation agriculture with continuous primary crops; CA2R and CA3R represent conservation agriculture with rotated primary crops with maize during monsoon season.
Sustainability 10 02665 g007
Table 1. Five-year crop rotation for EPIC input.
TreatmentCrop Rotation in Each Cropping System
Year 1 2009Year 2 2010Year 3 2011Year 4 2012Year 5 2013
Rice Systems
CTRMb/RMb/RMb/RMb/RMb/R
CA1RMt/R+StMt+Cr/R+StMt/R+StSt(2011) /R+StSt(2012)/R+St
CA2RMt/R+StMt+Cr/M+StMt+Cr+St(2010)/R+StSt(2011)/M+StSt(2012)/R+St
CA3RMt/M+StMt+Cr/R+StMt+Cr+St(2010)/M+StSt(2011)/R+StSt(2012)/M+St
Soybean Systems
CTSSe/SSe/SSe/SSe/SSe/S
CA1SMt/S+BrzMt/S+BrzMt/S+St+SgMt/S+StSg/S+St+Sg
CA2SMt/S+StMt/M+StMt/S+StMt+Cr/M+StSg/S+St+Sg
CA3SMt/M+BrzMt/S+StMt+Cr/M+StSt(2011)/S+StSg+Cr/M+St
Cassava Systems
CTCCCCCC
CA1CC+StC+StSt(2010)/C+StSt(2011)/C+StC+St
CA2CC+StMt/M+StSt(2010)/C+StMt+Cr/M+StC+St
CA3CMt/M+StC+StMt+Cr/M+StSt(2011)/C+StSt(2012)/M+St
Note:“/”separates two crop seasons: early monsoon (early April to late June) and main monsoon (July to early November); “+” indicates intercropping within crop seasons; St (year): the year in bracket indicates that St (Stylosanthes guianensis) continues growing from the year planted in brackets; Mb: mung bean (Vigna radiata); Brz: Congo grass (Brachiaria ruziziensis cv. Ruzi); C: cassava (Manihot esculenta); Cr: sunn hemp (Crotalaria juncea); M: maize (Zea mays L.); Mt: millet (Pennisetum typhoides Burm); R: upland rice (Oryza sativa L.); S: soybean (Glycine max (L.) Merr.); Se: sesame (Sesamum indicum); Sg: sorghum (Sorghum bicolor L.); St: Stylo (Stylosanthes guianensis).

