Article

Evaluating Greenhouse Tomato and Pepper Input Efficiency Use in Kosovo

1
Department of Agricultural Economics and Agribusiness, University of Arkansas, Fayetteville, AR 72701, USA
2
Department of Agricultural Economics, Faculty of Agriculture and Veterinary, University of Prishtina “Hasan Prishtina”, Boulevard “Bill Clinton”, n.a., 10000 Prishtina, Kosovo
*
Author to whom correspondence should be addressed.
Sustainability 2018, 10(8), 2768; https://doi.org/10.3390/su10082768
Submission received: 19 June 2018 / Revised: 23 July 2018 / Accepted: 1 August 2018 / Published: 6 August 2018
(This article belongs to the Section Economic and Business Aspects of Sustainability)

Abstract

:
Determinants of vegetable production input efficiency affect a Kosovar farmer’s decision to contribute to the agricultural sector. This study evaluates the input efficiency of greenhouse tomato and pepper farms in Kosovo. Using data collected from farm surveys, we conducted an input-oriented data envelopment analysis (DEA) to empirically assess input efficiency. Second, linear regression analysis was used to investigate what farm variables predict greenhouse tomato and pepper technical efficiency (TE). The DEA results indicated that, among the seven regions in Kosovo, Prizren emerged as the most efficient greenhouse tomato-producing region with a mean efficiency of 0.83 (on a scale of 0 to 1.00). Prishtina followed with a mean efficiency of 0.80. In the production of greenhouse peppers, Prishtina was the most efficient region with a mean efficiency of 0.99. Ferizaj followed with a mean efficiency of 0.93. Conclusions about farm characteristics that explain differences in efficiency were sensitive to model specification. Nevertheless, depending on the structural and operational characteristics of the greenhouse tomato and pepper farms, there is an opportunity for the technically inefficient farms and regions to improve their use of inputs.

1. Introduction

The 1998–1999 war left Kosovo’s agricultural sector in a fragile state since it caused a collapse of the rural infrastructure as well as law and order [1], which caused a loss of productivity. The Kosovar farmers’ relationship with the land, however, has remained strong. After the war, there have been clear attempts by the national government to revive failing agricultural production levels and to restructure the agricultural sector by introducing new government agricultural policies.
In the new framework that has emerged, the government of Kosovo has begun to formulate agricultural policies with structural characteristics similar to those of the European Union. Nevertheless, farmers continue to face challenges. For example, there is still a strong dependence on imports of agricultural products and processed food [2], which affects farmers’ production levels and efficiency [3]. The production of greenhouse vegetables is a relevant example of a subsector that is experiencing low input efficiency since it is a relatively new production method in Kosovo and it faces competition from imports. Yet, greenhouse vegetables exemplify the post-war resilience of Kosovo agriculture. In comparison with open-field farms, greenhouse farms in Kosovo may take advantage of early season production. However, farmers in this emerging subsector argue that they are finding it difficult to incorporate efficient input quantities in the production process.
The underlying tension between the associated aspects of low yields and the inefficient use of inputs may lead to a decrease in the domestic production of greenhouse tomatoes and peppers. Several studies have found that the optimal use of inputs is an important determinant of vegetable production [4,5]. While one study has examined the drivers of vegetable production efficiency in Kosovo [6], little attention was given to greenhouse tomato and pepper input efficiency use. Maximizing input efficiency is a subject that has not been examined in detail. For these reasons, the aim of this study is to provide insight on ways to maintain current yields while decreasing resource waste.

2. Materials and Methods

2.1. Data

Data were collected from 1 June 2017 to 7 August 2017 with a sample covering 136 greenhouse tomato and pepper farms from 22 villages, 11 municipalities, and 7 regions of Kosovo. Production information was obtained through face-to-face interviews with farmers. To facilitate the data collection process, two research surveys were developed to gather information from the field. The first survey was targeted toward the greenhouse tomato production in the seven regions, which includes Prishtina, Ferizaj, Gjilan, Prizren, Gjakova, Peja, and Mitrovica. The second survey was developed for the greenhouse pepper farms and was executed in all of the same regions excluding Prizren because of limited greenhouse pepper production in this area. Each survey included 47 questions and was separated into four survey modules. Both of the surveys contained three modules that elicited information about the respondent, characteristics of the greenhouse, and assessed producer needs. A fourth survey module was designed specifically for tomato or pepper production, respectively. All farmers interviewed were growing at least tomatoes or peppers as their cash crop. Some of those same farmers also produced a few rows of these crops or other vegetables for home consumption.

2.2. Data Envelopment Analysis (DEA)

The purpose of this analysis was to determine technical efficiency (TE), pure technical efficiency (PTE), and scale efficiency (SE) of the greenhouse tomato and pepper farms. An additional goal of this study was to understand factors that influence TE scores. Therefore, an input-oriented DEA coupled with linear regression were used to compare input efficiency use between farms and to explore what farm-level variables could predict TE. As a mathematical technique, DEA solves performance evaluation problems [7] and quantifies input efficiency use. The input-oriented Banker-Charnes-Cooper (BCC) [8,9] and Charnes-Cooper-Rhodes (CCR) [10] models were used. After characterizing TE and SE from these models, TE scores received from the greenhouse tomato and pepper CCR models were used as outcomes in additional analyses to understand farm-level characteristics that impact efficient input use. All analyses were performed in R, which is a programming language and software for statistical analysis.
Using the BBC model, we let j = 1, 2, ..., n, index the greenhouse tomato and pepper operations. Each operation realizes yields, yrj (r = 1, 2, ..., s), using observed levels of m farm inputs, xij (i = 1, 2, ..., m). In addition, ε denotes a small value that penalizes slack terms s i and s r + to facilitate model solutions and prevent a classification of an inefficient decision making unit (DMU) as efficient. A small and positive value for ε may work in many instances [11]. The BCC model is presented as follows.
min θ o ε ( i = 1 m s i + r = 1 s s r + ) ,
subject to
θ oX io = j = 1 n x ij λ j + s i i = 1 ,   2 , ,   m   - ,
y ro = j = 1 n y rj λ j s r + r = 1 ,   2 , ,   s   - ,
1 = j = 1 n λ j ,
0 λ j ,   s i ,   s r +   i ,   r ,   j ,  
Yield is the output for both greenhouse tomato and pepper farms because farmers’ primary production decisions can be based on potential future yields [12]. Efficient operations of farms can also lower per unit production costs and lead to yield increases [13]. The inputs used in the models include insecticide, labor, greenhouse area in square meters (m2), greenhouse value in euros, and the use of artificial and organic fertilizers at different stages of greenhouse production.
The rationale for measurement and inclusion of these variables in the model is as follows. In Kosovo, often greenhouses covering larger areas correspond to greenhouses that have improved designs and structures. These greenhouses may have, on average, higher volumes of production and may be more efficient. Therefore, the variable greenhouse area in m2 was included. Among pesticide use in Kosovar greenhouse tomato and pepper production, insecticides may be used more regularly than herbicides and fungicides. Similarly, chemical pest control measures can be costly in Kosovo but may be highly beneficial for production [14]. Labor was included as an input because two studies [4,15] presented evidence that labor is often overused in tomato production. Since this research suggests that labor is prone to overuse in greenhouse tomato production, it was hypothesized that labor could also be overused in pepper production.
The literature noted that fertilizer was an important input to include in the evaluation of TE [15,16]. One consideration is whether artificial or organic fertilizers may have a greater impact on tomato and pepper yields. Although several studies suggested that organic fertilizers may do more to increase productivity [17,18,19], there is evidence that the tomato yield was higher with the use of mineral fertilizers than with organic fertilizers [20]. To explore how fertilizers impact greenhouse tomato and pepper input efficiency use, this study included the planting phase of organic and artificial fertilizers and the flowering phase among crystalline and artificial fertilizers. In discussions with Kosovar experts, the value of greenhouses in Kosovo varied greatly between government program grantees and non-grantees. Grantees had greenhouses of higher euro value. Therefore, this study considered the greenhouse value in euros as an input for evaluating input efficiency use among greenhouse tomato and pepper farms.
The BCC model differs from the CCR model in that it includes an additional constraint on the intensity variables j = 1 n λ j = 1 [9]. This can permit the measurement of efficiency relative to a variable return to scale (VRS) technology. A PTE score is represented by θ BCC . The CCR model measures efficiency relative to a constant return to scale (CRS) technology and θ CCR corresponds to a TE score. This model uses the same inputs and outputs explained previously in this study for evaluating greenhouse tomato and pepper farms’ TE. In a linear programming framework, DEA as a non-parametric method was used to calculate SE. The evaluation of the CCR and BCC models helped us define SE as θ CCR / θ BCC . With the use of these notions, this study may demonstrate the decomposition of efficiency, which is shown below.
Technical   Efficiency   ( TE ) = Pure   Technical   Efficiency   ( PTE ) × Scale   Efficiency   ( SE )
The purpose of the decomposition was to show whether the source of inefficiency was caused by PTE, by SE, or by both [21].

2.3. Regression Analysis

This study contained two datasets that were used separately for greenhouse tomato and pepper farms. It was possible to analyze the efficiency scores derived from DEA through a linear regression model. An equal number of variables was considered for estimating the linear regression model for both the greenhouse tomato farms and the greenhouse pepper farms (Table 1).
Using the variables above from Table 1, we examined the average effect of farm characteristics on the TE scores of tomato and pepper greenhouses. The TE scores derived from the CCR model were used as the outcome measure in this regression.
TE i = β 0 + β 1 T / PCROP i + β 2 T / PPOWER i + β 3 T / PROWS i + β 4 T / PWHOLE i + β 5 T / PEXREV i + β 6 T / POTHER i + β 7 T / PFARM i + β 8 T / PWELL i + β 9 T / PWATER i + β 10 T / PEDU i + β 11 T / PFAMILY i + ε i
Following the model, this study called TE i the technical efficiency as the dependent variable for a given tomato or pepper greenhouse. The random error term for a greenhouse was represented by ε i .The first variable used was T / PCROP i . It was useful to explore which group of farmers were more efficient in the use of inputs including those who expressed their need to participate in crop nutrition training and those who did not.
Energy efficiency improvements are vital [22]. The government of Kosovo has prioritized the energy sector by emphasizing the improvement of electricity generation capacities. Over the years, a steady increase in electricity production has been noted in Kosovo. However, challenges remain in the effort to gain an efficient use of electricity [23]. Enterprises and farms in Kosovo may examine a cost-effective way to consume energy. There may be variations between greenhouse farmers who used electricity and greenhouse farmers who used fuel as their power source at a farm level. This power source may have an impact on a farm’s TE. Electricity remains a costly source of power in Kosovo [24]. Farmers focus on minimizing costs where the source of power often accounts for a large share in the vegetable production costs. Considering this, we used the indicator variable T / PPOWER i . Fruit yields can increase when the greenhouse plants are arranged correctly and when there is a minimization of gaps between plants and rows [25]. To achieve more greenhouse tomato or pepper yields, farmers may increase the number of rows more than may be efficient. Likewise, a discrepancy in the number of rows per greenhouse can impact how each farmer uses inputs in the production process. It is of interest to find an appropriate number of rows in the greenhouse, which may affect how inputs are allocated. Therefore, T / PPOWER i was included.
An issue reported from the greenhouse farmers is the low price received per kilogram (kg) of the produce. In this study, T / PWHOLE i is one variable that may explain this issue in part. Farmers often can have high price expectations if they noticed that there were high wholesale prices in the market from the previous harvesting season [26]. When the price is low from the vegetable wholesalers, greenhouse farmers may have to contract their gross profit margins. Actually, farmers can be forced to market their produce at lower prices to avoid the risk of not selling. In addition, farmers’ ability to sell their produce may be influenced from the wholesale price of tomatoes that tends to fluctuate. [27]. To test if the variable including the farmer’s wholesale selling price has an impact in the optimal use of inputs, this study included it in the models. Similarly, prices and varying yields can influence farm incomes [28]. Even off-farm income was found to have a positive effect on revenue risk [29]. The use of T / PEXREV i tested whether farmers with and without an external source of revenue differed in the optimal use of inputs. Off-farm income may even substitute income losses that occurred in the farm [29,30]. However, there may not be sufficient evidence to conclude why some farmers rely on off-farm income and others do not [30]. It can be expected in this study that farmers who have an external source of revenue could rely less on on-farm revenue.
Vegetable farms growing two or more crops were found to have less usage of water, diesel, and electricity [31]. In this aspect, T / POTHER i was another variable used in the models to understand how growing other crops over the course of a season impacts the efficient use of inputs. In Kosovo, there may be a mixture of farmers growing greenhouse tomatoes or peppers as a single crop and those who may have other crops with tomatoes or peppers in the same greenhouse. Large-sized and mixed farms tend to have high efficiency [32]. The variable T / PFARM i can be important given that product prices in agriculture have a high tendency to vary [12]. Farmers may choose to sell directly to the retailers or consumers through farmers’ markets [33]. High quality peppers can achieve premium prices in the market [34] while conventional tomatoes relative to organic tomatoes may not reach premium prices in the market [35]. There is a belief in Kosovo that farmers selling greenhouse peppers at the farmer’s market may receive higher prices per kg compared to the greenhouse tomato farmers. Whether the farmer market price influences the efficient use of inputs was important to explore.
The variable T / PWELL i was included because the amount of water applied on crops has a clear tendency to affect yields [36] and an efficient use of irrigation would rely on the design of the irrigation system and its management [37]. For example, an implication of a limited irrigation time could suggest that farms in Kosovo’s regions with lower than average well depths may be less likely to irrigate during the flowering season when faced with increased levels of water scarcity. When the well depth is large and there is an increase in irrigation effectiveness, a potential to grow yields is possible [38]. This study expects that it could be possible to test if well depth is likely to influence the optimal use of inputs. The model has T / PWATER i as a variable that may provide an understanding of the quality of a farmer’s irrigation system. Inadequate irrigation of the vegetable crops because of the old irrigation equipment can constrain input efficiency use. Despite the wide presence of the drip irrigation systems in Kosovo, the frequency and amount of irrigation needs improvement [39]. The greenhouse tomato and pepper farmers may have irrigation systems with varying euro values. Therefore, it was essential to use this variable for the greenhouse tomato and pepper input efficiency use related to regression analyses.
Studies in agriculture have found education to positively impact higher levels of TE [40,41]. However, education may not be significantly correlated with efficiency [42]. Therefore, the variable T / PEDU i could test whether education has an impact on the greenhouse tomato and pepper TE. The use of T / PFAMILY i is relevant since most of the farm work is performed by the farmer’s family members [14]. The number of family members may dictate the intensity of family labor use. The limited literature in Kosovo on the impact of family members in the production of greenhouse tomatoes and peppers could allow this study to examine any potential influence from the variable.

3. Results

Results of the DEA analysis revealed differences in input efficiency use among greenhouse tomato and pepper farms in Kosovo. For both types of farms, yield in kg is the output measure. Input measures differed depending on the production specificities of tomatoes and peppers, respectively. Models for both crops included inputs such as insecticide, labor, greenhouse area in m2, planting-phase organic fertilizer, flowering-phase artificial fertilizer, and flowering-phase crystalline fertilizer. Inputs for the DEA analysis of tomatoes also included the greenhouse value in euros and the planting-phase artificial fertilizers.

3.1. Greenhous Tomato Input Use at a Farm Level

All efficiency scores presented in this section are on a scale of 0 to 1.00 with a score of 1.00 indicating that the farm is 100 percent efficient, relative to other farms in the sample. The input-oriented DEA analysis of 94 greenhouse tomato farms showed that inefficiency was present in the use of inputs. Findings from the BCC model show that 33% of greenhouse tomato farms had a PTE measure of 1.00 (Table 2). Farms with an efficiency score of 1.00 were optimally using their inputs given their scale of operation. The remaining 77% of tomato farms showed some degree of inefficiency in the use of inputs. The CCR model for greenhouse tomato farms’ TE suggested that only 16% of the farms had an efficiency of 1.00 (Table 2). Therefore, nearly half of the operations with PTE measures of 1.00 were operating at an inefficient scale. Due to differences in scale, a decision-making unit can, at the same time, be BCC-efficient and may be found CCR-inefficient from the CCR model [21].
The comparison of the BCC and CCR models reveals inefficiency (Table 2). Of all the greenhouse tomato farms, 16% were scale-efficient. This indicates that any changes to their existing input values may not lead to higher efficiency. It suggested that these scale-efficient farms maintain the level of efficiency by employing the same practices in the production process. These practices may further support the continuous and optimal use of inputs. However, 84% were facing decreasing returns to scale (DRS). Among the DRS farms, the results indicated that there can be an over utilization of labor and fertilizers relative to the scale efficient farms (Table 3).
According to the results, greenhouse tomato farms facing DRS or diseconomies of scale may choose to reduce the farm output since they have surpassed their optimal size and use of inputs. In fact, the quantities of used inputs may affect the levels of yields [43]. The farmers interviewed reasoned that, given the lack of production expertise as well as other factors for the optimal use of inputs in the production of greenhouse tomatoes, they were struggling to maintain yields without an increase in the inputs consumed. The results of this study reflected complaints from farmers that additional use of inputs may not provide higher yields. This may particularly hold for the DRS farms.

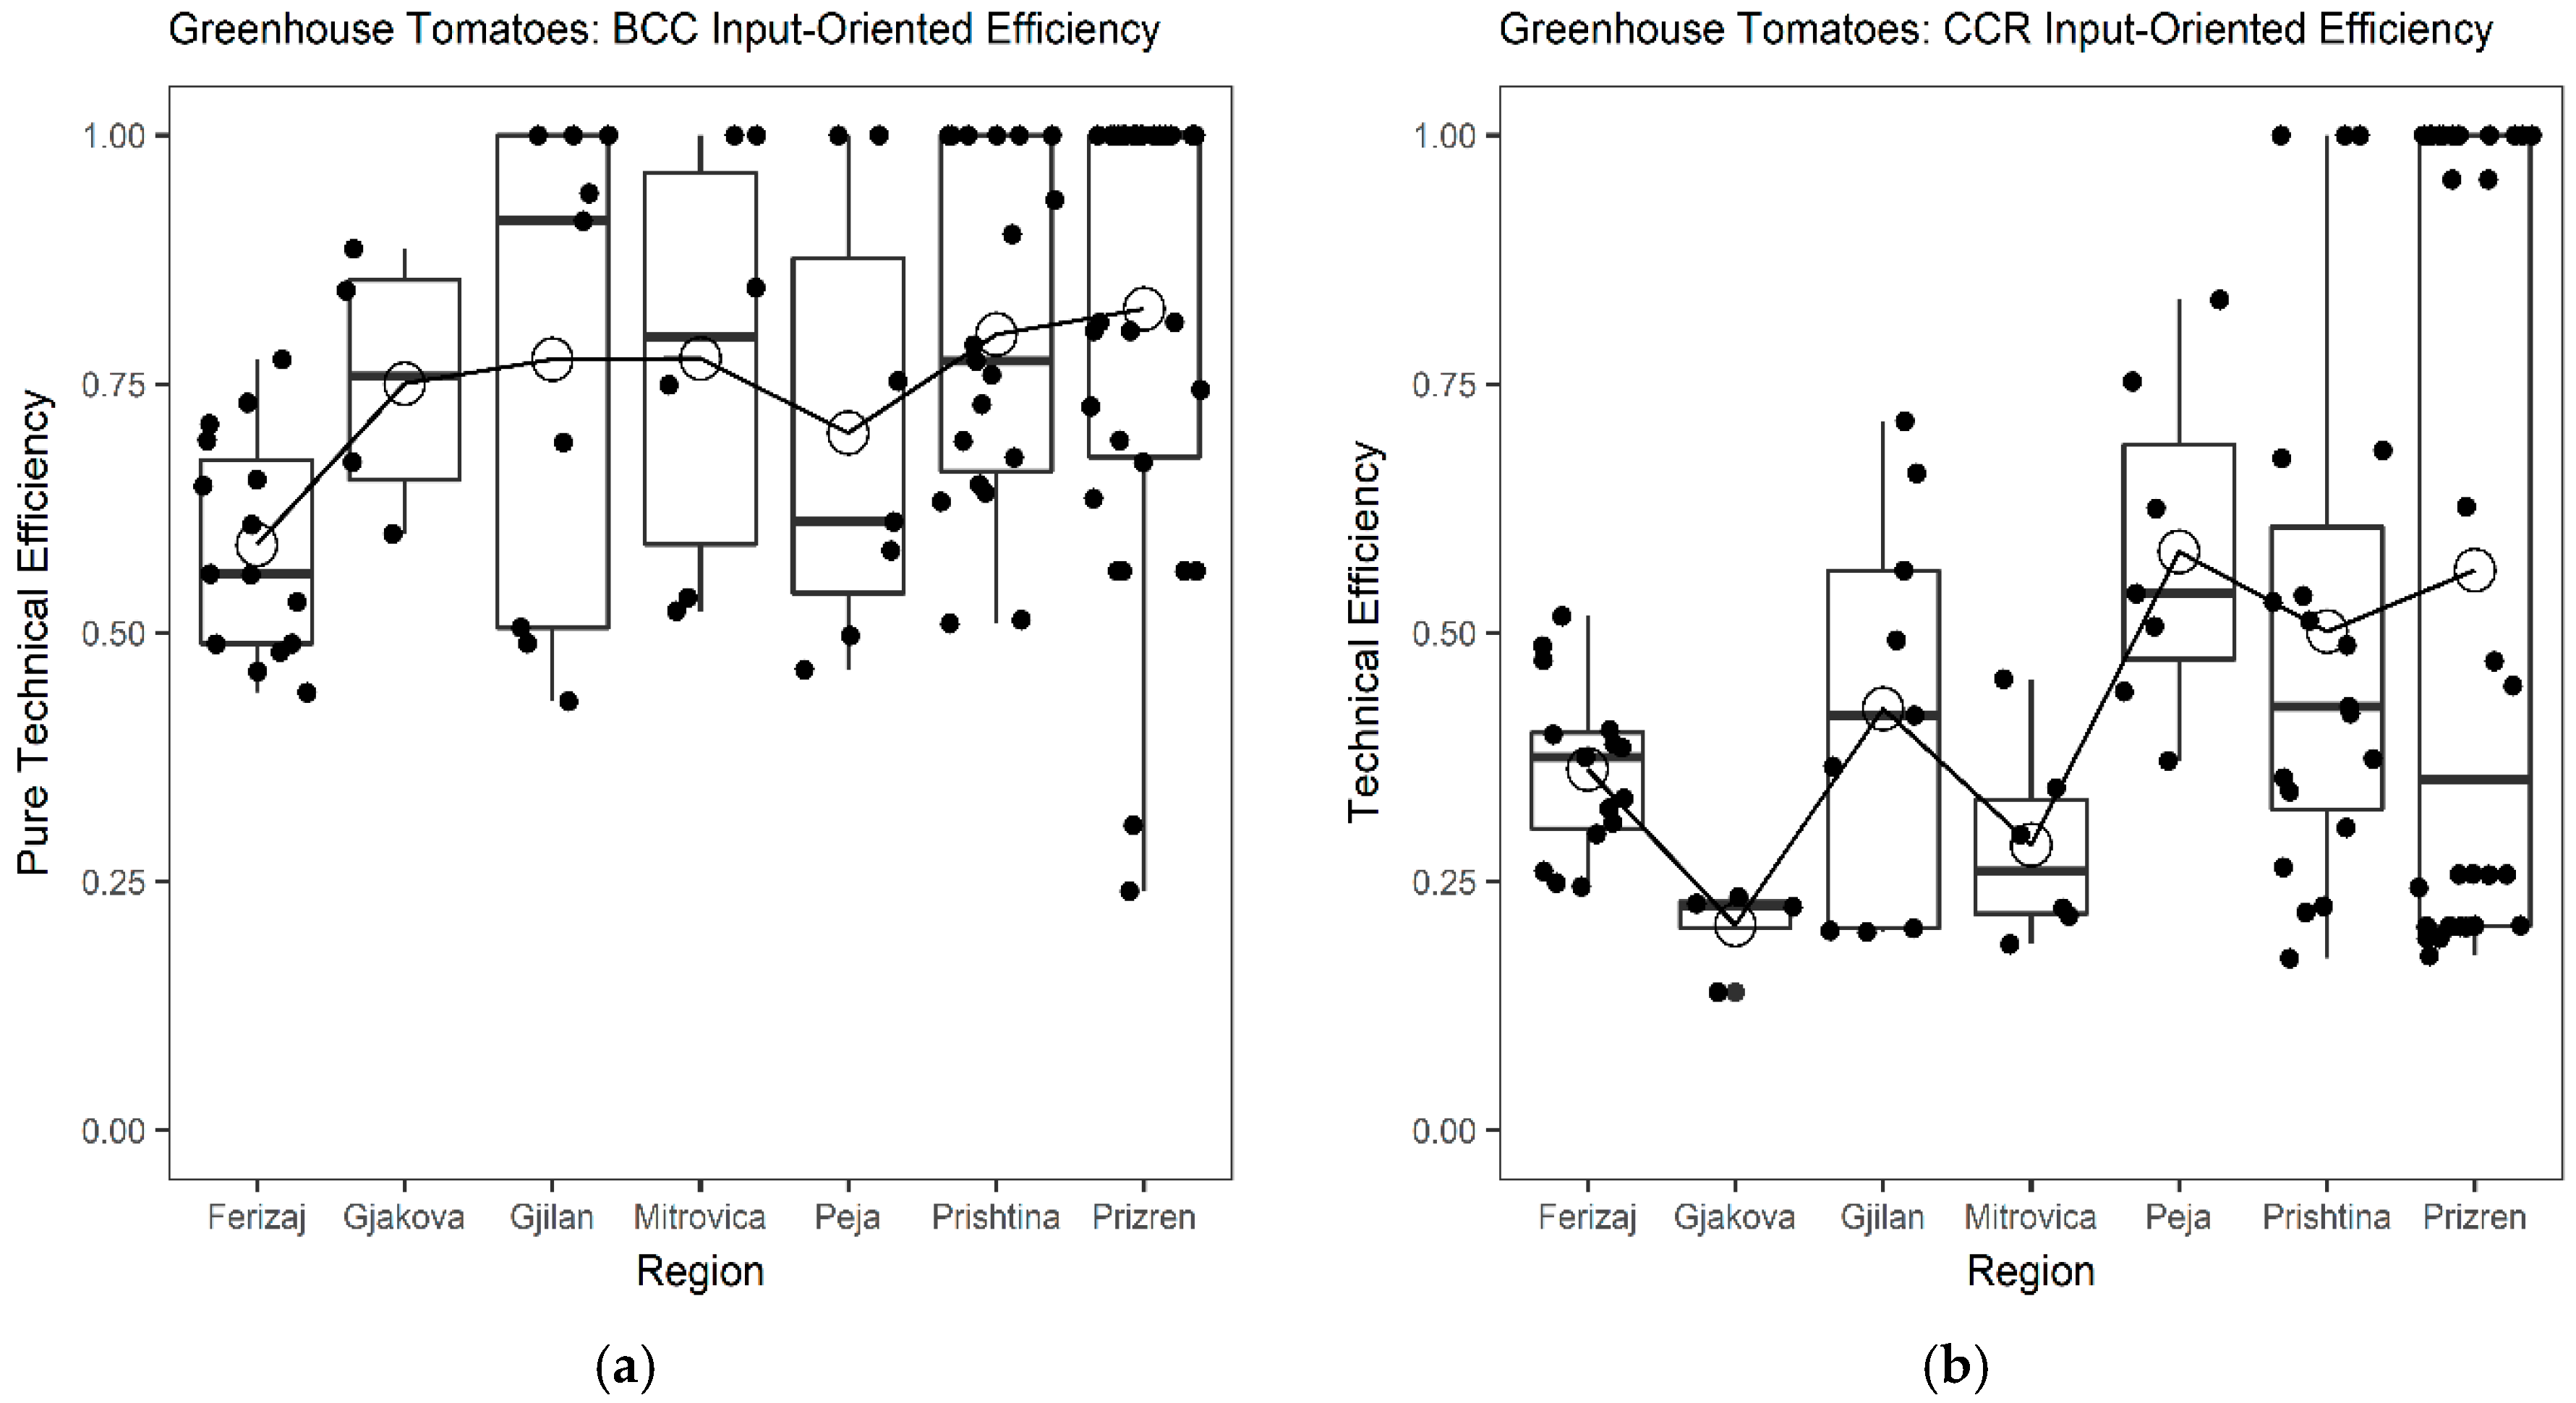
3.2. Greenhouse Tomato Input Use Comparison at a Regional Level

In addition to analyzing efficiency at a farm level, the extent of input efficiency use at a regional level was a component of the study. When using aggregate efficiency scores with BCC input-oriented efficiency, Prizren emerged as the region with the most efficient producers with a mean efficiency of 0.83. This result was expected since Prizren comprised the highest number of greenhouse tomato producers and held a tradition of family farming. The region known as Prishtina had a mean efficiency of 0.80 for the optimal use of inputs in the production of greenhouse tomatoes. Under the CCR input-oriented efficiency, the region of Peja with a mean efficiency of 0.58 ranked first and was followed by Prizren with a mean efficiency of 0.56. Efficiency ranking of the regions under BCC was relevant since CCR assumed all greenhouse tomato farms operate at an optimal scale. This assumption may not hold in Kosovo’s newly emerging greenhouse sector. The results indicating Prizren to be the region with the most efficient producers were more likely consistent with the input efficiency use comparison at a regional level.
We provide an efficiency representation of the leading greenhouse tomato producing regions under the BCC and CCR input-oriented efficiency (Figure 1) as well as where farms with low efficiency may be observed in the lower quartile compared to the high efficiency farms in the upper quartile. However, this study underscored the mean efficiency of the regions and how each region differs in the use of inputs according to this statistic.

3.3. Greenhouse Pepper Input Use at a Farm Level

The results revealed that there were percentage-wise fewer inefficient greenhouse pepper producers compared with the greenhouse tomato producers at the lower efficiency levels. Greenhouse pepper farms’ PTE showed that 52% of the farmers were BCC-efficient. However, the analysis including TE was lower with 26% of the farmers as CCR-efficient (Table 4).
Greenhouse pepper SE inferred results could show also that 26% of the farms were scale-efficient (Table 4), which indicates a 10% higher SE compared to the greenhouse tomato farms. Under the scale of production, 7% were operating in the area of increasing returns to scale (IRS) and 67% in the area of DRS. The production scale of the greenhouse pepper farms was small. Nevertheless, there was a slightly lower presence of diseconomies of scale when compared to the greenhouse tomato farms. For farmers operating under IRS, they may increase the use of input examined in this study to progress towards SE. Scale-efficient farms in terms of yields were slightly less than twice more efficient than their DRS and IRS counterparts. The efficient values of inputs under SE (Table 5) could be relevant for DRS and IRS farms in Kosovo to compare their existing input quantities used in the production of greenhouse peppers.
A greenhouse pepper farm facing DRS or diseconomies of scale may choose to decrease its size to reduce some of the excessive use of inputs. For the greenhouse pepper farms in the case of IRS or economies of scale, it was important to achieve an overall higher use of inputs. In this frame of analysis, an increase in output may be achieved through an increase in the use of inputs where the discrepancy of mean values was previously noted among IRS relative to the SE greenhouse pepper farms (Table 5).

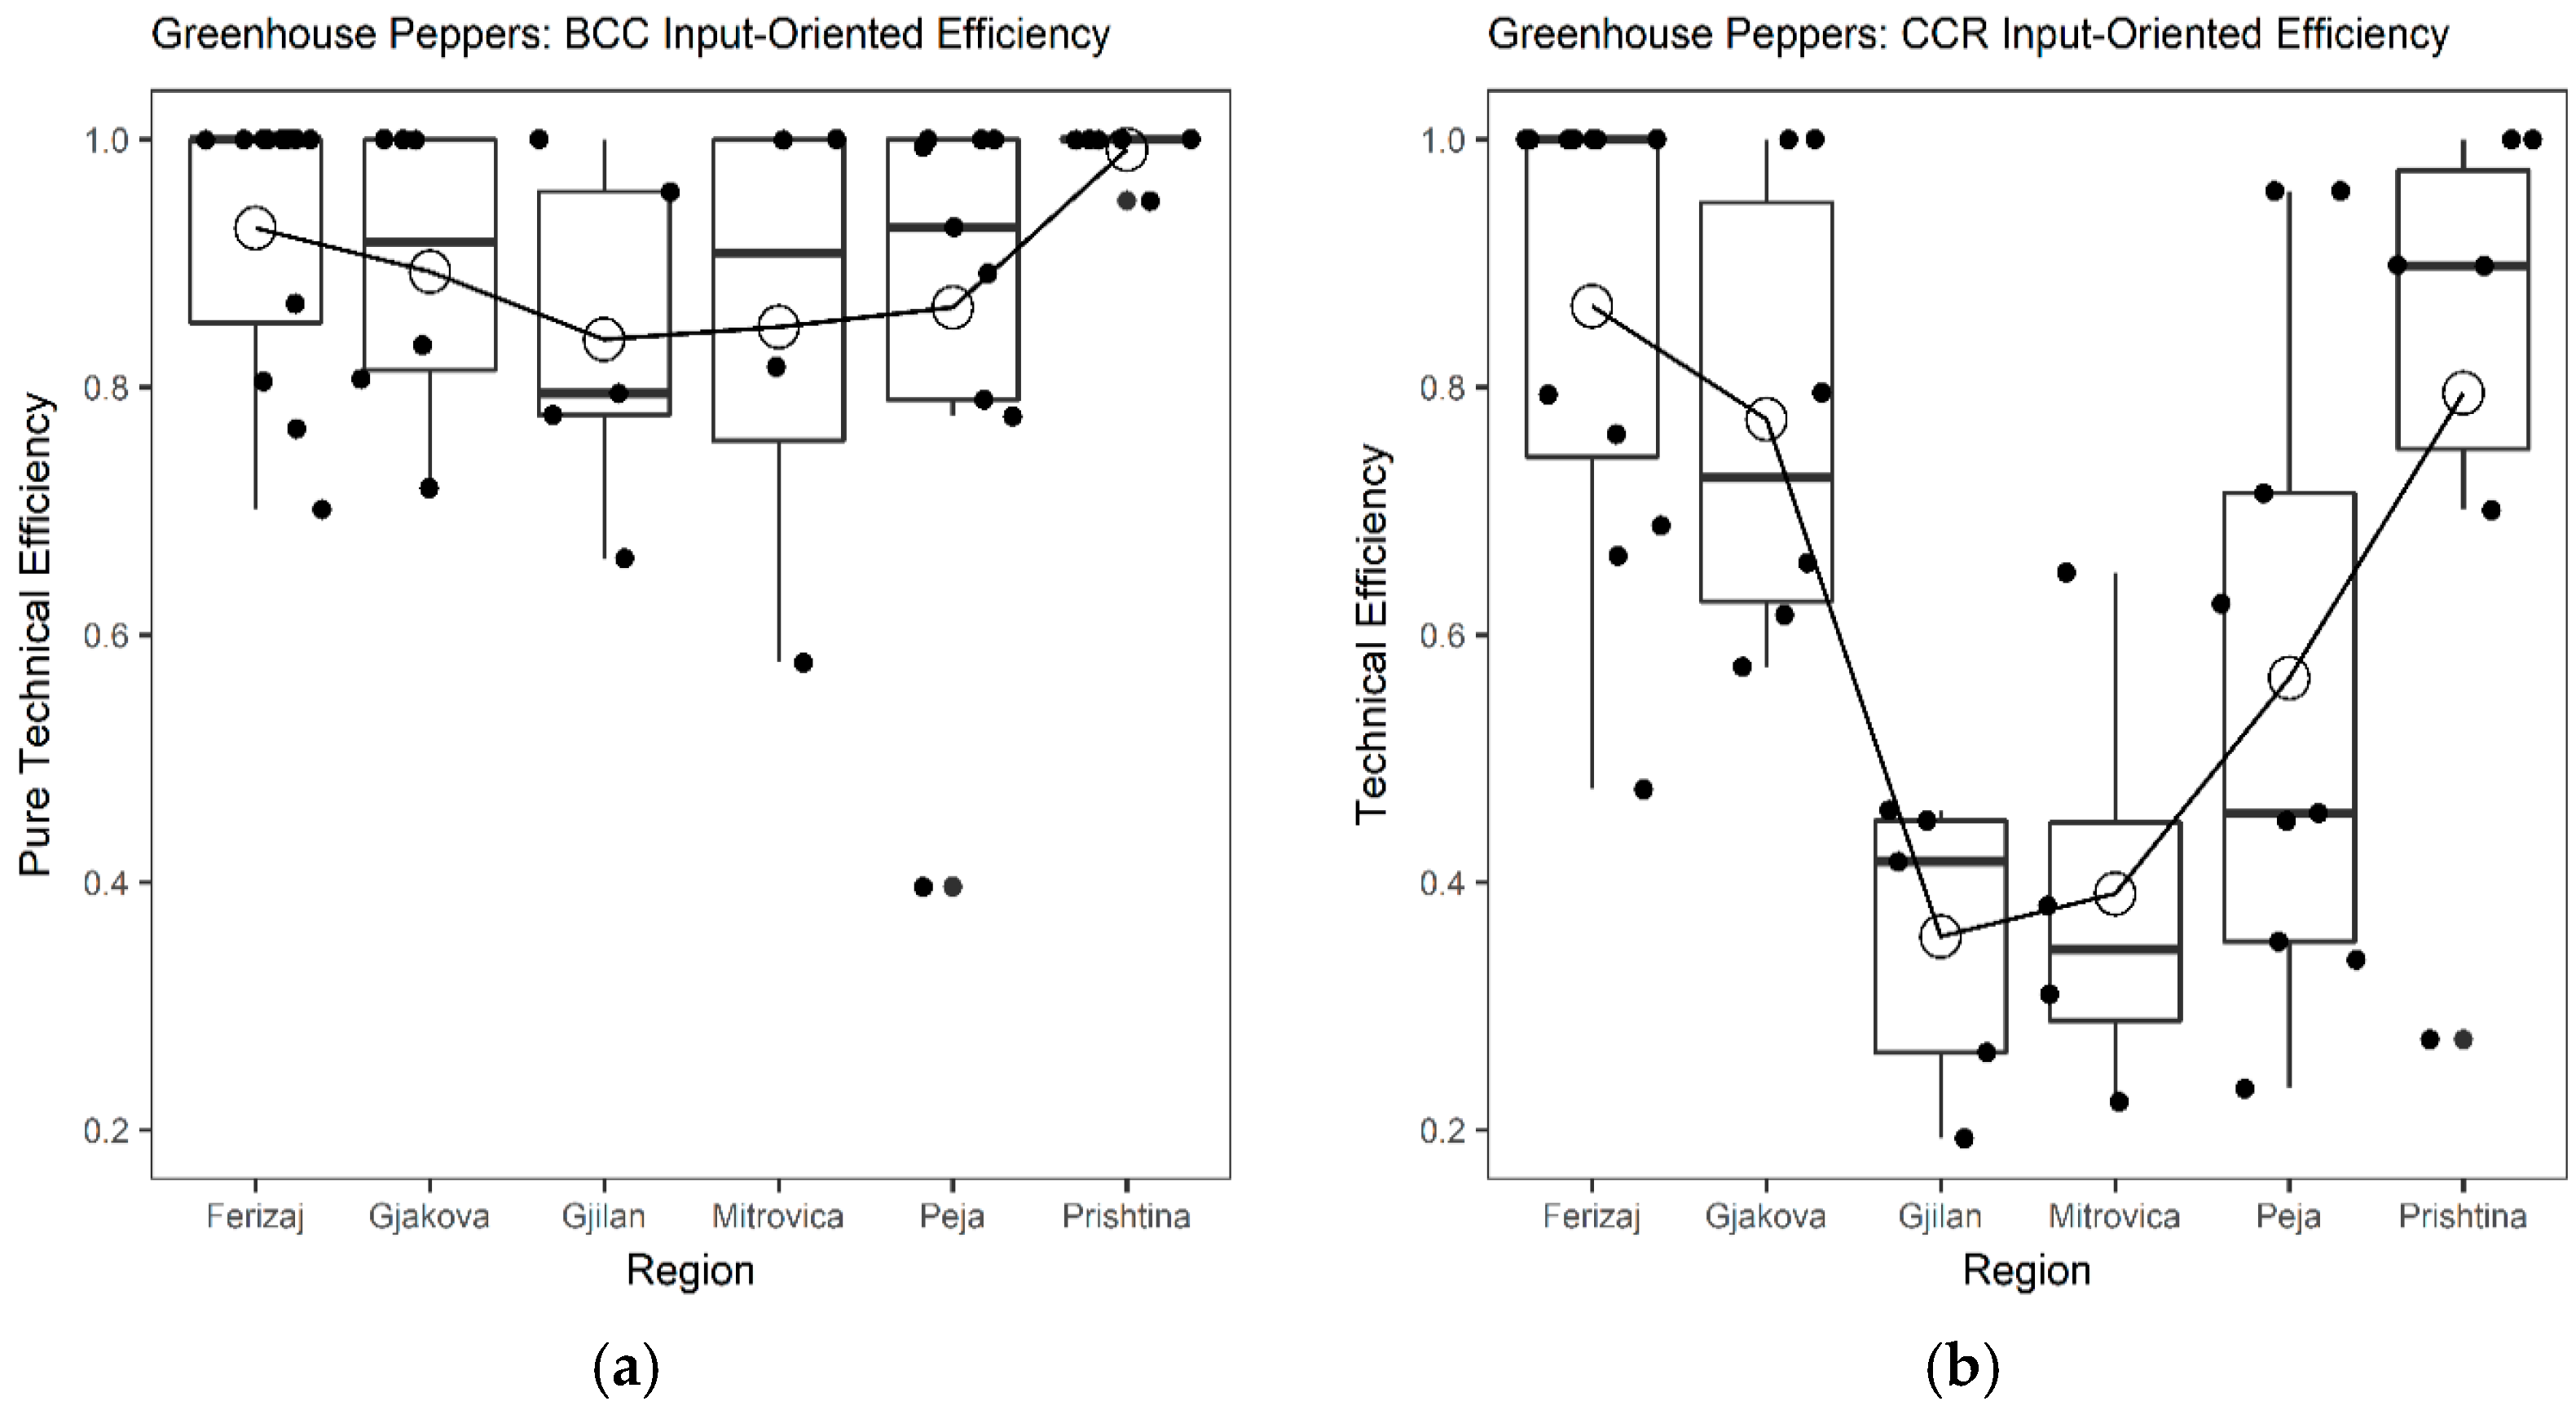
3.4. Greenhouse Pepper Input Use Comparison at a Regional Level

Using the aggregate efficiency scores with the BCC input-oriented efficiency, Prishtina was the most efficient region with a mean efficiency of 0.99. Ferizaj followed with a mean efficiency of 0.93 in the use of inputs when producing greenhouse peppers (Figure 2). This was expected since there is an increasing number of farmers from Prishtina receiving financial support by the Ministry of Agriculture, Forestry and Rural Development (MAFRD) as well as by the Municipality of Prishtina in the production of greenhouse vegetable crops. This along with the fact that Prishtina is the capital of Kosovo with a large market for the greenhouse peppers supports the study’s result that this region may have the most efficient producers of input use. Under the CCR input-oriented efficiency, the region of Ferizaj with a mean efficiency of 0.87 ranked first. It was followed by Prishtina, which had a mean efficiency of 0.80 (Figure 2). The greenhouse pepper producing regions with producers that have low efficiency may be observed in the lower quartile when compared with the producers with high efficiency who are observed in the upper quartile (Figure 2).

3.5. Linear Regression Implications

The external and production-related variables for the linear regression analysis were found to be different among greenhouse tomato and pepper farms. Some variables had significant impacts on the optimal use of inputs among greenhouse tomato farms and other inputs among greenhouse pepper farms. Some variables included in the final models differed across tomatoes and peppers. The estimation procedure for the greenhouse tomato farms included a power source, the rows per greenhouse, wholesale price per kg of tomatoes, the irrigation equipment value in euros, education in years, the need to participate in a crop nutrition training, and the number of family members. The estimation procedure for the greenhouse pepper farms included an indicator variable for the farmer’s external revenue, farmer market price per kg of peppers, other greenhouse crops grown, well depth in meters, irrigation equipment value in euros, education in years, and the number of family members.
In the linear model for the greenhouse tomato farms with TE scores as the scalar dependent variable, three variables were found statistically significant at the 5% level and four were not statistically significant (Table 6). Rows per greenhouse were found to be statistically significant with a positive coefficient. This result may suggest that farmers with greenhouse rows occupied with crops for non-commercial uses may make them less efficient in the optimal use of inputs. The positive result may also suggest that crops grown for home consumption may limit the greenhouse area for the greenhouse tomatoes produced for the market. The negative and significant coefficient of the power source variable showed that farmers using electricity were less efficient than those using fuel in the use of inputs. Given that electricity remains a costly source of power in Kosovo [23], this result was expected to demonstrate a negative impact on input efficiency use. As mentioned earlier, the farmers reported during the interview process that the price received per kilogram of tomatoes from the vegetable wholesalers in Kosovo was hurting their gross margins. The pressure originating from low profits and high input costs may lead farmers to lower efficiency levels in the use of inputs. This study found that the variable wholesale price per kilogram of tomatoes was significant and negative. First, this result supported the assumption that selling to the vegetable wholesalers may result in a less efficient use of inputs. Second, as the purchase of costly inputs is often realized with difficulty among greenhouse tomato farms, this may encourage a lower and disproportionate application of inputs. Variables reported statistically insignificant at the 5% level included the need for a crop nutrition training (p-value = 0.05), an irrigation equipment value in euros (p-value = 0.12), education in years (p-value = 0.05), and the number of family members (p-value = 0.42).
In the greenhouse pepper model, three variables were found to be significant at the 5% level and four were not (Table 6). The number of family members was statistically significant and negative. While a positive effect was initially expected, the model strengthened the assumption that a higher presence of the family members during the growing season may not contribute to an efficient use of inputs. This may be true among single tunnel greenhouses where labor may not be required as intensively as in the multiple tunnel greenhouses. Other greenhouse crops grown were reported significant with a negative impact. Farms that concurrently cultivated other vegetable crops and peppers in the same greenhouse displayed inefficiency in input use. The variable irrigation equipment value in euros was found significant and had a positive coefficient. The result indicated that higher valued irrigation equipment may increase the input efficiency use in greenhouse pepper productions. Despite the wide presence of the drip irrigation systems in Kosovo, it can be determined from the model’s estimation that irrigation equipment of higher euro value may result in a more precise application of water, which makes more efficient use of this input. Education in years (p-value = 0.64), well depth in meters (p-value = 0.10), external revenue (p-value = 0.86), and farmer market price per kilogram of peppers (p-value = 0.48) were found to be statistically insignificant.

4. Discussion

Often greenhouse vegetable farm differences in production have been considered as an explanation for low efficiency. This may be because of the low production of vegetables and its inability to meet domestic demand [44]. However, given Kosovo’s approximate uniformity in weather conditions and cultivation practices, greenhouse tomato and pepper farms may not have varying production specificities that justify the over-utilization or under-utilization of inputs. The study aimed to analyze greenhouse tomato and pepper input efficiency use in Kosovo at a farm and regional level and to determine the external factors that affect efficiency by using linear regression as a follow-up procedure to the DEA method.
In a regional analysis, Prizren and Prishtina were found to be the most efficient in the production of greenhouse tomatoes and peppers, respectively. This can provide helpful insights for the greenhouse vegetable sector in Kosovo. Additionally, the less efficient regions could be facing low production efficiency, and this can limit the competitiveness of farms and their products [3]. The inefficient greenhouse producers were found to be operating under DRS but may become scale-efficient by reducing the use of agricultural inputs. Those operating under IRS may become scale-efficient by increasing the use of agricultural inputs. The results suggest that, for greenhouse tomato producing regions to achieve proper TE, input use would need to improve by 13% to 41% depending on the region. Comparatively, greenhouse pepper producers had higher efficiency scores. This means that there were fewer pepper farms that could improve input use by adopting production practices of the best farms in the sample. Therefore, potential improvements in efficient input use ranged across regions from 1% to 16%.
At a farm level, the BCC model showed that 33% of the greenhouse tomato farms were fully efficient and only 16% were fully efficient under the CCR model. In addition, 52% of greenhouse pepper farms were fully efficient under the BCC model and 26% under the CCR model, respectively. Given differences in scale size, there were farms that had complete optimal use of inputs. The technically efficient farms could also decide to improve production over the long term [13] by considering that production efficiency has a positive impact on agricultural growth [15]. However, many of the greenhouse tomato farms under DRS and greenhouse pepper farms under IRS and DRS were struggling to find an optimal use of inputs. The results suggest developing a policy to address the issue of selling greenhouse tomatoes with a price that may jeopardize the financial health and future of the farms. The region of Prizren with the most concentration of greenhouse tomato farms and the region of Gjakova were found to be particularly influenced by the price received per kilogram (kg) of tomatoes from the vegetable wholesalers. Meanwhile, no estimates were statistically significant in relation to the price received by greenhouse pepper farms.
In sum, this study explores the inefficient input use in the production of greenhouse tomatoes and peppers, which is caused by two primary factors. One factor is the disproportionate use of inputs without a corresponding increase in yields noted among DRS farms. Often this leads to a loss of production, which may be avoided by reducing the use of inputs to the same level of the scale efficient input values. The other factor concerns the disadvantageous market conditions where pressure from imports and low prices set from vegetable wholesalers heavily affect greenhouse tomato production. This study revealed that, under the given greenhouse tomato and pepper production levels, there would be a large opportunity for the technically-inefficient farms and regions to improve their whole performance through the use of inputs.

Author Contributions

Contributions: J.S.P. and A.M. conceived the idea and B.F. facilitated by A.M. collected the data through surveys. All authors worked on the methodology, and B.F. and M.T. used the software to execute it. B.F. contributed to the writing and editing of the paper and J.S.P., M.T. and A.M. revised it. The final manuscript has been read and approved by all the authors.

Funding

This research received no external funding.

Acknowledgments

We thank the Department of Agricultural Economics and Agribusiness of the University of Arkansas in Fayetteville, Arkansas, and greenhouse tomato and pepper farmers throughout Kosovo.

Conflicts of Interest

The authors declare no conflict of interest.

References

  1. Judah, T. Kosovo: What Everyone Needs to Know; Oxford University Press: Oxford, UK, 2008. [Google Scholar]
  2. Sauer, J.; Davidova, S.; Latruffe, L. Determinants of smallholders’ decisions to leave land fallow: The case of Kosovo. J. Agric. Econ. 2012, 63, 119–141. [Google Scholar] [CrossRef]
  3. Zuzaku, A. Marketing research is path towards the development of agriculture in Kosovo. In Economic and Social Development: Book of Proceedings; Varazdin Development and Entrepreneurship Agency: Varazdin, Croatia, 2014; pp. 488–496. [Google Scholar]
  4. Alboghdady, M.A. nonparametric model for measuring impact of inputs density on Egyptian tomato production efficiency. Int. J. Food Agric. Econ. 2014, 2, 81–90. [Google Scholar]
  5. Nikolla, M.; Meco, M.; Bou Dib, J.; Belegu, M.; Qinami, I.; Dulja, X.; Kadiu, E. Increasing the efficiency of the Albanian agricultural farms using the DEA model. J. Food Agric. Environ. 2013, 11, 1286–1290. [Google Scholar]
  6. Kaciu, S.; Babaj, I.; Aliu, S.; Demaj, I. Potential of protected vegetable production in Kosovo and future perspectives. Acta Hortic. 2016, 1142, 461–466. [Google Scholar] [CrossRef]
  7. Toloo, M.; Salahi, M. A powerful discriminative approach for selecting the most efficient unit in DEA. Comput. Ind. Eng. 2018, 115, 269–277. [Google Scholar] [CrossRef]
  8. Banker, R.D.; Cooper, W.W.; Charnes, A. Some models for estimating technical and scale inefficiencies in data envelopment analysis. Manag. Sci. 1984, 30, 1078–1092. [Google Scholar] [CrossRef]
  9. Banker, R.D.; Cooper, W.W.; Seiford, L.M.; Thrall, R.M.; Zhu, J. Returns to scale in different DEA models. Eur. J. Oper. Res. 2004, 154, 345–362. [Google Scholar] [CrossRef]
  10. Charnes, A.; Cooper, W.; Rhodes, E. Measuring the efficiency of decision making units. Eur. J. Oper. Res. 1978, 2, 429–444. [Google Scholar] [CrossRef]
  11. Korhonen, P.; Joro, T. Extension of Data Envelopment Analysis with Preference Information: Value Efficiency; Springer: Berlin, Germany, 2015. [Google Scholar]
  12. Tomek, W.G.; Kaiser, H.M. Agricultural Product Prices; Cornell University Press: Ithaca, NY, USA, 2014. [Google Scholar]
  13. Khan, S.A.M.N.; Ramli, R.; Baten, M.D. A slack based enhanced DEA model with undesirable outputs for rice growing farmers efficiency measurement. Int. J. Supply Chain Manag. 2018, 7, 194–200. [Google Scholar]
  14. Kaciu, S.; Horticultural Promotion in Kosovo (HPK). Project Funded by the Governments of Switzerland and Denmark. Available online: http://helvetas-ks.org/documentation/technical_reports/Study_of_the_current_situation_of_pepper_production_in_Kosovo_HPK_Prishtina_35.pdf (accessed on 2 August 2018).
  15. Zalkuw, J.; Singh, R.; Pardhi, R.; Gangwar, A. Analysis of technical efficiency of tomato production in Adamawa State, Nigeria. Int. J. Agric. Environ. Biotechnol. 2014, 7, 645–650. [Google Scholar] [CrossRef]
  16. Thimmareddy, K.; Desai, B.; Vinoda Kumar, S. Uptake of NPK, availability of NPK and quality parameters of Bt cotton (‘Gossypium hirsutum’ L.) as influenced by different bio-fertilizers and ‘In-situ’ green manuring under Irrigation. Int. J. Agric. Environ. Biotechnol. 2013, 6, 623–628. [Google Scholar] [CrossRef]
  17. Dumas, Y.; Dadomo, M.; Di Lucca, G.; Grolier, P. Effects of environmental factors and agricultural techniques on antioxidant content of tomatoes. J. Sci. Food Agric. 2003, 83, 369–382. [Google Scholar] [CrossRef]
  18. Mader, P.; FlieBbach, A.; Dubois, D.; Gunst, L.; Padrout, F.; Urs, N. Soil fertility and biodiversity in organic farming. Science 2002, 296, 1694–1697. [Google Scholar] [CrossRef] [PubMed]
  19. Sohail, L. Effect of Organic Fertilizer on Plant Performance in Greenhouse Vegetable Production. Master’s Thesis, University of Windsor, Windsor, ON, Canada, 2008. [Google Scholar]
  20. Heeb, A.; Lundegårdh, B.; Savage, G.; Ericsson, T. Impact of organic and inorganic fertilizers on yield, taste, and nutritional quality of tomatoes. J. Plant Nutr. Soil Sci. 2006, 169, 535–541. [Google Scholar] [CrossRef]
  21. Cooper, W.W.; Seiford, L.M.; Tone, K. Data Envelopment Analysis: A Comprehensive Text with Models, Applications, References and DEA-Solver Software; Kluwer Academic Publishers: Alphen aan den Rijn, The Netherlands, 2002. [Google Scholar]
  22. Li, N.; Jiang, Y.; Yu, Z.; Shang, L. Analysis of agriculture total-factor energy efficiency in China based on DEA and malmquist indices. Energy Procedia 2017, 142, 2397–2402. [Google Scholar] [CrossRef]
  23. Bowen, B.H.; Myers, J.A.; Myderrizi, A.; Hasaj, B.; Halili, B. Kosovo Household Energy Consumption Facts and Figures. Available online: https://www.rit.edu/research/cenr/kosovo-household-energy-consumption-facts-and-figures-0 (accessed on 2 August 2018).
  24. Ministry of Economic Development. Energy Strategy of the Republic of Kosovo 2017–2026. Ministry of Economic Development, 2017. Available online: https://mzhe-ks.net/repository/docs/Kosovo_Energy_Strategy_2017_-_26.pdf (accessed on 2 August 2018).
  25. Rodriguez, J.C.; Shaw, N.L.; Cantliffe, D.J. Influence of plant density on yield and fruit quality of greenhouse-grown Galia muskmelons. HortTechnology 2007, 17, 580–585. [Google Scholar]
  26. Haile, M.G.; Kalkuhl, M.; Usman, M.A. Market information and smallholder farmer price expectations. Afr. J. Agric. Resour. Econ. 2015, 10, 297–311. [Google Scholar]
  27. Jaleta, M.; Gardebroek, C. Farm-gate tomato price negotiations under asymmetric information. Agric. Econ. 2007, 36, 245–251. [Google Scholar] [CrossRef]
  28. Barry, P.J.; Hopkin, J.A.; Baker, C.B. Financial Management in Agriculture; Interstate Printers and Publishers: Danville, IL, USA, 1988. [Google Scholar]
  29. El Benni, N.; Finger, R.; Mann, S. The effect of agricultural policy change on income risk. In Proceedings of the 123rd EAAE Seminar, Dublin, Ireland, 23–24 February 2012. [Google Scholar]
  30. Blank, S.C.; Erickson, K.W. Agricultural household hedging with off-farm income. West. Econ. Forum 2007, 6, 1–13. [Google Scholar]
  31. Li, L.; Wu, W.; Giller, P.; O’Halloran, J.; Liang, L.; Peng, P.; Zhao, G. Open accesslife cycle assessment of a highly diverse vegetable multi-cropping system in Fengqiu county, China. Sustainability 2018, 10, 983. [Google Scholar] [CrossRef]
  32. Błażejczyk-Majka, L.; Kala, R.; Maciejewski, K. Productivity and efficiency of large and small field crop farms and mixed farms of the old and new EU regions. Agric. Econ. 2012, 58, 61–71. [Google Scholar] [CrossRef]
  33. Ahearn, M.; Sterns, J. Direct-to-consumer sales of farm products: Producers and supply chains in the Southeast. J. Agric. Appl. Econ. 2013, 45, 497–508. [Google Scholar] [CrossRef]
  34. Sephton, P.S. Spatial arbitrage in Sarawak pepper prices. Can. J. Agric. Econ. 2010, 59, 405–416. [Google Scholar] [CrossRef]
  35. Huang, C.L.; Lin, B.H. A hedonic analysis of fresh tomato prices among regional markets. Rev. Agric. Econ. 2007, 29, 783–800. [Google Scholar] [CrossRef]
  36. Provenzano, G.; Cots, L.; Monserrat, J.; Autovino, D.; Barragán, J. Determining optimal seasonal irrigation depth based on field irrigation uniformity and economic evaluations: Application for onion crop. J. Irrig. Drain. Eng. 2016, 142, 1943–4774. [Google Scholar]
  37. Barragan, J.; Cots, L.; Monserrat, J.; Lopez, R.; Wu, I.P. Water distribution uniformity and scheduling in micro-irrigation systems for water saving and environmental protection. Biosyst. Eng. 2010, 107, 202–211. [Google Scholar] [CrossRef] [Green Version]
  38. Caswell, M.F.; Zilberman, D. The effects of well depth and land quality on the choice of irrigation technology. Am. J. Agric. Econ. 1986, 68, 798–811. [Google Scholar] [CrossRef]
  39. Balliu, A.; Kaçiu, S. Potential of the Greenhouse Industry in Kosovo. 2008. Available online: https://www.researchgate.net/profile/Astrit_Balliu2/publication/312095699_Potential_of_the_greenhouse_industry_in_Kosovo/links/586f7d2508ae6eb871bf5620/Potential-of-the-greenhouse-industry-in-Kosovo.pdf (accessed on 2 August 2018).
  40. Balcombe, K.; Fraser, I.; Rahman, M.; Smith, L. Examining the technical efficiency of rice producers in Bangladesh. J. Int. Dev. 2006, 19, 1–16. [Google Scholar] [CrossRef]
  41. Theodoridis, A.M.; Anwar, M.M. A comparison of DEA and SFA methods: A case study of farm households in Bangladesh. J. Dev. Areas 2011, 45, 95–110. [Google Scholar] [CrossRef]
  42. Coelli, T.; Rahman, S.; Thirtle, C. Technical, allocative, cost and scale efficiencies in Bangladesh rice cultivation: A non-parametric approach. J. Agric. Econ. 2002, 53, 607–626. [Google Scholar] [CrossRef]
  43. United Nations, Food and Agriculture Organization. Good Agricultural Practices for Greenhouse Vegetable Production in the South East European Countries: Principles for Sustainable Intensification of Smallholder Farms; United Nations, Food and Agriculture Organization: Rome, Italy, 2017. [Google Scholar]
  44. Kosovo Report 2006. Available online: https://ec.europa.eu/agriculture/sites/agriculture/files/external-studies/2006/applicant/kosovo_en.pdf (accessed on 2 August 2018).
Figure 1. Efficiency representation of greenhouse tomato producing regions. (a) Greenhouse tomatoes: BCC input-oriented efficiency; (b) Greenhouse tomatoes: CCR input-oriented efficiency.
Sustainability 10 02768 g001
Figure 2. Efficiency representation of greenhouse pepper producing regions. (a) Greenhouse peppers: BCC input-oriented efficiency; (b) Greenhouse peppers: CCR input-oriented efficiency.
Sustainability 10 02768 g002
Table 1. A descriptive summary of the regression variables.
Choice of VariablesDescription
Tomato/pepper variables (X)
T / PCROP i 1 = for a crop nutrition training need, 0 = otherwise
T / PPOWER i 1 = electricity as the power source, 0 = for fuel
T / PROWS i Number of tomato/pepper rows per greenhouse
T / PWHOLE i Wholesale price per kilogram of tomatoes/peppers
T / PEXREV i 1 = for having external revenue, 0 = otherwise
T / POTHER i 1 = for other greenhouse crops grown, 0 = otherwise
T / PFARM i Farmer market price per kilogram of tomatoes/peppers
T / PWELL i Well depth in meters
T / PWATER i Irrigation equipment value in euros
T / PEDU i Education in years
T / PFAMILY i Number of family members
Tomato/pepper dependent variable (y)
T/PDEPTomato/pepper technical efficiency scores
Table 2. Summary of greenhouse tomato farms’ efficiencies.
BCC Input-Oriented EfficiencyCCR Input-Oriented Efficiency
E Range# of farms%E Range# of farms%
0.2 ≤ E < 0.311.10.1 ≤ E < 0.277.4
0.3 ≤ E < 0.411.10.2 ≤ E < 0.32930.9
0.4 ≤ E < 0.599.60.3 ≤ E < 0.41414.9
0.5 ≤ E < 0.61516.00.4 ≤ E < 0.51212.8
0.6 ≤ E < 0.71516.00.5 ≤ E < 0.677.4
0.7 ≤ E < 0.81111.70.6 ≤ E < 0.755.3
0.8 ≤ E < 0.977.40.7 ≤ E < 0.822.1
0.9 ≤ E < 144.30.8 ≤ E < 0.911.1
E = 13133.00.9 ≤ E < 122.1
E = 11516.1
Total94100.2 94100.1
Note: BCC, Banker-Charnes-Cooper; CCR, Charnes-Cooper-Rhodes, E, efficiency; #, number; %, percentage.
Table 3. Comparison of input values for scale efficient and scale inefficient greenhouse tomato farms.
SE (N = 15)DRS (N = 79)
MaterialsUnitMeanCVMeanCV
Inputs
Insecticideliter1071.511571.25
Labordays700.40960.27
Greenhouse aream29551.166440.96
Greenhouse valueeuro16,7331.6614,1911.20
Planting phase fertilizer:
Organickg54331.2470581.05
Artificialkg231.61472.91
Flowering phase fertilizer:
Crystallinekg126.5361.22
Artificialkg00212.10
Output
Yieldkg20,6730.7877560.98
Note: SE, scale efficiency, DRS, decreasing returns to scale, CV, coefficient of variation. Increasing returns to scale (IRS) were absent since greenhouse tomato farms experienced only SE or DRS.
Table 4. Summary of greenhouse pepper farms’ efficiencies.
BCC Input-Oriented EfficiencyCCR Input-Oriented Efficiency
E Range# of farms%E Range# of farms%
0.3 ≤ E < 0.412.40.1 ≤ E < 0.212.4
0.4 ≤ E < 0.500.00.2 ≤ E < 0.349.5
0.5 ≤ E < 0.612.40.3 ≤ E < 0.449.5
0.6 ≤ E < 0.712.40.4 ≤ E < 0.5614.3
0.7 ≤ E < 0.8716.70.5 ≤ E < 0.612.4
0.8 ≤ E < 0.9614.30.6 ≤ E < 0.7614.3
0.9 ≤ E < 149.50.7 ≤ E < 0.8511.9
E = 12252.40.8 ≤ E < 0.924.8
0.9 ≤ E < 124.8
E = 11126.2
Total42100.1 42100
Note: BCC, Banker-Charnes-Cooper, CCR, Charnes-Cooper-Rhodes, E, efficiency, #, number, %, percentage.
Table 5. Greenhouse pepper efficient input values.
SE (N = 11)IRS (N = 3)DRS (N = 28)
MaterialsUnitMeanCVMeanCVMeanCV
Inputs
Insecticidel1001.26671.721191.13
Labordays800.19820.22900.24
Greenhouse aream27450.573830.086240.58
Planting phase fertilizer:
Organickg72270.2888670.1271000.78
Flowering phase fertilizer:
Crystallinekg121.83390.92240.96
Artificialkg551.8500411.56
Output
Yieldkg72410.5729670.6638100.81
Note: SE, scale efficiency, DRS, decreasing returns to scale, IRS, increasing returns to scale, CV, coefficient of variation.
Table 6. Linear regression results.
Greenhouse Tomato ModelGreenhouse Pepper Model
95% CI 95% CI
VariableβSELowerUpperβSELowerUpper
Crop nutrition training−0.144 *(0.074)−0.2880.001
Power source (electricity or fuel)−0.188 ***(0.053)−0.292−0.084
Rows per greenhouse0.012 ***(0.004)0.0050.019
Wholesale price per kg−0.364 **(0.169)−0.694−0.033
External revenue −0.015(0.083)−0.1770.148
Farmer market price per kg 0.044(0.062)−0.0770.166
Other crops grown −0.145 ***(0.050)−0.244−0.047
Well depth in meters 0.023(0.014)−0.0040.050
Irrigation in euro value−0.0001(0.0001)−0.00030.000030.0005 **(0.0002)0.00010.0009
Education in years−0.017 *(0.009)−0.034−0.00010.007(0.014)−0.0210.034
Family members0.005(0.007)−0.0070.018−0.054 ***(0.017)−0.087−0.020
(Constant)0.802 ***(0.145) 0.905 ***(0.290)
Observations9442
R20.3090.462
Adjusted R20.2520.351
Residual Std. Error0.248 (df = 86)0.224 (df = 34)
F Statistic5.484 *** (df = 7; 86)4.173 *** (df = 7; 34)
Note: β, regression coefficient, SE, standard error, CI, confidence interval. The statistical significance of the variables is represented by * p < 0.1, ** p < 0.05, *** p < 0.01.

