Article

Sustainable Selective Mitigation Interventions towards Effective Earthquake Risk Reduction at the Community Scale

Department of Structures for Engineering and Architecture, University of Naples Federico II, 80125 Naples, Italy
*
Author to whom correspondence should be addressed.
Sustainability 2018, 10(8), 2894; https://doi.org/10.3390/su10082894
Submission received: 25 July 2018 / Revised: 7 August 2018 / Accepted: 9 August 2018 / Published: 15 August 2018
(This article belongs to the Special Issue Disasters, Crisis, Hazards, Emergencies and Sustainable Development)

Abstract

:
Risk reduction policies are crucial in regions of high seismic risk, having significant exposure and building vulnerability. In Italy, the Sismabonus incentive mechanism was recently approved, which regulates the possibility of benefiting tax deductions after seismic strengthening interventions on buildings. This paper presents a simplified approach for evaluating the effects of implementation of the Sismabonus policy at the territorial scale. Considering only reinforced concrete RC building typologies, a speed method for calculating the probability of being in relevant risk classes is introduced and it is applied to a town in southern Italy. The evaluation is based on simplified modeling of lateral seismic behavior and on the estimate of the peak ground acceleration corresponding to the attainment of building capacity. The effect of possible retrofit interventions is also considered. This performance-based procedure allows for taking into account the cost for selective retrofit interventions and contemporarily to estimate the variation of mean expected annual loss that is obtained with building upgrading.

1. Introduction

It is well-known that seismic risk for a region depends on the hazard, on the vulnerability of the assets at risk and on the exposure. Seismic hazards, indicating the probability of having earthquakes of assigned intensity in a given interval of time, depends on seismicity that is a physical characteristic of an area. Seismic vulnerability for buildings expresses their potential for damage due to seismic events. More vulnerable buildings (e.g., those with inadequate design, with poor material properties or lack of maintenance) will probably exhibit greater damage after an earthquake. Finally, exposure depends on the buildings type and consistency (number) and on occupancy, that informs on population distribution and economic value of the exposed assets.
In the assessment and retrofit design process of existing structures, the aspects related to building’s future performances as well as to intervention sustainability are crucial. The sustainability can be quantified in terms of social, environmental and economic losses and can be adopted as a useful proxy in decision-making and risk-mitigation processes [1]. In regions of high seismic risk, the social outcome (downtime, injuries or fatalities), the environmental outcome (energy wastes and carbon dioxide emission due to the repair/reconstruction of severely damaged buildings) and the direct economic losses (repair/strengthening/reconstruction) can strongly affect sustainability. Therefore, there is a strong need to promote risk reduction policies in hazard prone countries where there are also high exposure and vulnerability. Not being possible to intervene on seismic hazard, basic policy approaches aimed at disaster mitigation are either oriented to reducing the exposure (e.g., through growth restrictions or land-use regulations) either to mitigating the consequences of events. The latter goal may be pursued by enhancing preparedness information, improving building codes for new buildings or promoting retrofit interventions for unsafe existing ones. However, as observed by the authors of [2], reducing the exposure to risks is hard to realize, while the desire to live and work in particular regions often limits serious attention to these kinds of risk mitigation policies. Also, policies promoting safe development (e.g., by the enforcement of new building codes) apply only to the new constructions. There are limited examples of codes where mandatory assessment for some typologies of existing buildings is required. For Unreinforced Masonry Buildings or wood-frame buildings in California, the building owners have to retrofit the building if it is found to be unsafe [3]. However, the state generally does not have the power to enforce the application of retroactive seismic codes for private building owners. More attempts to regulate safety checks and retrofitting for public or strategic buildings such as schools or hospitals can be found (e.g., the Field Act [4] and Hospital Safety Act [5] in California, the Act for Promotion of the Seismic Retrofit of Buildings in Japan [6], the Ordinance 3274 [7] in Italy). Another strategy that has been attempted in several countries is the institution of public incentives towards risk reduction, albeit these initiatives are contingent and depend on temporary availability of resources. Examples of nationwide programs to reduce risks to life and property resulting from earthquakes are NEHRP (National Earthquake Hazards Reduction Program) in the U.S., the National Platform for Disaster Risk Reduction in Chile or the national plan for the seismic risk reduction in Italy.
While nation-wide hazard risk reduction programs are clear in intention, the effective local governmental willingness and ability to undertake mitigation measures is not as clear. In particular, it is generally not defined to what extent the available resources can be employed in practice, especially if a co-funding with local capital is required. Several studies call attention to the role of state requirements and the influence of differing local political and economic contexts in shaping regulatory actions by local governments, or to possible different approaches in the policy implementation (e.g., distinguishing between broad application of mitigation measures, focused selective measures on fewer building categories etc.) [2,8].
In Italy, the Sismabonus incentive mechanism was recently approved, which regulates the possibility to benefit of tax deductions after seismic strengthening interventions on buildings [9,10,11,12]. In order to get the economic incentive, the citizens, on a voluntary base, shall apply with a request (through a designated technician) demonstrating the variation of a suitably evaluated “risk class” for the building from the initial state to the final state after retrofit. The tax deduction is increasingly higher for major demonstrated reduction of the risk class.
This paper presents a simplified approach for evaluating the effects of implementation of the Sismabonus policy at the territorial scale (i.e., with reference to a town or a town district and evaluating the risk class for relevant building typologies identified in the interested area). In particular, considering only RC building typologies, a speedy method for calculating the probability of being in relevant risk classes is introduced. The evaluation is based on simplified modeling of lateral seismic behavior and on the estimate of the peak ground acceleration corresponding to attainment of building capacity (PGAc) for relevant limit states, namely damage limitation (SLD) and life safety limit state (SLV). The effect of possible retrofit interventions is also considered, suitably modifying the building model and re-calculating the risk class after seismic upgrading. Selective solutions increasingly mitigating the earthquake effects and with corresponding variable costs are investigated. This performance-based procedure for evaluation of the modified risk-class allows for taking into account the cost for selective retrofit interventions and to estimate the variation of mean expected annual loss that is obtained with building upgrading [10,11]. The procedure is applied for a town in southern Italy, quantitatively comparing the selected building retrofit solutions towards the reduction of the seismic risk class and of the expected annual losses at the territorial scale. In this paper, only the economic issues in terms of direct losses for sustainability purposes are explicitly accounted. In particular, a cost benefit analysis allows for a comparison of the benefits obtained from reduction of expected losses with the costs incurred for the application of the selected retrofit interventions, and to choose preferable solution also in presence of budget constraints.
In Section 2 the Sismabonus incentive mechanism is presented and the procedures to implement it are briefly explained. Section 3 presents the approach to determine the probability of being in a seismic risk class according to the Sismabonus classification scheme. In particular, the procedure is based on automatic modeling and simplified nonlinear static analysis of a large number of buildings within a building typology. Section 3.1 gives a synthetic description of the building modeling approach and on evaluation of seismic capacity; Section 3.1.1 introduces possible local retrofit solutions and the relative modeling and Section 3.2 explains the probabilistic evaluation in a Montecarlo simulation framework. Section 4 presents an application for a town in southern Italy located in seismicity Zone 2, showing the practical evaluation of the probability of being in a seismic risk class SRC for two building typologies. Increasing levels of possible retrofit solutions are considered and their effect is shown in terms of SRC variation. Moreover, cost benefit analysis is performed showing the convenience of application of the considered retrofit solutions. Also, the evaluation is repeated in other two seismic zones (Zone 1 and Zone 3) showing the effect of hazard variation on the results. Finally, in Section 5 the results are discussed and conclusions presented.

2. The Sismabonus Incentive Mechanism

According to the Guidelines for the seismic risk classification of the constructions [9], the seismic risk class SRC for a building is the minimum between the class defined by the building safety index at the ultimate limit state IS-V (C-IS-V) and the one related to expected annual loss EAL (C-EAL). IS-V, also known as percentage of New Building Standard %NBS, is defined as IS-V = PGAc/PGAd, where PGAd is the anchoring peak ground acceleration related to the design acceleration spectrum for life safety limit state (SLV) according to Italian current seismic code [13] and PGAc is the minimum anchoring peak ground acceleration on a rock or a stiff site such as to determine building conventional collapse for brittle or ductile failure modes (see Figure 1a,b). Based on the IS-V a corresponding C-IS-V risk class can be determined, as reported in Table 1 (1st and 2nd column). The table shows that construction built as required by current design codes are in the higher class A+IS-V, while it is considered that also buildings with slightly lower capacity with respect to the design requirements are classifiable as AIS-V. The building safety index is a widely used parameter to evaluate the state of a construction with respect to new building standards [14,15,16]. The L’Aquila 2009 post-earthquake ordinance [17], established that damaged buildings having IS-V < 0.6 (classified with CIS-V or lower class according to Table 1) should be upgraded and a fund to increase the seismic capacity such as to reach a minimum IS-V = 0.6 and up to IS-V = 0.8 was granted (with maximum funding of 400 €/m2).
C-EAL depends on the area under the curve of the expected annual losses. The latter can be easily obtained considering the annual frequency λ (inverse of return period TR) corresponding to PGAc at different limit states and the associated percentage of reconstruction costs %RC (see Figure 1c,d). Based on the value of EAL a corresponding C-EAL risk class can be determined, as reported in Table 1, 3rd and 4th column.
Figure 1 exemplifies the steps for evaluation of a building risk class. The first step is the evaluation of the building seismic capacity corresponding to the attainment of relevant limit states according to the seismic code. The four limit states of operational (SLO), damage limitation (SLD), life safety (SLV) and collapse (SLC) are considered; Figure 1a shows an example of evaluation using nonlinear static analysis, but any other analysis method available and recognized by the code (e.g., response spectrum analysis) could be used. Once the seismic capacity for each limit state is determined, the corresponding peak ground acceleration PGAc has to be calculated.
To this end, given the spectral shape, several approaches could be used; Figure 1b exemplifies the evaluation with the Capacity Spectrum Method implementing the N2 method [18]. This method is also codified in the Italian seismic code [13] or the Eurocode 8 [19], but other methods could be used (e.g., SPO2IDA [20]).
Having calculated PGAc,SLV the IS-V, and the corresponding C-IS-V class from Table 1, are immediately determined. Next, given PGAc,LS for the generic limit state, the corresponding return period Trc,LS and related annual frequency λLS (=1/Trc,LS) have to be determined. The seismic demand PGAd,LS at the generic limit state corresponds to an assigned return period from the code [13], namely TR = 30, 50, 475 and 975 years for the SLO, SLD, SLV and SLC limit states respectively. Then the guidelines [9] suggest adopting a simplified formulation (see second equation in Figure 1c) for calculation of relevant Trc,LS. Assuming η = 1/0.41, as suggested in [9], an approximate interpolation of seismic hazard on the entire national territory is applied. However, it is still possible to calculate Trc,LS based on the seismic hazard at the site employing more specific η values depending on local seismicity. Values of reconstruction costs %RC associated to the limit states (see table in Figure 1c), define the percentage of the cost of new construction including costs of nonstructural parts and systems. They were estimated using Macroseismic analyses and the actual repair costs that were monitored in the reconstruction process following recent Italian earthquakes [21,22]. Next, the λ-%RC curve is built starting from the points evaluated at the four mentioned limit states (see Figure 1d) and considering additional two points: (i) for damage initiation limit state SLID, conventionally set to (λ-%RC) = (0.1%–0%); and (ii) for total loss or reconstruction limit state (SLR), conventionally set to (λ-%RC) = (λSLC-100%). The area under the λ-%RC curve represents all the possible losses that are associated to the different annual frequencies of earthquakes, that is the mean expected annual loss EAL. Based on the value of EAL the C-EAL class can be determined (see Table 1).
Finally, the building seismic risk class SRC is the minimum between C-IS-V and C-EAL; SRC = min(C-IS-V, C-EAL). This performance-based approach for calculation of a building risk class allows for balancing a financial based assessment (that relies on the economic value and potential economic losses through the C-EAL) with an evaluation that takes into account the value of life (that is implicitly included in the safety index IS-V and the related C-IS-V class).
A practical facilitation for calculation of EAL is also foreseen in the guidelines. In fact, while explicit evaluation is possible for all the limit states, the guidelines give the possibility to calculate only the limit states SLD and SLV and to derive the other ones as their function considering λSLO = 1.67λSLD and λSLC = 0.49λSLV.

3. Probabilistic Assessment of Seismic Risk Class for Infilled RC Buildings

This section explains the methodology used to derive the probability of being in risk class for existing RC building typologies. Figure 2 outlines the salient features of the method. First it is necessary to assemble suitable model to determine building seismic capacity. The model need to be not too sophisticated to allow speedy analyses for great number of buildings, taking into account possible variation of relevant structural and mechanical parameters within a class. At the same time, it should allow for capturing the attainment of relevant limit states for the building (see Figure 2a).
Nonlinear static pushover curves are performed for a number of building models in the framework of a Montecarlo simulation method (Figure 2b). Taking advantage of the possibility to derive other significant limit states as a function of SLD and SLV towards evaluation of EAL and estimation of C-EAL, only the SLD and SLV limit states are detected along each curve and transformed in the relative PGAc.
Section 3.1 gives a synthetic description of the building modeling approach, pushover analysis and evaluation of lateral seismic capacity for the generic building in a class, while a more detailed explanation can be found in [23]. The statistical treatment of the PGAc obtained after Montecarlo simulation allows for evaluating the relative probability density functions at SLD and SLV. By using the definition of the safety index IS-V, it also allows for determining the pdf of IS-V (see Figure 2c). Next, the λSLD and λSLV can be calculated using the formulations proposed in [9] while λSLO and λSLC are derived as a function of λSLD and λSLV (see 2nd and 3rd equation in Panel 3 of Figure 1 and end part of Section 2). Associating the relative %RC to each limit state, the λ-%RC curve is obtained and the EAL easily calculated. Starting from median and percentile statistics of PGAc,SLD and PGAc,SLV, the associated median and percentile λ-%RC are determined and the relative probability density function of the EAL can be built (see Figure 2d). Section 3.2 illustrates the simulation-based approach for probabilistic estimation of building risk class.

3.1. Building Model and Evaluation of Seismic Capacity

Building modeling and analysis is performed using a simplified version of a mechanical based procedure for class scale vulnerability evaluation already presented in [24]. Differently from [24], here the nonlinear model, that refers to regular buildings of rectangular shape, is built in the hypothesis that ends of the columns are restrained against rotation (Shear Type model). This simplifying hypothesis allows for reproducing the seismic response of existing buildings with a reasonable degree of approximation. It also allows for reducing the computational effort, that is a crucial aspect when large scale analyses have to be performed. This way, the lateral response of the structure under a given distribution of lateral forces can be determined based on the interstorey shear-displacement relationships at each storey. Thanks to regularity, torsional effects can be discarded and the interstorey shear-displacement relationships can be built for each analyzed direction (longitudinal X and transversal Y) and for each storey. They are obtained by simply summing up the contribution of the columns in the same direction. Figure 3 shows schematic representation of the generic plane frame and the nonlinear modelling for RC columns. Plastic hinges are modeled with a tri-linear moment-rotation envelope, with suitably identified cracking and yielding as characteristic points (see right-up panel in Figure 3).
The pushover curve, plotting the variation of base shear Vb along with the displacement of a control point for the structure, e.g., the top displacement Δtop, is a synthetic representation of the results on nonlinear static analysis. Example pushover curves are shown in Section 4. The attainment of seismic capacity at relevant limit states can also be detected along the pushover curve.
In view of code-based assessment of the building capacity, SLD and SLV limit states are determined according to code prescriptions. Concerning SLD, modern codes such as EC8 [19] and the Italian code [13], prescribe that maximum interstorey drift IDRmax should not exceed 5‰ for buildings having brittle non-structural components connected to the structure (e.g., in case of brick infills). SLV corresponds to the first attainment among brittle or ductile failure in structural elements and joints. The flexural rotation θu corresponding to the ultimate chord rotation for ductile members is evaluated according to the proposal of the Italian code [13]. However, lateral seismic capacity in existing gravity load designed (GLD) RC buildings or RC buildings designed with obsolete seismic codes, where capacity design rules are not applied, usually depends on premature brittle failures: failure of unconfined lateral joints or shear failure in columns [25,26,27,28]. GLD buildings typically have no transverse reinforcement in the joint region. Due to the lack of shear reinforcement, the shear strength of the joint panel zone is only provided by concrete resistance and can be directly related to the principal tensile or compressive strength of the concrete [23]. Limited values of tensile and compressive principal stresses, σnt and σnc, are established according to Italian seismic code [29]. The right-bottom panel in Figure 3 shows a schematic representation of an unconfined corner joint with determination of shear solicitation Vn on the joint panel; Vn depends on the solicitations on confining columns and beam. Shear strength for the columns is evaluated according to Eurocode 8-part 3 [19]. The failure of columns is often brittle due to inadequate transverse reinforcement.
Once the lateral seismic capacity is detected along the pushover curve for both SLD and SLV, the corresponding PGAc must be determined. In this paper, the N2 framework [18] is employed to evaluate the spectral ordinate Sa(T) corresponding to seismic capacity. Then, given the shape of the elastic pseudo-acceleration response spectrum, Sa(T) is scaled by the spectral amplification factor at period T to evaluate PGAc.

3.1.1. Modeling of Local Retrofit Interventions

The structural performances of an existing building can be enhanced in different ways by increasing the structural capacity in terms of ductility, stiffness or strength or by reducing the seismic demand. Many local or global strategies could be adopted [13,30]. In particular, local interventions such as concrete jacketing of selected columns, confinement by Active Confinement of Manufactured (CAM) or Fiber Reinforced Polymers (FRP) of columns and joints (i.e., that avoids brittle failure modes [31]), are some of the preferred solutions in the Italian context [21]. Indeed, they allow for upgrading the seismic performance of the buildings while keeping retrofit costs down. Global strength and stiffness enhancement, obtained by adding RC shear walls or steel bracing, or the reduction of the seismic demand through base isolation of the structure are instead limited, due to the invasiveness and the high costs of the interventions.
Among the available strategies, an effective solution for existing RC structures could be based on local modification of inadequate components. Local strengthening methods are meant to increase the strength or deformation capacity of deficient components, so that they will not attain their specified limit state under the design seismic excitation. The strategy adopting FRPs as the main retrofit solution for beams, columns and beam-column joints resulted to be one of the most applied to upgrade existing under-designed RC buildings after L’Aquila earthquake [32]. In this paper, with the aim of investigating the effect of widely used retrofit solutions, the strategy employing externally bonded FRP reinforcement is applied for building upgrading. It has been previously demonstrated that this strategy represents a fast and cost-effective improvement in seismic performance [33]; moreover, the effectiveness of using FRPs as a strengthening technique has been also proven by the recent earthquakes (i.e., Central Italy earthquake 2016) [32]. It also has the advantage of only requiring the assessment of local components capacity to increase, without the need to perform a new global analysis of building response, provided that global mass and structural stiffness are not significantly affected by the local strengthening intervention.
The corner joints, that are located at the terminal part of the perimeter frames, are typically weaker with respect to interior ones, because of the lower confinement and the more complex stress field related to the longitudinal reinforcement end anchorage. Different kinds of models were proposed to evaluate the shear capacity increase of joints strengthened by using FRP laminates.
Here, to model the effect of FRP strengthening on corner beam–column joints, the model proposed in [34] is adopted. In such a model it is supposed that the FRP system contributes to the principle tensile stress with a component that depends on the inclination of the fibers, and that the FRP fibers provide a similar contribution as the internal steel reinforcement. To evaluate the global strengthening effect on the corner joints, it is supposed to apply quadriaxial CFRP fabric with fibers inclined of 0°, ±45° and 90° at the beam axes. One or more layers of CFRP can be applied, depending on the strength increase that has to be realized. Furthermore, in order to fully prevent shear failure at the column joint interface due to local effects of infills, Steel reinforced Polymer (SRP) composites in the form of uniaxial systems are properly designed to be applied around the beam column-joint prior to application of CFRP quadriaxial fabric (Figure 4a) [33].
In order to increase the shear strength of columns with external FRP reinforcement, an effective solution is to strengthen the columns with discontinuous or continuous uniaxial carbon fiber reinforced polymers (CFRP) strips, with fibers perpendicular to the column longitudinal axis (see Figure 4b. One or more plies of CFRP can be applied, depending on the strength increase target. To evaluate the shear capacity of RC columns strengthened with FRP, the FRP contribution can be added to the original capacity of the member, as suggested by international codes provisions [30,35]. The obtained strength increase can easily be taken into account for assessment of the SLV limit state in retrofitted structures.

3.2. Seismic Risk Class for Building Typologies

A significant issue for analyses at a territorial scale is the large dimension of the building stock to be considered. It presents a large variability with respect to construction material, morphology, geometric dimensions, construction and mechanical features. In order to obtain a fast categorization to perform speedy analyses at an urban or regional scale, it is convenient to group buildings into homogeneous typologies with comparable seismic vulnerability. In addition to the preliminary classification based on the construction material (e.g., masonry or concrete buildings), most vulnerability models classify buildings based on height ranges (or storey number) and (often) construction age. The latter parameters, are consensually considered among the most influential parameters on building seismic vulnerability [36]. In this paper RC building typologies are defined based on height ranges (low or medium height) and considering only gravity load design GLD buildings. In particular, the structural model is obtained with a simulated design approach as already described in [37] and further generalized in [38,39,40]. The geometric/structural model for each building is defined as a function of a number of geometric, structural and mechanical parameters. The following assumptions are made: (i) building regular in plan and with rectangular shape; (ii) constant inter-storey height of the buildings and variable (within prefixed intervals) bay lengths in longitudinal and transversal directions; and (iii) the parameters that may be explicitly considered to influence seismic capacity are concrete strength fc, yield stress fy, surface area SA and the ratio Lx/Ly ratio (longitudinal versus transversal length). Such parameters may be extremely variable within each building typology due to intra-building variability, as well as the variation of structural configuration and material properties. Therefore, in order to explicitly consider this variation in the assessment of building risk class, the simulated design procedure can be applied in an automatic loop in the framework of a Montecarlo simulation method. In such a way, the parameters are extracted from suitable distributions (as reported for example in the application, Section 4.2); Latin Hypercube Sampling (LHS) technique [41] is adopted in order to reduce the number of simulations. For each building that is obtained in the simulation process, the nonlinear model is automatically generated. Then, as described in Section 3.1, the pushover analysis is performed. The lateral seismic capacity corresponding to SLD and SLV limit states is subsequently transformed in PGAc through the application of the N2 approach and adopting a pre-defined spectral shape. In the next section an example application with a more detailed description of the single steps for the assessment of seismic risk class is presented.

4. Application for a Town in Southern Italy

This section presents an application for evaluation of seismic risk class for RC building typologies in the town of Portici. The town is located in the south-east of Naples, down the slopes of Vesuvius volcano and facing the Tyrrhenian sea. Portici has an approximate extension of 4.5 km2 and a population of more than 55,000 inhabitants [42], with one of the higher population densities in the world.

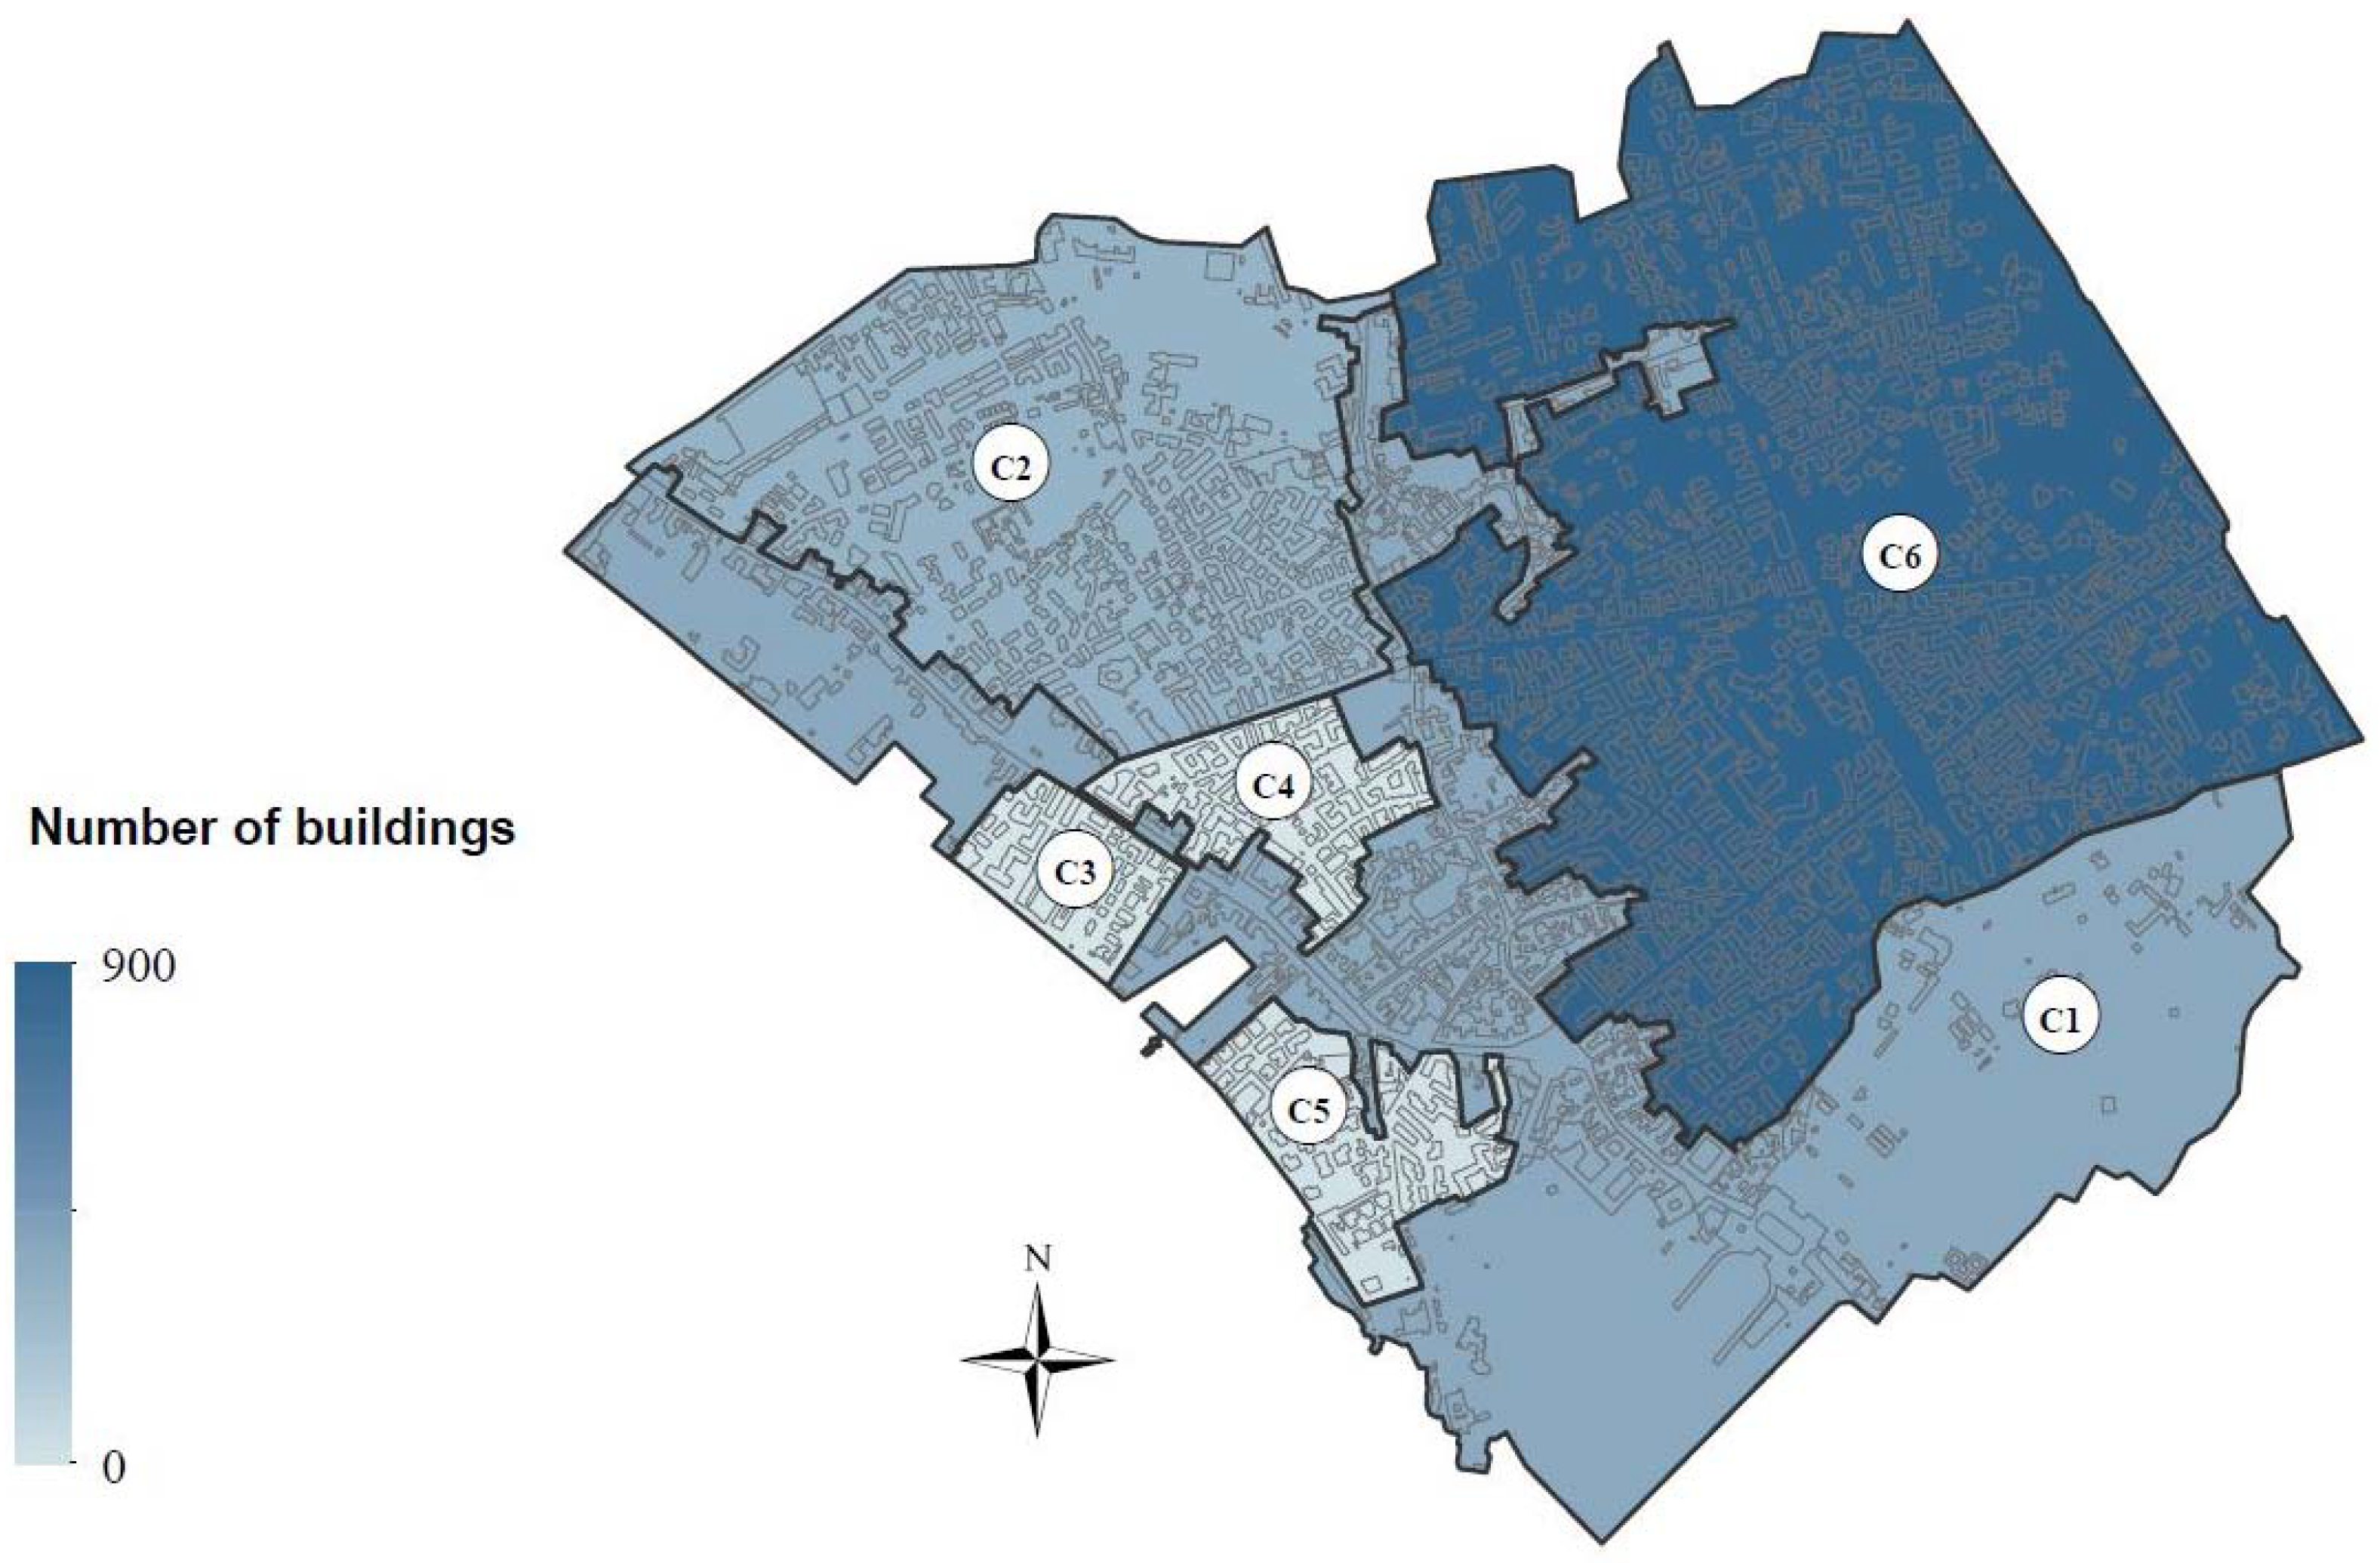
4.1. Building Inventory

The inventory for RC building typologies is assembled starting from the information reported in census returns [42] integrated with the information provided by the Cartis form compiled for the town of Portici [36]. The interview-based Cartis form, described by the authors of [43], is compiled by interviewing one or more local expert technicians with deep knowledge of the construction characteristics in the area. It allows to gather information on a greater number of building features that are relevant for the seismic behavior with respect to the data that are normally available in census databases. For example, referring to RC building typologies, in addition to construction age and storey number, additional information includes prevalent surface area SA in the typology, regularity in plan and elevation, type of resisting RC system (e.g., moment resisting frame or walls), type of infills (weak or strong) etc. Figure 5 shows the map of Portici with the town compartments identified in the framework of the Cartis approach.
Table 2 reports the number of RC buildings as well as the % of buildings for each RC typology belonging to each the compartments in Portici.
Based on information from census data and Cartis form, two main RC building typologies are identified, namely low height RC-L (with storey number Ns = 1 ÷ 3) and medium height RC-M (Ns ≥ 4) gravity load designed (GLD) buildings. Indeed, Portici was classified as seismic only in 1981, while most of the RC buildings were constructed in age ’60 s. Additional information from Cartis regards the mean surface area SA, ranging from 300 to 1200 m2, the regular disposition of infills, infills type (strong or weak) and plan regularity (regular or irregular). In this study the type of infills and plan irregularity are not considered. Future studies need to address these specific points.

4.2. Risk Classes for Building Typologies

Adopting the simulation-based approach as described in Section 3.1 and Section 3.2, population of buildings that are representative of the two typologies RC-L and RC-M are generated and analyzed in an automatic loop. To reduce the number of simulations it was chosen to represent the RC-L and RC-M typologies with buildings having 3 and 7 storeys, respectively. In particular, 3 storey buildings are higher ones in the RC-L typology, while 7 storey buildings represent the higher percentage in RC-M according to the Cartis survey. As explained in Section 3.2, the Montecarlo simulation process is applied extracting the relevant parameters from suitable distributions. Referring to the concrete and steel properties, the median and CoV for fc and fy are chosen as representative values for buildings constructed in the decade ’62–’71. Indeed, in this period most of the RC buildings where constructed according to the Cartis survey [44]. Inter-storey height of the buildings is assumed to be constant (equal to 3.0 m), while the bay lengths in longitudinal and transversal directions of the building are variable within prefixed intervals established according to typical values for existing RC buildings [25,37]. Table 3 summarizes the parameters that are considered in the simulated design process.
Figure 6 shows the pushover curves for one of the generated building models within RC-L and RC-M typologies respectively (model parameters: SA = 600 m2; Lx/Ly = 2; ax = 3.85 m, ay = 4.30 m). SLD and SLV limit states are also plotted as yellow triangle and red dots along the curves. As can be seen, the attainment of SLV limit state is premature and happens before the SLD limit state; this is due to brittle failure of exterior unconfined nodes according to the code criteria [29]. This circumstance is common for existing buildings designed only for gravity loads and not respecting capacity design principles [33]. It happens for nearly all the buildings within the considered typologies. Also shear failure in columns is another typical brittle type of crisis that happens for buildings with inadequate shear reinforcement. On the other hand, these types of brittle failures can be avoided with the application of local retrofit interventions. In this study we simulate retrofit solutions corresponding to the application of SRP uniaxial system and quadriaxial CFRP fabric for unconfined lateral joints as well as strengthening of the columns with continuous uniaxial carbon fiber reinforced polymers (CFRP) strips. Three increasing levels of retrofit are considered, namely R1, R2 and R3, corresponding to the application of 1, 2 or 3 plies of FRP for the elements (i.e., exterior beam column joints or columns) that are not verified at the SLV limit state. This type of retrofit can be modeled as described in Section 3.1.1. In particular, this retrofit strategy results particularly effective in the Sismabonus framework, since it allows increasing the seismic capacity of existing buildings and, thus, to possibly upgrade the seismic risk class by minimizing the building occupancy disruption [33].
The modified SLV limit states, with respect to no retrofit case NR, are also shown in Figure 6 (only R1 and R2 are represented). For both the 3 and 7 storey buildings, representative of RC-L and RC-M typologies, the retrofit R1 determines an increment of capacity but does not allow reaching maximum building’s lateral strength. By contrast, R2 allows for a significantly higher improvement in capacity. However, the effect of local retrofit may vary depending on the building configuration.
Figure 7 shows the λ-%RC curve obtained for the same building models and the aforementioned cases, i.e., no retrofit, and retrofit solutions R1 and R2. As it can be seen, in case of no retrofit the λ-%RC are dominated by the SLV. Indeed, due the premature brittle failures, the PGAc,SLV is lower with respect to PGAc,SLD. Because the corresponding λSLD should be greater or equal with respect to λSLV, the λ-%RC curves are shifted to the right and consequently the EAL is very high. It corresponds to the maximum value 8.2% for both the cases and to the worst C-EAL class (GEAL). On the other hand, thanks to the retrofit solutions a sensible reduction of EAL can be obtained. In case of the 3 storey building in the example, EAL decreases to 2.6% (DEAL) for R1 and to 0.8% (AEAL) for R2, while for the 7 storey building an even greater benefit is observed, with EAL downsized to approximately 0.9% (AEAL) for R1 and 0.8% (AEAL) for R2.
Figure 8 show the probability density functions for PGAc,SLD and PGAc,SLV that are obtained for the two building typologies in case no retrofit is applied and considering retrofit solutions R1, R2 and R3. Figure 8a refers to RC-L typology and Figure 8b to RC-M. For visualization purposes, the ordinates are normalized with respect to the maximum frequency for each case. It can be clearly noted the benefit of applying the FRP reinforcement, that produces a sensible shift of the distribution of PGAc,SLV for both the typologies.
Dividing the PGAc,SLV by PGAd at the site and integrating along the curve the probability of attaining the safety index IS-V is easily calculated. The PGAd at SLV limit state for Portici is comprised between 0.15 and 0.175 g. Figure 9 shows the IS-V probability curves obtained for the two considered building classes and the different retrofit options (including no retrofit). Maximum value of PGAd in the design interval is utilized to calculate IS-V.
As can be seen, for RC-L the median IS-V increases from 0.18 (that corresponds to EIS-V) in case of NR, to 0.58 (CIS-V) for R1, to 0.82 (AIS-V) for R2 and 0.98 (AIS-V) for R3. For RC-M the variation is from 0.24 (EIS-V) for NR, to 0.67 (BIS-V) for R1, to 0.84 (AIS-V) for R2 and 0.93 (AIS-V) for R3.
Applying the procedure described in Section 2, the EAL relative to each λ-%RC curve obtained in the framework of the Montecarlo simulation process is easily calculated. Figure 10 shows the EAL probability curves obtained for the two considered building classes and the different retrofit options (including no retrofit). Variation of EAL has inverted tendency with respect to IS-V. For RC-L the median EAL decreases from 7.3% (FEAL) for NR, to 3.3% (DEAL) for R1, to 2.5% (CEAL) for R2 and 2.2% (CEAL) for R3. For RC-M the variation is from 5.9% (FEAL) for NR, to 1.9% (CEAL) for R1, to 1.5% (BEAL) for R2 and 1.3% (BEAL) for R3.
The seismic risk class SRC is the minimum between C-IS-V and C-EAL. This means that for each analysis in the framework of the Montecarlo simulation the C-IS-V and C-EAL are evaluated and the corresponding SRC determined as SRC = min(C-IS-V, C-EAL). Figure 11 represents the probability of attaining the different SRC for buildings of RC-L (Figure 11a) and RC-M (Figure 11b) typologies. The cases of no retrofit NR as well as R1 to R3 retrofit solutions are considered. Due to extreme variability of building capacity in each building typology (i.e., variability of parameters such as structural configuration (Lx/Ly, ax, ay and SA) and material properties) different SRC, with variable occurrence probability, are possible for each case. As can be seen, the NR case corresponds to the higher probability of being in the worst class (the G). Indeed, most of the existing buildings belonging to the considered typologies are characterized by premature brittle failures in joints or columns. On the other hand, with the application of increasing retrofit solutions, there is a decreasing of risk class. If we denote as prevalent risk class PRC the SRC having higher probability to be attained for each case, it is observed that PRC are (G, F, B, B) for RC-L (NR, R1, R2, R3) and (G, D, A, A) for RC-M (NR, R1, R2, R3). However, for the case of R1 the ameliorating trend is present, but it does not tend to be a specific class, with classes B, D, F and G (A, C, D) having comparable probabilities for RC-L (RC-M) typology. For R2 and R3 the trend is clearer: most of the buildings belong to SRC B for RC-L and to SRC A for RC-M. However, other classes are also present for both R2 and R3.
The definition of the SRC is conditioned on the seismic demand at the site. According to [7], Italy can be divided in four different seismic zones with relevant demand in terms of PGA at SLV. With the aim of evidencing the effect of the seismic hazard on the SRC, the procedure is also applied by assuming a different seismic demand. In particular, with reference to the same building stock it is assumed to vary the demand considering other two different reference seismic zones: Zone 1 (PGA > 0.25 g) and Zone 3 (0.05 < PGA ≤ 0.15), while Portici is in Zone 2 (0.15 g < PGA ≤ 0.25 g).
The results in terms of SRC for RC-M typology are shown in Figure 12a,b with reference to a seismic demand typical of Zone 1, PGAd = 0.275 g, and Zone 3, PGAd = 0.125 g, respectively. In this case the PRC are (G, G, C, C) for Zone 1 (NR, R1, R2, R3) and (D, A, A, A) for Zone 3 (NR, R1, R2, R3), showing a higher probability of attaining the worst SRC for the zone with higher seismicity. Thus, the effects of the strengthening strategy, although less effective than in case of Zone 2 example, are still significant. Indeed, for Zone 1 the best SRC attained with application of a retrofit solution is C, for Zone 2 and 3 the class A can be attained.
For RC-L typology, depicted in Figure 13a,b, the PRC is always G for Zone 1 and (G, D, B, B) for Zone 3 (NR, R1, R2, R3). In this case the strategy appears clearly unsatisfactory in case of Zone 1 and more invasive interventions may be necessary to strongly improve the SRC. For Zone 1 an ameliorating trend is present, however only for R2 and R3 the probability of reaching class D is significant, while the probability of attaining class C is very low and that of attaining a higher class is null. For Zone 3 there is a reduction of risk class with the application of increasing retrofit solutions and the probability of being in class B/C/D is comparable.
Cost-benefit analysis (CBA) can be used to compare the costs of a retrofit strategy to the benefits achieved from improved seismic performance. There are various examples of CBA for the evaluation of selected retrofit strategies, e.g., [45]. In [46] an application of CBA for the assessment of retrofit strategies for a large building stock is presented; however, the retrofit level of the different hypothesized solutions is assigned with an expert based approach.
In the present application, the CBA is applied to evaluate the efficiency of increasing retrofit measures with a quantitative assessment based on the building analysis with and without retrofit; the application refers to a large building stock comprising two RC building typologies in the town of Portici, Zone 2 seismic demand. The indirect cost benefits, including human loss and down time, are not considered in this study, while only direct losses and the costs for the retrofit are explicitly included in the analysis.
We denote by NPVL(T, Sj, Rk) the Net Present Value (discounted) of losses over time T, due to expected earthquakes, for all structures of typology Sj retrofitted by Rk (R0 corresponds to no retrofit). Net Present Value (discounted) of losses over time T can be calculated with Equation (1):
NPV L ( T , S j , R k ) = i = 1 T SA tot ( S j ) · C R · EAL ( S j , R k ) ( 1 + r ) i
where the term r represents the discount rate, T is the time frame of interest, SAtot(Sj) represents the surface area summed over the storeys of the Sj typology, CR is the unit reconstruction cost, including costs of nonstructural parts and systems, that is expressed in €/m2 and EAL(Sj,Rk) is the median expected annual loss for building typology Sj with retrofit solution Rk. Obviously, EAL(Sj,R0) > EAL(Sj,R1) > … > EAL(Sj,R3). In this study r = 3% is adopted and a time frame of 50 years is considered. However, as noted in [45], the discount rate can have significant fluctuations (e.g., 2–6%).
The benefit of a measure Rk is determined by evaluating the reduction of losses, respect to the status quo R0. So, the overall benefit BN(T, Sj, Rk) is given by Equation (2):
BN ( T , S j , R k ) = [ NPV L ( T , S j , R 0 ) NPV L ( T , S j , R k ) ]
The cost C(Sj,Rk) of retrofitting measure Rk for all structures Sj is computed multiplying SAtot(Sj) by the unit retrofit cost for the selected measure CRet,Rk, also expressed in €/m2. Assuming that the capital expenditure happens at time the analysis is performed, no discounting of the cost C is necessary.
Once the costs and benefits of each retrofitting measure have been calculated, the attractiveness of each single measure can be evaluated by using the benefit cost ratio BCR, that is the ratio of the discounted benefits, the overall benefit BN(T, Sj, Rk), to the costs. A measure is attractive if BCR > 1.
For the case of our application it is assumed that CR = 1360 €/m2 while retrofit costs are roughly assumed CRet,Rk = 120, 150 or 180 €/m2 for k = 1, 2 or 3; such values are deduced from actual repair and retrofit costs that were monitored in the reconstruction process following recent Italian earthquakes [21,22].
Table 4 resumes the results of the CBA for the two considered building typologies and assuming three retrofit levels. As it can be seen, thanks to significant reduction of EAL, mainly related to the contribution at SLV given by the strengthening solution, all the retrofit strategies are convenient. However, it is plausible that a budget constraint limits the possible costs devolved to retrofitting. For example, if a maximum budget of 100 million of Euros is available, the only solution R1 for building typology RC-L would be applicable.
Moreover, in a large-scale analysis and in the framework of an investment policy, Table 4, which takes into account direct losses only, shows that a minimum retrofit level certainly provides the maximum cost benefit as it provides the maximum loss reduction with minimum costs. However, even if slightly lower values of BCR are attained for increasing levels of retrofit, they significantly affect the safety levels of buildings and occupants, see Figure 9.

5. Discussion and Conclusions

Seismic Risk Classes SRC, introduced in the Italian guidelines for the seismic risk classification of the constructions, is defined as the minimum between the class defined by the building safety index at the ultimate limit state IS-V and the one related to expected annual loss EAL. A speedy approach for evaluating the probability of attaining relevant SRC for buildings of existing RC typologies is presented. The method is based on simplified modeling of lateral seismic behavior and on the estimate of the peak ground acceleration corresponding to attainment of building capacity (PGAc) for relevant limit states, namely damage limitation (SLD) and life safety limit state (SLV). The possible attainment of premature brittle failures in existing under-designed buildings is suitably accounted for in the element’s and sub-assemblage’s capacity model. Also, the effect of selected local retrofit solutions based on the externally bonded FRP reinforcement and SRP application is considered. The benefits in terms of SRC for structures, where this mitigation strategy is applied, are also determined. This retrofit technique is widely used in Italy and has been proven to be effective after recent earthquakes.
Combining the facilitated seismic analysis approach with an automated simulated design process of buildings belonging to selected typologies, it is possible to analyze a great number of models in the framework of a Montecarlo simulation and to evaluate statistics of relevant parameters towards evaluation of SRC probability.
The proposed method is applied with reference to two building typologies, namely low RC-L and medium height RC-M reinforced concrete gravity load designed moment frame buildings, representing the RC building stock for a town in Southern Italy. Suitable distributions for the relevant model parameters, including geometric and mechanical properties of the considered typologies, are assigned and the Montecarlo simulation and analysis process applied. SRC probability for the status quo, where no retrofit is applied, and for retrofit strategies of increasing efficacy (and costs) are evaluated.
SRC depends on IS-V and EAL for the buildings. From the statistics of IS-V and EAL it is observed, as expected, that IS-V increases with increasing retrofit level while EAL diminishes. However, the variation of EAL is comparatively lower with respect to IS-V. This is mainly due to the dependence of EAL on both the capacity at life safety limit state (SLV) and at damage limitation limit state (SLD), while IS-V is a function of the sole SLV. Because the applied retrofit strategy is designed to enhance the capacity at the SLV, while it has no effect on SLD, the effectiveness of increasing retrofit levels is significant until SLV is resolved, with minor EAL improvement afterwards.
For what concerns the probability of attaining the different possible seismic risk classes SRC, it is observed that for each retrofit scheme, including the status quo (i.e., no retrofit), different SRC are possible with variable probability. This is due to extreme variability of building capacity in each building typology, that depends on variability of relevant parameters such as structural configuration (Lx/Ly, ax, ay and SA) and material properties. As a general trend, the analysis performed on the building stock located in an Italian medium seismicity zone, shows that probability of attaining the worst risk class (G according to [9]) diminishes with increasing retrofit level for both the considered building typologies and the probability of attaining the better risk classes (e.g., A and B) increases. Denoting as prevalent risk class PRC the SRC having higher probability to be attained for each case (no retrofit, and increasing retrofit level R1, R2 and R3) it is observed that PRC varies from (G, F, B, B) for RC-L (NR, R1, R2, R3) to (G, D, A, A) for RC-M (NR, R1, R2, R3). However, for the case of R1 the ameliorating trend is present but does not tend to a specific class, with classes B, D, F and G (A, C, D) having comparable probabilities for RC-L (RC-M) typology. For R2 and R3 the trend is clearer: most of the buildings belong to SRC B for RC-L and to SRC A for RC-M. However, also other classes are present also for R2 and R3. In a high seismicity zone, the benefits provided by the selected strengthening strategy are less effective and global invasive techniques may be needed to strongly improve SRC.
The cost-benefit analysis CBA applied for the building stock in an Italian medium seismicity zone, allowed for comparing the costs of the increasing retrofit solutions to the benefits achieved from improved seismic performances. Results show that, thanks to significant reduction of EAL, all the retrofit strategies are convenient. However, it is plausible that a budget constraint limits the possible costs devolved to retrofitting, leading to the choice of retrofitting only a portion of the building stock.
Despite sustainability can be quantified in terms of social, environmental, and economic metrics, in this paper only the direct losses are explicitly considered. However, the retrofit of existing buildings will generally result in a more sustainable community by means of the upgrading of seismic performances. In particular, the reduced vulnerability of existing buildings will result in a reduction of the downtime, human losses (social outcome), of energy wastes and carbon dioxide emission due to the repair/reconstruction of severely damaged or collapsed buildings (environmental outcome), and thus in a certainly reduction of direct economic losses for the community.
This study has shown the possibility to apply a simplified approach for the evaluation of the efficacy of application of alternative retrofit solutions at the territorial scale and for a rapid estimate of expected losses at the regional scale.
Future studies need to address the analysis of other building typologies, e.g., RC frames with infills, whose behavior may be sensibly different to bare ones [47], or masonry structures.
Finally, the influence of local hazard on the final outcome of seismic risk classification should be further investigated, e.g., through applications for different cities belonging to seismic zones of different seismicity.

Author Contributions

M.P., M.G.d.A. and M.D.L. collected scientific articles for state of the art. M.G.d.A. performed the analyses and analyzed the results. M.P. organized the work, contributed to the analyses of the results and wrote the paper. M.D.L. gave advice on the Sismabonus approach, on the alternative retrofit strategies and contributed to the analyses of results. A.P. contributed to the analyses of results and revised the paper for overall consistency and scopes.

Acknowledgments

This study was performed in the framework of PE 2018; joint program DPC-Reluis Subproject RC-WP1: vulnerability of RC construction at the territorial scale and Subproject TT: Territorial themes.

Conflicts of Interest

The authors declare no conflict of interest.

References

  1. Dong, Y.; Frangopol, D.M.; Saydam, D. Time-variant sustainability assessment of seismically vulnerable bridges subjected to multiple hazards. Earthq. Eng. Struct. Dyn. 2013, 42, 1451–1467. [Google Scholar] [CrossRef]
  2. Comerio, M.C. Public policy for reducing earthquake risks: A US perspective. Build. Res. Inf. 2004, 32, 403–413. [Google Scholar] [CrossRef]
  3. City and County of San Francisco. San Francisco Existing Building Code, 2016th ed.; City and County of San Francisco: San Francisco, CA, USA, 2016. [Google Scholar]
  4. Alquist, A.E. The Field Act and Its Relative Effectiveness in Reducing Earthquake Damage in California Public Schools Appendices; The State of California, Seismic Safety Commission: Sacramento, CA, USA, 2009.
  5. Seismic Safety Act Statutes. California Codes, Government Code, Section (8870-8870.95); Seismic Safety Act Statutes: Sacramento, CA, USA, 1974. [Google Scholar]
  6. Suganuma, K. Recent Trends in Earthquake Disaster Management in Japan; NISTEP Science & Technology Foresight Center: Tokyo, Japan, 2006. [Google Scholar]
  7. OPCM-3274, Primi Elementi in Materia di Criteri Generali per la Classificazione Sismica del Territorio Nazionale e di Normative Tecniche per le Costruzioni in Zona Sismica. Gazzetta Ufficiale Della Repubblica Italiana. 2003. Available online: http://www.gazzettaufficiale.it/eli/id/2003/05/08/03A04408/sg (accessed on 13 August 2018).
  8. May, P.J.; Burby, R.J.; Feeley, T.J.; Wood, R. Adoption and Enforcement of Earthquake Risk Reduction Measures; Report 1999/04; Pacific Earthquake Engineering Research Center, University of California: Berkeley, CA, USA, 1999. [Google Scholar]
  9. Decreto Ministeriale del 28-02-2017, Approvazione Delle Linee Guida per la “Classificazione di Rischio Sismico Delle Costruzioni” Modificato con D.M. n.65 il 7 Marzo 2017. Available online: http://www.mit.gov.it/normativa/decreto-ministeriale-numero-65-del-07032017 (accessed on 13 August 2018).
  10. Priestley, M.J.N. Performance Based Seismic Design. Bull. N. Z. Soc. Earthq. Eng. 2000, 33, 325–346. [Google Scholar]
  11. Welch, D.P.; Sullivan, T.J.; Calvi, G.M. Developing direct displacement-based procedures for simplified loss assessment in performance-based earthquake engineering. J. Earthq. Eng. 2014, 18, 290–322. [Google Scholar] [CrossRef]
  12. Cosenza, E.; Del Vecchio, C.; Di Ludovico, M.; Dolce, M.; Moroni, C.; Prota, A.; Renzi, E. The Italian Guidelines for seismic risk classification of constructions: technical principles and validation. Bull. Earthq. Eng. 2018, in press. [Google Scholar] [CrossRef]
  13. Ministerial Decree D.M. 20.02.2018 “Updating of Technical Standards for Construction”. Available online: http://www.gazzettaufficiale.it/eli/gu/2018/02/20/42/so/8/sg/pdf (accessed on 13 August 2018).
  14. Federal Emergency Management Agency. FEMA 308 Repair of Earthquake Damaged Concrete and Masonry Wall Buildings; Federal Emergency Management Agency: Washington, DC, USA, 1998.
  15. Polese, M.; Marcolini, M.; Gaetani d’Aragona, M.; Cosenza, E. Reconstruction policies: Explicitating the link of decisions thresholds to safety level and costs for RC buildings. Bull. Earthq. Eng. 2017, 15, 759–785. [Google Scholar] [CrossRef]
  16. Polese, M.; Di Ludovico, M.; Marcolini, M.; Prota, A.; Manfredi, G. Assessing reparability: Simple tools for estimation of costs and performance loss of earthquake damaged reinforced concrete buildings. Earthq. Eng. Struct. Dyn. 2015, 44, 1539–1557. [Google Scholar] [CrossRef]
  17. OPCM 3790, Ordinance of the President of Counsel of Ministry “Urgent Intervention to Deal with Seismic Events Occurred in the Abruzzo Region on April 6, 2009 and Other Urgent Civil Protection Provisions” 2009. Available online: http://www.commissarioperlaricostruzione.it/Informare/Normative-e-Documenti/Ordinanze-e-Decreti-del-Presidente-del-Consiglio-dei-Ministri/Ordinanza-3790-del-9-luglio-2009 (accessed on 13 August 2018).
  18. Fajfar, P. Capacity spectrum method based on inelastic demand spectra. Earthq. Eng. Struct. Dyn. 1999, 28, 979–993. [Google Scholar] [CrossRef]
  19. EC8-3, EN 1998-3 Eurocode 8: Design of Structures for Earthquake Resistance, Part 3: Assessment and Retrofitting of Buildings. 2005. Available online: http://civil.emu.edu.tr/courses/civl471/1998-3-2005.pdf (accessed on 13 August 2018).
  20. Vamvatsikos, D.; Cornell, A. Direct estimation of the seismic demand and capacity of oscillators with multi-linear static pushovers through IDA. Earthq. Eng. Struct. Dyn. 2006, 35, 1097–1117. [Google Scholar] [CrossRef]
  21. Di Ludovico, M.; Prota, A.; Moroni, C.; Manfredi, G.; Dolce, M. Reconstruction process of damaged residential buildings outside historical centres after the L’Aquila earthquake: Part I—“light damage” reconstruction. Bull. Earthq. Eng. 2017, 15, 667–692. [Google Scholar] [CrossRef]
  22. Di Ludovico, M.; Prota, A.; Moroni, C.; Manfredi, G.; Dolce, M. Reconstruction process of damaged residential buildings outside historical centres after the L’Aquila earthquake: Part II: “heavy damage” reconstruction. Bull. Earthq. Eng. 2017, 15, 693–729. [Google Scholar] [CrossRef]
  23. Gaetani d’Aragona, M.; Polese, M.; Di Ludovico, M.; Prota, A. Seismic vulnerability for RC infilled frames: Simplified evaluation for as-built and retrofitted building typologies. Buildings 2018. submitted for publication. [Google Scholar]
  24. Polese, M.; Verderame, G.M.; Mariniello, C.; Iervolino, I.; Manfredi, G. Vulnerability analysis for gravity load designed RC buildings in Naples–Italy. J. Earthq. Eng. 2008, 12, 234–245. [Google Scholar] [CrossRef]
  25. Polese, M.; Verderame, G.M.; Manfredi, G. Static vulnerability of existing R.C. buildings in Italy: A case study. Struct. Eng. Mech. 2011, 39, 599–620. [Google Scholar]
  26. Gaetani d’Aragona, M.; Polese, M.; Prota, A. Relationship between the Variation of Seismic Capacity after Damaging Earthquakes, Collapse Probability and Repair Costs: Detailed Evaluation for a Non-Ductile Building. In Proceedings of the Compdyn 2015 5th Eccomas Thematic Conference on Computational Methods in Structural Dynamics and Earthquake Engineering, Crete Island, Greece, 25–27 May 2015. [Google Scholar]
  27. Gaetani d’Aragona, M.; Polese, M.; Elwood, K.; Baradaran Shoraka, M.; Prota, A. Aftershock collapse fragility curves for non-ductile RC buildings: A scenario-based assessment. Earthq. Eng. Struct. Dyn. 2017, 46, 2083–2102. [Google Scholar] [CrossRef]
  28. Gaetani d’Aragona, M.; Polese, M.; Elwood, K.; Baradaran Shoraka, M.; Prota, A.; Manfredi, G. Building Performance Loss After Damaging Earthquakes: An Investigation Towards Reparability Decisions. In Proceedings of the 12th International Conference on Applications of Statistics and Probability in Civil Engineering, ICASP12, Vancouver, BC, Canada, 12–15 July 2015. [Google Scholar]
  29. Circolare del Ministero dei Lavori Pubblici n. 617 del 2/2/2009. Istruzioni per L’Applicazione Delle “Nuove Norme Tecniche per le Costruzioni” di cui al D.M. 14 Gennaio 2008. G.U. n. 47 del 26/2/2009, 2009. Available online: http://cslp.mit.gov.it/index.php?option=com_docman&task=cat_view&gid=283&dir=DESC&order=hits&Itemid=10&limit=5&limitstart=0 (accessed on 13 August 2018).
  30. Fédération Internationale du Beton (fib). Seismic Assessment and Retrofit of reinforced Concrete Buildings Externally Bonded FRP Reinforcement for RC Structures; Bulletin 24; International Federation for Structural Concrete (fib): Lausanne, Switzerland, 2003; p. 312. [Google Scholar]
  31. Ilki, A.; Tore, E.; Demir, C.; Comert, M. Seismic performance of a full-scale FRP retrofitted sub-standard RC building. In Recent Advances in Earthquake Engineering in Europe: 16th European Conference on Earthquake Engineering; Springer International Publishing: New York, NY, USA, 2018; pp. 519–544. [Google Scholar]
  32. Del Zoppo, M.; Di Ludovico, M.; Balsamo, A.; Prota, A.; Manfredi, G. FRP for seismic strengthening of shear controlled RC columns: Experience from earthquakes and experimental analysis. Compos. Part B Eng. 2017, 129, 47–57. [Google Scholar] [CrossRef]
  33. Frascadore, R.; Di Ludovico, M.; Prota, A.; Verderame, G.M.; Manfredi, G.; Dolce, M.; Cosenza, E. Local strengthening of reinforced concrete structures as a strategy for seismic risk mitigation at regional scale. Earthq. Spectra 2015, 31, 1083–1102. [Google Scholar] [CrossRef]
  34. Del Vecchio, C.; Di Ludovico, M.; Prota, A.; Manfredi, G. Analytical model and design approach for FRP strengthening of non-conforming RC corner beam–column joints. Eng. Struct. 2015, 87, 8–20. [Google Scholar] [CrossRef]
  35. Consiglio Nazionale delle Ricerche CNR, CNR-DT 200 R1/2013. Guide for the Design and Construction of Externally Bonded FRP Systems for Strengthening Existing Structures e Materials, RC and PC Structures, Masonry Structures; Italian National Research Council: Roma, Italy, 2013. [Google Scholar]
  36. Polese, M.; Gaetani d’Aragona, M.; Prota, A. Simplified approach for building inventory and seismic damage assessment at the territorial scale: An application for a town in southern Italy. Soil Dyn. Earthq. Eng. 2018. under review. [Google Scholar]
  37. Verderame, G.M.; Polese, M.; Mariniello, C.; Manfredi, G. A simulated design procedure for the assessment of seismic capacity of existing reinforced concrete buildings. Adv. Eng. Softw. 2010, 41, 323–335. [Google Scholar] [CrossRef]
  38. Polese, M.; Marcolini, M.; Prota, A.; Zuccaro, G. Mechanism Based Assessment of Damaged Building’s Residual Capacity, Paper # 1524. In Proceedings of the COMPDYN 2013 4th ECCOMAS Thematic Conference on Computational Methods in Structural Dynamics and Earthquake Engineering, Kos Island, Greece, 12–14 June 2013. [Google Scholar]
  39. Polese, M.; Marcolini, M.; Zuccaro, G.; Cacace, F. Mechanism based assessment of damaged- dependent fragility curves for RC building classes. Bull. Earthq. Eng. 2015, 13, 1323–1345. [Google Scholar] [CrossRef]
  40. Gaetani d’Aragona, M.; Polese, M.; Cosenza, E.; Prota, A. Simplified assessment of maximum interstory drift for RC buildings with irregular infills distribution along the height. Bull. Earthq. Eng. 2018. under review. [Google Scholar]
  41. Vořechovský, M.; Novák, D. Correlation control in small-sample Monte Carlo type simulations I: A simulated annealing approach. Probabilistic Eng. Mech. 2009, 24, 452–462. [Google Scholar] [CrossRef]
  42. Edifici ed abitazioni Censimento 2001. Dati Definitivi, 2004, Released by ISTAT on December 9, 2004. Available online: http://dawinci.istat.it/jsp/MD/ (accessed on 13 August 2018).
  43. Zuccaro, G.; Dolce, M.; De Gregorio, D.; Speranza, E.; Moroni, C. La scheda CARTIS per la caratterizzazione tipologico- strutturale dei comparti urbani costituiti da edifici ordinari. Valutazione dell’esposizione in analisi di rischio sismico. In Proceedings of the GNGTS 2015, Trieste, Italy, 17–19 November 2015. [Google Scholar]
  44. Verderame, G.M.; Ricci, P.; Esposito, M.; Manfredi, G. STIL v1.0, 2012, Software and Handbook. Available online: http://www.reluis.it/index.php?option=com_content&view=article&id=199&Itemid=136&lang=it (accessed on 13 August 2018).
  45. Liel, A.B.; Deierlein, G.G. Cost-benefit evaluation of seismic risk mitigation alternatives for older concrete frame buildings. Earthq. Spectra 2013, 29, 1391–1411. [Google Scholar] [CrossRef]
  46. Kappos, A.J.; Dimitrakopoulos, E.G. Feasibility of pre-earthquake strengthening of buildings based on cost-benefit and life-cycle cost analysis, with the aid of fragility curves. Nat. Hazards 2008, 45, 33–54. [Google Scholar] [CrossRef]
  47. Dominguez-Santos, D.; Ballesteros-Perez, P.; Mora-Melia, D. Structural resistance of reinforced concrete buildings in areas of moderate seismicity and assessment of strategies for structural improvement. Buildings 2017, 7, 89. [Google Scholar] [CrossRef]
Figure 1. Steps for evaluation of a building risk class: (a) Pushover curve and identification of relevant limit states; (b) Calculation of the PGAc corresponding to selected limit states through the N2 method [18]; (c) Attribution of C-IS-V class and definition of λLS and%RC for the (d) calculation of the EAL and attribution of the C-EAL class.
Sustainability 10 02894 g001
Figure 2. Outline of the method: (a) Model to analyze building class; (b) Building class pushover curves and limits of SLD and SLV capacity; (c) statistics of PGAc at SLD and SLV limit states and derivation of IS-V index probability; (d) median and 16–84 percentiles of λ-%RC curves and corresponding EAL probability.
Sustainability 10 02894 g002
Figure 3. Schematic representation of the generic plane frame and the nonlinear modelling for RC columns and model for joint failure.
Sustainability 10 02894 g003
Figure 4. Local retrofit solutions for columns and joints: (a) application of SRP uniaxial system to withstand horizontal action due to infills effects and quadriaxial carbon fiber reinforced polymers (CFRP) fabric for corner joint; (b) strengthening of the columns with uniaxial carbon fiber reinforced polymers (CFRP) strips.
Sustainability 10 02894 g004
Figure 5. Map of Portici with Town Compartments (bold contours) according to Cartis approach.
Sustainability 10 02894 g005
Figure 6. Pushover curves for one of the generated building models (model parameters: SA = 600 m2; Lx/Ly = 2; ax = 3.85 m, ay = 4.30 m) for RC-L (a) and RC-M (b) typologies.
Sustainability 10 02894 g006
Figure 7. The λ-%RC curves for one of the generated building models (model parameters: SA = 600 m2; Lx/Ly = 2; ax = 3.85 m, ay = 4.30 m) within (a) RC-L and (b) RC-M typologies. No retrofit, local retrofit solutions R1 and R2 are shown.
Sustainability 10 02894 g007
Figure 8. Probability density functions for PGAc,SLD and PGAc,SLV for RC-L (a) and RC-M (b) typologies. Cases of no retrofit, R1, R2 and R3 are shown. The ordinates are normalized with respect to maximum frequency for each case.
Sustainability 10 02894 g008
Figure 9. IS-V probability for (a) RC-L and (b) RC-M typologies. Cases of no retrofit (NR), R1, R2 and R3 are shown.
Sustainability 10 02894 g009
Figure 10. EAL probability for (a) RC-L and (b) RC-M typologies. Cases of no retrofit, R1, R2 and R3 are shown.
Sustainability 10 02894 g010
Figure 11. SRC probability for (a) RC-L and (b) RC-M typologies and considering cases of no retrofit (NR) as well as R1, R2 and R3 retrofit solutions.
Sustainability 10 02894 g011
Figure 12. SRC probability for RC-M (a) Zone 1 and (b) Zone 3 considering cases of no retrofit (NR) as well as R1, R2 and R3 retrofit solutions.
Sustainability 10 02894 g012
Figure 13. SRC probability for RC-L (a) Zone 1 and (b) Zone 3 considering cases of no retrofit (NR) as well as R1, R2 and R3 retrofit solutions.
Sustainability 10 02894 g013
Table 1. Indications for attribution of C-IS-V and C-EAL class.
Safety IndexC-IS-VExpected Annual LossC-EAL
1 ≤ IS-VA+IS-VEAL ≤ 0.50%A+EAL
0.8 ≤ IS-V < 1AIS-V0.50% < EAL ≤ 1.0%AEAL
0.6 ≤ IS-V < 0.8BIS-V1.0% < EAL ≤ 1.5%BEAL
0.45 ≤ IS-V < 0.6CIS-V1.5% < EAL ≤ 2.5%CEAL
0.30 ≤ IS-V < 0.45DIS-V2.5% < EAL ≤ 3.5%DEAL
0.15 ≤ IS-V < 0.30EIS-V3.5% < EAL ≤ 4.5%EEAL
IS-V < 0.15FIS-V4.5% < EAL ≤ 7.5%FEAL
- 7.5% < EALGEAL
Table 2. Synthetic data for town compartments in Portici.
TCRC BuildingsRC-LRC-M
C111055%45%
C218351%49%
C32142%58%
C44052%48%
C54641%59%
C647048%52%
Table 3. Parameters assumed to generate the building population for the RC-6-S and RC-6-W typologies.
ParameterDistributionMedianCoV
fclognormal25 MPa30%
fylognormal399 MPa28%
SAuniform[300, 600, 900, 1200] m2-
Lx/Lyuniform[1, 1.5, 2, 2.5]-
azconstant3 m
ax, aymin; max3.5 m; 6 m-
Table 4. Results of Cost Benefit Analysis.
SjRkEALNPVL(50,Sj,Rk)BN(50,Sj,Rk)C(Sj,Rk)BCR(T = 50)
%M €M €M €
RC-LR0 (NR)7.31971.900n.a.
RC-LR1 3.3891.41080.592.611.7
RC-LR22.5675.31296.6115.811.2
RC-LR32.2583.51388.5139.010.0
RC-MR0 (NR)5.94918.000.0
RC-MR1 1.91583.83334.3285.911.7
RC-MR21.51208.73709.4357.310.4
RC-MR31.31042.03876.1428.89.0

