A Multi-Data Approach for Spatial Risk Assessment of Topsoil Compaction on Arable Sites

1
Thünen Institute of Rural Studies, Bundesallee 64, 38116 Braunschweig, Germany
2
Thünen Institute of Agricultural Technology, Bundesallee 47, 38116 Braunschweig, Germany
3
Kuratorium für Technik und Bauwesen in der Landwirtschaft e. V. (KTBL), Bartningstraße 49, 64289 Darmstadt, Germany
*
Author to whom correspondence should be addressed.
Sustainability 2018, 10(8), 2915; https://doi.org/10.3390/su10082915
Submission received: 30 May 2018
/
Revised: 8 July 2018
/
Accepted: 8 August 2018
/
Published: 16 August 2018
(This article belongs to the Special Issue Assessment and Governance of Sustainable Soil Management)
Abstract
:Soil compaction is a human-induced threat which negatively affects soil functions and is highly dependent on site-specific soil conditions and land use patterns. Proper management techniques are indispensable for sustainable soil protection to ensure its function in the long term. A number of concepts exist to develop risk maps on the basis of soil inherent susceptibility to compaction at a given soil moisture level (mostly field capacity). However, the real soil conditions, e.g., current soil moisture content at the time of field work and the real machinery load, are not taken into account. To bridge this gap, we present a multi-data approach for qualitative risk assessment, which combines spatially and temporally explicit data on soil, soil moisture, and land use information. The contributing components integrate daily probability distribution, including inter- and intra-annual variations in land use and weather. We combined soil susceptibility to compaction and field work for the federal state of Lower Saxony per half-months and identified three clusters with more or less compaction risk for Lower Saxony. In spring, mainly manure spreading to maize and in autumn harvesting of maize and sugar beets are contributing to the yearly probability of compaction risk in top soils. With the presented approach risk areas can be identified. For the evaluation of the current compaction risks, farm specifications on machinery and timing of field work must also be taken into account.
1. Introduction
The use of heavy machinery and intensive field traffic can lead to a soil load that exceeds the intrinsic stability and resilience of soil structure and induces soil compaction. Soil compaction is a worldwide problem in agriculture, but particularly in regions with high mechanization rates in the production chain [1,2] and high precipitation [3]. The process of soil compaction leads to a reduction of pore volume and change in pore structure and negatively influences the gas, water, and nutrient exchanges [1,4,5,6,7]. On the one hand, it leads to declines in yield quality and quantity, which requires increased use of water, energy, and nutrients to compensate for the declined productivity. Short term (1–4 years) yield losses due to top soil compaction are generally higher then long term yield losses due to subsoil compaction [6,8,9,10,11]. However, the effects of soil physical properties on yields strongly depend on weather conditions [11]. On the other hand, the infiltration and storage capacity of water is reduced, which promotes water erosion associated with a loss of nutrients and chemicals, which in turn leads to pollution of surface waters Furthermore, soil compaction has negative impacts on the formation of floods and on the production of greenhouse gases, e.g., in the form of nitrogen losses [12,13,14]. Especially the subsoil (mostly below 0.3 cm) is endangered by compaction because this layer is not tilled, thus subsoil compaction is much more persistent and alleviation more difficult [2,15]. A persistent deformation of soil layers between 0.3 and 0.7 cm is often observed in field trials and recognized as almost irreversible [17]. Soil compaction is, on the one hand, controlled by the type and intensity of the mechanical load as external factors. Thereby, for subsoil compaction the wheel load plays a major role [8,17,18,19] and for topsoil the contact area, tire inflation pressure and mean ground pressure are crucial [19]. On the other hand, soil susceptibility, that is mainly dependent on soil type and water content at the time of mechanical load, plays a decisive role [3,15,20,21,22]. The increase of extreme climate situations and the intensification of agricultural production will intensify these conflicts in the future. To ensure long-term yield levels and to maintain soil functions, site-specific requirements and circumstances must be taken into account [23]. Identification of the region-specific driving factors of soil compaction helps to determine a suitable type and time of cultivation, as well as the proper machinery for field work to avoid soil compaction and to achieve a desired soil structure. Risk Assessment is a tool to describe the probability that an object is exposed hazard, resulting from human activity, and can contribute to a sustainable and site-specific planning and management of soils [14,24,25,26,27,28].
A number of concepts exist to develop maps, indicating subsoil compaction risk on the basis of soil information maps at different scales and for a static soil moisture content (e.g., Lebert [29] for Germany, van den Akker [30] for the Netherlands, D’Or and Destain [31] for the Walloon Region in Belgium, and Jones et al. [12] for Europe). They represent the soil susceptibility to compaction at a given content of soil moisture. Thus, the variability of soil moisture as well as the variability in crop distribution and associated field operations is not considered. So, the current moisture content at the time of field work and the used machine equipment do not find entry [21,22,30]. In the methodology of van den Akker [30], subsoil compaction risk is expressed as wheel-load-carrying capacity (WLCC). The WLCC is defined as the maximum wheel load for a given tire size, inflation pressure, and soil moisture content where no permanent soil deformation occurs. The method is expanded by Lamandé et al. [27] who developed wheel-load-carrying-capacity maps for Europe for a sugar beet harvester with a specific tire and caterpillar at a soil depth of 0.3 m. These maps assume the use of the same sugar beet harvester all over Europe, which is not fact and thus leads to a distorted image. There are only a few studies that integrate weather and/or land use variability into the assessment of soil compaction risk on a regional scale. In their proposed approach, Jones et al. [12] consider the question of the probable soil water content in the growing season to determine the susceptibility of soil to compaction of these time span for Europe. Troldborg et al. [32] used this concept and extended it by the external pressure in the form of land use and machine properties. In a Bayesian Network (BN), all factors are included with location-specific probability distributions and results in the probability of compaction risk for selected locations in Scotland. A different approach is provided by Edwards et al. [33] who introduce the term “readiness” of a soil for operation within a decision support system to plan soil tillage methods for a given field or farm. The average number of suitable days, as well as the probability of individual days categorized as “suitable“ or “not suitable“ is evaluated for different time periods for a specific field. Götze et al. [34] model the “Soil Compaction Index” (SCI) for top- and subsoil of a field trial in Germany. Individual years and field operations for whole crop rotations of five years are taken into account. The SCI is modeled by using the methodology of Rücknagel et al. [35] where the prevailing soil strength is compared to soil stress induced by field operations. There are tools or applications to predict the risk of soil compaction for a specific field operation. These are, for example, the REPRO-[35,36], the Terranimo-[37], or the TASC-model [38]. All of them are working with the precompression stress concept, which should not be discussed further in this place; instead we refer to other work [16,39,40,41]. The existing approaches for a region-wide assessment do not account for spatial and temporal variabilities in crop growing patterns, associated mechanical load, and soil moisture content at the time of field work. The approaches at the farm level or for specific field operations require very detailed soil, land use, and machine data, which is not suitable for a region-wide assessment.
In this paper, we present an approach for the region-wide risk assessment of soil compaction, including crop growing patterns, associated mechanical loads, and soil moisture contents in a long-term perspective. We focus on the topsoil as the results form the basis for further socioeconomic investigations at farm level and compaction in the topsoil has a particular impact on short term yield levels. The presented approach links the probability of mechanical load due to field operation as external pressure, with the probability of soil susceptibility to compaction at high temporal and spatial resolution. We use a time series of daily soil moisture and mass data for field block-specific land use for eleven years (2005–2015) to analyze the various probabilities contributing to a joint probability of compaction risk. This allows an identification of the spatial distribution of areas with more or less compaction risk, including inter- and intra-annual, regional variations in crop cultivation (and the associated mechanical load for different field works), soil characteristics, and weather. The contributing factors in terms of soil conditions, crop growing patterns, and machinery are determined for half-month time steps to identify the main adjustment possibilities for a sustainable soil management and mid- and long-term farm planning. With the analysis of manure spreading on a focus area with two different types of machine equipment, we evaluate the available days in different compaction risk classes on a daily basis.
2. Materials and Methods
We analyze the compaction risk to the top layer (0–30 cm) of arable land in the federal state of Lower Saxony, Germany, for the spreading of liquid manure and digestates in spring (only to maize), and for harvesting of silage maize, winter grains, spring grains (which are sown in spring and harvested in late summer or autumn), potatoes, and sugar beets in late summer and autumn. We assumed that manure is spread only in spring because with the new fertilization ordinance in Germany the conditions for manure spreading in autumn are highly restricted. We expect a shift of relevant volumes to be applied in spring. For the evaluation of compaction risk, the susceptibility of soil to compaction is compared to the mechanical load of agricultural machines and assessed by the expert-based approach of Lorenz et al. [22]. Therefore, soil and soil moisture data, as well as land use data of the Integrated Administration and Control System (IACS) for the years 2005–2015 are evaluated. IACS data contain field block-specific information on cropland use in farms applying for area-related payments of the EU Common Agricultural Policy (CAP).
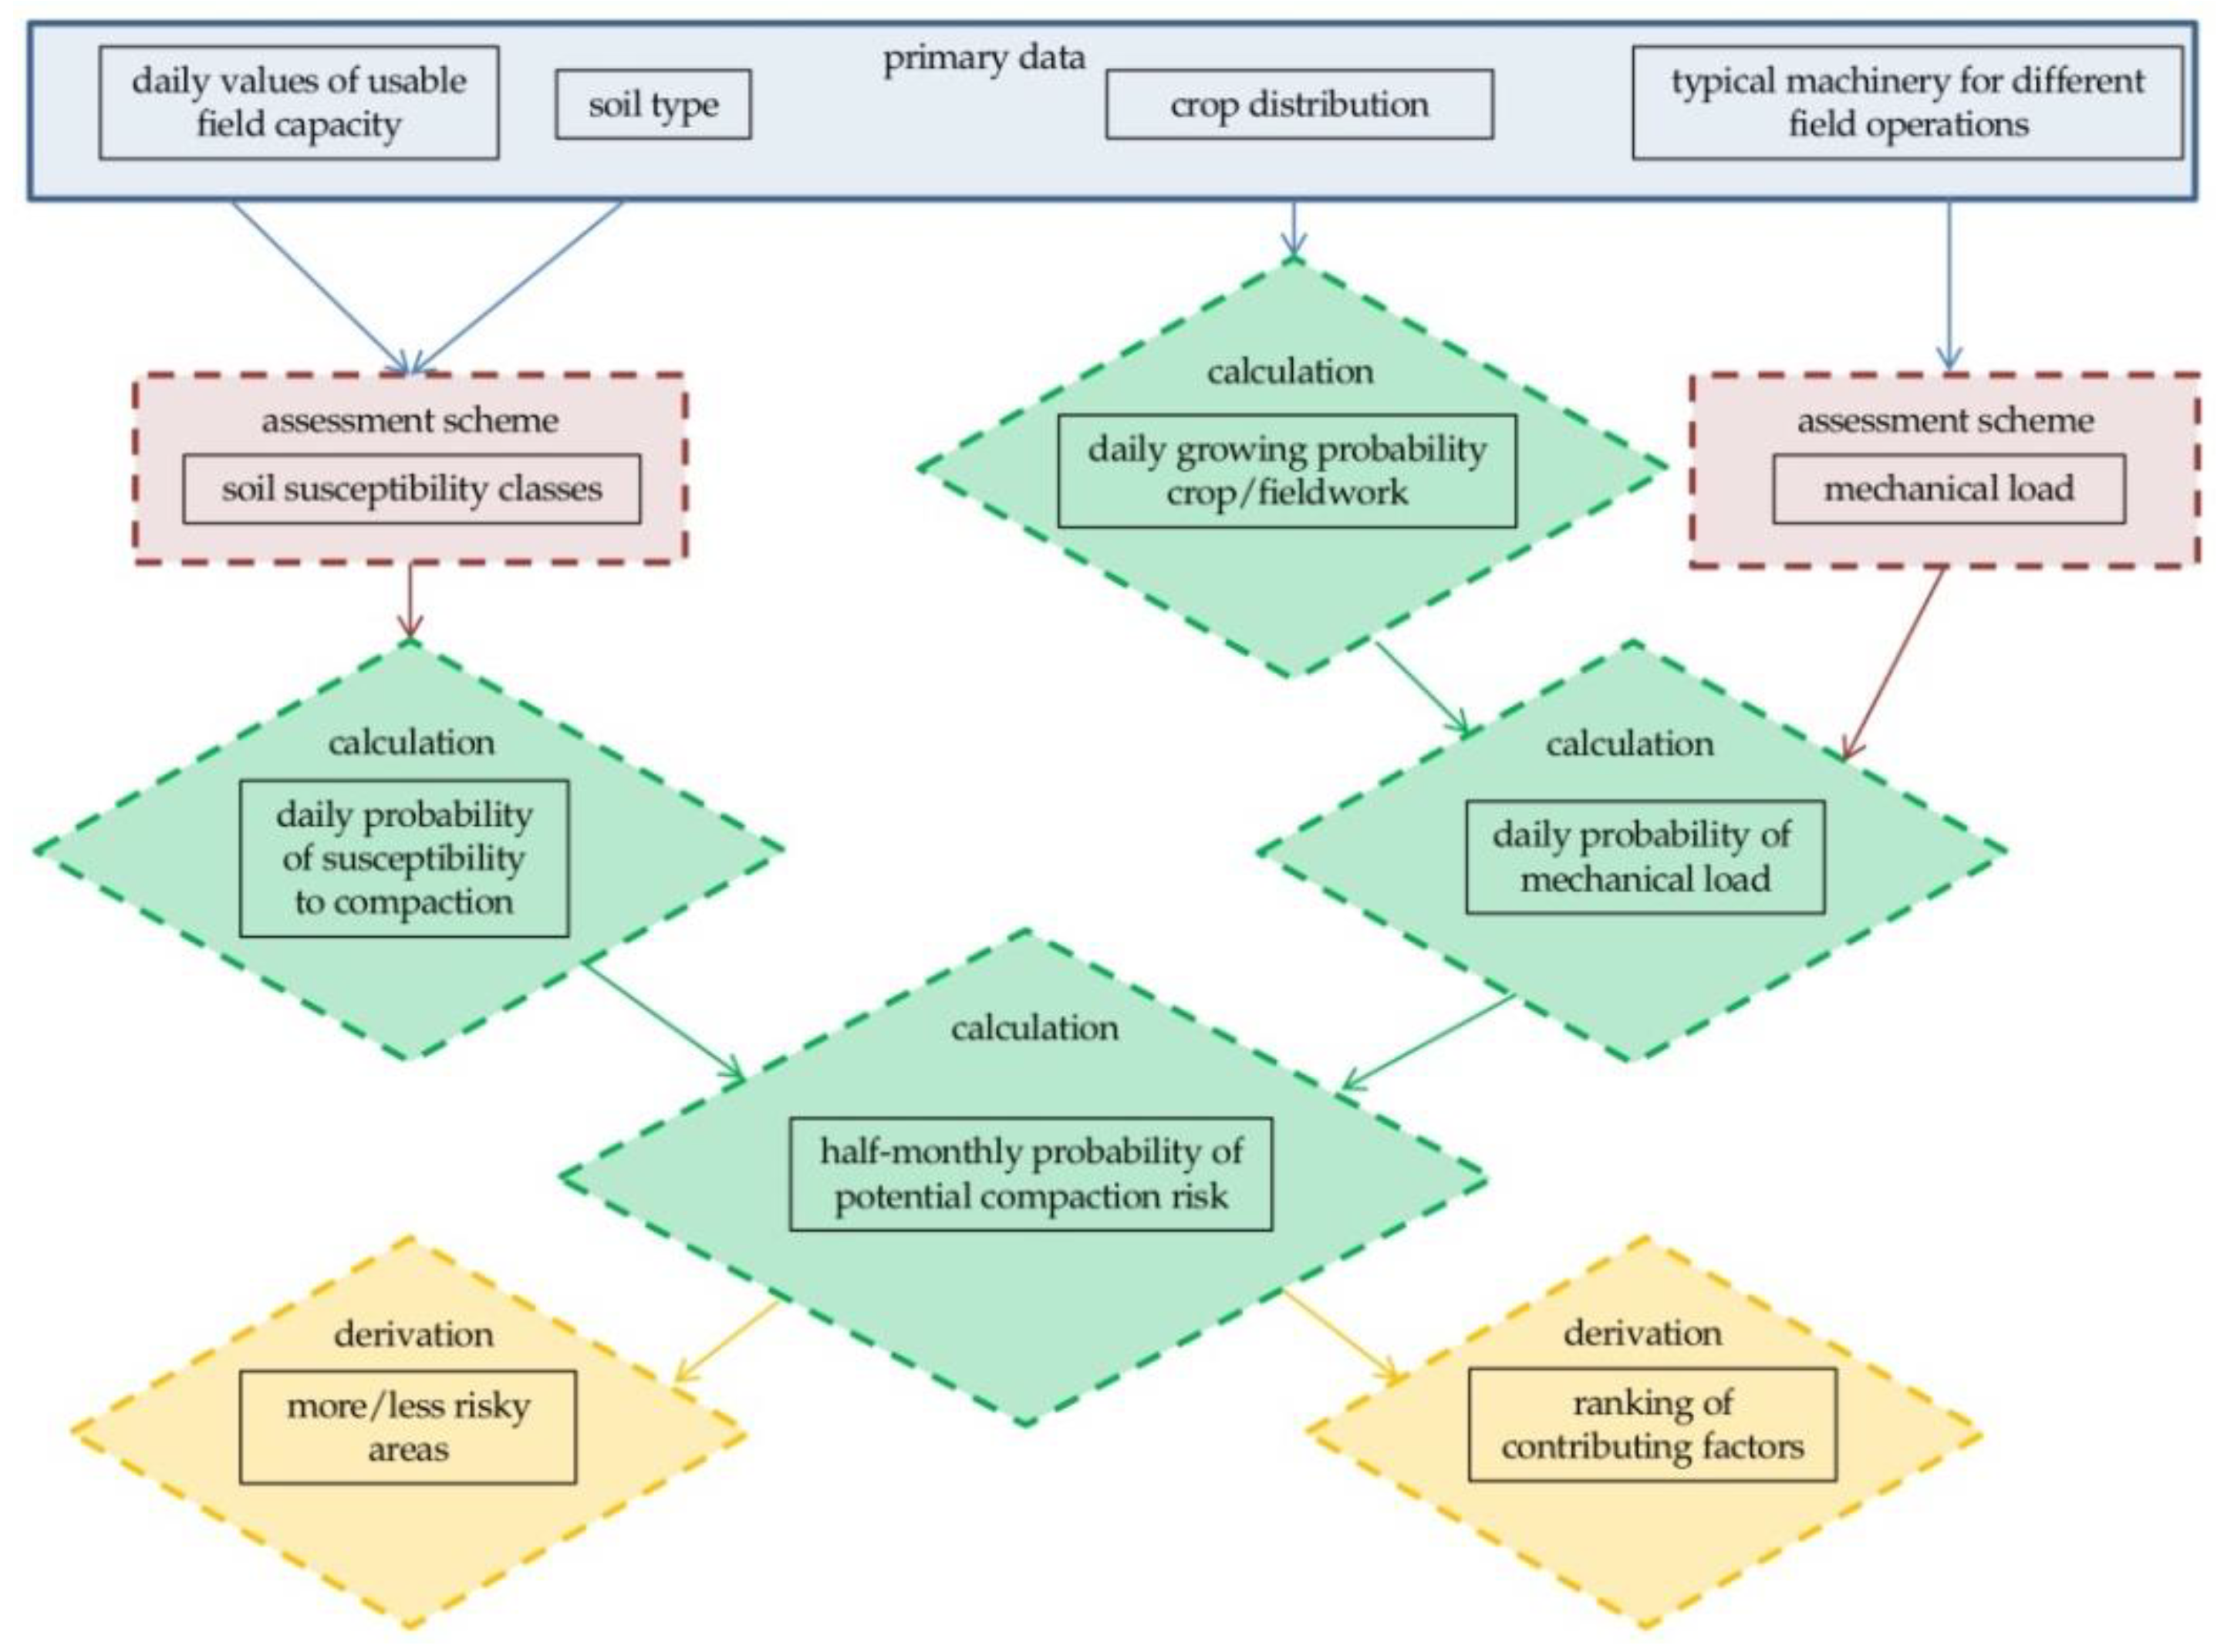
The results provide areas with more or less compaction risk due to soil susceptibility to compaction and mechanical load. Furthermore, a distinction of the contributing factors for the whole time-period and for certain years and time slots within the years is made. Figure 1 shows schematically the developed approach with primary data, assessment schemes, calculation steps, and derived results.
2.1. Primary Data
2.1.1. Soil Data
For soil information, the soil map for Lower Saxony in scale 1:50,000 (BUEK 50) [42] is used. Each soil unit is georeferenced and identified by a unique identification number and described with a profile and the corresponding soil properties for each soil layer. To link the soil data with the modeled effective field capacity (German Weather Service, DWD, Offenbach am Main, Germany; see Section 2.1.2 Soil moisture data), one soil type must be determined for the top soil layer for each profile. The depth of 0–30 cm was chosen to delimit the topsoil as it usually represents the tillage depth. So, the soil moisture was simulated for this depths range by the DWD. In practice, only very few profiles have layers with exact delimitations at 30 cm. For this reason, the major layer between 0 and 30 cm is selected as top soil. Table 1 shows an example of the determination of layered profiles with different depths.
2.1.2. Soil Moisture Data
The simulated soil moisture data for Lower Saxony were provided by the DWD. The calculations are carried out using the AMBAV model (agricultural meteorological model for calculating the current evaporation [43]). The model is based on the classical Penman-Monteith equation for the calculation of evapotranspiration. Synoptic parameters such as air temperature, precipitation or global radiation are used as input data. The user-defined input parameters for soil and plant properties also determine the output data soil moisture and evapotranspiration. By integrating leaf area indices (LAI), the evapotranspiration, and thus the soil moisture content, is adjusted to crop-and season-specific conditions [43]. Soil moisture is calculated as effective field capacity (eFC) in %, and daily values for the years 2005–2015 are available in a 1 × 1 km grid resolution. Six different soil types (German soil texture classification [44]: slightly loamy sand (Sl2), highly loamy sand (Sl4), medium clayey silt (Ut3), medium clayey loam (Lt3), silty loam (Lu), and loamy clay (Tl)) and four different crops (winter wheat, spring wheat, silage maize, and sugar beet) were considered. Each grid cell is georeferenced and defined by a unique key, and can therefore be spatially located. The determined soil types of the soil map BUEK50 are assigned to the simulated soil types on the basis of their position/proximity depending on their sand-, silt- and clay-content and the associated similar grain size distribution and hydraulic properties [45] (Table 2).
2.1.3. Land-Use Data
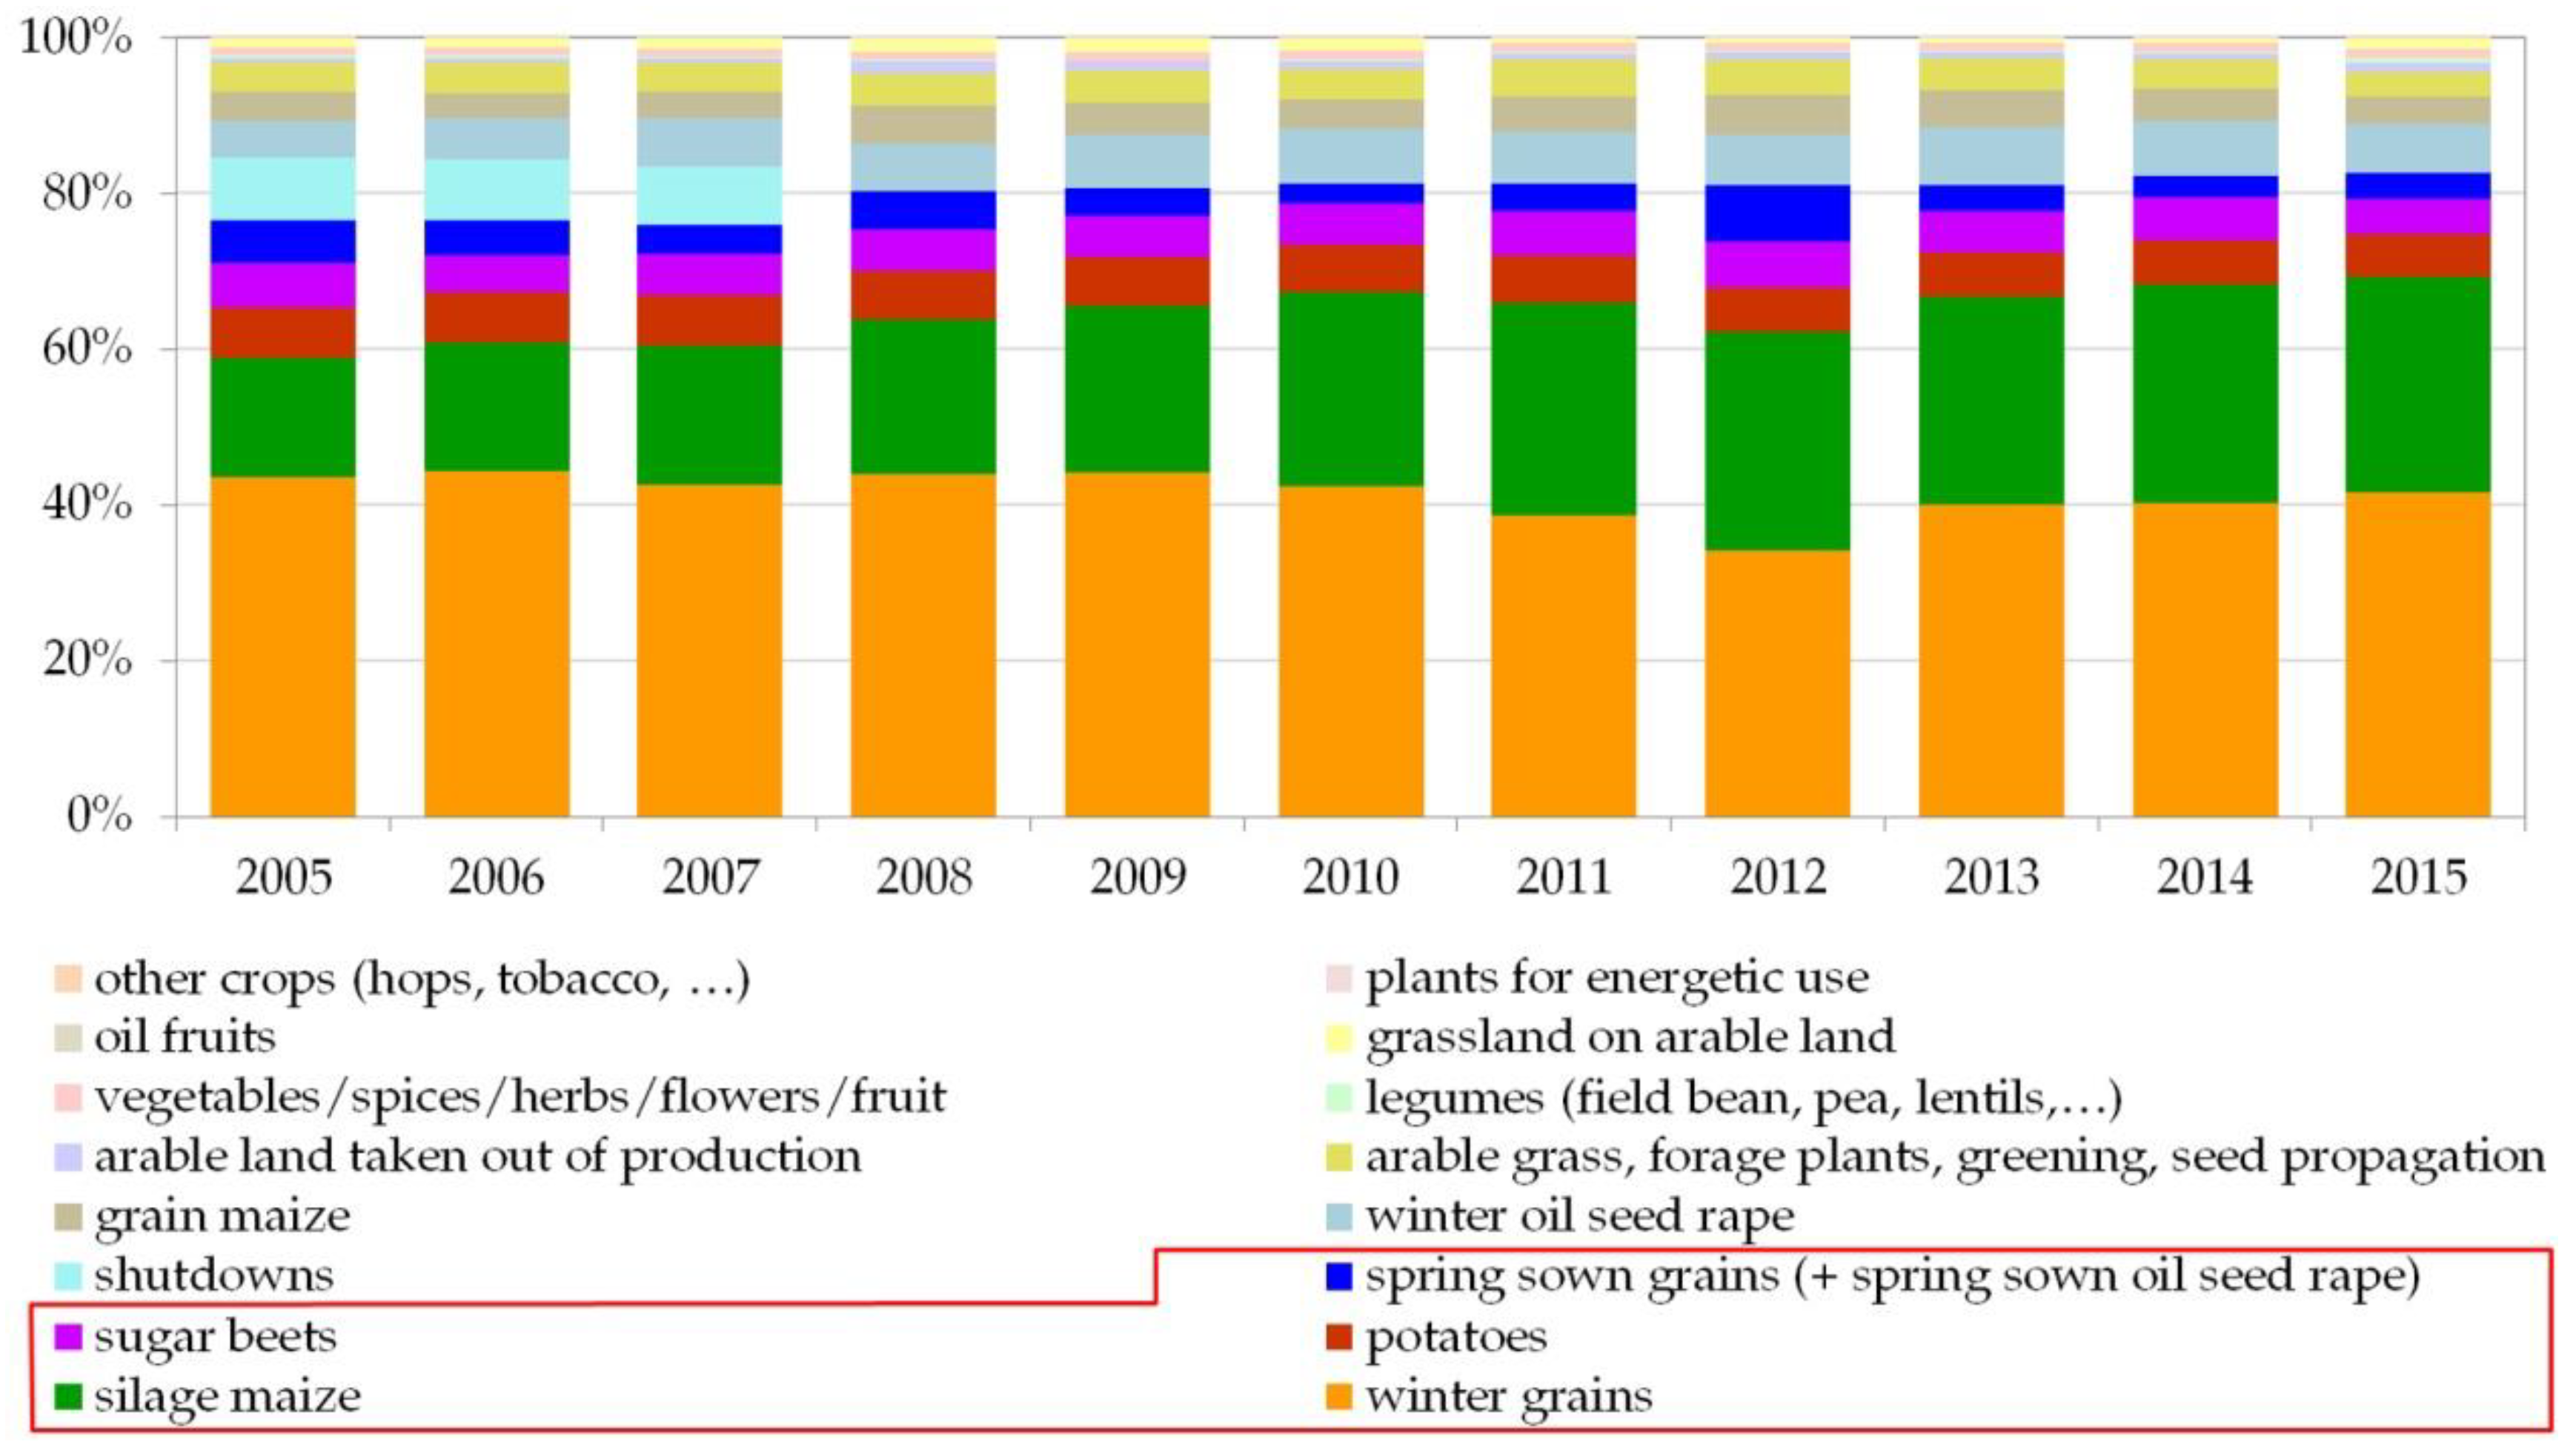
The data from the IACS for the implementation of area-based subsidies within the CAP provide land use data for the years 2005 to 2015 on a field block basis. The information on crop-type with hectare indication in the respective year is used for the evaluation. A field block comprises a spatially defined agricultural area bounded by linear elements (path, course of a river, or edge). One or more fields from one or more farmers with one or more crops may be located within a field block. Each field block is identified by a unique area identifier (ID) with a georeferenced area. If one crop is reported per ID, the spatial location of this crop is clear. However, if more than one crop is reported per ID, the data set includes only the hectares of each crop, but not the specific location within the field block. This results in an uncertainty in the spatial location of crops, which is stated as the probability that a certain crop is cultivated within a defined location (field block). Each year, those cultures that grow on 15 May are reported and are considered to be the only culture for the respective year. In IACS, cultures are recorded very precisely, which is not necessary for this evaluation, since the soil moisture data is only defined for four crops. Thus, the reported crops are grouped according to agronomic aspects into the five groups winter grains, spring grains (+ spring sown oil seed rape rape), silage maize, potatoes, and sugar beets. The corresponding modeled soil moisture values of the DWD can then be assigned to the grouped crops (Table 3). Potatoes are also considered, as they make up a relevant proportion of the area. Due to agronomic similarities, we assigned the soil moisture values of sugar beet to them and grouped spring sown oil seed rape together with spring sown grains. Together, the five groups cover between 73 and 80% of the total arable land in Lower Saxony in the analyzed years (Figure 2).
The field blocks of 2015 are chosen as the reference area for the total growing probabilities of each crop group for 2005 to 2015 because they represent the most up-to-date arable land limitation. The times of field work for manure spreading and harvesting on a half-month basis are taken from a German online-application of the Kuratorium für Technik und Bauwesen in der Landwirtschaft e. V. (KTBL, Darmstadt, Germany [46]) and regionally adjusted for Lower Saxony by expert knowledge [45] (Table 3).
2.1.4. Machinery Data
Since there is no available data on the current machinery use for different field operations, locations, and farm-sizes, for this study we defined standard machine equipment with a medium mechanical load according to the method of Lorenz et al. [22] (see Table A1, Appendix A). Table 4 lists the crop-groups and the associated machine equipment for manure spreading to silage maize and harvesting of silage maize, winter grains, spring grains, potatoes, and sugar beets. The mechanical load of the machine equipment is described by the dimensionless characteristic load value which lies between 0.3 and 0.7 [22]. On the one hand, this value represents machine characteristics as wheel load, contact area, tire inflation pressure, or contact area pressure. On the other hand, it represents characteristics of the processing chain as the number of passages associated with the considered field operation or wheeled area, depending on the machine size, field operation, and field shape. Not only are individual machines evaluated, but complete process chains including the organization of field work are taken into account. During maize harvest, for example, the harvester with one transport trailer for street and field transport, or with separated street and field transport trailer, which depends on the organization, labor and machine equipment of the individual farmer, can be evaluated. The two variants differ in the tire pressure of the trailer, as the field trailer can drive at lower pressure when the transport is separated [22]. An example for the calculation of the characteristic load value is given in Appendix A Table A1. With the determined characteristic load value, the mechanical load of the machine equipment can be classified as very low to very high (see Figure 3). As an example for increasing the available days with a lower compaction risk by using machine equipment with a lower mechanical load, we choose manure spreading. Compared to manure spreading with a self-propelled spreader (Table 4, manure spreading (1)), the option with umbilical cord manure spreading (Table 4, manure spreading (2)) is associated with a very low mechanical load. In this option, the manure is stored in a tank on the field edge and pumped via a large cord to the tractor in the field. This reduces the mechanical load by the amount of manure carried on the field compared to the self-propelled spreader.
2.2. Assessment of Compaction Risk
2.2.1. Risk Matrix for Soil Compaction
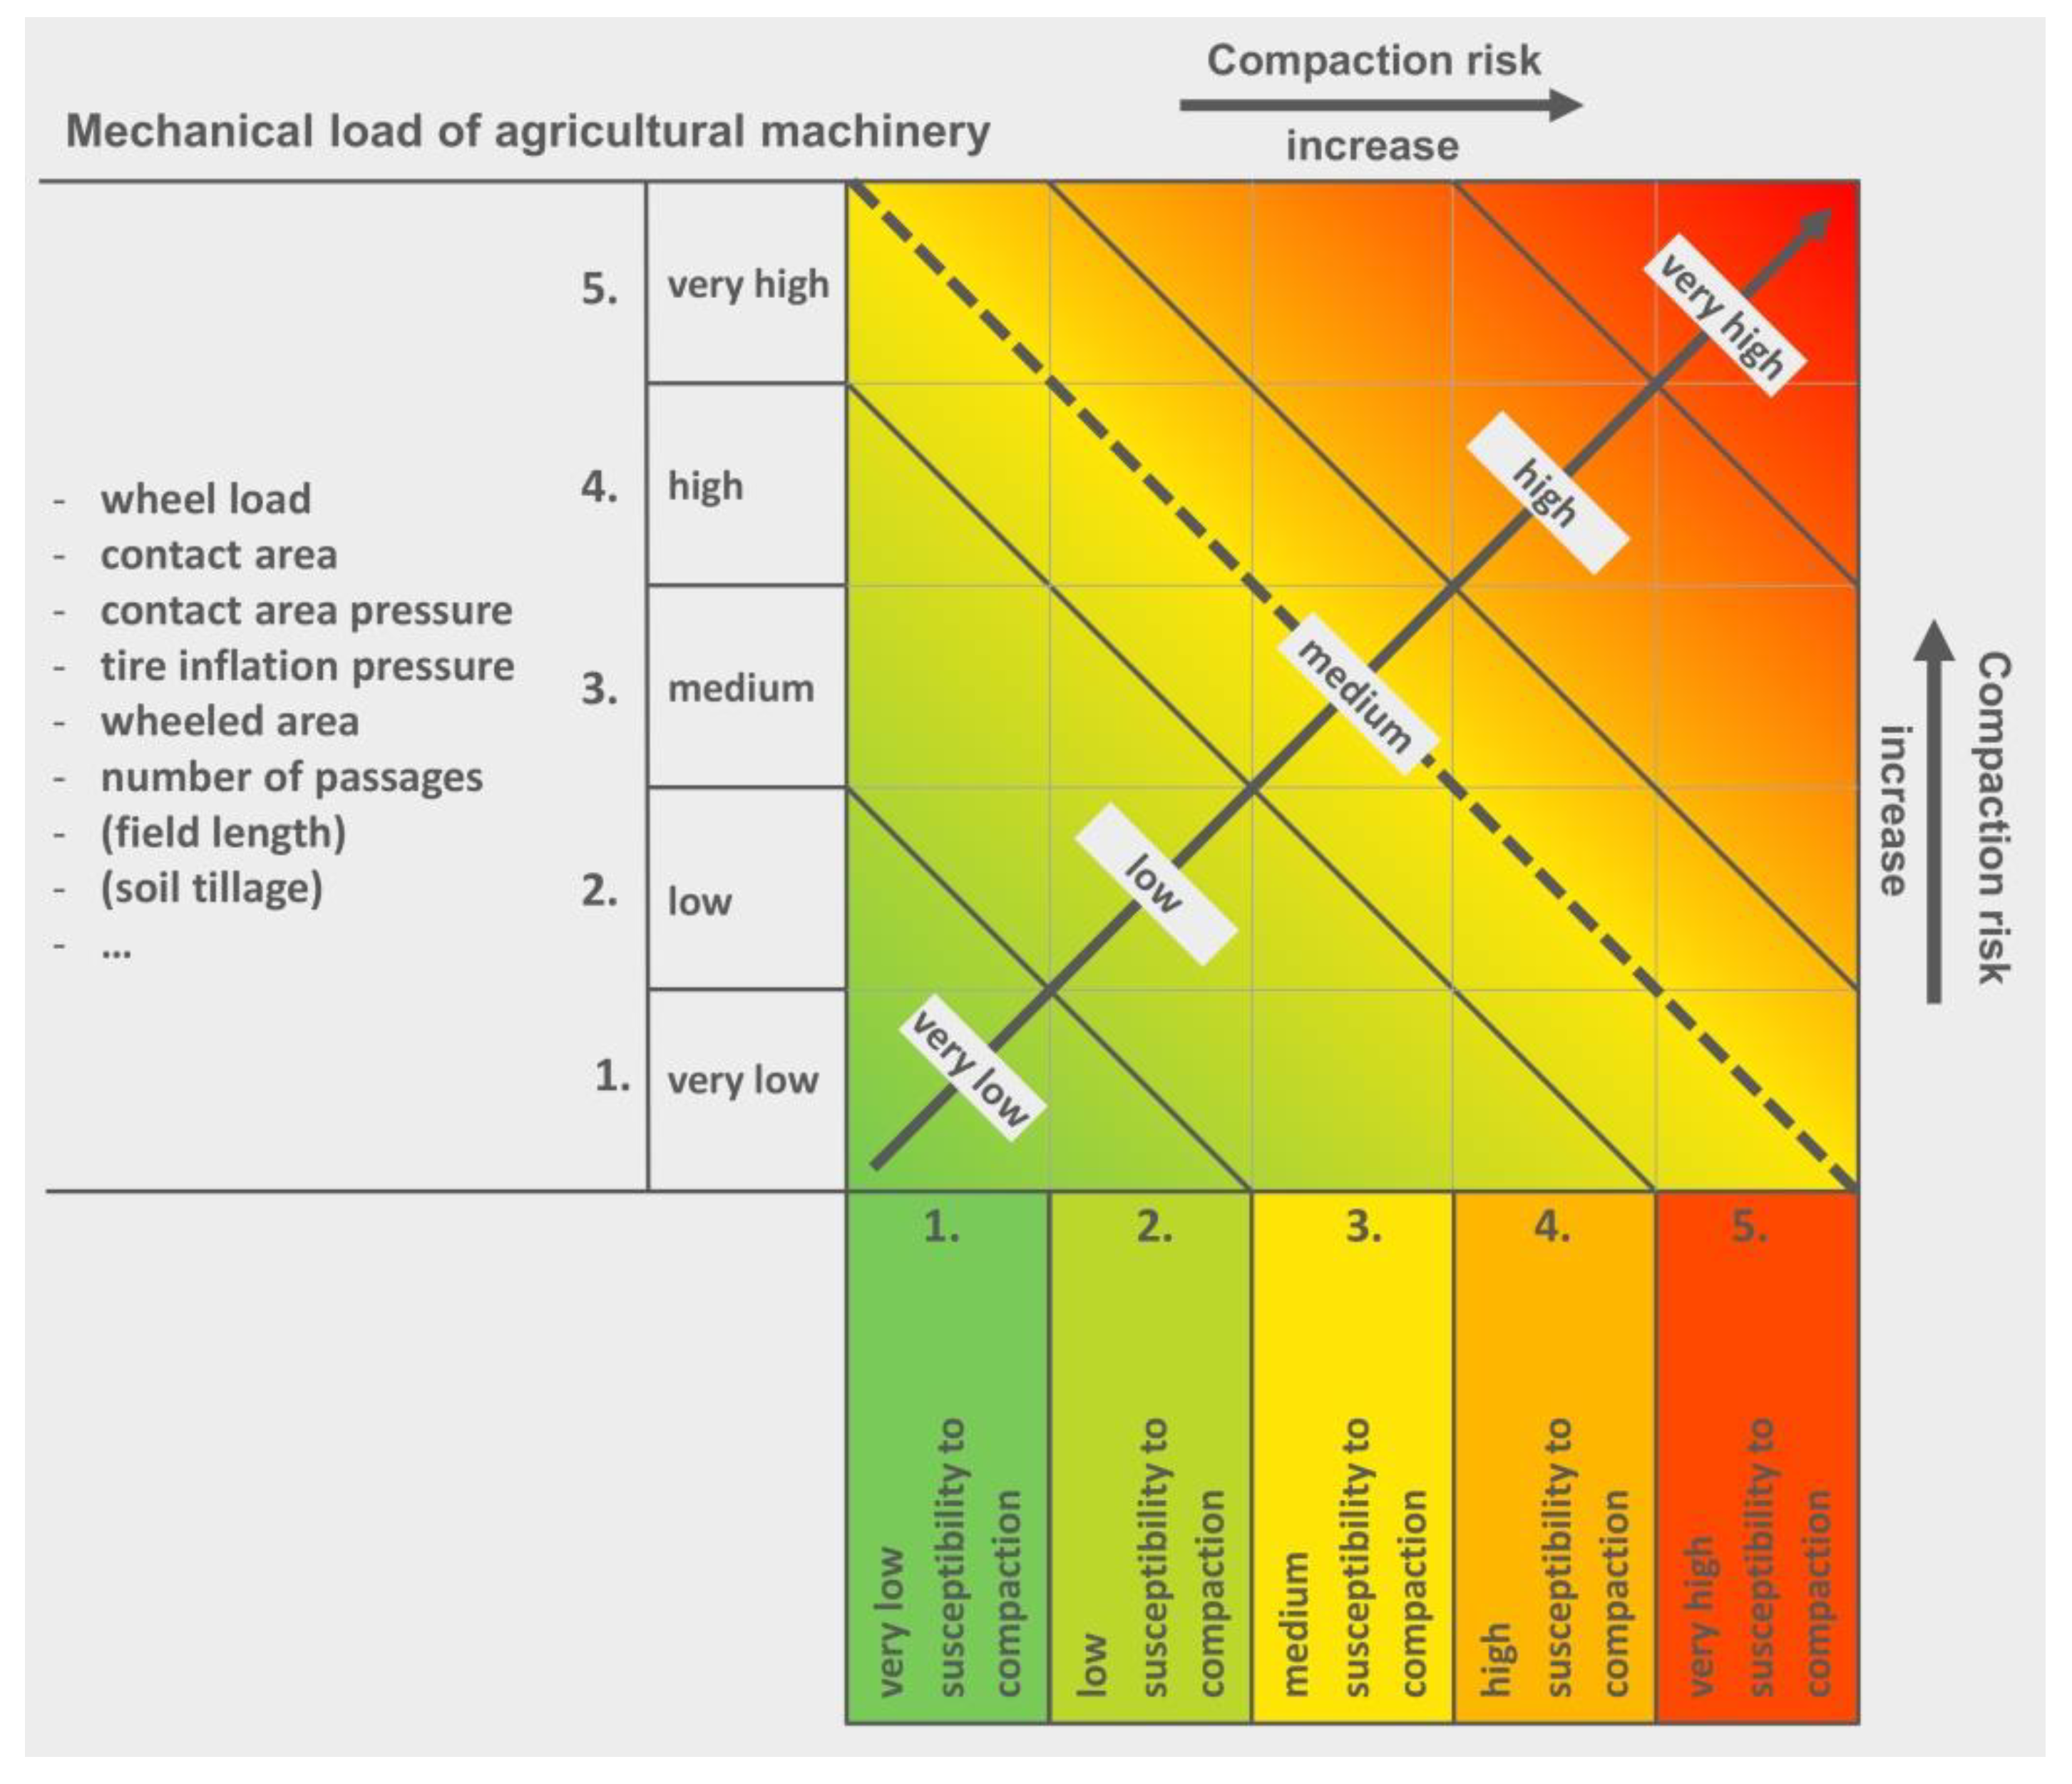
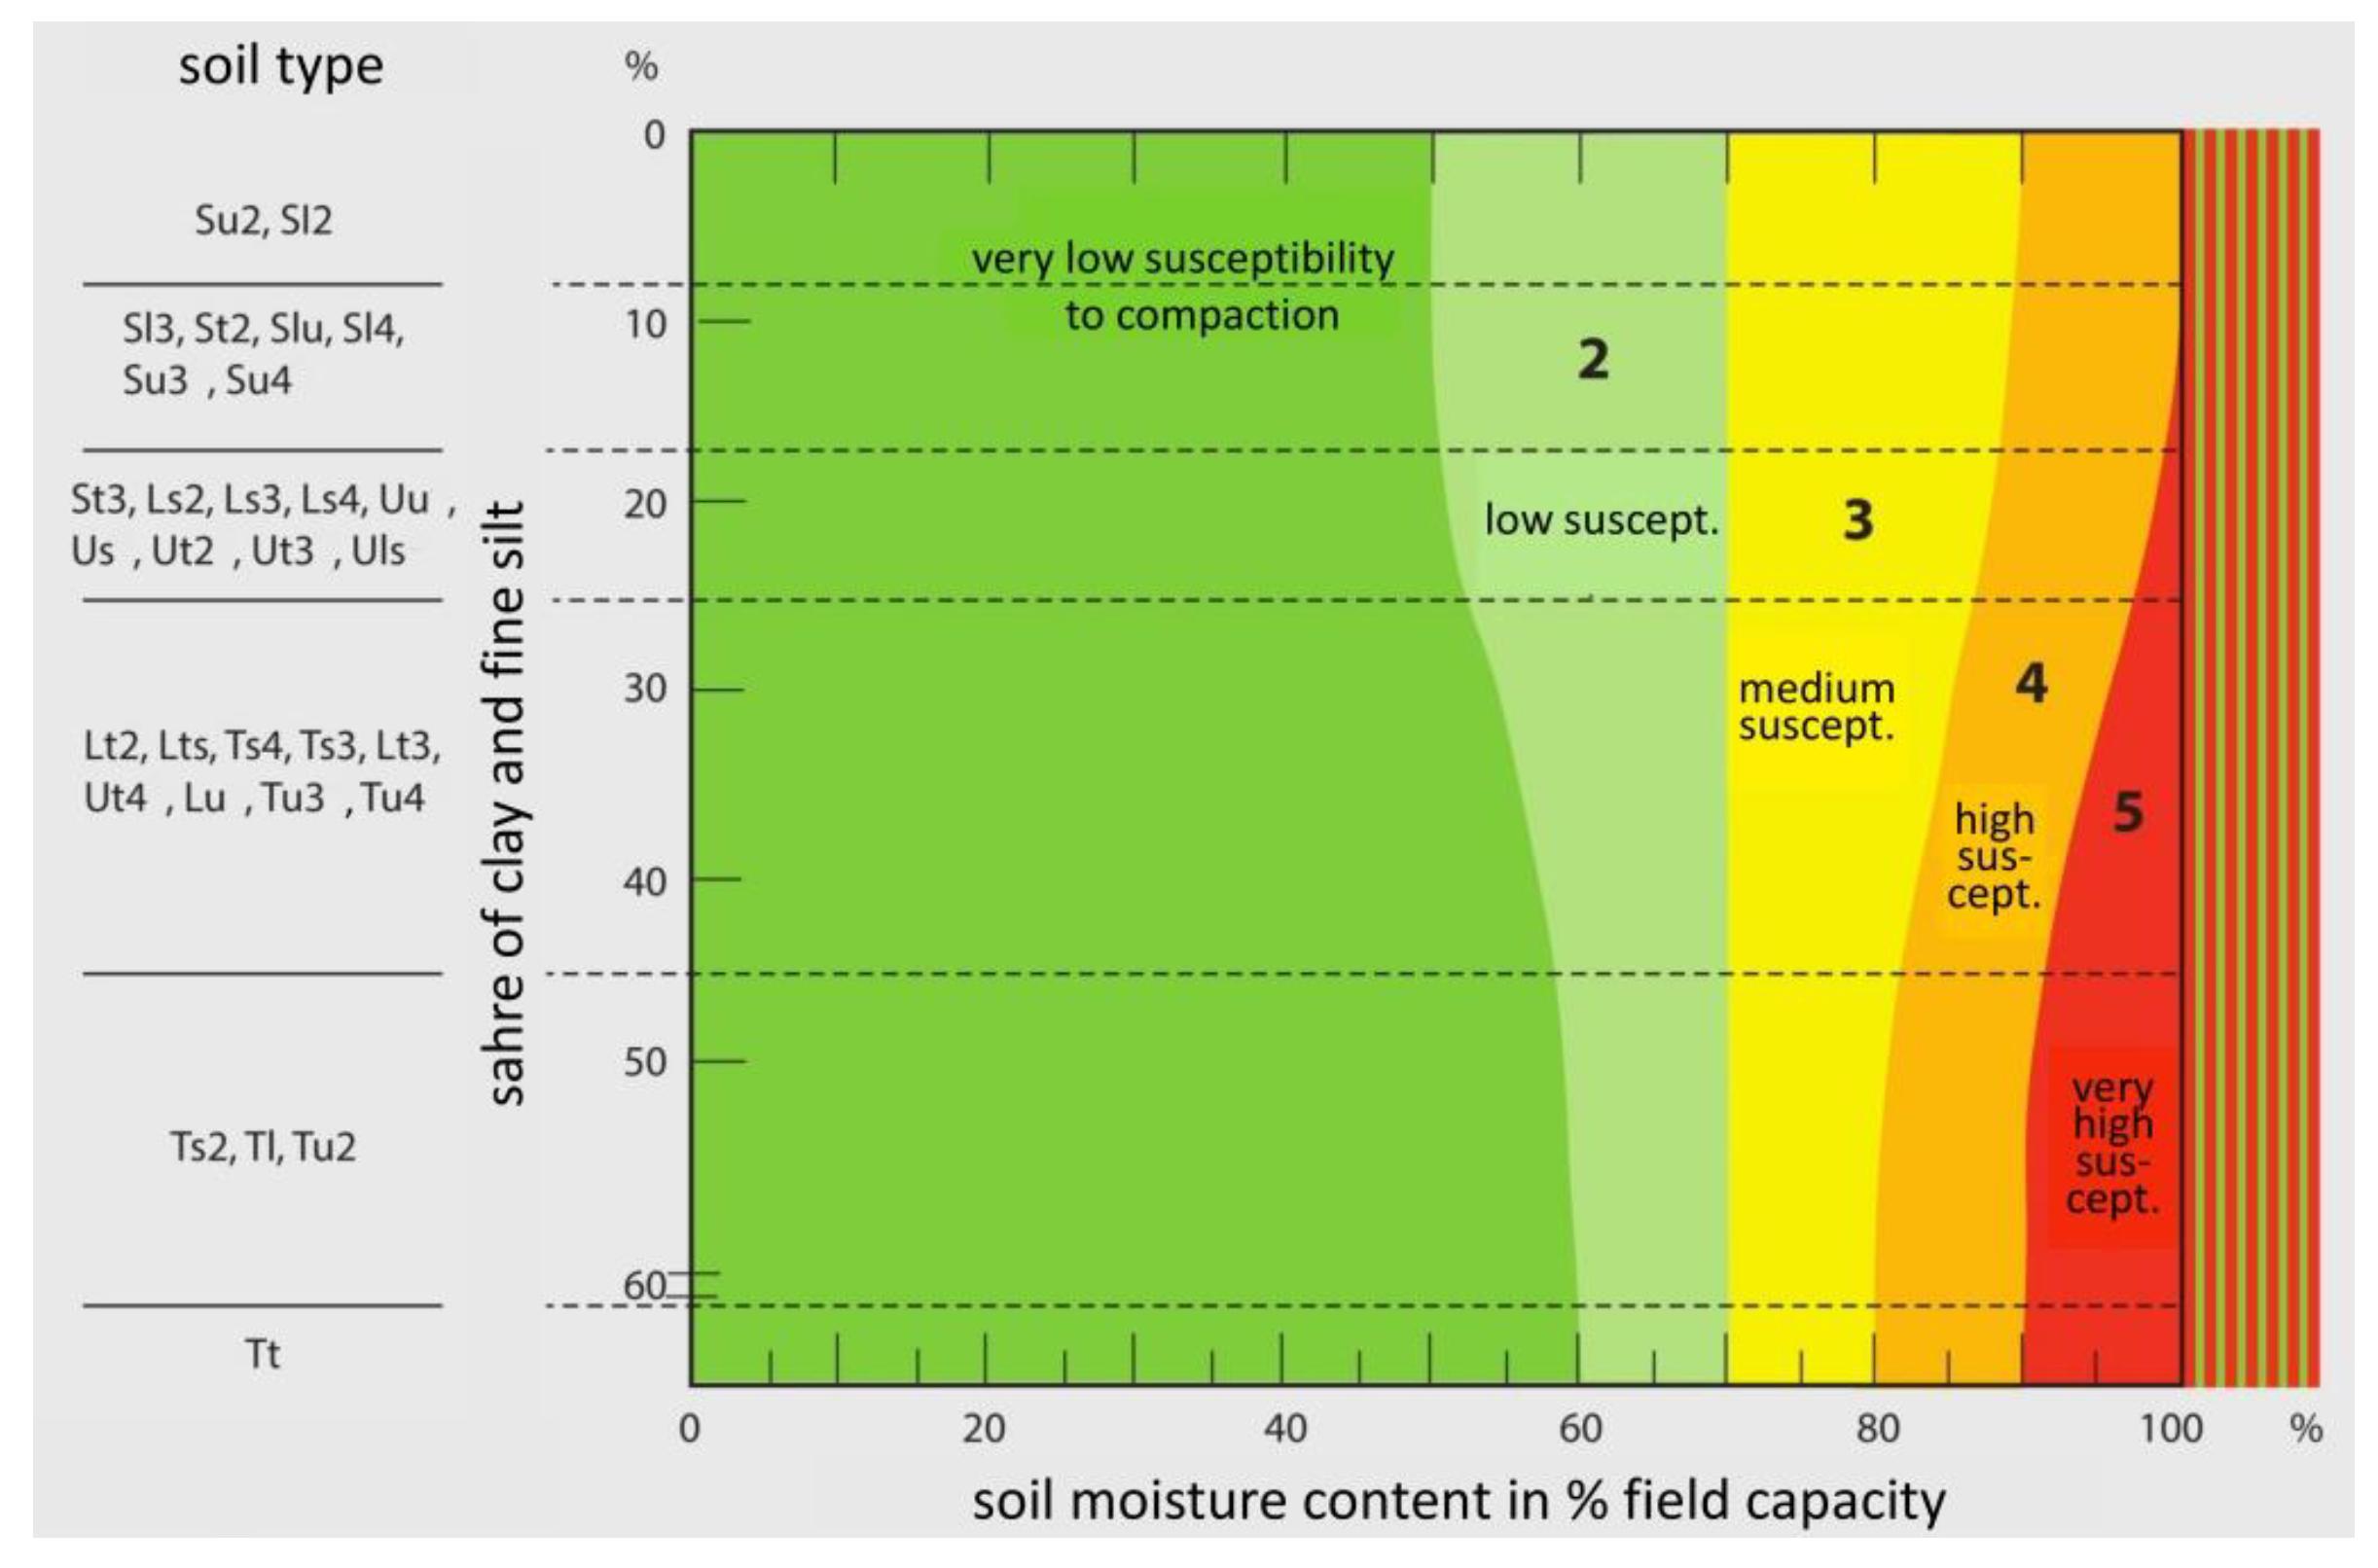
In the decision matrix of Lorenz et al. [22], the compaction risk is assessed by combining the susceptibility of soils to compaction and the mechanical load applied by machinery, as commonly used in soil compaction risk assessment [2,32,37,47,48] (Figure 3). Thresholds for each soil type to divide them into five susceptibility classes have been defined by an expert consortium (Appendix B, Figure A1). In general, the susceptibility increases with increasing soil water and clay content [15]. The system was verified by Lorenz et al. [22]. In general there were good agreements between the observed and modeled soil susceptibility to compaction. The characteristic load value is also divided into five classes. The intersection of susceptibility and load value class within the decision matrix (Figure 3) leads to five compaction risk classes from very low to very high. An increasing impact on soil functions is assumed with increasing compaction risk classes. For the identification of areas with and without compaction risk, we associate all combinations above the dashed diagonal line with compaction risk and all those below without compaction risk (for soil moisture contents of the susceptibility classes see Appendix B, Table A3). For example, a medium mechanical load combined with very high susceptibility to compaction leads to a high compaction risk (Figure 3).
2.2.2. Spatial Soil Compaction Risk Assessment
For the assessment of soil compaction risk on arable sites in Lower Saxony risk is seen as the probability per time unit that an object is exposed to a hazard [28], which is commonly used in ecological risk assessment [26,32,49,50,51]. We present a step-wise approach from a general to a case-specific view. The general view means an average compaction risk combining the cultivation and soil moisture data for the years 2005–2015, resulting in an average risk for the whole year per soil-moisture-land-use-unit j (Pcrj). The soil-moisture-land-use-units j are formed by intersecting georeferenced data sets, namely the soil units; the 1 × 1 km grid for soil moisture and the field blocks for 2015 (reference area for crop growing probability) is the most up-to-date arable land limitation. Figure 4 shows a section of the intersected data sets. This means every combination of soil unit, soil moisture grid, and arable land limitation has an individual time series for soil moisture.
The time spans of field work for half-month periods are known (Table 3), but not the exact day or days of field work within these periods. Therefore, we assume field work to be 100% probable every day within the respective half-month of field work. This means that the probability of field work (Pfwi) is 100% for crop-specific time spans for field work and 0% for all other half-months k. To derive the crop growing probabilities, the daily probabilities within a year for the crop groups are calculated as the share of a crop group i within the individual field blocks of the respective year. The growing probability within the individual field blocks is further set in relation to the share in the reference area (field blocks 2015). Furthermore, the mean yearly growing probabilities are calculated, resulting in the average growing probability for 2005–2015 (Pci/half-month k) for every reference area and crop group i. The probability of mechanical load (Pli/half-month ki) for crop group i grown in a reference area per half-month k is then derived by multiplying Pfwi/half-month k and Pci (Equation (1)):
The probability of soil susceptibility to compaction in half-month k (Psi/half-month k) is derived by calculating the mean usable field capacity for each half-month and year. Each value is defined as below and above the diagonal line (see Section 2.2.1, Figure 3). Furthermore, the probability of each half-month is calculated and ranged to be susceptible (above the diagonal line) or not susceptible (below the diagonal line) to compaction. In the next step, the probability of susceptibility to compaction is compared with the probability of mechanical load and the products for all crops within the resulting soil-moisture-land-use-units j as Psumj are summarized (Equation (2)).
Dividing Psumj by the number of half-months (24) leads to the indicator average compaction risk over the entire years Pcrj for each soil-moisture-land-use-unit j (Equation (3)).
- Pli/half-month k = Probability of mechanical load for crop i grown in reference area per half-month k
- Pci/half-month k = Probability of crop i grown in reference area (2015) per half-month k
- Pfwi/half-month k = Probability of field work for crop i in half-month k in reference area (2015)
- Psi/half-month k = Probability of soil susceptibility for soil-moisture-unit per half-month k
In addition to the indicator average compaction risk (Pcrj) over the entire year, the indicator maximum compaction risk per half-month (max (Psumj)) is identified. This indicator shows the half-month in which the maximum probability of soil compaction is found. With these two indicators for soil compaction risk, a cluster analysis is conducted using the FASTCLUS Procedure in SAS 9.4 [52]. The procedure was run with given numbers of clusters from one to ten and the Elbow Method was used to determine the number of clusters. In the next step, the average value was divided into the contributing factors Pli/half-month k and Psi/half-month k and analyzed in more detail. For a case specific view, half-months were analyzed by individual days for a focus area in Lower Saxony (red circle in in Figure 5). The focus area has a high average compaction risk (high CR cluster) and three crop groups (sugar beet, silage maize, and winter grains) are grown. The individual days are classified according to the compaction risk classes for each crop group and two special years, representing a wet and a dry year. Years are defined as dry and wet when precipitation shows minimum and maximum deviation from the average precipitation in the period 2005–2015.
3. Results
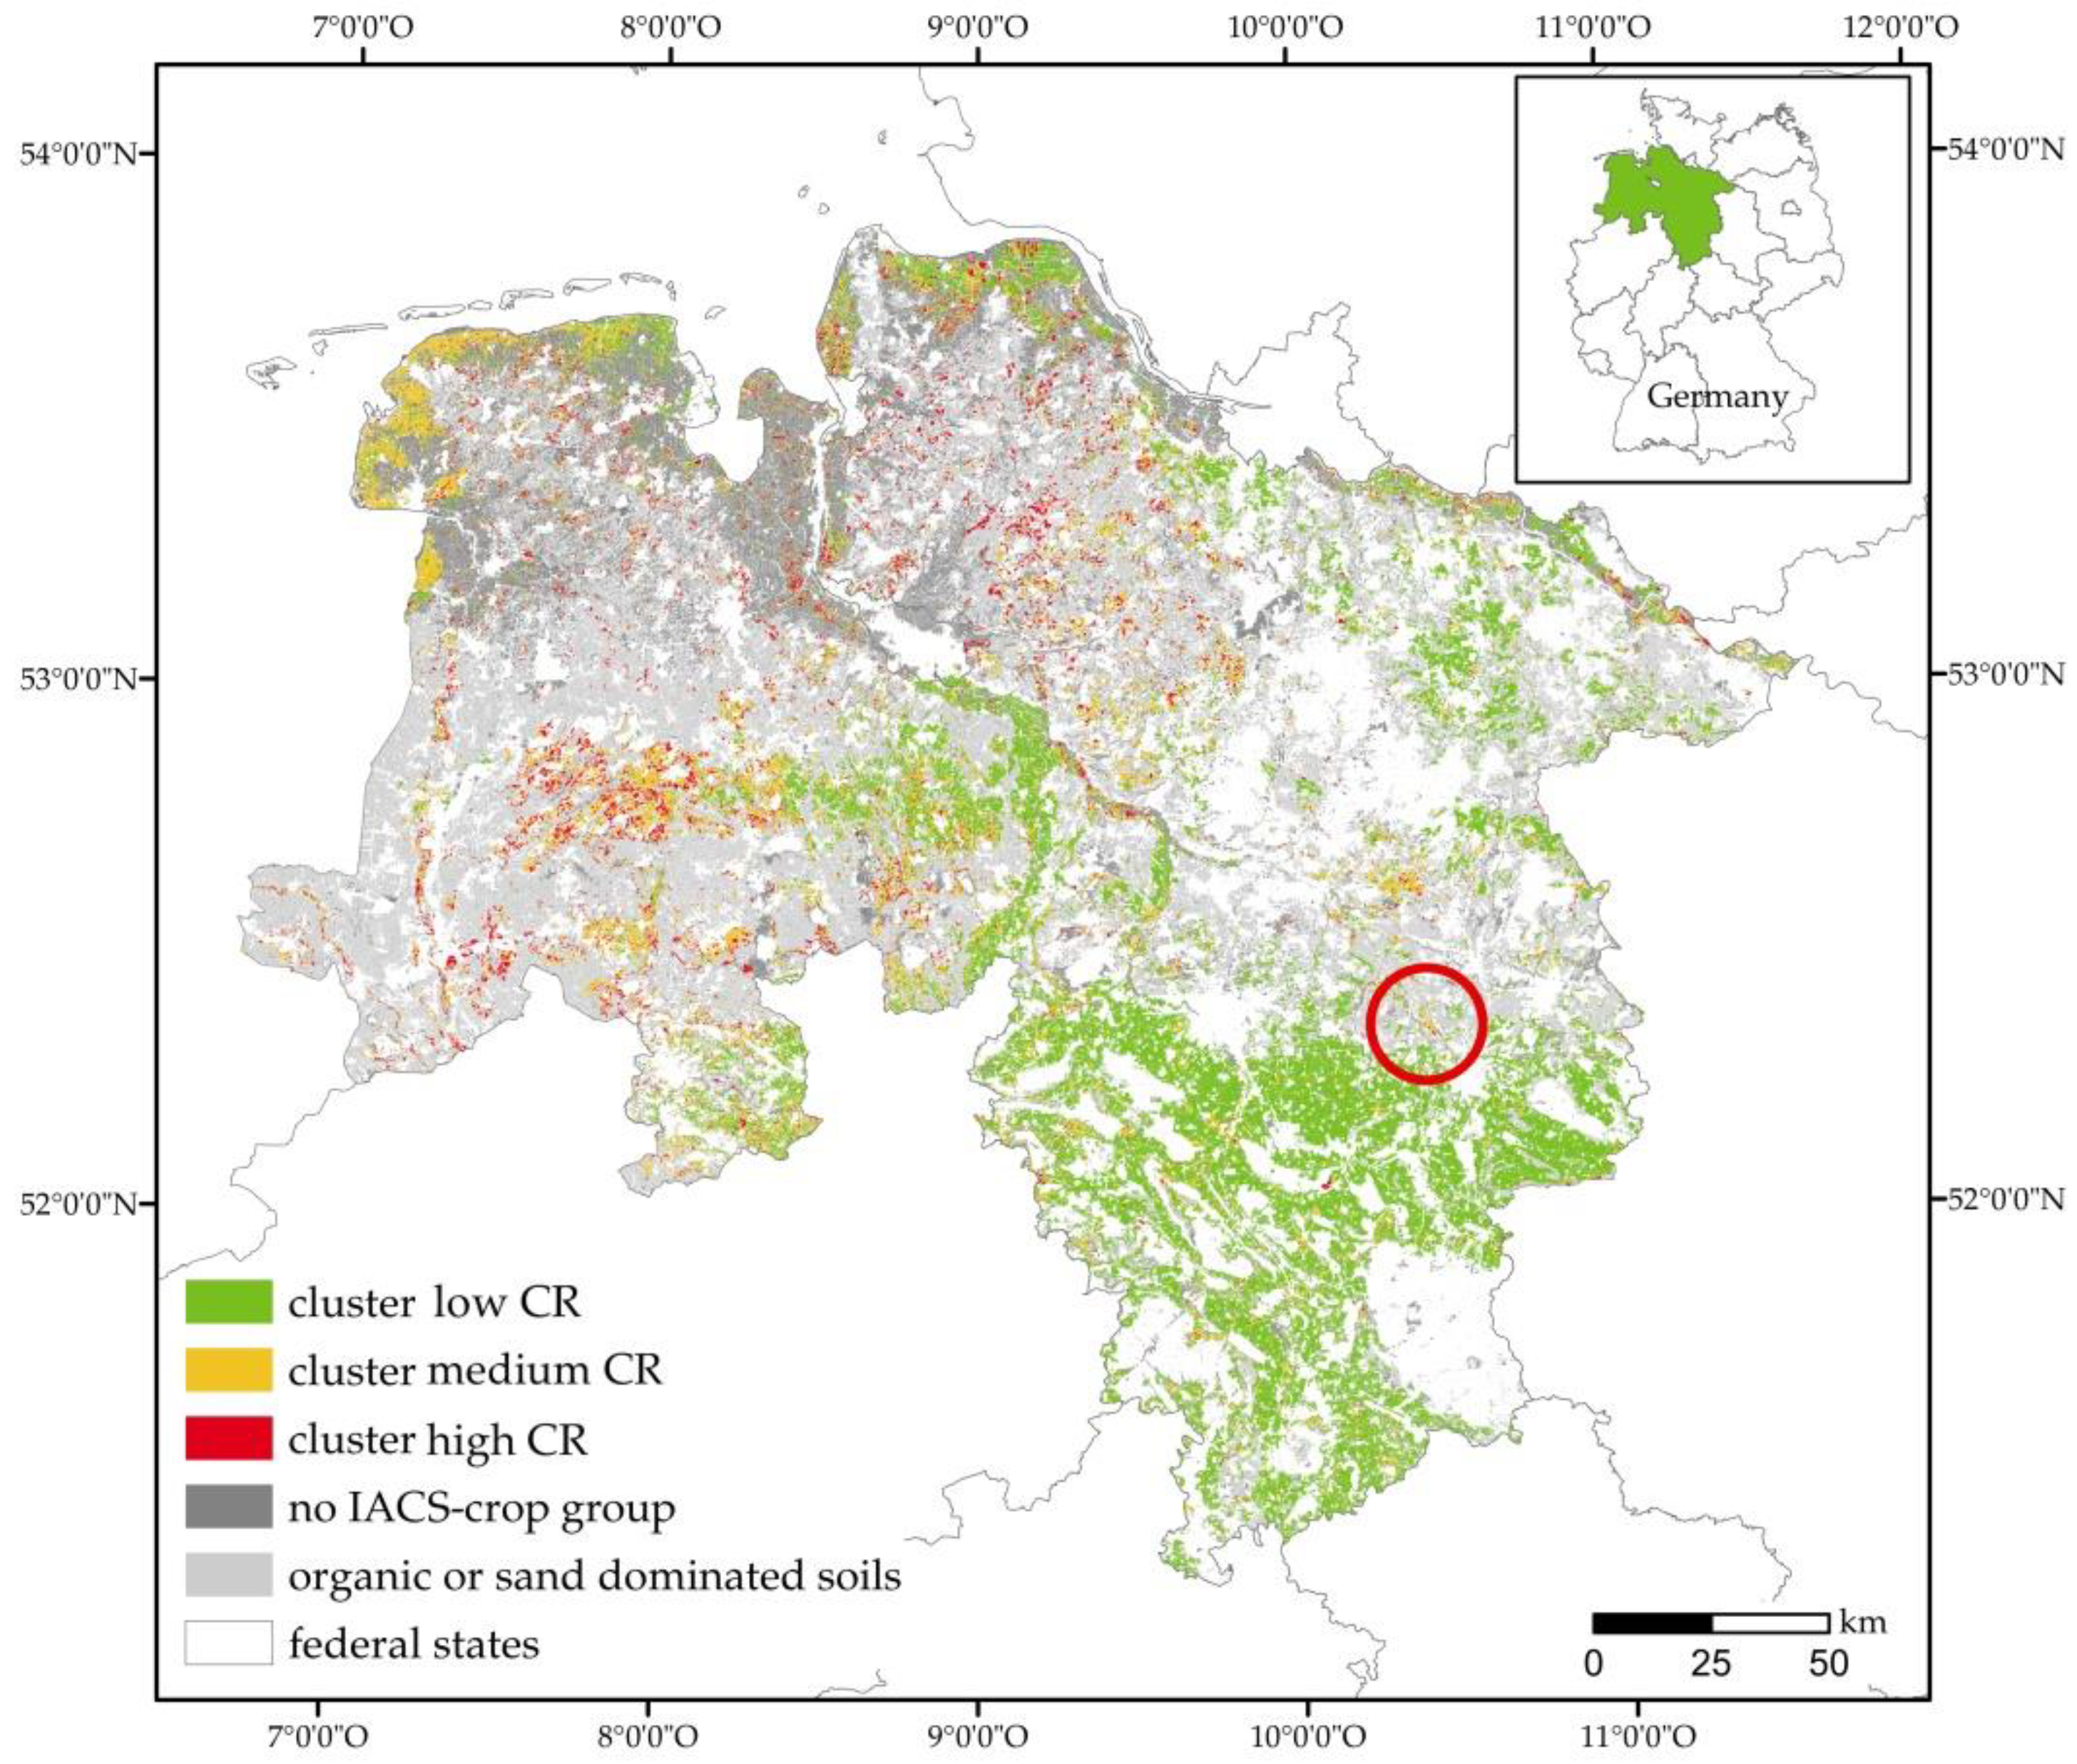
There were approximately 1.9 million ha of arable land in Lower Saxony from 2005 to 2015. Due to the reduction of the considered crops to the dominant crop groups and associated soil moisture data, the area for evaluation reduced to approximately 1.7 million ha. The methodology used to assess the soil susceptibility to compaction by Lorenz et al. [22] is not suitable for organic and sand dominated soils. These soils are not considered in the presented analysis (light grey in Figure 5) and lead to a further reduction to 970,000 ha. In total about 50% of the arable land in 2015 was analyzed. The cluster analysis with the indicators Pcrj (average compaction risk across all years) and Psumj (maximum compaction risk per half-month) resulted in three clusters with a low, medium, and high compaction risk (CR). Figure 4 shows the spatial distribution of the derived cluster. The areas in the cluster with low CR are spread all over Lower Saxony with a local focus in the southern region. The areas of the clusters with medium and high CR are located predominantly in the central and the coastal regions (Figure 4).
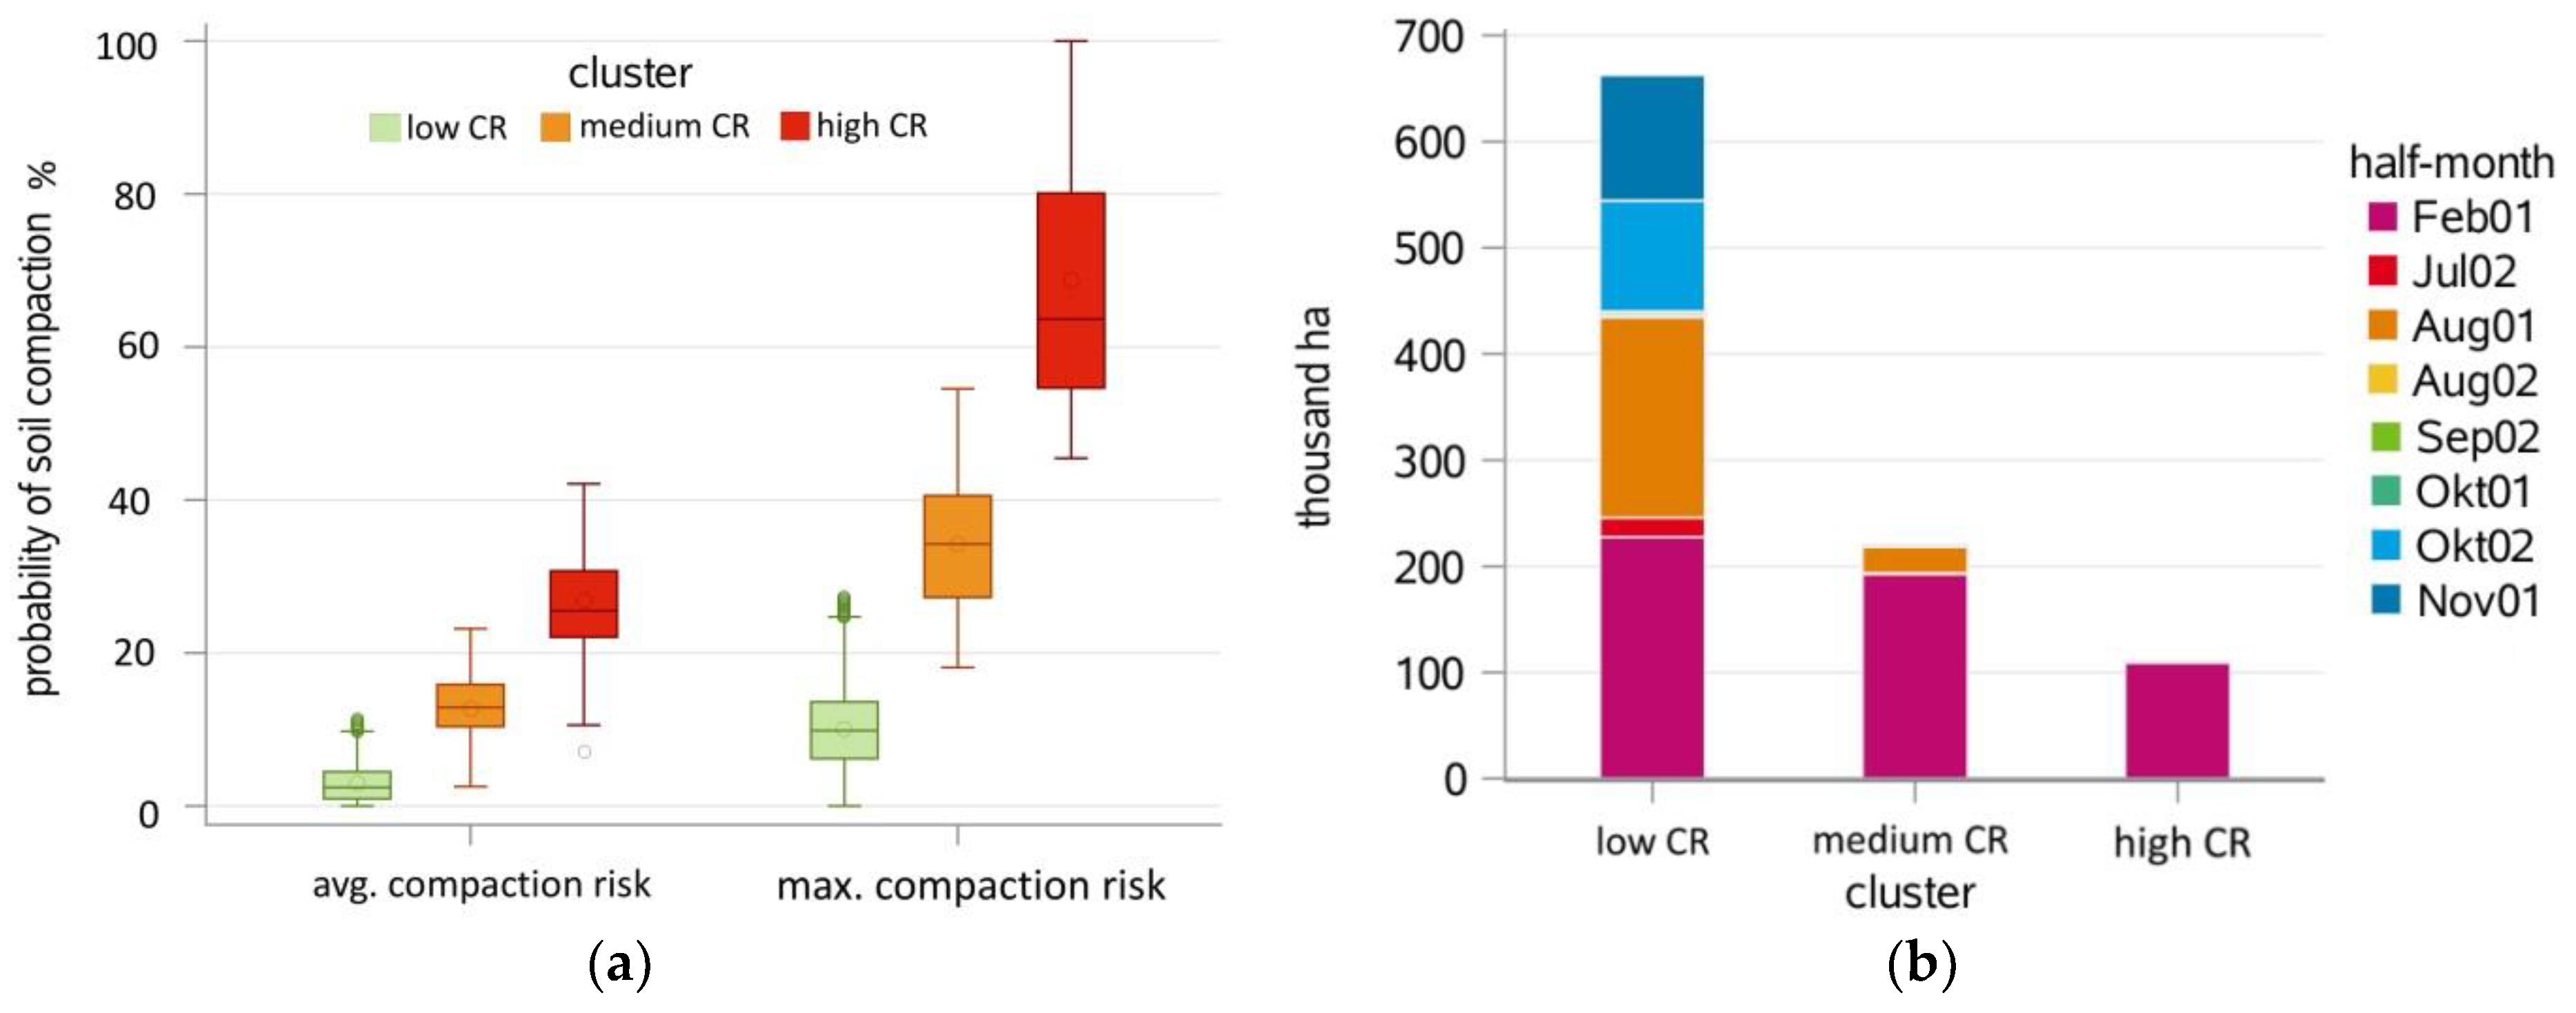
Figure 5a shows the probability in % (y-axis) for the indicators average compaction risk and maximum compaction risk (lower x-axis) for the three clusters (upper x-axis). The low CR cluster has probabilities between 0 and 11% for average compaction risk and probabilities between 0 and 27% for maximum compaction risk. The high CR cluster has probabilities between 7 and 42% for average compaction risk and probabilities for soil compaction between 45 and 100% for maximum compaction risk. The medium CR cluster lies between these two clusters. Figure 5b shows the area of maximum compaction risk per half-months in hectares (y-axis) for the three clusters (x-axis). In the low CR cluster, maximum compaction risk is found in almost every evaluated half-month. In the medium and high CR cluster, the predominant area has its maximum soil compaction risk in Feb01, with a 90–100% probability of susceptibility. Since we have assumed that liquid manure is applied only to silage maize, the determining factors for the maximum compaction risk in February for all three clusters is linked to the probability of silage maize grown in the respective area. In the medium CR cluster, the maximum compaction risk in the first half of August is the result of a 42% probability of winter grains, corresponding with a 60% probability of soil susceptibility to compaction in this time. In the low CR cluster the contributing factors in Jul02 and Aug01 are 50% probability of winter grains with 3% probability of soil susceptibility to compaction in Jul02 and 10% in Aug01. A probability for sugar beets of 15% with approximately 45% probability of soil susceptibility to compaction in Okt02 and Nov01 leads to maximum compaction risk in this half-month.
For all clusters, all soil texture classes are represented by a certain share of area of Lower Saxony (Table 5) (except cluster one; class five). In the low CR cluster, nearly 60% of the area is in soil texture class three, which represents the lower hilly regions in the south with loamy soils. In the high CR cluster, over half of the area has soils in soil class one which represents mostly sandy soils. In the medium CR cluster, the shares are distributed more equally, but with another key area in the coastal region with clayey soils.
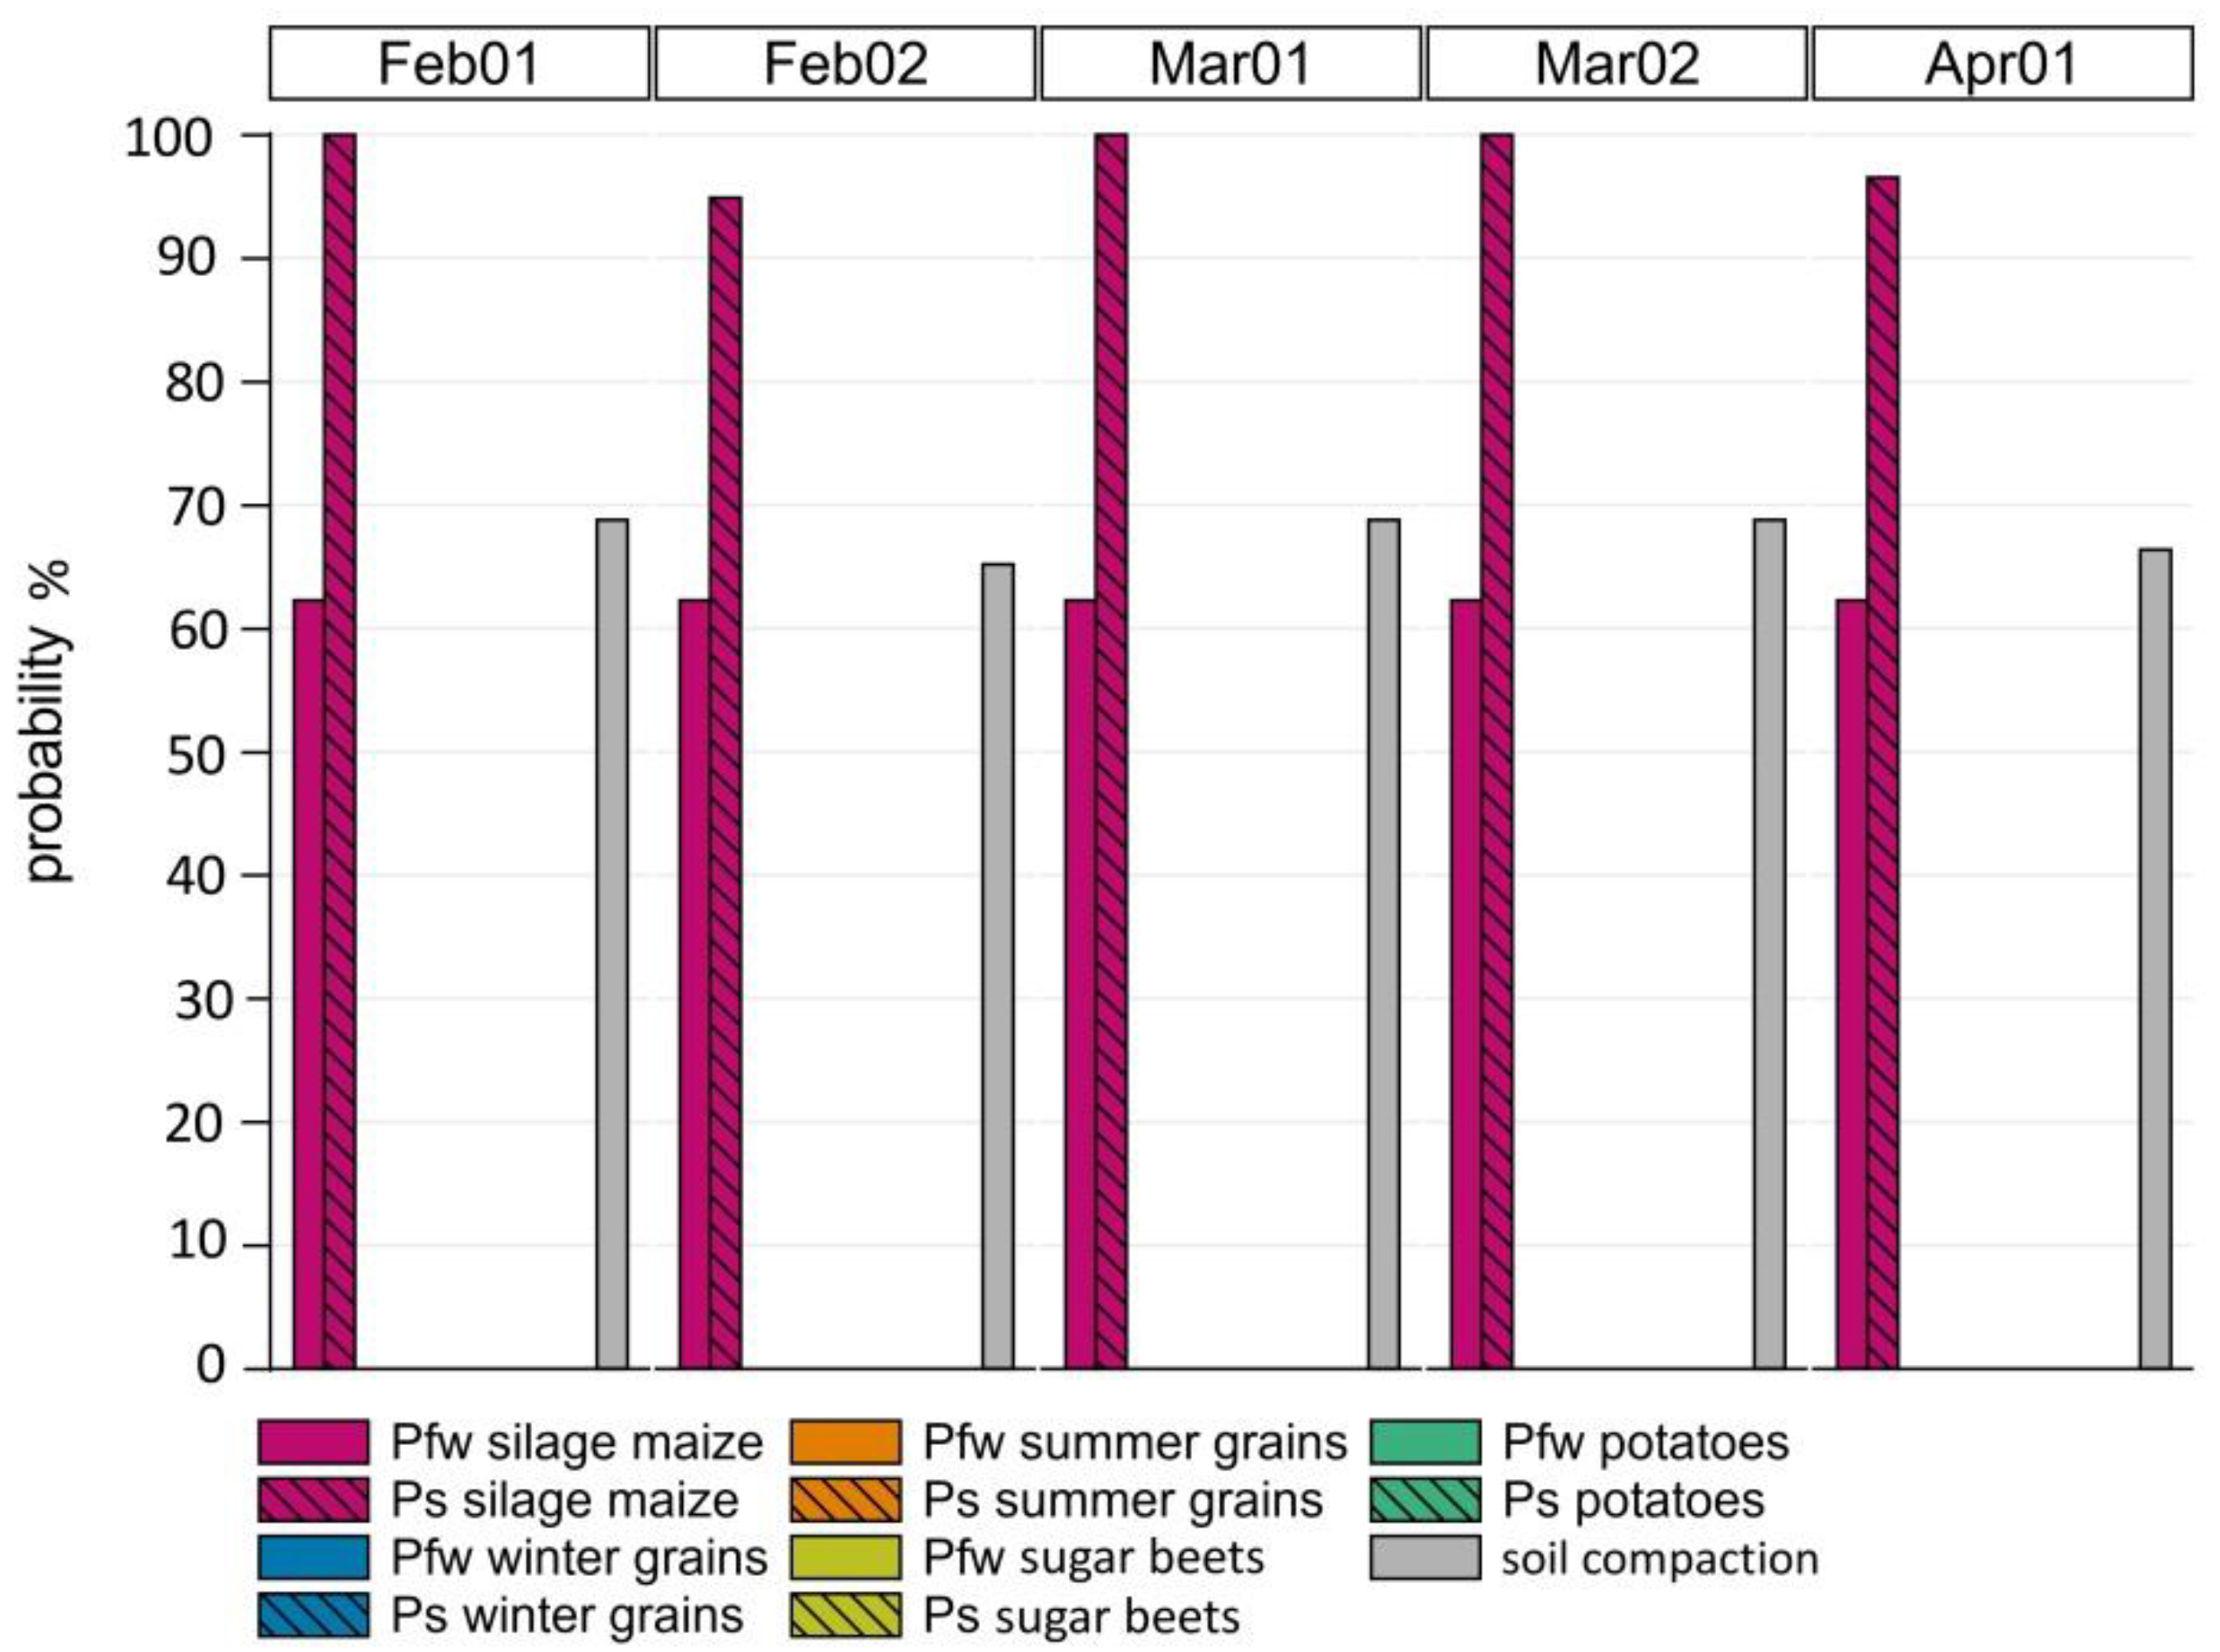
In the next step, we took a closer look at the individual crops groups and half-months. For an example we chose the high CR cluster with an average of 62% silage maize, 22% winter grains, 9% potatoes, 7% spring grains, and 5% sugar beet grown. Figure 6 shows for each crop the probability of field work (Pfw), the probability of soil susceptibility to compaction (Ps), and the resulting average probability of soil compaction for the analyzed half-months in spring as average for the clusters. The growing probability of a crop group is constant during the year and it is assumed that field operations have the same probability every day (100%) within the defined half-months (Table 3). Thus, the probability of field work is 62% for silage maize each month in the considered time span. Consequently, variations in the probability of soil compaction depend only on the variations in the soil’s susceptibility to compaction (Ps). For example, in Feb01 the soil is 100% susceptible to compaction and in Feb02 it is 94%. This results in a decrease in the probability of soil compaction from 68 to 65%. As manure spreading to maize is the only field work in spring, the other crops in the high CR cluster do not contribute to the probability of soil compaction in spring.
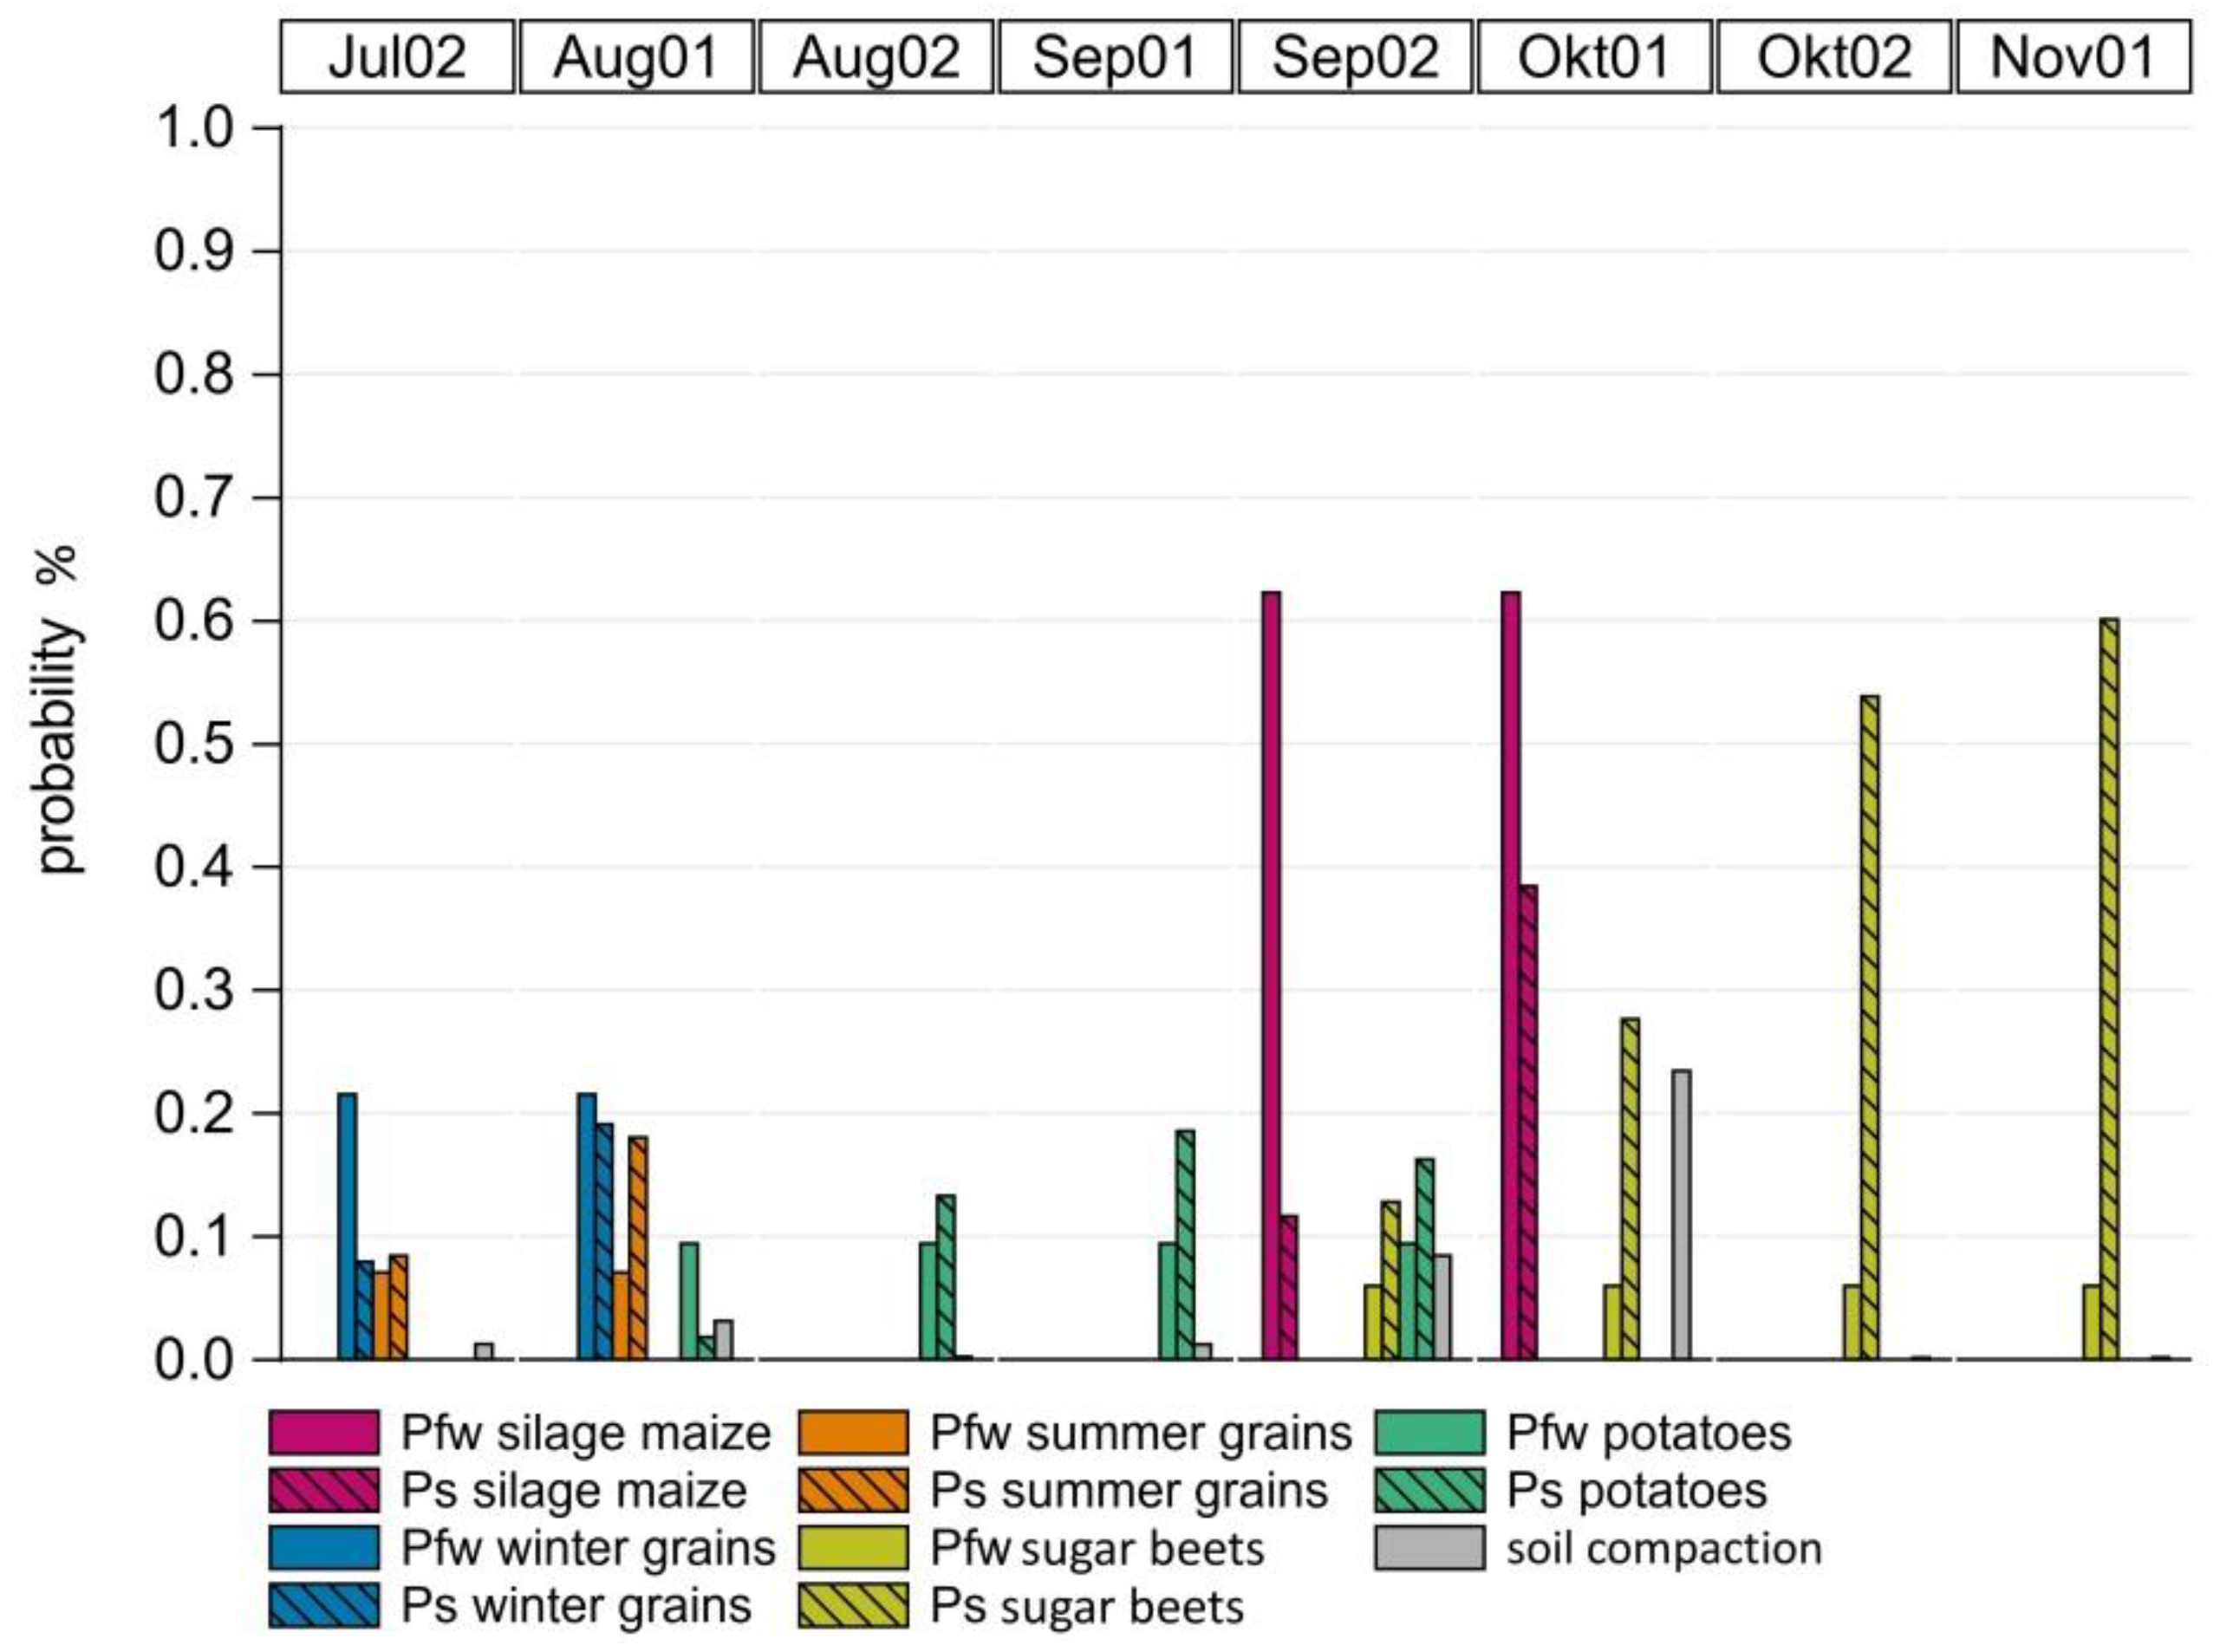
Even if no maximum probabilities of soil compaction are found in summer/autumn for this cluster, there is a certain probability of soil compaction. Figure 7 shows Pfw, Ps, and the probability of soil compaction in summer/autumn. The low probabilities of field work for winter grains, summer spring grains, and potatoes coincide with low probabilities of soil susceptibility to compaction, and thus low probabilities of soil compaction from Jul02 to Sep01. In Sep02, the probability of soil compaction increases (8%) because in this period there is an additional harvesting of silage maize with a field work probability of 62%. In Okt01, the probability of soil compaction rises to 23% because of increased soil moisture content while harvesting silage maize and sugar beets with their associated field work and mechanical load.
In Okt02 and Nov01, it was assumed that the only field operation is harvesting sugar beets (Table 4). The probability of susceptibility in this time is high (60%), but the probability of field work is low at 5%, resulting in a probability for soil compaction below 1%. So, the main contributing factors to the average soil compaction risk in the high CR cluster are manure spreading to silage maize in spring and harvesting silage maize in the first half of October. Both the high share of silage maize and high soil susceptibility to compaction (due to high soil moisture contents) during field work are the major controlling factors.
A focus area (red circle in Figure 5) for the high CR cluster was chosen to demonstrate, on the one hand, the impact of the used machine equipment on the average soil compaction risk and on the other hand, to point out the variability of days within the compaction risk classes for single years, different machine equipment, and half-months. The chosen site comprises 5.3 ha of sandy loam (Slu) with an average compaction risk of 23%. The growing probabilities are 18% winter grains, 55% silage maize, and 27% sugar beets. The maximum risk, with 55% probability for soil compaction, is found in the first half of February due to manure spreading to silage maize. For manure spreading, two different types of machine equipment were evaluated: the self-propelled manure spreader with a medium mechanical load and the umbilical cord manure spreading with a very low mechanical load. Machine equipment with a medium mechanical load was assumed for harvesting (see Table 4). For spring, 2008 was chosen as a wet year and 2012 as a dry year. For autumn, 2007 was chosen as a wet year and 2011 as a dry year (Table 6).
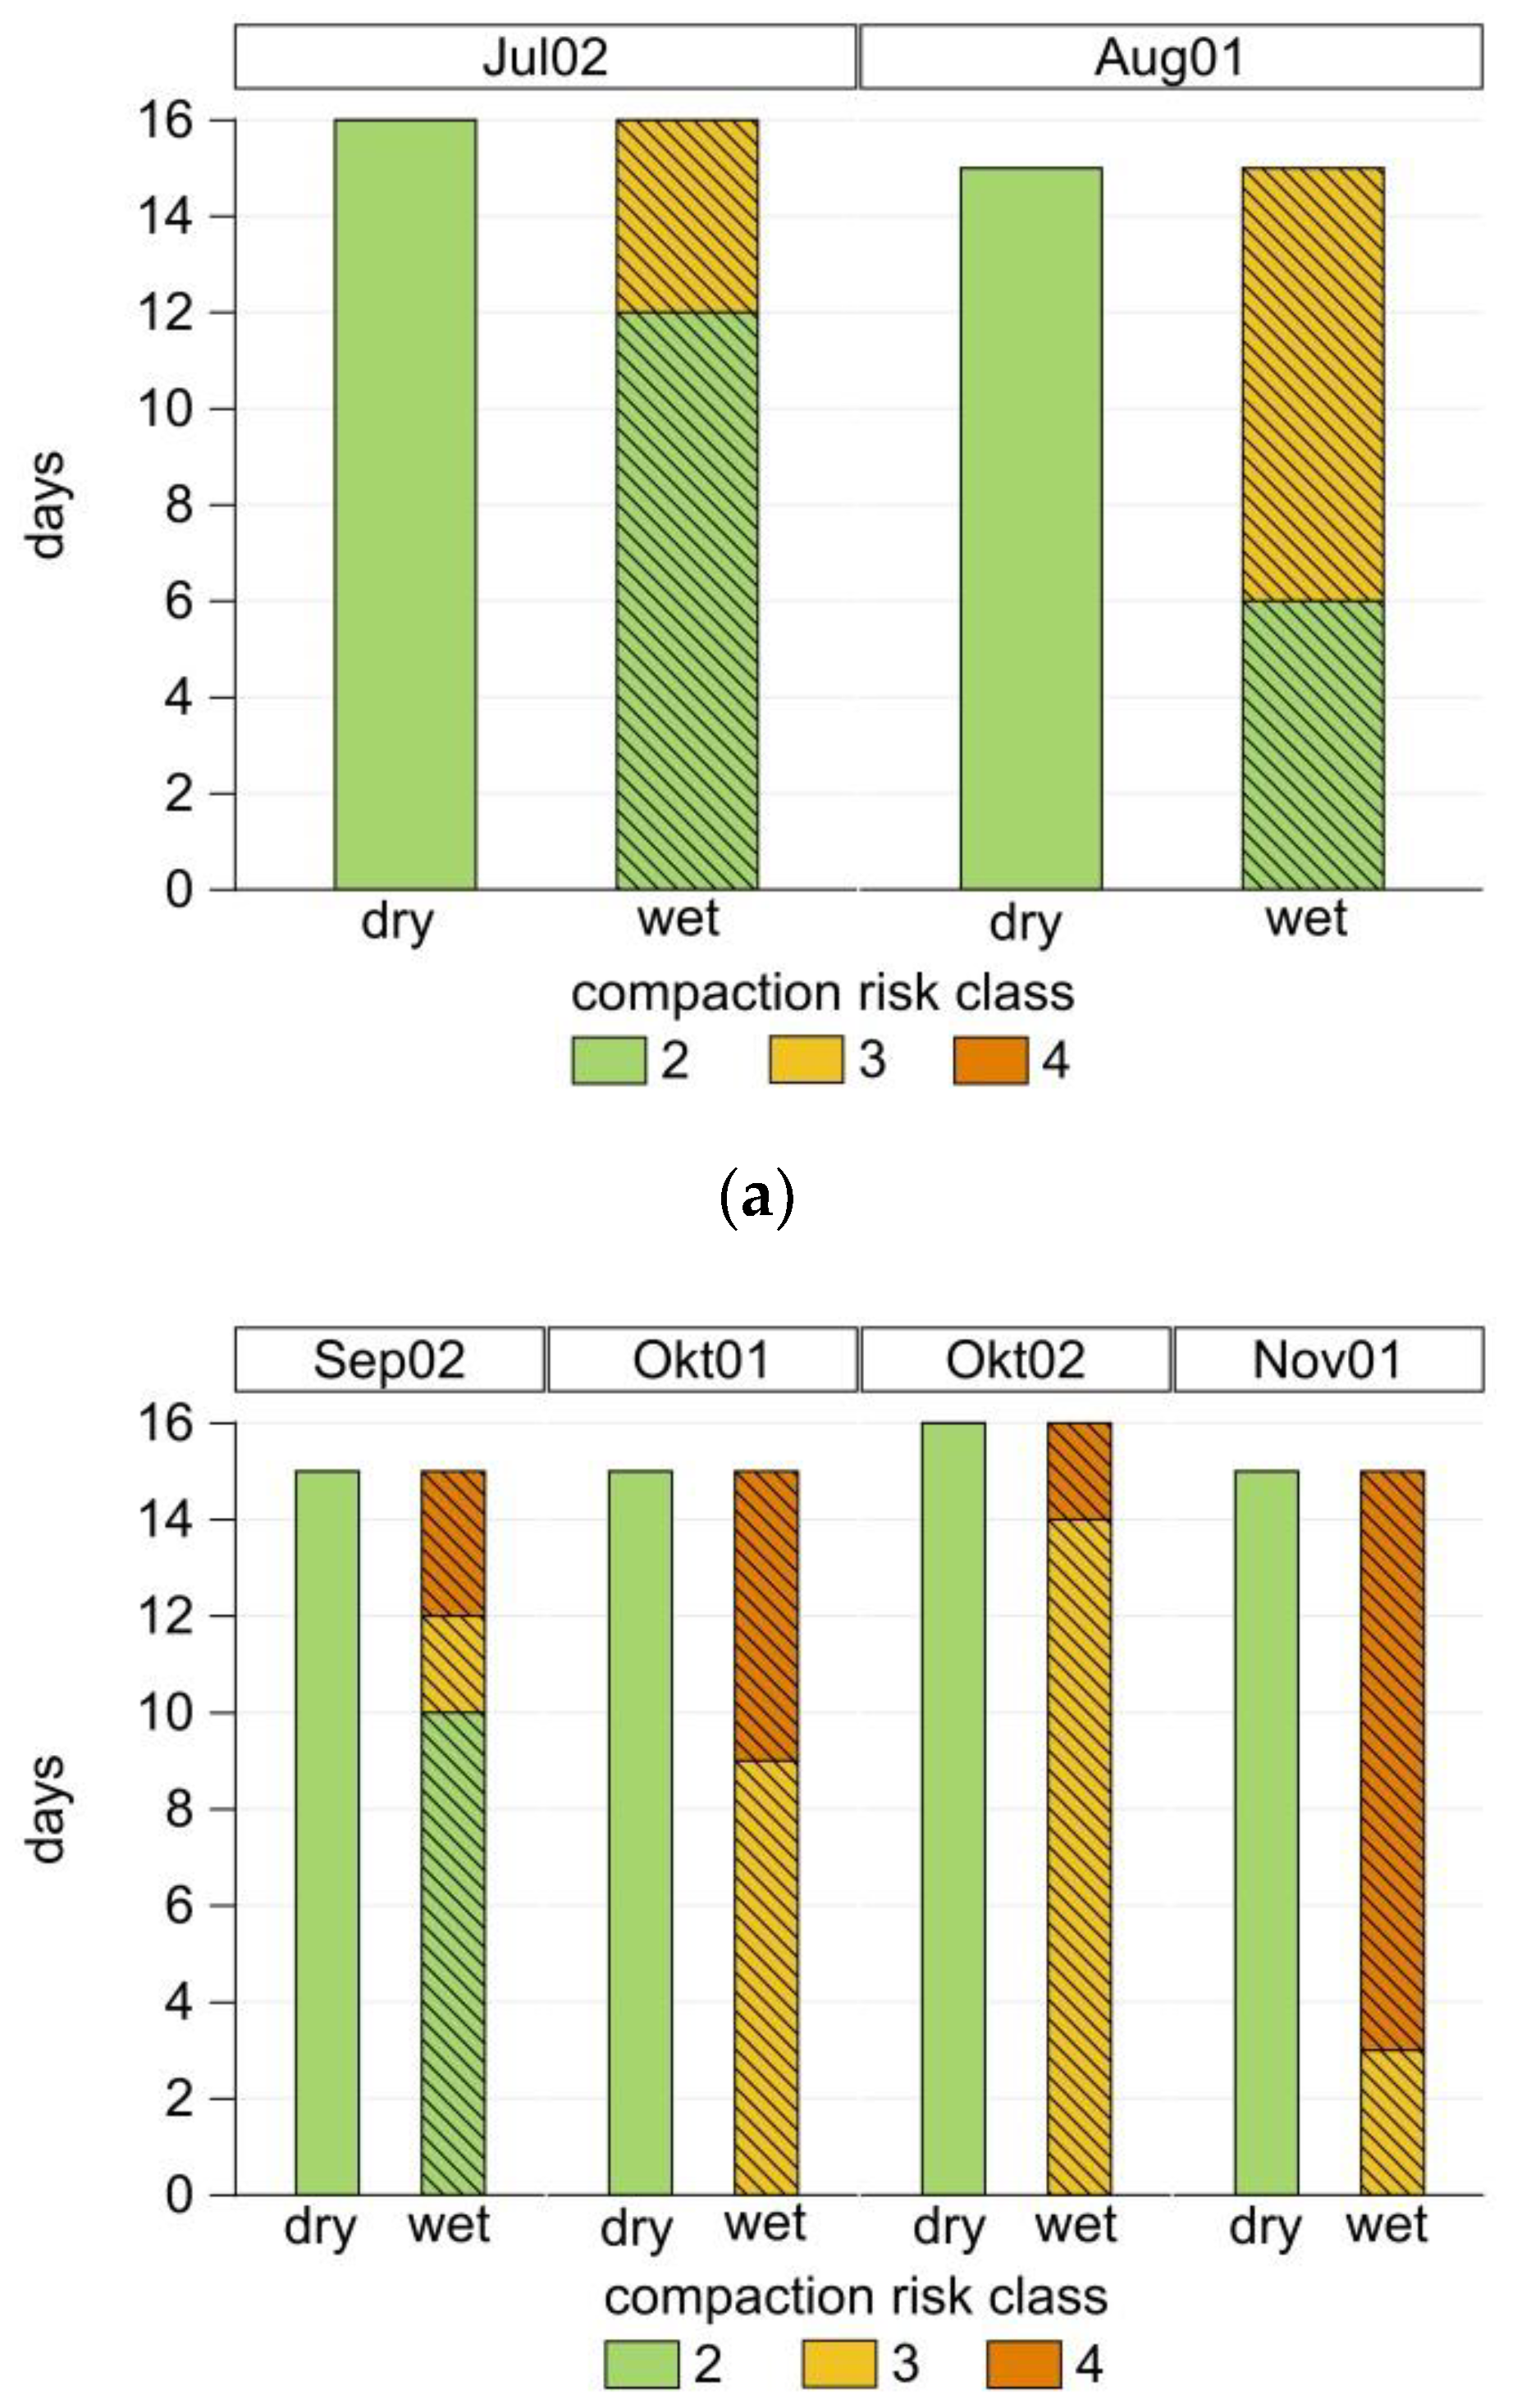
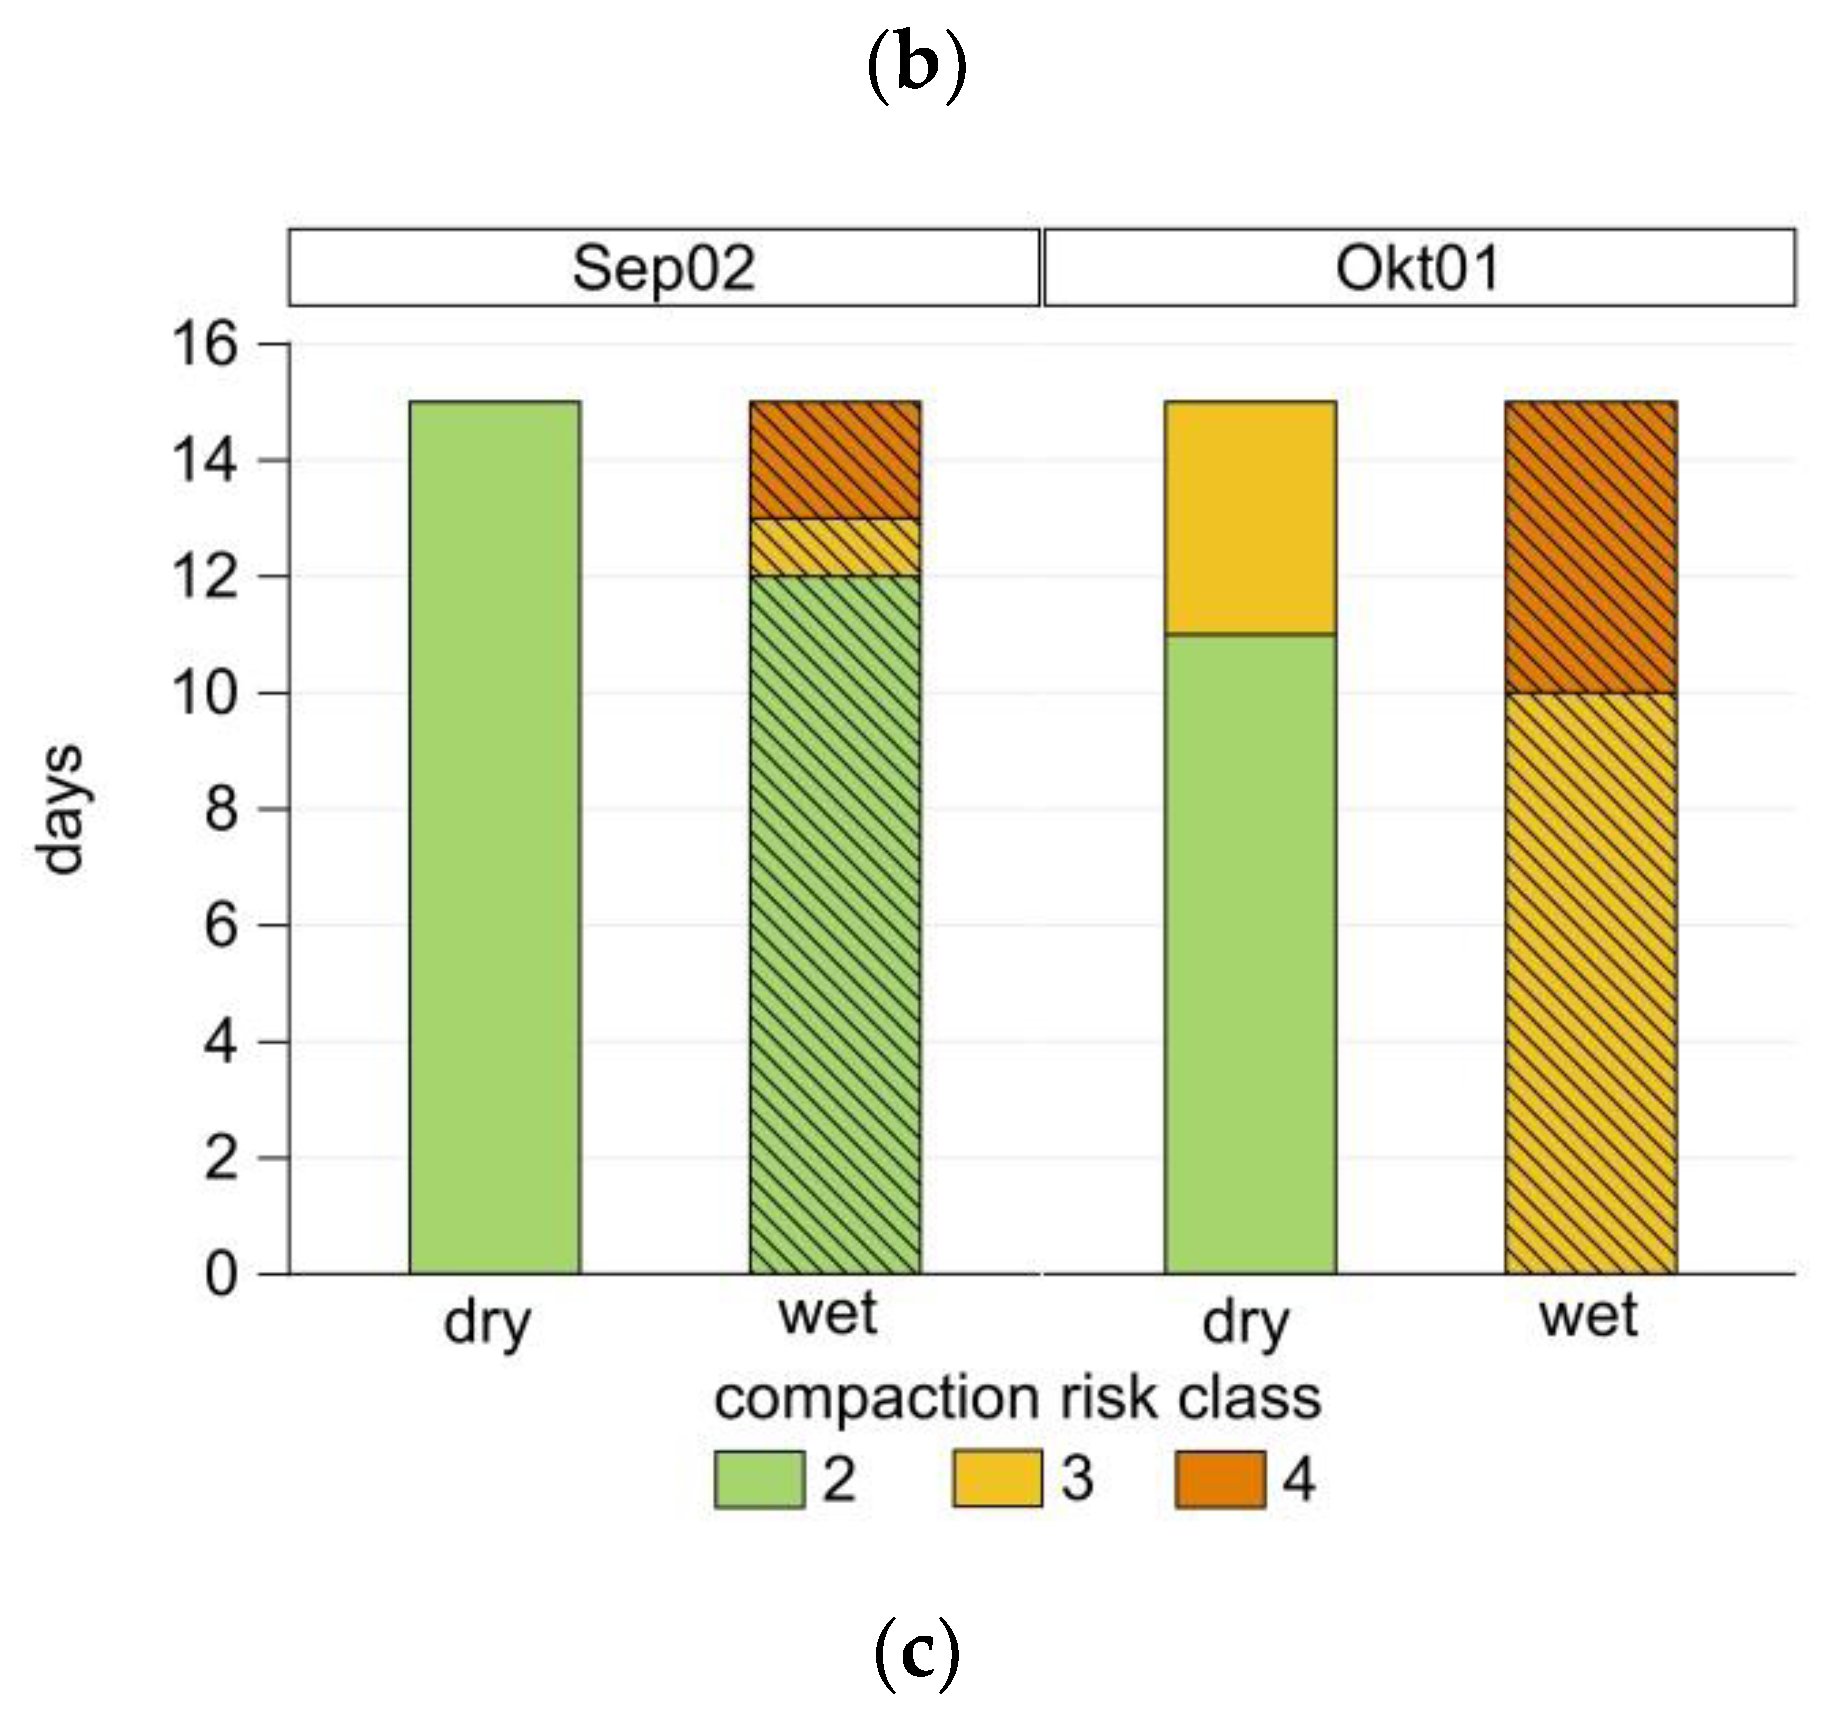
The soil compaction risk is categorized into five classes from very low to very high (Figure 3). Figure 8 shows the number of days within the compaction risk classes (y-axis) for harvesting winter grains (a), harvesting sugar beets (b), and harvesting silage maize (c) per half-month (upper x-axis). The number of days is further presented for the wet and the dry year for each half-month (lower x-axis). In general, the days with low compaction risk decrease from Jul02 to Nov01 because of increasing precipitation, soil moisture content, and thus, soil susceptibility to compaction. For harvesting winter grains (Figure 8a) in Jul02 and Aug01 in a dry year, all days have a low– medium compaction risk; in a wet year the days with low compaction risk increase in favor of the days with medium compaction risk. For harvesting sugar beets (Figure 8b) in a dry year, all days in the associated time period have a low compaction risk. In a wet year, days with a low compaction risk are only available in Sep02. The number of days with medium and high compaction risk increase until Nov01. For harvesting silage maize (Figure 8c), in a dry year in Sep02, all days have a low compaction risk, and in Okt01, there are 11 days with a low and 4 days with a high compaction risk. In a wet year, in Sep02, just 12 days have a low compaction risk. For this soil type (Slu) and medium mechanical load compaction risk class 2 is associated with field capacity 0–60.5%, class 3 with >60.5–94%, and class 3 with >94%; for a very low mechanical load class 1 is associated with 0–60.5% field capacity, class 2 with >60.5–94%, and class 3 with >94%.
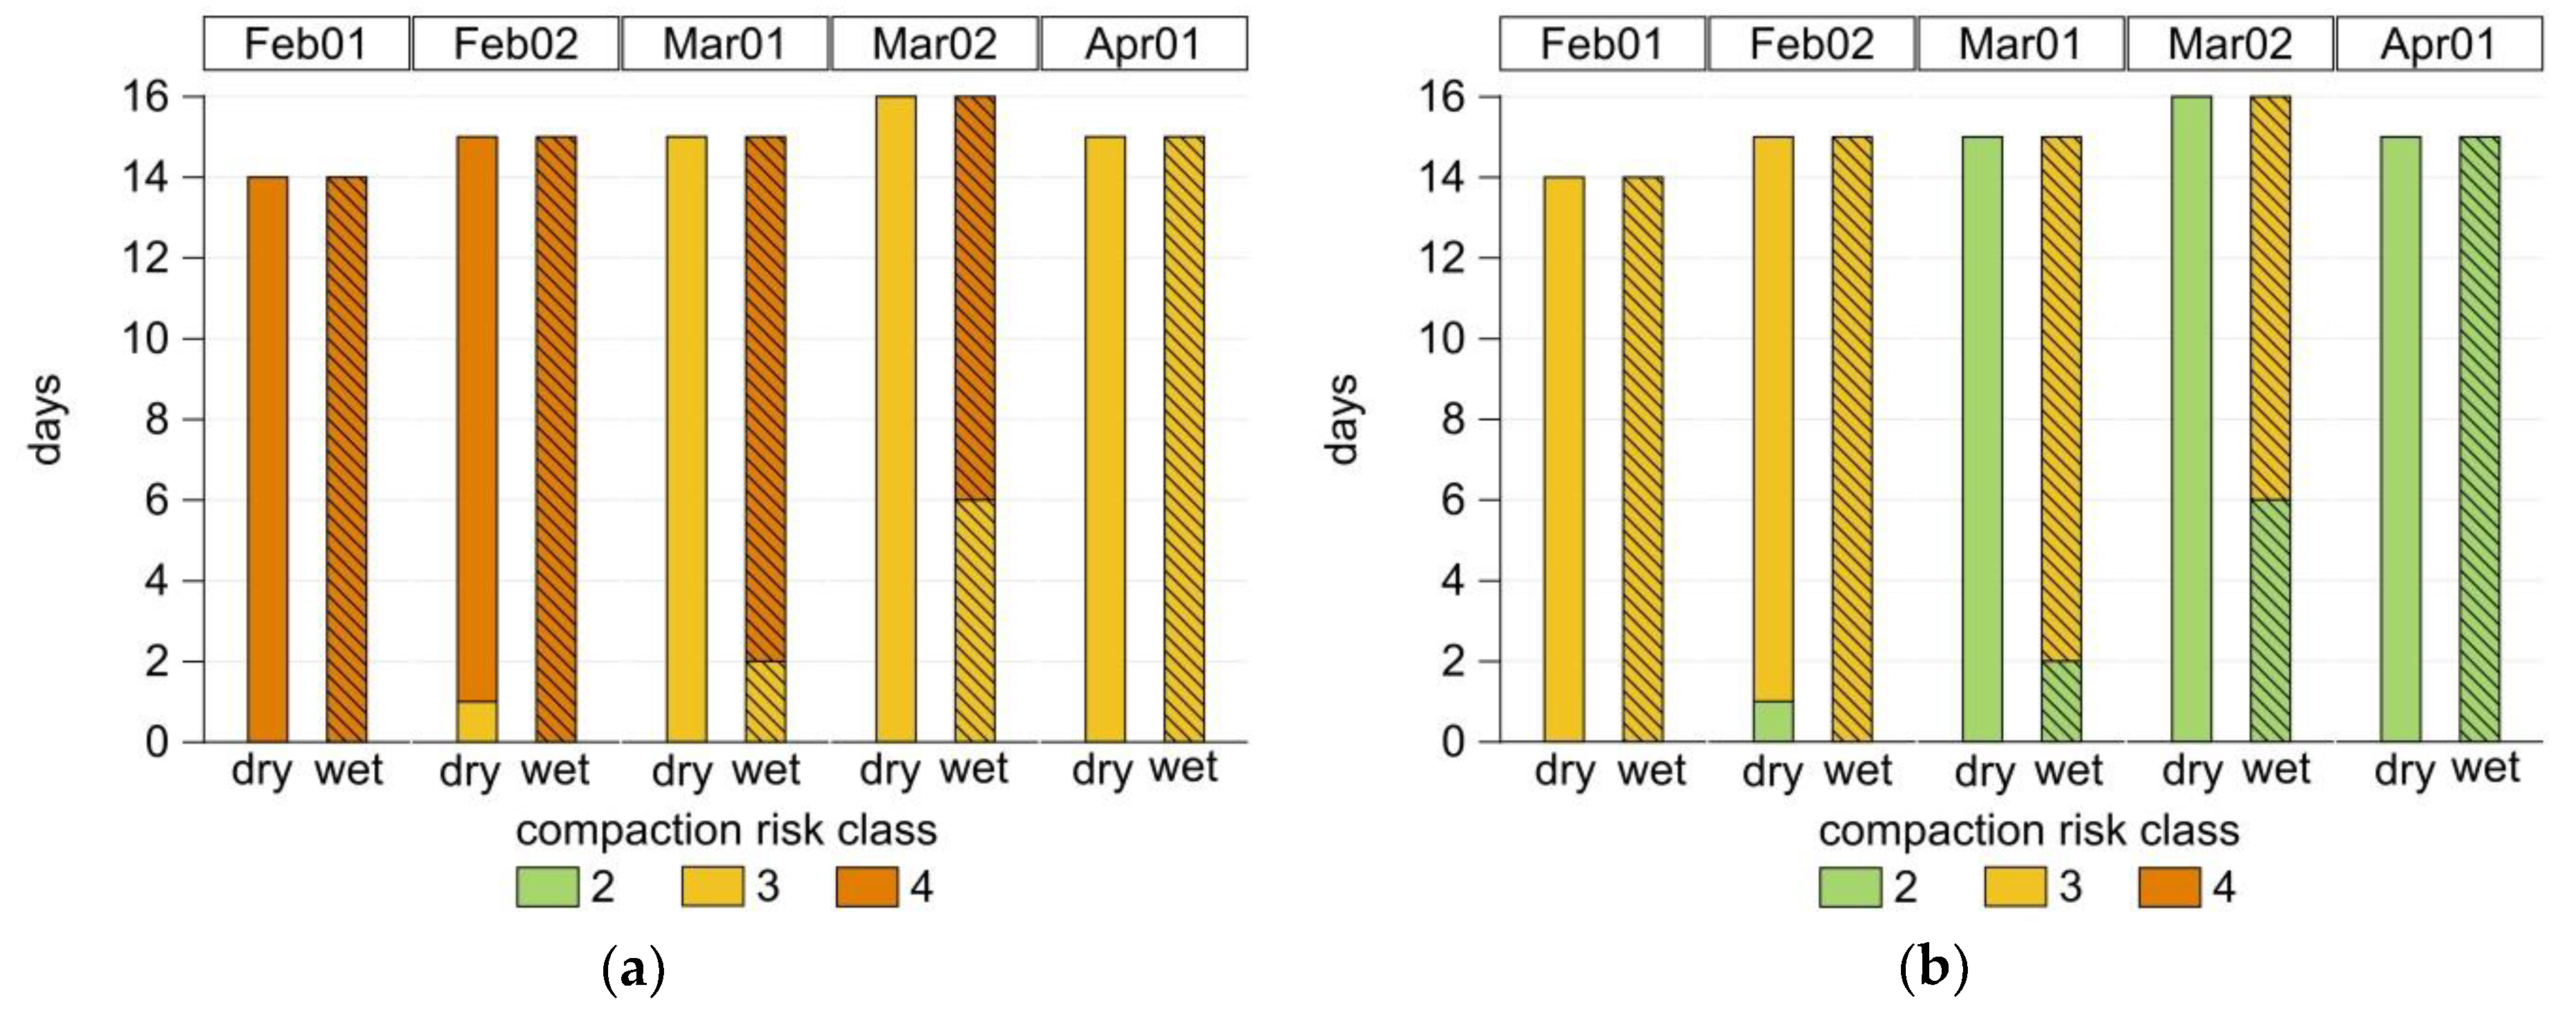
For manure spreading to maize in spring the opposite holds true for the conditions in autumn. Over the course of the year the days with a high compaction risk decrease and the days with a medium risk increase (Figure 9a,b).
With the self-propelled manure spreader (Figure 9a), all days are associated with a high compaction risk for both a dry and a wet year in Feb01. In a dry year, there is one day with medium compaction risk in Feb02, there are no such days for wet conditions. In Mar01, all days have a medium compaction risk for dry conditions, and just two for wet conditions. For both conditions, there is an increase to 15 days with medium compaction risk until Apr01. With umbilical cord manure spreading (very low mechanical load) the compaction risk is reduced. While the soil susceptibility to compaction remains the same, the decreased mechanical load leads to a lower risk class for each day (Figure 9b). While all days in Feb01 are associated with high compaction risk with the self-propelled manure spreader, they are associated with a medium compaction risk with the umbilical cord spreader. So, even if soils are susceptible to compaction, the compaction risk can be reduced through the choice of machine equipment. The average probability of soil compaction for the focus area was reduced from 23% for manure spreading with the self-propelled manure spreader to 13% with the umbilical cord spreader.
To answer the question of current soil compaction risk it needs to be evaluated whether the farm specifications are suitable to carry out field operations within the given days or not. This depends on the capability of the machine equipment, the labor force, the size and shape of the field and the current share of the specific crops.
4. Discussion
The highest probability for soil compaction was found in the high CR cluster. Over 50% of the areas in this cluster are associated with sand dominated soils. The reason for the high probability of compaction risk is the high shares of silage maize and the corresponding manure spreading in spring. With the high soil moisture contents from Feb01 to Apr01 we find a high probability of compaction risk even on the sandy soils in the high CR cluster which are ranked as low to medium endangered by Lebert [29]. For the determination of compaction risk areas, this shows the necessity to include not only the type of soil, but also the crop growing patterns, times of field work, and mechanical load of the machine. An additional necessity is the consideration of time windows/spans of field work and thus the given soil moisture content at the time of field operation. Comparing the results with those of Lebert [29], there are both similarities and differences. In general, there is a good match for the medium and low CR cluster in the center and north of Lower Saxony, whose soil functions in the subsoil layer are classified by Lebert [29] as highly endangered. We identified differences for the areas in the low CR cluster in the south of Lower Saxony; in this area the soil functions in the lower soil layer are also classified by Lebert [29] as highly endangered, but a low probability of compaction risk is shown in the presented study. The loamy soils in this cluster are inherently more susceptible to compaction but are not faced with a high probability for field operations in critical times with high soil moisture contents. Thus, the probability of compaction risk is low due to patterns of cropping and field operations. In this case, the approach proposed by Lebert [29] leads to an overestimation of compaction risk because the time and mechanical load of field operations is not taken into account. Within the general similarities and differences, there are variations resulting from the spatially explicit analysis of the cropping patterns and the higher resolution of the soil map used. For two fields in northern Germany, Kuhwald et al. [53] evaluated the compaction risk using the SCI. Temporal variations in soil moisture contents as well as crop growing patterns and associated machine equipment are included. The seasonal variations of the derived compaction risks show similar patterns throughout the year with a strong dependency on soil moisture content.
The assessment of the average compaction risk was conducted with a medium mechanical load (method see Appendix A, Table A1). As the comparison for manure spreading showed, with a low or very low mechanical load the magnitude and distribution compaction risk may vary. However, it shows that the use of machines with a low (or very low) mechanical load can significantly reduce the risk of compaction. These findings reflect the physically based results of Schjønning et al. [8] who noticed a lower penetration resistance and higher yields after traffic in springtime with a self-propelled manure spreader with less filling as compared to more filling, or Lamandé and Schjønning [17], who account for increasing soil stress with increasing wheel loads. At the same time, time spans with a lower compaction risk, and thus field working days can be expanded. The work presented is an improvement of Troldborg et al. [32] since both the cropping patterns and the field operating times could be analyzed in a more differentiated form in terms of time and quality. Compared to the approach of Jones et al. [12], which includes soil moisture content as a potential soil moisture deficit during the growing season, we could include the inner annual variations of soil moisture contents to a greater extent and in more temporal detail; this is of particular interest for farm-specific planning.
For the analysis, we made a number of assumptions due to a lack of data and knowledge. The coarse grouping of cultures and assignment of soil moisture values represents an abstraction of reality, as well as the assumption of used machinery and field working times. Additionally, due to the IACS-data, we incorporated a certain amount of uncertainty in the spatial explicit location of the grown crops. Because of the number of assumptions and the uncertainty in the location of the crops, we are not able to assess a prevailing compaction risk, but a potential expressed by probabilities. Specific farm equipment has to be included to evaluate the prevailing compaction risk, as in the study of Rücknagel et al. [35,54] and Edwards et al. [54]. As the used assessment system by Lorenz et al. [22] has been initially verified by the developer, the next step is to further substantiate the system with physically based findings, which is planned in ongoing projects. Further on, the presented approach should be applied with a different underlying soil moisture model (for example, MONICA [55]). On the one hand, this is to test the sensitivity of the approach to soil moisture data; on the other it is to further differentiate crops and their associated soil moisture contents. A comparison of the modeled compaction risk of the same study sites with the approach of Kuhwald et al. [53] could give an indication of the model quality.
5. Conclusions
With the presented approach, we clearly identified the main maize cropping area in Lower Saxony as the area with the highest probability of soil compaction, where the main contributing factor is manure spreading in spring. The remaining area of Lower Saxony is associated with a lower probability of soil compaction, resulting from a combination of manure spreading in spring and harvesting in autumn. It has been shown that the use of soil-protecting machine equipment while manure spreading in spring can significantly reduce the risk of compaction. This plays a major role, especially in regions with a high proportion of maize. These areas should be examined more closely to identify farm- and site-specific driving factors for soil compaction and to develop and propose adapted management strategies to protect soil functions in the long-term. Further studies within the SOILAssist-project will use the presented results to evaluate current compaction risk at the farm scale, by determining unsuitable conditions (medium to very high compaction risk) for field work and to evaluate technical and management options to avoid soil compaction in these situations in a socioeconomic sense. This work shows how different (mass) data can be used to identify risk areas in ex-post evaluation. Above all, the inclusion of high-resolution land use and soil moisture data represents an improvement of existing approaches. At the same time it shows the limitations and problems due to a lack of data and information availability.
Author Contributions
S.L. designed the study, analyzed the data and wrote the manuscript; M.L. reviewed and edited the original manuscript; M.L. and J.B. are responsible for the funding acquisition and project administration; M.L., J.B., and N.F. are responsible for defining mechanical equipment and the associated mechanical load, and were the expert consortium for questions about the susceptibility of soil to compaction, machinery, crop growing patterns, and the decision matrix used (Methodology).
Funding
This work was conducted as part of the SOILAssist-Project within the BonAres initiative, funded by the Federal Ministry of Education and Research, BMBF (grant No. 031A563A).
Acknowledgments
We thank the unknown reviewers for the helpful comments to improve the quality of this article.
Conflicts of Interest
The authors declare no conflicts of interest. The funding sponsors had no role in the design of the study; in the collection, analyses, or interpretation of data; in the writing of the manuscript, and in the decision to publish the results.
Appendix A

Table A1.
Calculation method for the “characteristic load value”; example: maize harvester 350 kW, transport trailer 138 kW 40 m3, transport trailer with tire pressure for street transport, and transport in track of harvester [22].
Table A1.
Calculation method for the “characteristic load value”; example: maize harvester 350 kW, transport trailer 138 kW 40 m3, transport trailer with tire pressure for street transport, and transport in track of harvester [22].
| A | B | C | D | E | F | G | H | ||
| Machine and Number of Axles Taken into Account | Harvester | Transport Tractor | Trailer | Maximum | Mean | ||||
| Front Axle | Rear Axle | Front Axle | Rear Axle | Front Axle | Rear Axle | ||||
| 1. axle | 2. axle | 3. axle | 4. axle | 5. axle | 6. axle | ||||
| 1 | wheel load [t] | 4.8 | 3.5 | 1.2 | 3.2 | 3.8 | 3.8 | 4.8 | 3.4 |
| 2 | tire pressure [kPa] | 100 | 100 | 160 | 200 | 350 | 350 | 350 | 210 |
| 3 | contact area pressure [kPa] | 120 | 120 | 100 | 120 | 150 | 150 | 150 | 130 |
| 4 | number of wheel passages per track | 6 | |||||||
| 5 | share of wheeled area [%] | 40 | |||||||
| lower bound | upper bound | weighting | share of load | ||||||
| 6 | wheel load [t] | 0.5 | 12 | 2.0 | 0.8 | ||||
| 7 | tire pressure [kPa] | 60 | 400 | 1.0 | 0.5 | ||||
| 8 | contact area pressure [kPa] | 40 | 250 | 2.0 | 1.1 | ||||
| 9 | number of wheel passages per track | 1 | 6 | 0.6 | 0.6 | ||||
| 10 | share of wheeled area | 0 | 100 | 0.2 | 0.1 | ||||
| 11 | sum of weightening | 5.7 | |||||||
| 12 | sum of load | 3.02 | |||||||
| 13 | “characteristic load value” | 0.52 | |||||||
| load class | 1 | 2 | 3 | 4 | 5 | ||||
| upper bound | 0.38 | 0.46 | 0.54 | 0.62 | 0.70 | ||||
| lower bound | 0.30 | 0.38 | 0.46 | 0.54 | 0.62 | ||||
Calculation of the weighting of parameters “number of wheel passages per track” and “share of wheeled area”:
(1) C9 = (H1/B6) × C6
(2) C10 = (C9 + (A5/100)
Calculation of the share of load:
(3) E6 = (G1/B6) × C6
(4) E7 = ((H2/B7) × C7)/100
(5) E8 = ((H3/B8) × C8)/100
(6) E9 = (A4/B9) × C9
(7) E10 = (A5/B10) × C10
Table A2.
Ranges of axial load and tire pressure for the used machine equipment.
| Machine Equipment | Mechanical Load | Number of Axles Considered | Range of Axial Load in t | Range of Tire Pressure in kPa |
|---|---|---|---|---|
| Harvester 360 kW 10m3, dual tires | medium | 2 | 3.1–11 | 100–160 |
| Maize harvester 350 kW, transport trailer 138 kW 40 m3 | medium | 6 | 1.2–4.8 | 100–350 |
| self-propelled manure spreader 350 kW 20 m3, crab steering | medium | 2 | 10–10.9 | 140 |
| Tractor 138 kW, umbilical cord 24 m manure spreading | very low | 2 | 0.7–3.9 | 80–100 |
| self-propelled sugar beet harvester, two-axis, crab steering | medium | 2 | 7.7–8.6 | 150 |
| Tractor 138 kW, drawn 2-row potato bunker-harvester | medium | 3 | 1.1–6 | 80–200 |
Appendix B
Figure A1.
Soil susceptibility to compaction depending on soil type and soil moisture content (source: modified according to [22]; Reproduced with the permission from Lorenz et al., Landbauforschung; published by Johann Henrich von Thünen-Institut, 2016).
Figure A1.
Soil susceptibility to compaction depending on soil type and soil moisture content (source: modified according to [22]; Reproduced with the permission from Lorenz et al., Landbauforschung; published by Johann Henrich von Thünen-Institut, 2016).

Table A3.
Mean values for medium susceptibility per soil type for average risk evaluation.
| Soil Susceptibility Class | Soil Type | % Field Capacity |
|---|---|---|
| 1 | Su2 (slightly silty sand) and Sl2 (slightly loamy sand) | 80 |
| 2 | Su4 (highly silty sand), Su3 (medium silty sand), Slu (loamy silty sand), Sl3 (medium loamy sand), Sl4 (highly loamy sand), and St2 (slightly clayey sand) | 79.5 |
| 3 | Ut3 (medium clayey silt), Ut2 (slightly clayey silt), Uls (loamy sandy silt), Us (sandy silt), Uu (pure silt), Ls2 (slightly sandy loam), Ls3 (medium sandy loam), Ls4 (highly sandy loam), and St3 (medium clayey sand) | 79 |
| 4 | Ut4 (highly clayey silt), Lu (silty loam), Tu4 (silty cl), Tu3 (medium silty clay), Lt2 (slightly clayey loam), Lt3 (medium clayey loam), Lts (clayey sandy loam), Ts4 (highly sandy clay), and Ts3 (medium sandy clay) | 77 |
| 5 | Ts2 (slightly silty clay), Tl (loamy clay), Tu2 (slightly silty clay), and Tt (pure clay) | 75.5 |
References
- Soane, B.D.; van Ouwerkerk, C. Soil compaction problems in world agriculture. In Soil Compaction in Crop Production; Soane, B.D., van Ouwerkerk, C., Eds.; ELSEVIR: Amsterdam, The Netherlands, 1994; Volume 11, pp. 1–21. ISBN 978-0444882868. [Google Scholar]
- Gut, S.; Chervet, A.; Stettler, M.; Weisskopf, P.; Sturny, W.G.; Lamandé, M.; Schjønning, P.; Kelle, T. Seasonal dynamics in wheel load-carrying capacity of a loam soil in the Swiss Plateau. Soil Use Manag. 2015, 31, 132–141. [Google Scholar] [CrossRef]
- Défossez, P.; Richard, G.; Boizard, H.; O’Sullivan, M.F. Modeling change in soil compaction due to agricultural traffic as function of soil water content. Geoderma 2003, 116, 89–105. [Google Scholar] [CrossRef]
- Brunotte, J.; Brandhuber, R.; Vorderbrügge, T.; Schrader, S. Vorsorge gegen Bodenverdichtung. In Gutefachliche Praxis—Bodenbewirtschaftung und Bodenschutz; AID-Infodienst Ernährung, Landwirtschaft, Verbraucherschutz e.V.: Bonn, Germany, 2015; pp. 21–73. ISBN 978-3-8308-1166-4. [Google Scholar]
- Soane, B.D.; Blackwell, P.S.; Dickson, J.W.; Painter, D.J. Compaction by agricultural vehicles: A review I. Soil and wheel characteristics. Soil Tillage Res. 1980, 1, 207–237. [Google Scholar] [CrossRef]
- Arvidsson, J.; Hakansson, I. A model for estimating crop yield losses caused by soil compaction. Soil Tillage Res. 1991, 20, 319–332. [Google Scholar] [CrossRef]
- Horn, R. Bodenverdichtung. In Handbuch des Bodenschutzes: Bodenökologie und—Belastung/Vorbeugende und Abwehrende Schutzmaßnahmen, 4th ed.; Blume, H.-P., Horn, R., Thiele, B., Eds.; WILEY-VCH Verlag GmbH & Co. KGaA: Weinheim, Germany, 2011; pp. 175–198. ISBN 978-3-527-32297-8. [Google Scholar]
- Schjønning, P.; Lamandé, M.; Munkholm, L.J.; Lyngvig, H.S.; Nielsen, J.A. Soil precompression stress, penetration resistance and crop yields in relation to differently-trafficked, temperate-region sandy loam soils. Soil Tillage Res. 2016, 163, 298–308. [Google Scholar] [CrossRef]
- Alakukku, L. Response of annual crops to subsoil compaction in a field experiment on clay soil lasting 17 years. In Advances in Geoecology. Subsoil Compaction: Distribution, Processes and Consequences; Horn, R., van den Akker, J.J.H., Arvidsson, J., Eds.; Catena-Verlag: Reiskirchen, Germany, 2000; Volume 32, pp. 205–208. ISBN 3923381441. [Google Scholar]
- Stoessel, F.; Sonderegger, T.; Bayer, P.; Hellweg, S. Assessing the environmental impacts of soil compaction in Life Cycle Assessment. Sci. Total Environ. 2018, 630, 913–921. [Google Scholar] [CrossRef] [PubMed]
- Seehusen, T.; Børresen, T.; Rostad, B.I.; Fleige, H.; Zink, A.; Riley, H. Verification of traffic-induced soil compaction after long-term ploughing and 10 years minimum tillage on clay loam soil in South-East Norway. Acta Agric. Scand. Sect. B Soil Plant Sci. 2014, 64, 312–328. [Google Scholar] [CrossRef]
- Jones, R.J.; Spoor, G.; Thomasson, A. Vulnerability of subsoils in Europe to compaction: A preliminary analysis. Soil Tillage Res. 2003, 73, 131–143. [Google Scholar] [CrossRef]
- Zapf, R. Mechanische Bodenbelastung durch die Landwirtschaftliche Pflanzenproduktion in Bayern: Flächenbezogene Quantifizierung des Bewirtschaftungsbedingten Bodenverdichtungspotentials auf Ackerland; Schriftenreihe der Bayerischen Landesanstalt für Bodenkultur und Pflanzenbau: Freising, Germany, 1997; ISBN 3980571866. [Google Scholar]
- Van den Akker, J.J.H.; Canarache, A. Two European concerted actions on subsoil compaction. Landnutz. Landentwickl. 2001, 42, 15–22. [Google Scholar]
- Spoor, G.; Tijink, F.; Weisskopf, P. Subsoil compaction: Risk, avoidance, identification and alleviation. Soil Tillage Res. 2003, 73, 175–182. [Google Scholar] [CrossRef]
- Schjønning, P.; Lamandé, M. Models for prediction of soil precompression stress from readily available soil properties. Geoderma 2018, 320, 115–125. [Google Scholar] [CrossRef]
- Lamandé, M.; Schjønning, P. Soil mechanical stresses in high wheel load agricultural field traffic: A case study. Soil Res. 2018, 56, 129–135. [Google Scholar] [CrossRef]
- Alakukku, L.; Weisskopf, P.; Chamen, W.C.T.; Tijink, F.G.J.; van der Linden, J.P.; Pires, S.; Sommer, C.; Spoor, G. Prevention strategies for field traffic-induced subsoil compaction: A review: Part 1. Machine/Soil interactions. Soil Tillage Res. 2003, 73, 145–160. [Google Scholar] [CrossRef]
- Schjønning, P.; Lamandé, M.; Keller, T.; Pedersen, J.; Stettler, M. Rules of thumb for minimizing subsoil compaction. Soil Use Manag. 2012, 28, 378–393. [Google Scholar] [CrossRef]
- Horn, R.; Domżżał, H.; Słowińska-Jurkiewicz, A.; van Ouwerkerk, C. Soil compaction processes and their effects on the structure of arable soils and the environment. Soil Tillage Res. 1995, 35, 23–36. [Google Scholar] [CrossRef]
- Brunotte, J.; Vorderbrügge, T.; Nolting, K.; Sommer, C. Teil IV: Ein praxisorientierter Lösungsansatz zur Vorbeugung von Bodenschadverdichtungen. Landbauforsch. VTI Agric. Res. 2011, 61, 51–70. [Google Scholar]
- Lorenz, M.; Brunotte, J.; Vorderbrügge, T.; Brandhuber, R.; Koch, H.-J.; Senger, M.; Fröba, N.; Löpmeier, F.-J. Anpassung der Lasteinträge landwirtschaftlicher Maschinen an die Verdichtungsempfindlichkeit des Bodens—Grundlagen für ein bodenschonendes Befahren von Ackerland. Landbauforschung 2016, 66, 101–144. [Google Scholar] [CrossRef]
- Bundesministerium für Ernährung und Landwirtschaft. Nationale Politikstrategie Bioökonomie—Nachwachsende Ressourcen und biotechnologische Verfahren als Basis für Ernährung, Industrie und Energie; BMEL: Berlin, Germany, 2014. [Google Scholar]
- Ohu, J.; Folorunso, O.; Adeniji, F.; Raghavan, G. Critical moisture content as an index of compactibility of agricultural soils in borno state of nigeria. Soil Technol. 1989, 2, 211–219. [Google Scholar] [CrossRef]
- Verdonck, F.; Jaworska, J.; Janssen, C.; Vanrolleghem, P.A. Probabilistic Ecological Risk Assessment Framework for Chemical Substances. In Proceedings of the International Congress on Environmental Modelling and Software, Lugano, Swizerland, 24–27 June 2002. [Google Scholar]
- ICES. Report of the Workshop on Probabilistic Assessments for Spatial Management (WKPASM). In Proceedings of the WKPASM, Hamburg, Germany, 9–13 March 2015. [Google Scholar]
- Lamandé, M.; Greve, M.H.; Schjønning, P. Risk assessment of soil compaction in Europe—Rubber tracks or wheels on machinery. CATENA 2018, 167, 353–362. [Google Scholar] [CrossRef]
- Sage, A.P.; White, E.B. Methodologies for Risk and Hazard Assessment: A Survey and Status Report. IEEE Trans. Syst. Man Cybern. 1980, 10, 425–446. [Google Scholar] [CrossRef]
- Lebert, M. Entwicklung eines Prüfkonzeptes zur Erfassung der tatsächlichen Verdichtungsgefährdung landwirtschaftlich genutzter Böden; Umweltbundesamt: Dessau-Roßlau, Germany, 2010. [Google Scholar]
- Van den Akker, J.J.H. Socomo: A soil compaction model to calculate soil stresses and the subsoil carrying capacity. Soil Tillage Res. 2004, 79, 113–127. [Google Scholar] [CrossRef]
- D’Or, D.; Destain, M.-F. Risk Assessment of Soil Compaction in the Walloon Region in Belgium. Math. Geosci. 2016, 48, 89–103. [Google Scholar] [CrossRef]
- Troldborg, M.; Aalders, I.; Towers, W.; Hallett, P.D.; McKenzie, B.M.; Bengough, A.G.; Lilly, A.; Ball, B.C.; Hough, R.L. Application of Bayesian Belief Networks to quantify and map areas at risk to soil threats: Using soil compaction as an example. Soil Tillage Res. 2013, 132, 56–68. [Google Scholar] [CrossRef]
- Edwards, G.; Sørensen, C.G.; Bochtis, D.D.; Munkholm, L.J. Optimised schedules for sequential agricultural operations using a Tabu Search method. Comput. Electron. Agric. 2015, 117, 102–113. [Google Scholar] [CrossRef]
- Götze, P.; Rücknagel, J.; Jacobs, A.; Märländer, B.; Koch, H.-J.; Christen, O. Environmental impacts of different crop rotations in terms of soil compaction. J. Environ. Manag. 2016, 181, 54–63. [Google Scholar] [CrossRef] [PubMed]
- Rücknagel, J.; Hofmann, B.; Deumelandt, P.; Reinicke, F.; Bauhardt, J.; Hülsbergen, K.-J.; Christen, O. Indicator based assessment of the soil compaction risk at arable sites using the model REPRO. Ecol. Indic. 2015, 52, 341–352. [Google Scholar] [CrossRef]
- Rücknagel, J.; Christen, O. Prüfung, Anpassung und Weiterentwicklung des Moduls zur Bewertung der Schadverdichtungsgefährdung im Betriebsbilanzierungsmodell REPRO; Deutsche Bundesstiftung Umwelt: Osnabrück, Germany, 2010. [Google Scholar]
- Stettler, M.; LKeller, T.; Weisskopf, P.; Lamandé, M.; Lassen, P.; Schjønning, P. Terranimo®—Ein webbasiertes Modell zur Abschätzung des Bodenverdichtungsrisikos. Landtechnik 2014, 69, 132–138. [Google Scholar] [CrossRef]
- Battiato, A.; Diserens, E. Tractor traction performance simulation on differently textured soils and validation: A basic study to make traction and energy requirements accessible to the practice. Soil Tillage Res. 2017, 166, 18–32. [Google Scholar] [CrossRef]
- Vorderbrügge, T.; Brunotte, J. Mechanische Verdichtungsempfindlichkeit für Ackerflächen (Unterboden) —Validierung von Pedotransferfunktionen zur Ableitung der Verdichtungsempfindlichkeit bzw. zur Ausweisung “sensibler Gebiete” in Europa und ein Praxisorientierter Lösungsansatz zur Guten fachlichen Praxis—Teil II: Bewertung eines Vorschlages zur Ableitung von Vorsorgewerten gemäß der Bundes-Bodenschutzverordnung sowie der Pedotransferfunktionen zur Ableitung der “Potentiellen mechanischen Verdichtungsempfindlichkeit für Ackerflächen (Unterboden)” nach LEBERT (2008) als Grundlage zur “Identifizierung sensibler Gebiete” i. S. der Bodenschutzrahmenrichtlinie (BSRRL) der Europäischen Kommissionen. Landbauforsch. VTI Agric. Res. 2011, 61, 23–39. [Google Scholar]
- Horn, R.; Lebert, M.; Burger, N. Vorhersage der Mechanischen Belastbarkeit von Boden als Pflanzenstandort auf der Grundlage von Labor und in situ—Messungen, Materialien des Bayer; Staatsministeriums für Landesentwicklung u. Umweltfragen: Munich, Germany, 1991. [Google Scholar]
- Rücknagel, J.; Brandhuber, R.; Hofmann, B.; Lebert, M.; Marschall, K.; Paul, R.; Stock, O.; Christen, O. Variance of mechanical precompression stress in graphic estimations using the Casagrande method and derived mathematical models. Soil Tillage Res. 2010, 106, 165–170. [Google Scholar] [CrossRef]
- Landesamt für Bergbau, Energie und Geologie. Bodenübersichtskarte im Maßstab 1:50 000 (BÜK50); Landesamt für Bergbau, Energie und Geologie (LBEG): Hannover, Germany, 2016. [Google Scholar]
- Löpmeier, F.-J. Agrarmeteorologisches Modell zur Berechnung der aktuellen Verdunstung (AMBAV); Dt. Wetterdienst, Zentrale Agrarmeteorologische Forschungsstelle Braunschweig: Braunschweig, Germany, 1983. [Google Scholar]
- Eckelmann, W.; Sponagel, H.; Grottenthaler, W.; Hartmann, K.-J.; Hartwich, R.; Janetzko, P.; Joisten, H.; Kühn, D.; Sabel, K.-J.; Traidl, R. Bodenkundliche Kartieranleitung. Ka5; Ad-hoc-Arbeitsgruppe Boden; Schweizerbart Science Publishers: Stuttgart, Germany, 2006. [Google Scholar]
- Lorenz, M.; Thünen Institute of Agricultural Technology, Braunschweig, Germany; Brunotte, J.; Thünen Institute of Agricultural Technology, Braunschweig, Germany. Personal communication, 2017.
- KTBL. Verfahrensrechner Pflanze. Available online: http://daten.ktbl.de/vrpflanze/prodverfahren/start.action (accessed on 20 February 2018).
- Diserens, E.; Spiess, E. Wechselwirkung zwischen Fahrwerk und Ackerboden: TASC: Eine PC-Anwendung zum Beurteilen und Optimieren der Bodenbeanspruchung; Eidgenössische Forschungsanstalt für Agrarwirtschaft und Landtechnik Agroscope (FAT): Tänikon, Switzerland, 2004. [Google Scholar]
- Werner, D.; Paul, R. Kennzeichnung der Verdichtungsgefährdung landwirtschaftlich genutzter Böden. Wasser Boden 1999, 51, 10–14. [Google Scholar]
- Stelzenmüller, V.; Coll, M.; Mazaris, A.D.; Giakoumi, S.; Katsanevakis, S.; Portman, M.E.; Degen, R.; Mackelworth, P.; Gimpel, A.; Albano, P.G.; et al. A risk-based approach to cumulative effect assessments for marine management. Sci. Total Environ. 2018, 612, 1132–1140. [Google Scholar] [CrossRef] [PubMed]
- USEPA. Guidelines for Ecological Risk Assessment; U.S. Environmental Protection Agency: Washington, DC, USA, 1998.
- Gormley, Á.; Pollard, S.; Rocks, S.; Black, E. Guidelines for Environmental Risk Assessment and Management—Green Leaves III; Cranfield University: Bedfordshire, UK, 2011. [Google Scholar]
- SAS Institute Inc. The FASTCLUS Procedure, SAS/STAT ® 13.3 User’s Guide; SAS Institute Inc.: Cary, NC, USA, 2017; pp. 2589–2653. [Google Scholar]
- Kuhwald, M.; Dörnhöfer, K.; Oppelt, N.; Duttmann, R. Spatially Explicit Soil Compaction Risk Assessment of Arable Soils at Regional Scale: The SaSCiA-Model. Sustainability 2018, 10. [Google Scholar] [CrossRef]
- Edwards, G.; White, D.R.; Munkholm, L.J.; Sørensen, C.G.; Lamandé, M. Modelling the readiness of soil for different methods of tillage. Soil Tillage Res. 2016, 155, 339–350. [Google Scholar] [CrossRef]
- Nendel, C.; Berg, M.; Kersebaum, K.C.; Mirschel, W.; Specka, X.; Wegehenkel, M.; Wenkel, K.O.; Wieland, R. The MONICA model: Testing predictability for crop growth, soil moisture and nitrogen dynamics. Ecol. Model. 2011, 222, 1614–1625. [Google Scholar] [CrossRef]
Figure 1.
Schematic presentation of the used data, assessment schemes and calculation steps.

Figure 2.
Crop groups derived from IACS data 2005–2015, red box: crop groups used for the evaluation.
Figure 2.
Crop groups derived from IACS data 2005–2015, red box: crop groups used for the evaluation.

Figure 3.
Decision matrix (source: modified according to [22]; Reproduced with permission from Lorenz et al., Landbauforschung; published by Johann Henrich von Thünen-Institut, 2016).
Figure 3.
Decision matrix (source: modified according to [22]; Reproduced with permission from Lorenz et al., Landbauforschung; published by Johann Henrich von Thünen-Institut, 2016).

Figure 4.
Spatial distribution of the derived clusters of topsoil compaction risk for arable sites in Lower Saxony, red circle: case site.
Figure 4.
Spatial distribution of the derived clusters of topsoil compaction risk for arable sites in Lower Saxony, red circle: case site.

Figure 5.
(a) Level of the probability of soil compaction per cluster and indicator average compaction risk and the maximum compaction risk in %; (b) area of the evaluated soil-moisture-land-use-units with maximum probability of soil compaction per half-month and cluster (cluster 1: n = 239,131; cluster 2: n = 55,697; cluster 3: n = 89,218).

Figure 6.
Probability of field work per crop groups (Pfw), soil susceptibility to compaction in 0–30 cm (Ps), and probability of soil compaction for cluster three in spring per half-month.
Figure 6.
Probability of field work per crop groups (Pfw), soil susceptibility to compaction in 0–30 cm (Ps), and probability of soil compaction for cluster three in spring per half-month.

Figure 7.
Probability of field work per crop groups (Pfw), soil susceptibility to compaction in 0–30 cm (Ps) and probability of soil compaction for cluster three in autumn per half-month.
Figure 7.
Probability of field work per crop groups (Pfw), soil susceptibility to compaction in 0–30 cm (Ps) and probability of soil compaction for cluster three in autumn per half-month.

Figure 8.
Days within the compaction risk classes (topsoil) for a wet and a dry year; (a) winter grains harvest, (b) sugar beet harvest, (c) silage maize harvest; risk classes 2 = low, 3 = medium, and 4 = high.
Figure 8.
Days within the compaction risk classes (topsoil) for a wet and a dry year; (a) winter grains harvest, (b) sugar beet harvest, (c) silage maize harvest; risk classes 2 = low, 3 = medium, and 4 = high.


Figure 9.
Days within the compaction risk classes (topsoil) for a wet and a dry year for manure spreading to silage maize in spring with (a) a medium mechanical load and (b) a very low mechanical load. Risk classes 2 = low, 3 = medium, and 4 = high.
Figure 9.
Days within the compaction risk classes (topsoil) for a wet and a dry year for manure spreading to silage maize in spring with (a) a medium mechanical load and (b) a very low mechanical load. Risk classes 2 = low, 3 = medium, and 4 = high.

Table 1.
Example for determining the top soil layer from soil map profile information, lower boundaries for each layer.
Table 1.
Example for determining the top soil layer from soil map profile information, lower boundaries for each layer.
| Profile | Layer_1 | Layer_2 | Layer_3 | Layer_4 | Layer_5 | Top Layer |
|---|---|---|---|---|---|---|
| 1 | 10 | 50 | 90 | - | - | layer_2 |
| 2 | 30 | 9 | 60 | - | - | layer_1 |
| 3 | 30 | 51 | 48 | - | - | layer_1 |
| 4 | 5 | 10 | 35 | 80 | - | layer_3 |
Table 2.
Classification of soil types for soil moisture simulation.
| Soil Type in Map [44] | Soil Types of DWD eFC Simulations |
|---|---|
| Su2 (slightly silty sand), Sl2 (slightly loamy sand), | Sl2 |
| St2 (slightly clayey sand), Su3 (medium silty sand) | |
| Sl3 (medium loamy sand), Sl4 (highly loamy sand), Su4 (highly silty sand) | Sl4 |
| Slu (loamy silty sand), St3 (medium clayey sand), Ls4 (highly sandy loam) | |
| Ls3 (medium sandy loam), Ls2 (slightly sandy loam) | |
| Us (sandy silt), Uls (loamy sandy silt), Ut2 (slightly clayey silt) | Ut3 |
| Ut3 (medium clayey silt), Uu (pure silt), Ut4 (highly clayey silt) | |
| Ts4 (highly sandy clay), Lt2 (slightly clayey loam), Lts (clayey sandy loam), | Lt3 |
| Ts3 (medium sandy clay), Lt3 (medium clayey loam) | |
| Lu (silty loam), Tu4 (silty cl), Tu3 (medium silty clay) | Lu |
| Ts2 (slightly silty clay), Tl (loamy clay), Tu2 (slightly silty clay), Tt (pure clay) | Tl |
Table 3.
Connection of the IACS crop-group and the simulated crop by the DWD and the associated field works and time slots.
Table 3.
Connection of the IACS crop-group and the simulated crop by the DWD and the associated field works and time slots.
| DWD-Crop | IACS-Crop Group | Manure Spreading in Spring | Harvesting in Summer/Autumn |
|---|---|---|---|
| winter wheat | winter grains | - | Jul02 to Aug01 |
| spring wheat | spring grains + oil seed rape | - | Jul02 to Aug01 |
| silage maize | silage maize | Feb01 to Apr01 | Sep02 to Okt01 |
| sugar beet | sugar beets | - | Sep02 to Nov01 |
| sugar beet | potatoes | - | Aug01 to Sep02 |
Table 4.
Identified crop-groups, evaluated field works and corresponding machinery (load values and tire pressure see Appendix A, Table A2).
Table 4.
Identified crop-groups, evaluated field works and corresponding machinery (load values and tire pressure see Appendix A, Table A2).
| IACS-Crop Group | Field Work | Machine Equipment |
|---|---|---|
| winter grains | harvesting | Harvester 360 kW 10 m3, dual tires |
| spring sown grains (+ oil seed rape) | harvesting | Harvester 360 kW 10 m3, dual tires |
| silage maize | harvesting | Maize harvester 350 kW, transport trailer 138 kW 40 m3 |
| silage maize | manure spreading (1) | Self-propelled manure spreader 350 kW 20 m3, crab steering |
| silage maize | manure spreading (2) | Tractor 138 kW, umbilical cord 24 m |
| sugar beets | harvesting | Self-propelled harvester, two-axis, and crab steering |
| potatoes | harvesting | Tractor 138 kW, drawn 2-row bunker-harvester |
Table 5.
Share of area within the soil classes by cluster.
| Soil Texture Class [44] | Cluster | |||
|---|---|---|---|---|
| (See Table 2) | Class No. | Low CR | Medium CR | High CR |
| Su2, Sl2 | 1 | 18% | 40% | 52% |
| Sl3, St2, Slu, Sl4, Su3, Su4 | 2 | 9% | 11% | 10% |
| St3, Ls2, Ls3, Ls4, Uu, Us, Ut2, Ut3, Uls | 3 | 59% | 27% | 20% |
| Lt2, Lts, Ts4, Ts3, Lt3, Ut4, Lu, Tu3, Tu4 | 4 | 13% | 20% | 17% |
| Ts2, Tl, Tu2, Tt | 5 | 0% | 1% | 2% |
Table 6.
Average precipitation in mm (pcp_avg) for spring (Feb01–Apr01) and autumn (Jul02–Nov01), identified values for a dry (pcp_dry) and a wet (pcp_wet) year, and the respective derivation in % (derivation_wet, derivation_dry) from pcp_avg.
Table 6.
Average precipitation in mm (pcp_avg) for spring (Feb01–Apr01) and autumn (Jul02–Nov01), identified values for a dry (pcp_dry) and a wet (pcp_wet) year, and the respective derivation in % (derivation_wet, derivation_dry) from pcp_avg.
| Pcp_Avg | Pcp_Wet | Pcp_Dry | Derivation_Wet | Derivation_Wet | |
|---|---|---|---|---|---|
| Spring | 83 | 145 | 45 | +74% | −45% |
| autumn | 232 | 343 | 174 | +48% | −24% |
© 2018 by the authors. Licensee MDPI, Basel, Switzerland. This article is an open access article distributed under the terms and conditions of the Creative Commons Attribution (CC BY) license (http://creativecommons.org/licenses/by/4.0/).
Share and Cite
MDPI and ACS Style
Ledermüller, S.; Lorenz, M.; Brunotte, J.; Fröba, N. A Multi-Data Approach for Spatial Risk Assessment of Topsoil Compaction on Arable Sites. Sustainability 2018, 10, 2915. https://doi.org/10.3390/su10082915
AMA Style
Ledermüller S, Lorenz M, Brunotte J, Fröba N. A Multi-Data Approach for Spatial Risk Assessment of Topsoil Compaction on Arable Sites. Sustainability. 2018; 10(8):2915. https://doi.org/10.3390/su10082915
Chicago/Turabian StyleLedermüller, Sandra, Marco Lorenz, Joachim Brunotte, and Norbert Fröba. 2018. "A Multi-Data Approach for Spatial Risk Assessment of Topsoil Compaction on Arable Sites" Sustainability 10, no. 8: 2915. https://doi.org/10.3390/su10082915
Note that from the first issue of 2016, this journal uses article numbers instead of page numbers. See further details here.