Article

Analysis of Spatial-Temporal Characteristics of the PM2.5 Concentrations in Weifang City, China

1
Chinese Academy of Surveying and Mapping, Beijing 100830, China
2
Beijing No.4 High School International Campus, Beijing 100031, China
*
Author to whom correspondence should be addressed.
Sustainability 2018, 10(9), 2960; https://doi.org/10.3390/su10092960
Submission received: 25 July 2018 / Revised: 8 August 2018 / Accepted: 14 August 2018 / Published: 21 August 2018

Abstract

:
Air pollution, which accompanies industrial progression and urbanization, has become an urgent issue to address in contemporary society. As a result, our understanding and continued study of the spatial-temporal characteristics of a major pollutant, defined as 2.5-micron or less particulate matter (PM2.5), as well as the development of related approaches to improve the environment, has become vital. This paper studies the characteristics of yearly, quarterly, monthly, daily, and hourly PM2.5 concentrations, and discusses the influencing factors based on the hourly data of nationally controlled and provincially controlled monitoring stations, from 2012 to 2016, in Weifang City. The main conclusion of this study is that the annual PM2.5 concentrations reached a peak in 2013. With efficient aid from the government, this value has decreased annually and has high spatial characteristics in the northwest and low spatial characteristics in the southeast. Second, the seasonal and monthly PM2.5 concentrations form a U-shaped trend, meaning that the concentration is high in the summer and low in the winter. These trends are highly relevant to the factors of plantation, humidity, temperature, and precipitation. Third, within a week, higher PM2.5 concentrations appear on Mondays and Saturdays, whereas the lowest concentration occurs on Wednesdays. It can be inferred that PM2.5 concentrations tend to be highly dependent on human activities and living habits. Lastly, there are hourly discrepancies within the peaks and troughs depending on the month, and the overall daytime PM2.5 concentrations and reductive rates are higher in the daytime than in the nighttime.

1. Introduction

In recent years, with the rapid industrial and economic development in China, new environmental problems such as fog and haze have appeared. For instance, a wide range and long-lasting haze swept across central and eastern China in January 2013, causing an increase in public attention to urban air quality [1]. The primary pollutant that causes haze weather conditions is atmospheric particulate matter, especially fine particulate matter PM2.5. PM2.5 is airborne particulate matter, which has a diameter less than or equal to 2.5 microns. It is composed of various toxic and harmful substances and can enter the lungs directly through respiration, resulting in respiratory system, cardiovascular and cerebrovascular diseases [2,3]. In 2013, the International Agency for Research on Cancer (IARC) treated PM2.5 as a carcinogen. Liu et al. concluded that million case of premature mortalities were attributed to PM2.5 exposure [4]. Moreover, PM2.5 can also notably reduce the atmospheric visibility [5], which is inconvenient for traveling. Studying the characteristics of PM2.5 is therefore important for improving the quality of life, physical health and the living environment of inhabitants.
The objectives of this paper are: (1) To analyze for the first time the spatial-temporal variations of PM2.5 concentrations, from 2012 to 2016 in Weifang City, in Shandong Province, based on hourly data from nationally controlled and provincially controlled ground monitoring stations; (2) to explore the seasonal, monthly, daily and hourly characteristics of PM2.5 concentrations in Weifang City; and (3) to assess the possible factors that influence PM2.5 concentrations. At present, most studies on PM2.5 focus on the analysis of chemical mechanisms [6], influencing factors [7,8,9], and spatial-temporal characteristics based on data from ground monitoring stations and remote sensing [10,11]. However, the analysis of spatial-temporal characteristics based on ground monitoring stations conducted by earlier studies focused on large-scale regions, such as mainland China [12], the Beijing-Tianjin-Hebei region [13], and the Yangtze River Delta region [14], but little research has been conducted in small-scale areas, such as Weifang City. Another distinctive feature of this research is the long period of observation data from 2012 to 2016 since PM2.5 concentration indicators were added to China’s new National Ambient Air Quality Standards in 2012. Furthermore, 38 nationally controlled and provincially controlled ground monitoring stations are captured in Weifang City, overcoming the defect of low accuracy based on a modicum of nationally controlled stations. As a result, this study is helpful for enhancing the recognition of the spatial distributions and dynamic changes of PM2.5 in Weifang City and for providing data verification and technological support for the remote sensing inversion of atmospheric grey haze. This study may also be useful for assisting the government in making effective environmental management decisions and policies.
The paper is organized as follows. Section 2 presents a review of the relevant literature on PM2.5. Section 3 introduces the study area, data sources and data preprocessing. Section 4 presents and analyzes the spatial-temporal characterization of the PM2.5 concentrations. Section 5 concludes the paper.

2. Literature Review

At present, an array of literature [15,16,17] focuses on analyzing the spatial-temporal characteristics of PM2.5. For example, based on data from 338 Chinese cities, Ye et al. found that although regional discrepancies exist, concentrations in locations where storms frequently occur are especially high [18]. In accordance with the data of the Beijing-Tianjin-Hebei region in 2014, Liu et al. concluded that the spatial patterns of PM2.5 concentrations in this area appeared to be high in the southeast and low in the northwest, and pollutants primarily arise from automobile emissions and coal burning [19]. Feng et al. researched the PM2.5 concentration data with a 6-hour-renewal interval in the Yangtze River Delta region and concluded that, instead of vehicle emissions, the burning of biomass mainly gives rise to high PM2.5 concentrations [20].
Studies focusing on small-scale cities have been published, but with significantly fewer in number. Liu et al. used the daily data of seventeen nationally controlled monitoring stations from 2014–2015 in Chongqing Province and concluded that the PM2.5 concentrations in winter were the highest, followed by autumn and spring, and with summer having the lowest concentrations [21]. Kang et al. utilized the data from 4 cities in Heilongjiang Province during 2014 and showed that PM2.5, the main source of pollution, was negatively correlated with humidity, wind speed, and precipitation, while it was positively correlated with air pressure and temperature [22]. Chen et al. employed data from nine nationally controlled monitoring stations in Nanjing Province during 2013, and they proposed that the population density is positively correlated with the air pollution level and that areas near water have a negative correlation with the air pollution level [23]. This proved the importance of preserving water areas for gaining a better air quality.
The shortcomings of the existing PM2.5 studies based on ground monitoring station data are as follows. Firstly, the studies focused on large-scale regions, such as mainland China or metropolitan areas, with little research on small-scale areas, such as prefectures. With an increase in regional differentiation [17], analysis on small district cities can be more valuable. Secondly, the existing studies used mostly rough and historical data [24], causing the research results to lack accuracy and practicality. More specifically, most studies focused on nationally controlled stations (less than 20 in number when distributing to one city) and were based on daily data instead of hourly data. Thirdly, unlike the air pollution index (API), SO2, and PM10 [25,26,27], PM2.5 pollutant concentrations have been recorded since 2012. Studies based on a time span longer than 5 years are few, and most of them used data retrieved from remote-sensed imagery [28]. In summary, the past studies were dependent on time scales that were too short or too old and usually used daily data, resulting in a low temporal resolution.

3. Materials and Methods
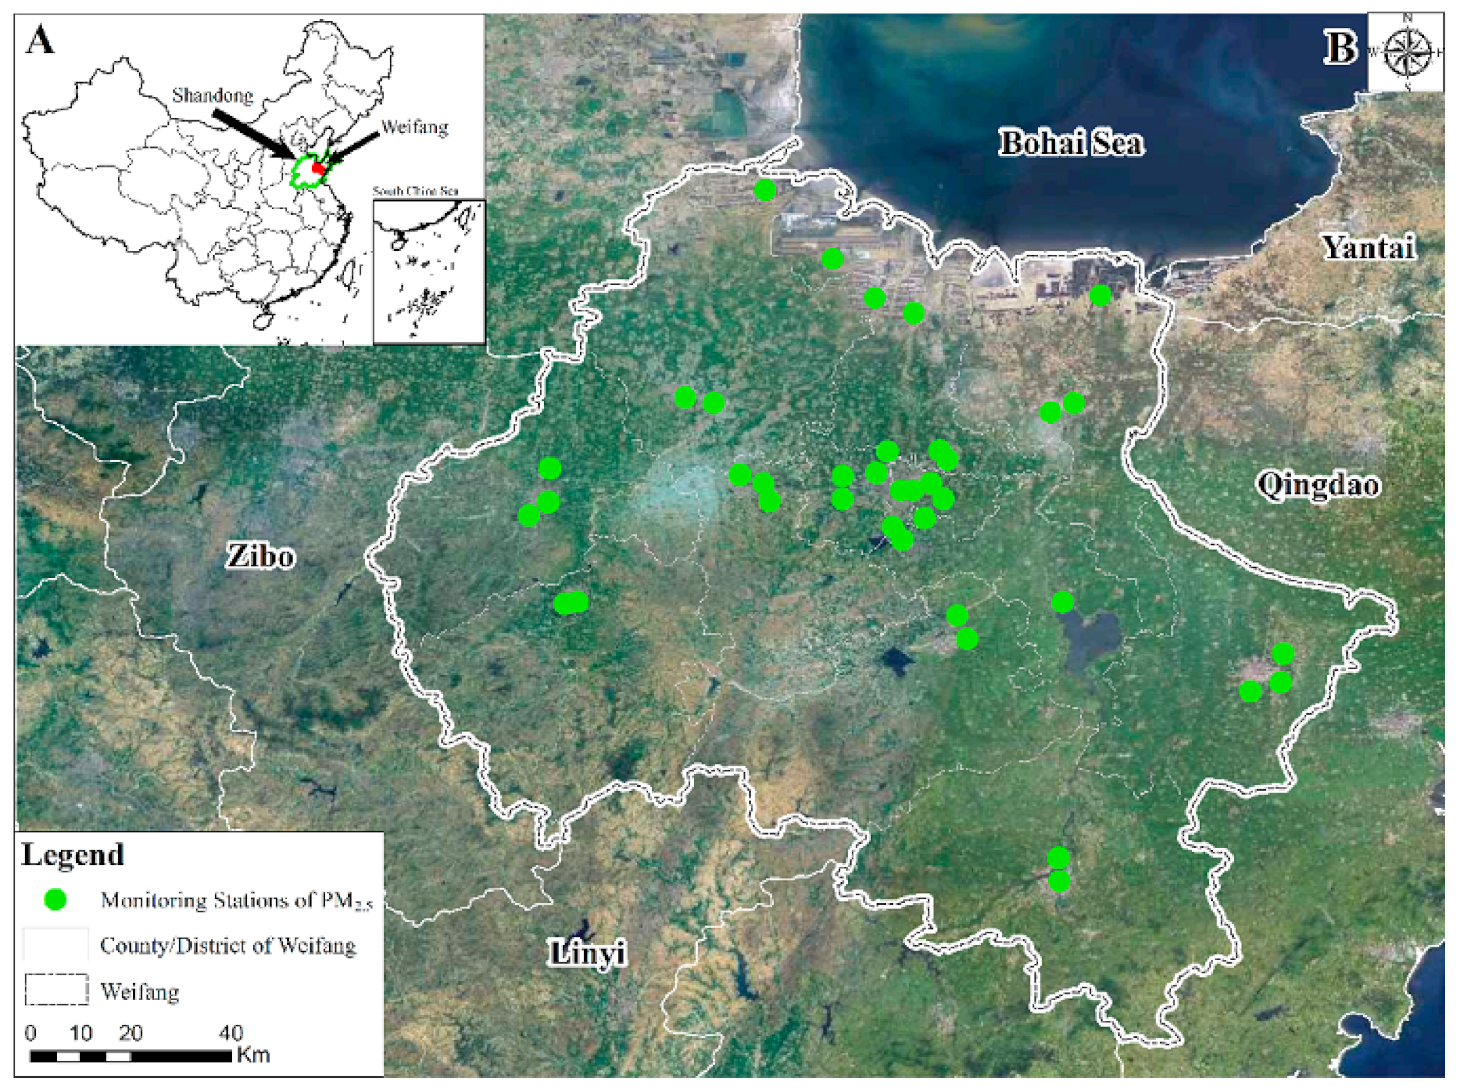
3.1. Study Area

Shandong Province is located in eastern China, crossing 15 prefecture-level cities, with a total area of 158,000 km2. The study area used in this research is Weifang City, which is a prefecture-level city located in the middle of Shandong Peninsula (Figure 1), with an area of 15,859 km2. Weifang City lies in a warm temperate zone and is classified as having a semi-humid continental monsoon climate. The topography appears to be high in the south, and low in the north. The south is mainly covered with hills and low mountains, while the northeast is mainly characterized by plains and lakes. The various topographical features and the typical climate in Weifang City make this research more representative. In recent years, the continual industrial and economic growth and development have created business opportunities in Weifang City. Nevertheless, this growth results in damage to the Weifang City environment. The “Ranking of PM2.5 Concentration of 336 Chinese Cities in 2015”, published by the international environmental organization, Greenpeace, reported that the air quality index in Weifang City ranked in the top 50 cities with the worst air quality. Therefore, research on the spatial and temporal characteristics of PM2.5 concentrations in Weifang City has become even more necessary.

3.2. Data Source and Processing

Hourly PM2.5 concentration observations of 38 air pollution stations in Weifang City were acquired from the Data Center of the Ministry of Environmental Protection of the People’s Republic of China (http://datacenter.mep.gov.cn/index), during the period from March 2012 to December 2016. Thermo Fisher 1405F monitoring devices were used to measure the PM2.5 concentrations, and this instrument operates on the principle of measuring PM2.5 concentrations by a filter dynamic measurement system (FDMS) with the tapered element oscillating microbalance (TEOM), and the beta-attenuation method [3,29]. The frequency of these observations is once every 5 min. The hourly renewed concentrations are then calculated by the arithmetic means of the data from every 5 min for each hour [2]. In this paper, the PM2.5 concentration data are based on the hourly concentrations.
The C++ language is also applied in this study to perform statistical analysis based on hourly renewing data from 38 ground monitoring stations in Weifang City, from 2012 to 2016. Subsequently, the hourly, daily, monthly, seasonal, and annual PM2.5 concentrations are retrieved. In addition, analysis of the spatial characterization is conducted through the use of spatial analysis methods with the support of ArcGIS software.

4. Results and Discussion

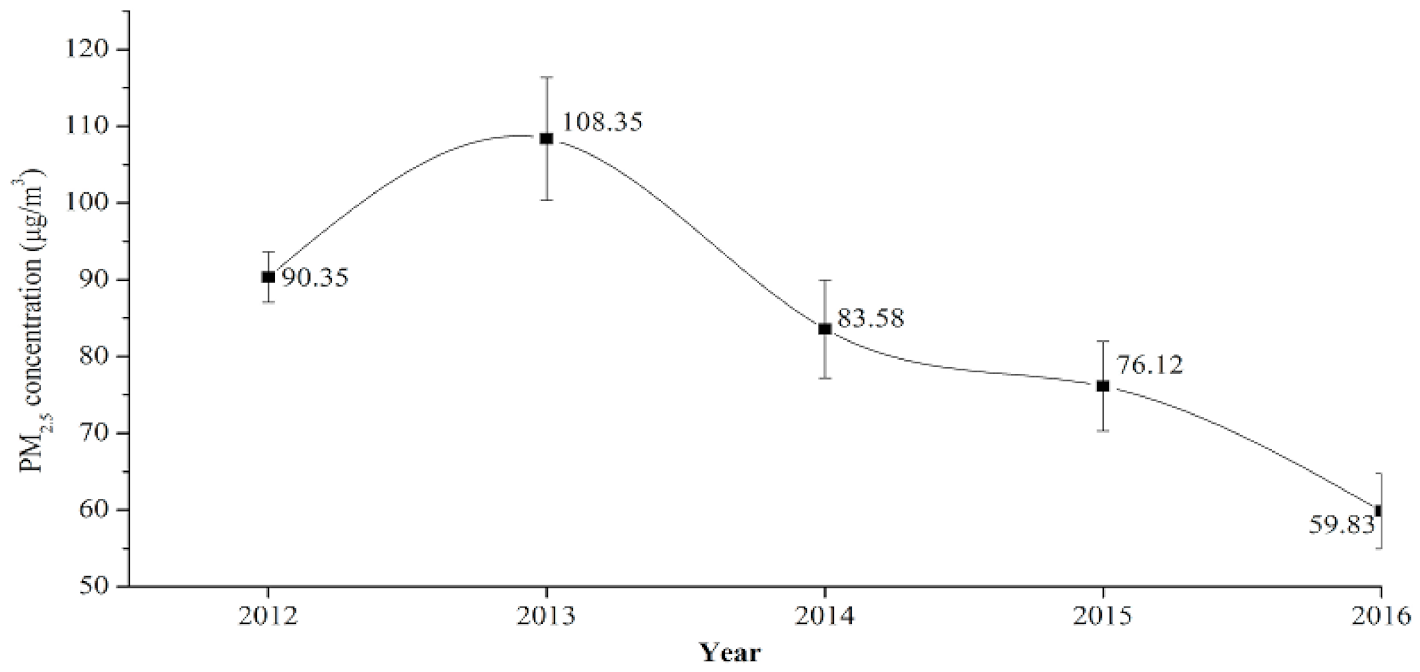
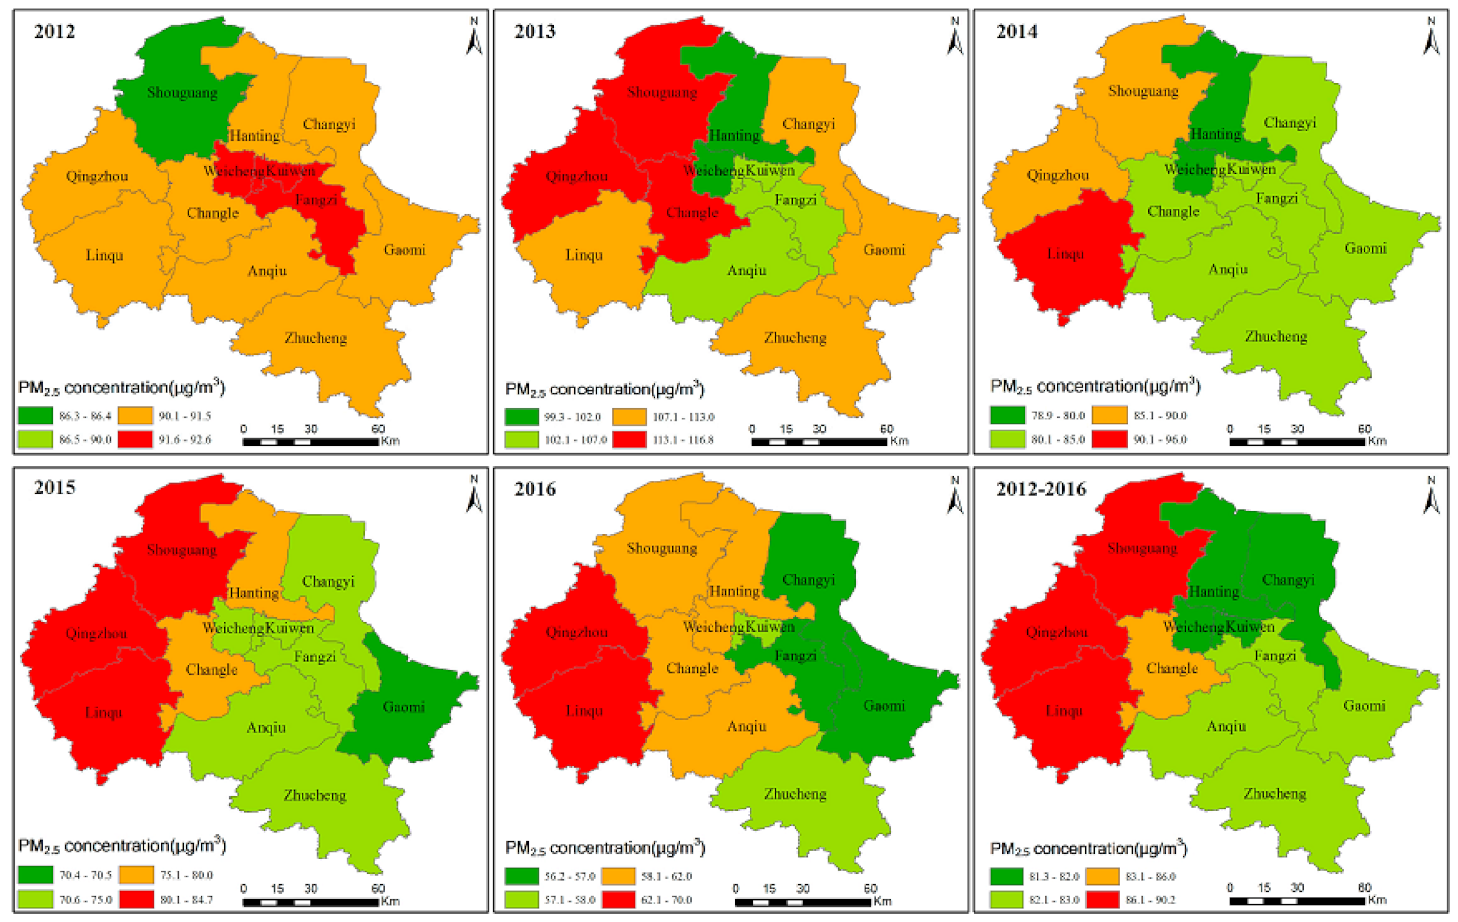
4.1. Annual Spatial-Temporal Characterization

Figure 2 describes the temporal characteristics of the annual average concentration of PM2.5 from 2012 to 2016 in Weifang City. As shown in this figure, the annual average PM2.5 concentrations over these five years exceeded the Chinese Ambient Air Quality Standards (CAAQS) Grade II standard (35 µg/m3). The PM2.5 concentration reached its peak in 2013 (108 μg/m3), and it gradually decreased annually, falling to a low in 2016 (60 μg/m3). In light of previous studies in China, researchers have indicated that environmentally friendly policies and haze-controlling measures, such as the Air Pollution Prevention and Control Action Plan, have been effective for reducing the PM2.5 concentrations [1]. Chen et al. also emphasized the importance of protecting areas near water and plantations for saving the environment [23].
Similar environmental protective activities were carried out by the Weifang City government in 2013, which verified positive impacts these actions can have in protecting air quality. The government convened the Ecology Bureau and the Transportation Bureau to implement several “battles” including the “Coal to Gas Battle”, “Rickshaws Elimination Battle” (eliminating cars with large emissions, large concentrations, and low stability), and “Battle of the Odor Pollution Remediation” (installing exhaust gas monitoring devices and demarcating the burning-prohibited zone). After these actions, the reduction rate between 2013 and 2014 reached a maximum, decreasing the PM2.5 concentration by approximately 23%. It suggests that the implementation of protective strategies by government may partially reduce the extent of air pollution effectively.
Figure 3 illustrates the spatial distribution of the annual average concentrations of PM2.5 from 2012 to 2016 in Weifang City. County/district concentrations are calculated by the average of points monitored concentrations within the area. In accordance with the graph, the PM2.5 pollutants are mainly concentrated in the downtown areas since the PM2.5 concentrations in the Weicheng District, Kuiwen District and Fangzi District all exceeded 91.6 μg/m3. This finding may be because the central areas were especially populous in 2012, and the intensive population and traffic are more prone to lead to serious PM2.5 pollution. Previous studies in different cities have also found accordant results. For example, Yao reported that compared with suburban areas, urban areas in Beijing suffered from higher PM2.5 concentrations, which validates the influence of human activities on PM2.5 concentrations [3].
Note that from 2013 to 2016, the PM2.5 concentrations presented a west-high, east-low trend. Among the western areas, such as Qingzhou City and Linqu County, the PM2.5 concentrations remain higher than 80 μg/m3, while in southeastern cities, the PM2.5 concentrations are approximately 70 μg/m3. This result has been largely related to the topographical features of Weifang City. The southern cities are mostly low mountains and hills with a high vegetation coverage that can efficiently absorb pollutants in the air and hinder aerosols from entering the atmosphere [30], thus decreasing the PM2.5 concentrations. The eastern cities are adjacent to Qingdao City, which is located by the sea and hence has good air quality. In contrast, the western Weifang area includes Shouguang, Qingzhou and Linqu Counties, which border Zibo City, a traditional industrial city with more severe air pollution. Large-scale spreading of substantive air pollutants and toxic particles from Zibo City to these relatively flat areas has an intense effect on their air quality indices. Furthermore, the populations in western areas such as Shouguang, Linqu County and Qingzhou rank in Weifang City’s top five most populated areas. The dense population increases the emissions of particulate matter, contributing to an increase in PM2.5 concentrations. This conclusion corresponds with that of Chen [23], who proposed that the population density is positively correlated with PM2.5 concentrations.

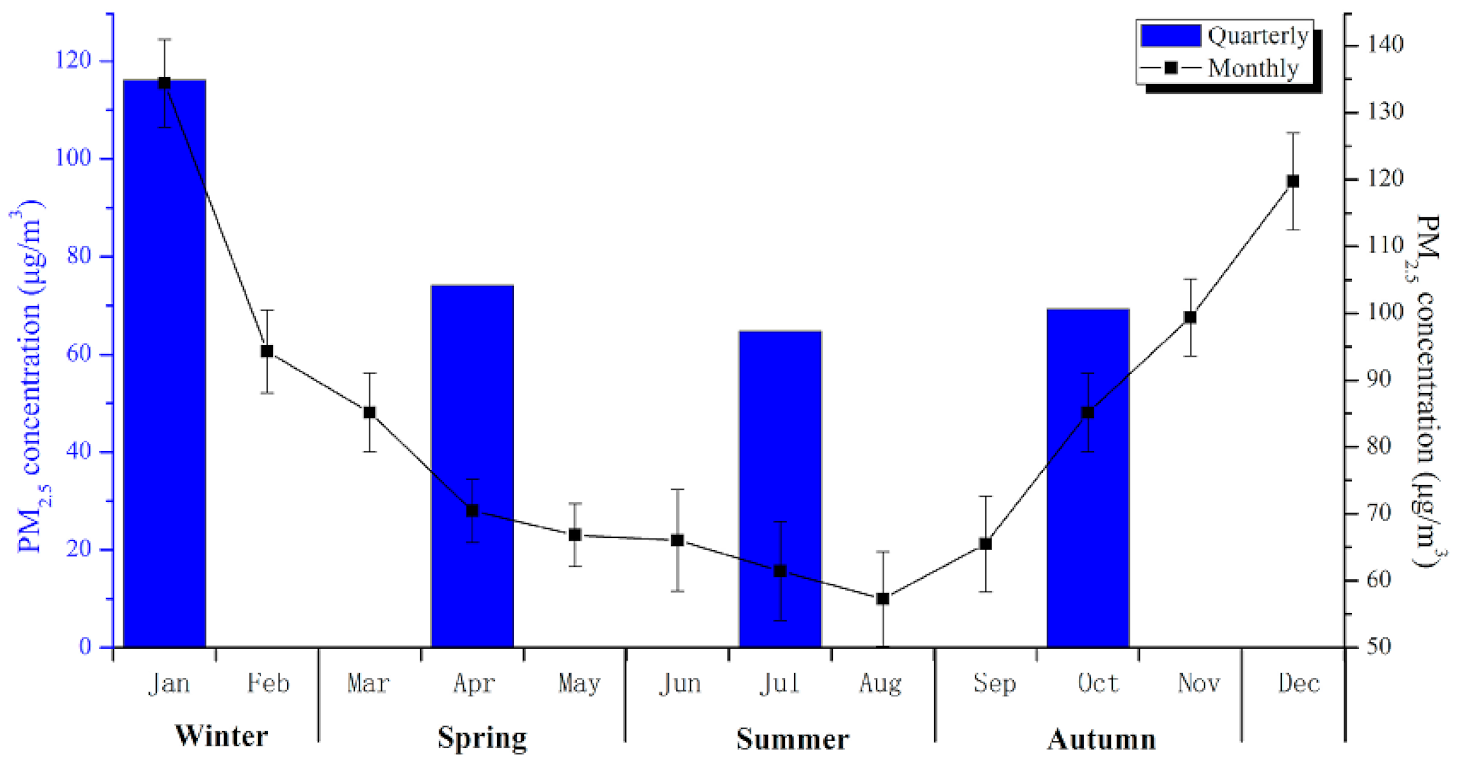
4.2. Seasonal and Monthly Spatial-Temporal Characterization

Monthly changes in PM2.5 concentrations in Weifang City, from 2012 to 2016, are illustrated in Figure 4. As shown in this figure, the mean PM2.5 concentrations form a U-shaped trend in general during these 5 years, which is consistent with previous findings [20]. More specifically, the monthly average PM2.5 concentration shows a decreasing trend starting in January after it reaches a maximum at 134 μg/m3, maintains a stable trend of approximately 70 μg/m3 from May to September, reaches a low at 57 μg/m3 in August, and begins to significantly increase in October.
Figure 4 also presents the seasonal average PM2.5 concentrations. As illustrated in this figure, the mean concentrations of PM2.5 are highest in winter (December, January, February) with a value of 116 μg/m3. Then they sequentially decrease in spring (March, April, May), autumn (September, October, November), and summer (June, July, August), with values roughly corresponding to 74 μg/m3, 69 μg/m3, and 65 μg/m3, respectively. This result indicates that air pollution is less serious in summer than in winter, which agrees with the results from previous studies [9,31]. One caveat that should be noted is that the mean PM2.5 concentrations in winter far exceeded the CAAQS Grade II standard (75 µg/m3), and the concentrations in the other three seasons all exceeded the CAAQS Grade I standard (35 µg/m3).
According to the literature and other materials, the abovementioned evidence can be explained by the following reasons. In terms of summer, overheated surfaces disrupt the stability of the atmosphere because high temperatures can lead to strong convections, resulting in strong ascending motions of low density air, which is favorable for pollutant diffusion. In addition, the low PM2.5 concentrations in summer also benefit from flourishing vegetation, which decreases the amount of aerosols entering the atmosphere, and effectively absorbs polluting particles. Gentle breezes coming from the southeast blow towards the western flat land, scattering the pollutants. Furthermore, frequent rainfall and higher moisture in summer are propitious for pollutant dilution and wet sedimentation, thus reducing the PM2.5 concentrations.
Possible reasons for the high PM2.5 concentrations in winter are associated with low temperatures, low humidity, temperature inversion, less precipitation and wind direction. Specifically, in contrast to summer, low temperatures in winter result in feeble convection currents, which are unfavorable for pollutant diffusion. Secondly, the relatively strong winds from the northwest blow towards the southern hills and low mountains in winter. These higher-altitude terrains in the south prevent pollutants from successfully scattering. Thirdly, the low moisture in cold seasons results in a dry atmosphere. Once it rains, pollutants immediately absorb water and become larger in size [32], resulting in an increase in PM2.5 concentrations. Fourthly, the winter aerosphere is relatively stable, resulting in frequent short-period occurrences of intense temperature inversions, which are not conducive to pollutant diffusion. Finally, PM2.5 emissions are greatly increased by winter heating. A large portion of this analysis is aligned with the results of Kang [22], who discovered that PM2.5 concentrations are negatively correlated with humidity and precipitation but positively correlated with air temperature. However, this conclusion encounters a discrepancy when considering wind speed, which this study deduced as having a subtle positive relationship, whereas Kang et al. believed that it is negatively related to PM2.5 concentrations. The exact quantitative relationship in Weifang City will be further studied in our future work.
In addition, it is worth stating that the PM2.5 in March has a high concentration of 85 μg/m3, which can be explained by two reasons. On the one hand, weather phenomena called “dao chun han” often appear in March, which means prolonged cold springs. This meteorological element of low temperature leads to the high PM2.5 concentration in March. On the other hand, a massive quantity of PM2.5 that accumulates throughout winter has not yet fully dissipated and plays a role in increasing the concentration index.

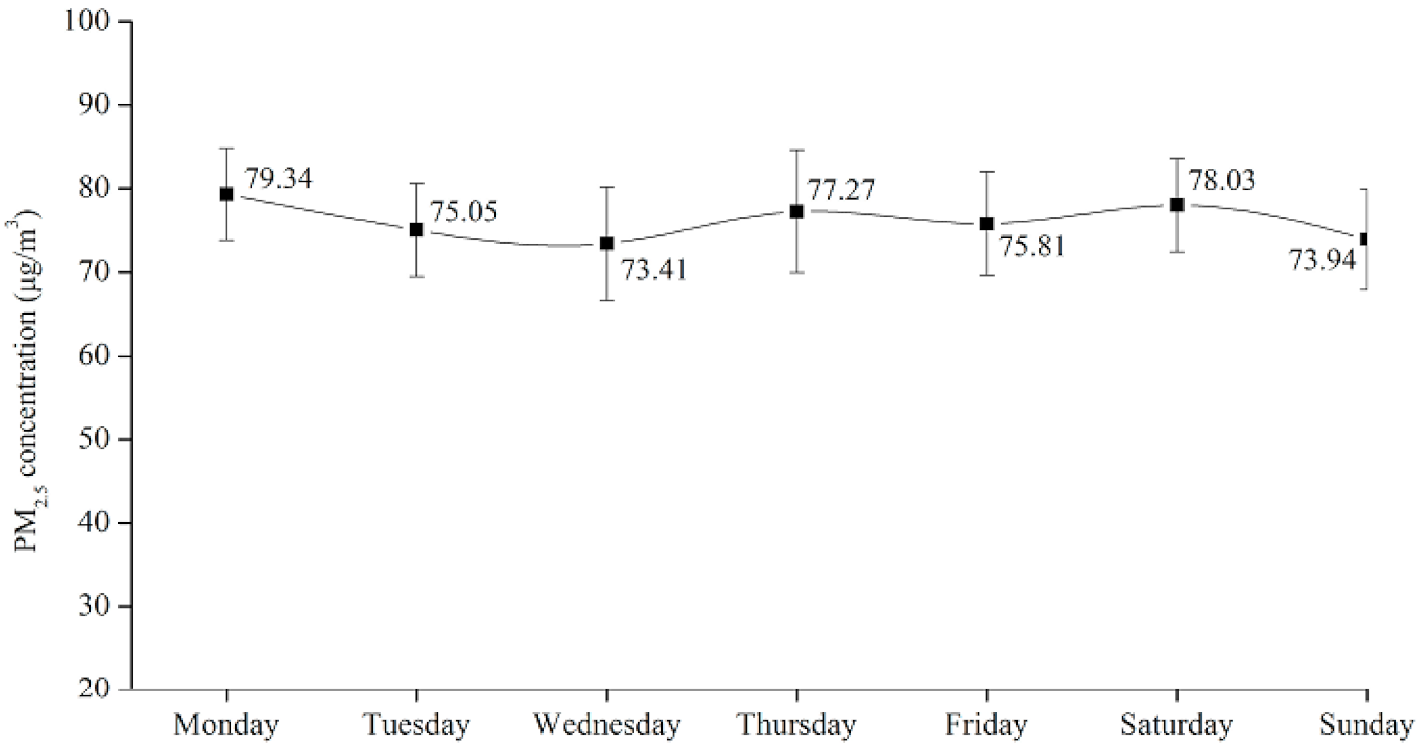
4.3. Daily Spatial-Temporal Characterization

The daily variations in the PM2.5 concentrations in Weifang City, from 2012 to 2016, are demonstrated in Figure 5. Our investigation shows that the concentration on Mondays is the highest, with an index of 79 μg/m3; the next highest concentration is on Saturdays, with a concentration of 78 μg/m3. The indices on Wednesdays and Sundays are among the lowest at 73 μg/m3 and 74 μg/m3, respectively. The causes of this result are presented as follows.
Monday is the beginning of the week and the first day of the workdays; thus, a remarkably dense PM2.5 may be associated with a large amount of inhabitants returning to work and the morning rush. Note that the overall pollution level during workdays is especially increased by Monday’s concentrations, and the index on workdays (76.18 μg/m3), is slightly higher than that on weekends and holidays (75.98 μg/m3). This result was contradicted by Yao [3], who discovered that, instead, the holiday concentrations are higher. This difference is due to some extent to the regional differentiation since the study area used by Yao is Beijing. The air quality after Monday tends to be mitigated and reaches its low on Wednesday.
Moreover, on Saturday, the start of the weekend, people are prone to travel or socialize, resulting in excessive human and transportation activities, thus increasing the PM2.5 concentrations. On Sunday, the end of the week, people prepare and rest for the beginning of the new week. As a result, human activities and PM2.5 concentrations are evidently reduced. By analyzing the weekend and workday PM2.5 concentrations, it is appropriate to infer that the PM2.5 concentrations and the extent of pollution are closely related to the schedules and living habits of the people.

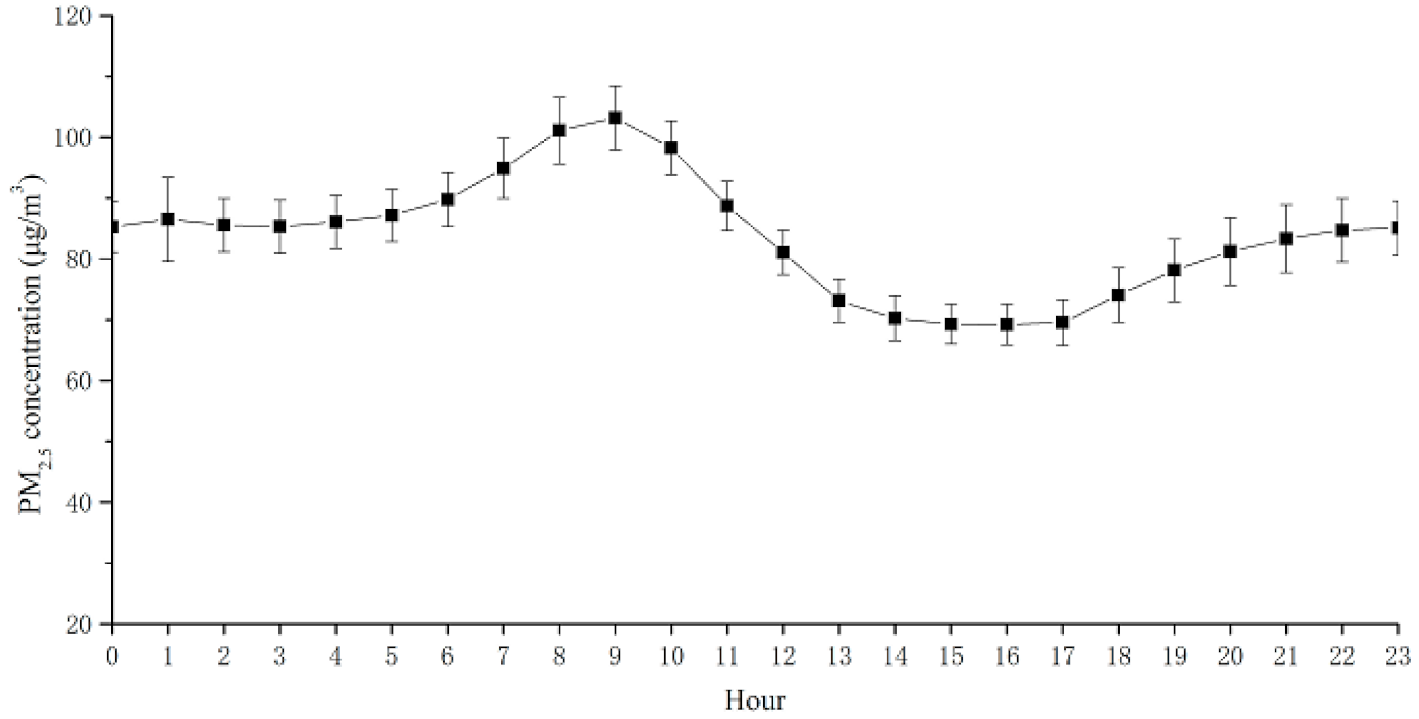
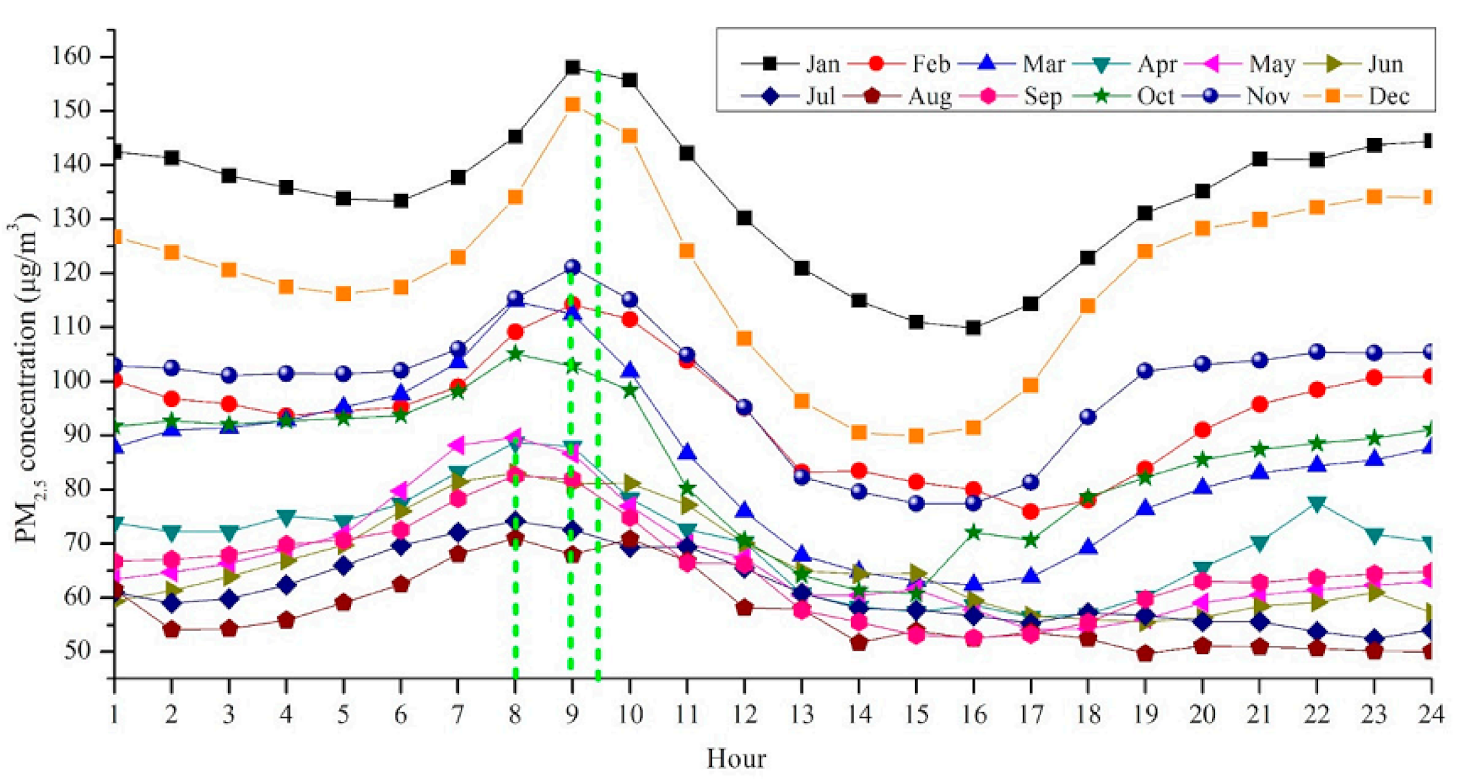
4.4. Hourly Spatial-Temporal Characterization

Figure 6 shows the hourly average concentration of PM2.5 in Weifang City, from 2012 to 2016. The graph reveals that, as a whole, the concentration reaches its peak at approximately 09:00, surpassing an index of 100 μg/m3, and reaches its low at approximately 15:00 or 16:00, with a concentration of 70 μg/m3.
To analyze the spatial variations of the hourly PM2.5 concentrations more thoroughly and from multifaceted perspectives, the hourly concentrations from different months are gathered and sorted. The statistical results are displayed in Figure 7. The graph implies a delayed trend for the increase in the PM2.5 concentrations. In detail, from April to September, the peak points, which are less than 80 μg/m3, appear at approximately 08:00; in October, November, February, and March, the highest indices, which are between 110 μg/m3 and 120 μg/m3, occur at approximately 09:00; the peak concentrations of December and January, which are between 150 μg/m3 and 160 μg/m3, are reached at approximately 09:30. These results are mainly attributed to the distinctive living habits of people in different months and seasons. In summer, the days are longer, and the nights are shorter, so people are apt to wake early to go to work, causing heavy traffic during the morning rush hours. Therefore, the time when the concentration indices begin to increase to their peak takes place relatively early. In contrast, in winter, nights are longer, and days are shorter. People’s lifestyles are different from their lifestyles in summer. The time to leave home for work is delayed, by approximately one hour or more, which results in a later time for the concentration to reach its maximum.
In most cases, the pollution level reaches its minimum at approximately 15:00 or 16:00. During this period, a time generally for continued working, human outdoor activities markedly decrease, and fewer pollutants are emitted into the atmosphere, providing sufficient time for the PM2.5 to scatter. This process ultimately leads to a reduction in PM2.5 concentrations. Until 18:00 and 19:00, the concentration increases again, possibly caused by human transportation activities during the evening rush hours. These increasing trends are especially obvious in winter and autumn. Note that the evening rush hours in July and August do not significantly give rise to high PM2.5 concentrations, primarily because of the comfortable weather in summer that encourages green transportation such as biking or walking.
Furthermore, from 22:00 to 06:00 on the following day, because of the tendency for pollutants to accumulate and the two-fold higher formation of aerosols during nighttime than that in daytime [33], the PM2.5 concentrations remain approximately the same. According to the research results of Liu [21], the PM2.5 concentration trends display double peaks and troughs in winter. This claim is in contrast to the results found in Weifang City, suggesting that the accumulating effects and the effect of the two-fold higher formation of aerosols may be especially weak in Chongqing. Thus, Chongqing’s air quality throughout the evening and during the night is better than that in Weifang City. The abovementioned evidence also reinforces to some degree the importance of studying each region, as conclusions about one location may not apply to another location.

5. Conclusions

Fully understanding the characteristics of PM2.5 has become pivotal in mitigating its polluting effects. Previous studies focused on large-scale urban and metropolitan areas instead of specific regions, and used historical and rough data that have markedly decreased accuracy and practicality. Considering the abovementioned comments, this paper explores the yearly, seasonal, monthly, daily, and hourly spatial-temporal characteristics of PM2.5 concentrations by using nationally controlled and provincially controlled ground monitoring observations from 2012 to 2016 in a small-scale city, Weifang City. The conclusions are as follows:
(1) Throughout the five years of the study period, the PM2.5 concentrations in Weifang City exceeded the CAAQS Grade II standard (35 µg/m3) on an annual average. After reaching a maximum in 2013 (approximately 108 μg/m3), haze-controlling measures were taken by the Chinese government, and environmental protective actions named “Three Six Eight” were implemented by the Weifang City government. These measures were beneficial, and the air quality improved. The spatial characteristics of PM2.5 concentrations are high in the west and low in the east, revealing that the PM2.5 concentrations are mainly influenced by geographical location, topography, altitude, vegetation, population, etc.
(2) The seasonal and monthly general trend of the PM2.5 concentration is U-shaped, being high in summer and low in winter, with the four seasons all exceeding the CAAQS Grade I daily standard (35 µg/m3). More specifically, the PM2.5 concentrations reached a peak in January with an index of approximately 134 μg/m3 and a low in August with a concentration of approximately 57 μg/m3. Overall, the changes in the PM2.5 concentrations were closely dependent on wind direction, vegetation cover, temperature, and relative humidity.
(3) Within a given week, our investigation reveals that the weekday concentrations are slightly higher than those on weekends. In particular, the PM2.5 concentrations on Mondays and Saturdays are among the highest, with concentrations of 79 μg/m3 and 78 μg/m3, respectively. This result suggests that changes in daily concentrations may be associated with the activities and living habits of people.
(4) Overall, the PM2.5 concentrations peak at 09:00, and reach their minimum at 15:00 to 16:00. A deviation from this trend was observed by month. To further illustrate this point, from April to September, the highest PM2.5 concentrations occurred at approximately 08:00; during October, November, February, and March, the highest PM2.5 concentrations occurred at approximately 09:00; in December and January, the index, however, reaches its maximum at 09:30. Moreover, the PM2.5 concentrations during the day are overall slightly higher than those at night due to pollutant accumulation and the two-fold higher formation of aerosols during nighttime than during daytime.
This assessment is important because it provides a comprehensive understanding of the spatial-temporal characteristics of the PM2.5 concentrations in Weifang City since 2012. This study also provides statistical verification and theoretical support for subsequent studies. However, this study has limitations. For instance, as the atmosphere and environment have a more complex structure than expected, the ground monitoring data and models adopted by this paper may not accurately represent the actual conditions in the whole city, and deviations may exist within the related analyses. In future studies, more complex data can be added to develop quantified assessments of the influencing factors, such as meteorological conditions, land use, and human activities, which can further improve our understanding of the influencing factors on PM2.5 and help build prediction models through statistical regression analysis. The research findings in this paper remain preliminary, and one direction for future research is to expand the scope of the assessment to a broader level.

Author Contributions

All authors contributed equally to this work. In particular, Y.L. and Z.D. conceived and designed the study, completed the analyses, Y.L. drafted the manuscript, which was revised by Z.D.. X.L. provided input to the study design, gave review suggestions for the manuscript on the whole writing process and polished the expression.

Funding

This research was funded by the National Key R&D Program of China (Grant No. 2016YFF0201305) and National Basic Surveying and Mapping Project of China (Grant No. A1705).

Conflicts of Interest

The authors declare no conflict of interest.

References

  1. Zhan, D.S.; Kwan, M.P.; Zhang, W.Z.; Yu, X.F.; Meng, B.; Liu, Q.Q. The driving factors of air quality index in China. J. Clean. Prod. 2018, 197, 1342–1351. [Google Scholar] [CrossRef]
  2. Dai, Z.X.; Zhang, Y.Z.; Hu, Y.F.; Yu, D. Spatial-temporal Characteristics of PM2.5 in Yangtze River Delta (YRD) Region Based on the Ground Monitoring Data from 2013 to 2015. Resour. Environ. Yangtze Basin 2016, 25, 813–821. [Google Scholar]
  3. Yao, L.; Lu, N.; Yue, X.F.; Du, J.; Yang, C.D. Comparison of Hourly PM2.5 Observations Between Urban and Suburban Areas in Beijing, China. Int. J. Environ. Res. Public Health 2015, 12, 12264–12276. [Google Scholar] [CrossRef] [PubMed]
  4. Liu, J.; Han, Y.Q.; Tang, X.; Zhu, J.; Zhu, T. Estimating adult mortality attributable to PM2.5 exposure in China with assimilated PM2.5 concentrations based on a ground monitoring network. Sci. Total Environ. 2016, 568, 1253–1262. [Google Scholar] [CrossRef] [PubMed]
  5. He, J.Q.; Yu, X.N.; Zhu, B.; Zhu, J. Characteristics of aerosol extinction and low visibility in haze pollution. China Environ. Sci. 2016, 36, 1645–1653. [Google Scholar]
  6. Ming, L.L.; Jin, L.; Li, J.; Fu, P.Q.; Yang, W.Y.; Liu, D.; Zhang, G.; Wang, Z.F.; Li, X.D. PM2.5 in the Yangtze River Delta, China: Chemical compositions, seasonal Variations, and regional pollution events. Environ. Pollut. 2017, 233, 200–212. [Google Scholar] [CrossRef] [PubMed]
  7. Wu, X.H.; Chen, Y.F.; Guo, J.; Wang, G.Z.; Gong, Y.M. Spatial Concentration, Impact factors and Prevention-Control Measures of PM2.5 Pollution in China. Nat. Hazards 2017, 86, 393–410. [Google Scholar] [CrossRef]
  8. Choi, G.; Heo, S.; Lee, J.T. Assessment of environmental injustice in Korea using synthetic air quality index and multiple indicators of socioeconomic status: A cross-sectional study. J. Air Waste Manag. Assoc. 2016, 66, 28–37. [Google Scholar] [CrossRef] [PubMed]
  9. Yang, Q.Q.; Yuan, Q.Q.; Li, T.W.; Shen, H.F.; Zhang, L.P. The Relationships between PM2.5 and Meteorological Factors in China: Seasonal and Regional Variations. Int. J. Environ. Res. Public Health 2017, 14, 1510. [Google Scholar] [CrossRef] [PubMed]
  10. He, Q.S.; Geng, F.H.; Li, C.C.; Yang, S.Q.; Wang, Y.Y.; Mu, H.Z.; Zhou, G.Q.; Liu, X.B.; Gao, W.; et al. Long-term characteristics of satellite-based PM2.5 over East China. Sci. Total Environ. 2017, 612, 1417–1423. [Google Scholar] [CrossRef] [PubMed]
  11. Song, Y.Z.; Yang, H.L.; Peng, J.H.; Song, Y.R.; Sun, Q.; Li, Y. Estimating PM2.5 Concentrations in Xi’an City Using a Generalized Additive Model with Multi-Source Monitoring Data. PLoS ONE 2015, 10, e0142149. [Google Scholar] [CrossRef] [PubMed]
  12. Zhang, H.F.; Wang, Z.H.; Zhang, W.Z. Exploring spatiotemporal patterns of PM2.5 in China based on ground-level observations for 190 cities. Environ. Pollut. 2016, 216, 559–567. [Google Scholar] [CrossRef] [PubMed]
  13. Yan, D.; Lei, Y.L.; Shi, Y.K.; Zhu, Q.; Li, L.; Zhang, Z.E. Evolution of the spatial-temporal pattern of PM2.5 concentrations in China—A case study from the Beijing-Tianjin-Hebei region. Atmos. Environ. 2018, 183, 225–233. [Google Scholar] [CrossRef]
  14. Hu, J.L.; Wang, Y.G.; Ying, Q.; Zhang, H.L. Spatial and temporal variability of PM2.5 and PM10 over the North China Plain and the Yangtze River Delta, China. Atmos. Environ. 2014, 95, 598–609. [Google Scholar] [CrossRef]
  15. Guo, H.; Cheng, T.H.; Gu, X.F.; Wang, Y.; Chen, H.; Bao, F.W.; Shi, S.Y.; Xu, B.R.; Wang, W.N.; Zuo, X.; et al. Assessment of PM2.5 concentrations and exposure throughout China using ground observations. Sci. Total Environ. 2017, 601–602, 1024–1030. [Google Scholar] [CrossRef] [PubMed]
  16. Li, J.M.; Han, X.L.; Li, X.; Yang, J.P.; Li, X.J. Spatiotemporal Patterns of Ground Monitored PM2.5 Concentrations in China in Recent Years. Int. J. Environ. Res. Public Health 2018, 15, 114. [Google Scholar] [CrossRef] [PubMed]
  17. Wang, G.L.; Xue, J.J.; Zhang, J.Y. Analysis of Spatial-temporal distribution Characteristics and Main Cause of Air Pollution in Beijing-Tianjin-Hebei Region in 2014. Meteorol. Environ. Sci. 2016, 39, 34–42. [Google Scholar]
  18. Ye, W.F.; Ma, Z.Y.; Ha, X.Z. Spatial-temporal patterns of PM2.5 concentrations for 338 Chinese Cities. Sci. Total Environ. 2018, 631–632, 524–533. [Google Scholar] [CrossRef] [PubMed]
  19. Liu, H.M.; Fang, C.L.; Huang, J.J.; Zhu, X.D.; Zhou, Y.; Wang, Z.B.; Zhang, Q. The Spatial Temporal Characteristics and influencing factors of air pollution in Beijing-Tianjin-Hebei urban agglomeration. J. Geog. Sci. 2018, 73, 177–191. [Google Scholar]
  20. Feng, J.L.; Hu, J.C.; Xu, B.H.; Hu, X.L.; Sun, P.; Han, W.L.; Gu, Z.P.; Yu, X.M.; Wu, M.H. Characteristics and seasonal variation of organic matter in PM2.5 at a regional background site of the Yangtze River Delta region, China. Atmos. Environ. 2015, 123, 288–297. [Google Scholar] [CrossRef]
  21. Liu, Y.L.; Sun, Q.M.; Zhong, M.Y.; Zuong, B.Q.; Luo, K.L. Temporal and Spatial Distribution Characteristics of PM2.5 in Chongqing Urban Areas. Environ. Sci. 2016, 37, 1219–1229. [Google Scholar]
  22. Kang, H.Y.; Liu, Y.L.; Li, T. Characteristics of Air Quality Index and its relationship with meteorological factors in key city of Heilongjiang Province. J. Nat. Resour. 2017, 32, 692–703. [Google Scholar]
  23. Chen, X.J.; Zhang, J.T.; Zhang, C.C.; Peng, X.J. Spatial and Temporal Variation of PM2.5 Concentrations Based on Thiessen Polygon and its Correlation with Land-use Patterns in Nanjing City. Bull. Soil Water Conserv. 2018, 38, 293–298. [Google Scholar]
  24. Jin, Q.; Fang, X.Y.; Wen, B.; Shan, A. Spatio-temporal variations of PM2.5 emission in China from 2005 to 2014. Chemosphere 2017, 183, 429–436. [Google Scholar] [CrossRef] [PubMed]
  25. Gong, J.P.; Hu, Y.M.; Liu, M.; Bu, R.C.; Chang, Y.; Li, C.L.; Wu, W. Characterization of air pollution index and its affecting factors in Industrial Urban Area in northeastern China. Technology 2015, 24, 1579–1592. [Google Scholar] [CrossRef]
  26. Wu, X.L.; Zhang, B.; Ai, N.S.; Liu, L.J. Wavelet analysis on SO2 pollution index changes of Shanghai in recent 10 years. Environ. Sci. 2009, 30, 2193–2198. [Google Scholar]
  27. Tian, G.; Qiao, Z.; Xu, X. Characteristic of particulate matter (PM10) and its relationship with meteorological factors during 2001-2012 in Beijing. Environ. Pollut. 2014, 192, 266–274. [Google Scholar] [CrossRef] [PubMed]
  28. Shi, Y.S.; Matsunaga, T.; Yamaguchi, Y.; Zhao, A.; Li, Z.Q.; Gu, X.F. Long-term trends and spatial patterns of PM2.5-induced premature mortality in South and Southeast Asia from 1999 to 2014. Sci. Total Environ. 2018, 631–632, 1504–1514. [Google Scholar] [CrossRef] [PubMed]
  29. Wang, Z.S.; Li, Y.T.; Chen, T.; Zhang, D.W.; Sun, F.; Pan, L.B. Spatial-Temporal characteristics of PM2.5 in Beijing in 2013. Acta Geogr. Sin. 2015, 70, 110–120. [Google Scholar]
  30. Nowak, D.J.; Hirabayashi, S.; Bodine, A.; Hoehn, R. Modeled PM2.5 removal by trees in ten U.S. cities and associated health effect. Environ. Pollut. 2013, 178, 395–402. [Google Scholar] [CrossRef] [PubMed]
  31. Yan, S.J.; Cao, H.; Chen, Y.; Wu, C.Z.; Hong, T.; Fan, H.L. Spatial and temporal characteristics of air quality and air pollutants in 2013 in Beijing. Environ. Sci. Pollut. Res. 2016, 23, 13996–14007. [Google Scholar] [CrossRef] [PubMed]
  32. Li, L.; Qian, J.; Zhou, Y.X.; Guo, C.; Guo, Y. Spatial and temporal analysis of Air pollution Index and its timescale-dependent relationship with meteorological factor in Guangzhou, China, 2001–2011. Environ. Pollut. 2014, 190, 75–81. [Google Scholar] [CrossRef] [PubMed]
  33. Ren, L.H.; Zhou, Z.E.; Zhao, X.Y.; Yang, W.; Yin, B.H.; Bai, Z.P.; Ji, Y.Q. Source Apportionment of PM10 and PM2.5 in urban areas of Chongqing. Res. Environ. Sci. 2014, 27, 1387–1394. [Google Scholar]
Figure 1. Study area and spatial distribution of monitoring stations. Panel A: Location of Shandong Province and Weifang City. Panel B: Spatial distribution of 38 monitoring stations in Weifang City.
Sustainability 10 02960 g001
Figure 2. Annual average concentration of PM2.5 from 2012 to 2016. (The bars indicate average value ±S.D. The analysis is performed based on 38 observations).
Sustainability 10 02960 g002
Figure 3. Spatial distribution of PM2.5 concentrations in Weifang City, from 2012 to 2016.
Sustainability 10 02960 g003
Figure 4. Seasonal and monthly average concentrations of PM2.5, from 2012 to 2016. (The bars indicate average value ±S.D. The analysis is performed based on 38 observations).
Sustainability 10 02960 g004
Figure 5. Daily average concentration of PM2.5, from 2012 to 2016. (The bars indicate average value ±S.D. The analysis is performed based on 38 observations).
Sustainability 10 02960 g005
Figure 6. Hourly average concentration of PM2.5, from 2012 to 2016. (The bars indicate average value ±S.D. The analysis is performed based on 38 observations).
Sustainability 10 02960 g006
Figure 7. Hourly average concentration of PM2.5 in different months from 2012 to 2016.
Sustainability 10 02960 g007

