An Exploration of the Debt Ratio of Ski Lift Operators


1
Austrian Institute of Economic Research (WIFO), 1030 Vienna, Austria
2
Department of Public Finance, University of Innsbruck, 6020 Innsbruck, Austria
*
Author to whom correspondence should be addressed.
Sustainability 2018, 10(9), 2985; https://doi.org/10.3390/su10092985
Submission received: 4 July 2018
/
Revised: 3 August 2018
/
Accepted: 16 August 2018
/
Published: 22 August 2018
(This article belongs to the Special Issue Sustainable Winter Tourism in Changing Climate)
Abstract
:This article examines the determinants of the debt-to-capital ratio of ski lift operators. The analysis is based on the total population of 248 ski lift operators in Austria. The median debt-to-capital ratio is 73%, with a highly skewed distribution, where almost every fourth operator exhibits negative equity capital. Robust regressions show that the debt-to-capital ratio significantly depends on the size of the ski area, elevation, location, presence of a neighboring ski area, supply of accommodation nearby, and the proportion of foreign overnight stays. However, the significance and magnitude of these factors differ between East and West Austria. For eastern Austria, larger ski operators, with neighboring resorts close by and a vast supply of accommodation, have a significantly lower debt-to-capital ratio. In western Austria, elevation and presence of a neighbor are significant predictors. Operators with a neighbor nearby exhibit a 15-percentage-point lower debt ratio.
1. Introduction
Sustainability consists of three pillars: economic, environmental, and social issues [1]. Because ski lift operators are relatively land and resource intensive businesses, compared with other industries, environmental sustainability and climate change receive the most attention among scholars. In recent years, ski lift operators have been increasingly aware of their environmental responsibilities, and thus have tried to reduce their carbon footprint. This is undertaken by reducing energy consumption, increasing the consumption of clean energy, using environmentally friendly business practices, and means of transportation within the destination (i.e., electric buses), as well as the introduction of green certification labels (source: annual reports of the largest ski lift companies). Some operators even state sustainability or environmental achievements separately or in their annual reports. Others have successfully registered for one of the environmental certification standards (International Standard Organization, ISO 14,000 series, Eco-Management and Audit Scheme (EMAS) certification). However, the issue of economic sustainability of ski lift companies is largely overlooked. To be economically sustainable, a business must be profitable. Firms with a high level of debts or liabilities in relation to equity or assets are commonly at risk of failure and have difficulty financing future investments [2,3,4]. Often, high debts reflect cumulative losses over time [5]. The hospitality industry, airlines, and other transportations are characterized by high levels of debt [6,7]. Ski lift operators are no exceptions to this, and exhibit high debts measured by the debt-to-capital ratio. For instance, operators in North America report a debt-to-capital ratio ranging between 60 and 100% (Wyatt investment; www.wyattresearch.com).
This study aims to empirically investigate factors of importance for economic sustainability of ski lift operators. Sustainability is measured by the debt-to-capital-ratio. Specific focus is put on the importance of determinants such as size, elevation, and presence of neighboring operators. A type of robust regression methods is employed that can deal with the skewed distribution of the debt ratio. Data is retrieved from the total population of ski lift operators with three and more ski lifts in 2013.
The literature shows that the level of indebtedness, measured either as the debt-to-capital-ratio or the debt-to-equity -ratio, depends on many factors including size, age, sector affiliation, share of tangible assets, profitability, ownership characteristics, and growth opportunities [8]. For the hospitality industry, several studies focus on the determinants of the capital structure at the firm level [6,7,9,10,11,12,13,14,15,16,17,18,19,20]. Other studies include a wider group of tourism industries, and investigate the determinants of the level of indebtedness [6,20]. These studies reveal that the debt ratio depends on firm characteristics such as age, size, profitability, share of tangible assets, past growth, and growth opportunities, although the importance and strength of these factors vary across studies. The role of age, profitability, and growth in the past is remarkably unclear. None of these studies have taken location specific factors into account.
The ski industry is particularly interesting to analyze because it is currently in a phase of stagnation and consolidation [21]. Since the mid-1980s, there have been no new entries into the main ski markets in the European Alps or in North America, and growth of ski resorts is possible only by new lift connections between ski areas. Previous studies based on balance sheet data for ski lift operators have focused on the technical efficiency with total assets and labor costs as input factors [22].
The study contributes the first empirical analysis of the determinants of the debt ratio among ski lift operators. It gives detailed information on the weight of the factors of importance. The ski lift industry is often neglected in the literature, along with other providers of recreation and leisure activities. A novel aspect of the analysis is the introduction of location and geographical factors, such as presence of a neighbor and elevation, for determining the level of indebtedness. Determinants also include characteristics of the operators including size of the ski area and village specifics (local accommodation supply). Another innovation is the use of the recently developed robust regression methods, which are robust to a large proportion of influential observations and outliers, as is the case for company-specific debt ratio data. A detailed analysis of the debt-to-capital structure of ski lift operators has not been conducted so far. Given the homogeneity of ski lift operations, the results are expected to be representative beyond the dataset used (at least for Europe).
Knowing the factors that influence the ratio of debt-to-capital is relevant to managers and stakeholders for a variety of reasons. On the one hand, high debt ratios and negative equity positions are leading indicators of corporate failure. Failure of companies is associated with high costs for investors and creditors. On the other hand, insights into the determinants of the debt ratio are important for local government agencies, as some ski lift companies are partly publicly owned or supported through public funds. A high level of debt relative to equity is not compatible with economic sustainability of achieving a sufficient cash flow to guarantee liquidity and a satisfying return on capital.
The structure of this paper is as follows: Section Two outlines the conceptual background and the research hypotheses. Section Three introduces the empirical model and the data. Section Four presents descriptive statistics and the empirical results. Section Five presents the discussion and conclusions.
2. Conceptual Background and Research Hypotheses
Economic sustainability can be measured in various ways. Profitability is a common measure of economic sustainability. This also applies to tourism enterprises [23]. Other measures of economic sustainability include efficiency, productivity, debts, and performance. Profitability can be described in several ways, although the generally preferred measure is derived from the profit and loss accounts of firms [24]. However, information on economic profitability or productivity is difficult to obtain for small ski lift operators, as these (micro-) firms are not obliged to publicly provide such information. According to Austrian Commercial code, firms are exempt from submitting income statements (profit and loss accounts) (§ 221 UGB) if at least two of the three following criteria is met: a balance sheet total of less than €5 million, less than €10 million in sales in the twelve months preceding the balance sheet date, or an annual average of not more than 50 employees (https://www.jusline.at/gesetz/ugb/paragraf/221). A majority of Austrian ski lift operators meet these criteria and thus do not submit income statements. An alternative way to measure profitability is to use the accounting profit rate [24]. This can be calculated as the ratio of accounting profits to the book value of assets, where both numbers originate from the balance sheets. This information is available for all ski lift operators. Yet, this alternative measure is based on the Austrian commercial code and thus is not identical to the economic profits or losses incurred in the financial year, as the reporting can be manipulated through the formation and reversal of reserves, for instance.
In general, profits are volatile over time with a pro-cyclical pattern, implying that the rate of profit is strongly related to the period of measurement. In contrast, the debts of a firm are highly persistent over time and thus less affected by the current financial position. Therefore, in this study, the debt-to-capital ratio is used to measure economic sustainability of firms. This approach also gives a better indication of the long-term status of the ski lift operator than an analysis based on the economic or accounting profit ratio. A high debt ratio often reflects cumulative losses in the past. In addition, the debt ratio is good predictor of company failure.
The debt ratio is likely to vary across different types of firms. Possible factors include location-specific and firm-specific factors. Location-specific factors have so far received little attention in studies of the debt ratio of hotels and restaurants and related industries. For hotels, previous studies show that an ideal location is associated with higher hotel prices, higher performance, and a higher survival rate [25,26,27,28]. In the ski industry, the most important factors for performance and survival are the altitude of the terrain, size, and the presence of neighboring ski areas [29,30]. The distance to cities could also play a role in this regard.
The positive externalities of co-location of firms in an industry have long been recognized [31]. The co-location of firms can, for example, have positive effects due to geographically localized spillovers or agglomeration advantages. It is suggested that service firms can benefit from agglomeration by attracting more customers even when there are no explicit regional spillovers [32]. This is because geographically concentrated firms can attract more customers as a group relative to what they could attract individually [33]. This is especially true if the products offered by the companies are heterogeneous [32]. However, local presence of many competitors can have negative effects such as high factor costs and a high number of exits [30,34].
In the hospitality industry, positive effects of agglomeration on performance often occur [35,36,37,38]. In the case of ski resorts, ski areas with nearby neighbors may have an advantage because operators often cooperate with the neighboring ones. These collaborations are diverse and include joint marketing activities, destination branding, and mutual pricing systems for lift tickets [39]. For instance, ski lift tickets are often valid on the adjacent slopes in the neighboring areas. The related benefits comprise not only more slope kilometers, but more variety as well.
The relationship between collaboration and debt ratio can also be explained by financial theory, as in, for instance, the trade-off theory [40]. This theory indicates a higher debt-ratio for firms with neighbors nearby, who feel a lower degree of insecurity due to implicit cooperation efforts. On the contrary, the pecking order theory [4,40] suggests that companies with neighbors have a higher profitability, and thus a lower debt ratio. Given that co-location of ski areas may be associated with agglomeration advantages, which in turn leads to higher performance and possibly also a lower debt ratio, the first hypothesis can be formulated.
Hypothesis 1.
A neighbor nearby is associated with a lower debt-to-capital ratio of ski lift operators.
Counter-hypothesis: A neighbor nearby does not lead to a lower debt-to-capital ratio of ski lift operators.
Another location specific factor is elevation of ski areas. Elevation is commonly regarded as a factor critical to performance in anomalously warm winter seasons [29,41,42,43,44]. For instance, in Australia, low natural snow cover was found to lead to a strong decline in visitors—ranging between 52 and 86 percent—for the three lowest-altitude ski resorts compared with the average number of visitors for the previous nine years [43]. Previous empirical evidence from Austrian ski areas in the province of Tyrol shows that lower-elevation resorts experienced the largest reductions in number of passenger transports during the extraordinarily warm winter season of 2006/2007 [29]. For New Hampshire, Hamilton et al. [45] find that many low-elevation ski areas in the southern part of the state have been abandoned in favor of ski areas at higher elevations in more northerly locations (see also [30]). Lower sections of ski areas are typically more vulnerable to warm winter temperatures than higher-elevation slopes [46]. As the actual debt ratio may reflect possible losses in the past, and green winters often occurred in recent years, it can be expected that ski areas at lower altitudes have disadvantages compared with those located in snow-reliable high elevation areas.
Hypothesis 2.
The debt-to-capital ratio is related to elevation.
Counter hypothesis: The debt-to-capital ratio is independent of elevation.
Size is another factor that is relevant for performance and debts of companies. A study investigating the link between efficiency and firm size shows that large firms are more efficient than small firms because of market power [47]. Based on data for ski lift operators for New England, Beaudin and Huang [48] show that the larger a ski area is, the higher the chance it has to survive. As debts and probability of bankruptcy are correlated, the debt ratio is likely to be lower for large operators. In the hospitality literature, size is measured by the number of total assets. For ski resorts located in North Tyrol, Steiger [29] find that the decline in skier visits during the exceptionally warm winter of 2006/07 (+3 °C above the climatic mean) was more pronounced for small to medium ski areas than for large ski areas. As ski lift operators are land intensive, size of terrain is probably more relevant than the asset value of the lift equipment, snow making systems, and other fixed assets. Previous studies on the role of the size in determining the debt ratio are mixed. Positive relationships between debts and size are found for hotels [12] and for restaurants [49]. In contrast, Kim [7] reveals that the debt ratio of large restaurants is significantly lower than for small ones. Based on data for about 2000 hotels in the US, Singh and Schmidgall [5] show that the debt ratio for small businesses is between three and four times higher than that for larger hotels. The large differences in the relevance of the size across studies could be the result of differences in the samples (inclusion or exclusion of the very small firms). Small operators are likely to have higher debts because of economies of scale and high fixed costs of operations.
Hypothesis 3.
Size of ski areas is related to the debt-to-capital ratio.
Counter-hypothesis: Size of ski areas is independent of the debt-to-capital ratio.
Age is another important characteristic of a firm. Earlier entrants are more likely to have lower debts because they make higher profits in the early stages of the industry’s life cycle and show higher performance. Older companies often have a better reputation, and information asymmetries between lenders and borrowers are likely to be lower. For the restaurant industry, the literature shows that older restaurants exhibit a significantly higher debt ratio [19]. In contrast, Dalbor et al. [50] find no significant relationship. In the ski industry, it is unlikely that age plays a major role because there has been no entries in Austria in the last 30 years.
3. Empirical Model and Data
The dependent variable is the debt-to-capital ratio measured as total debts divided by debts plus equity capital. Firms use a combination of equity capital and debts to finance their assets [51,52,53]. Equity capital represents money invested by shareholders, while debts refer to money provided by creditors, which is associated with interest and repayments. A high debt ratio can be an indication of financial distress [2,3,4]. High debt coupled with negative equity poses an even greater threat to companies. Firms with a negative equity position can be regarded as technically insolvent [54] or practically bankrupt [55]. Previous empirical studies show that the debt-to-book equity ratio is significant predictor of firm failure [2,3,4,56].
In the accounting and finance literature, the level of indebtedness of firms is defined in several ways. A commonly used measure is the debt ratio (the book or market value of total debts divided by the book value of equity) [57]:
The debt-to-equity ratio is a financial ratio indicating the relative proportion of debts and equity. It is also referred to as the financial leverage ratio. A higher ratio indicates greater risk for the creditors, through high interest and debt payments, while a smaller ratio shows a safer position and better long term financial viability. If equity capital is negative, the debt-to-equity ratio becomes negative and becomes difficult to interpret. One solution is to define the debt ratio as the book value of debt divided by the book value of debt plus the market value of equity [58]:
This debt ratio is similar to the ratio of total debts to total assets (sum of total liabilities and total equity), which is commonly used in the hospitality literature [19,49]. As the market value of equity is available only for listed firms, the book value of equity is often used for privately owned companies. A debt-to-capital ratio exceeding one indicates a negative equity position. This is likely caused by cumulative losses in the past, which exceed equity capital [5].
The use of book value of equity as a measure of the firm’s assets can be criticized for several reasons. It is an accounting number that measures the shareholders’ initial capital contributions [59]. The book value of equity is often regarded as a “plug number” to balance the left-hand side and the right-hand side of the balance sheet [58]. However, it is suggested that book value-based measures of equity capital are more appropriate than market-based measures because market-based values show higher fluctuations [60]. Similarly, the book value of equity is regarded as an important variable in equity valuation for financially troubled firms and plays a role as a proxy for expected future normal earnings [61]. A comparison of the debt-to-equity ratio based on the market equity value with that based on the book value of equity shows little difference [62].
As mentioned above, hospitality literature shows that the debt ratio depends on various factors [6,7,9,10,11,12,13,14,15,16,17,18,19,20], a significant one being growth opportunities. However, the hospitality literature is not clear-cut. Specifically, both Tang and Jang and Dalbor and Upneja [11,12] find a significantly positive relationship between the debt ratio and growth opportunities, whereas others [16,49] show that hotels with growth opportunities use less debts. Similarly, using firm level data for restaurants, Kim [7] finds a significantly negative relationship, and additionally suggests that growth opportunities are the most significant predictor of the debt ratio. Unfortunately, past growth cannot be used because there is no revenue information for small businesses.
Profitability is regarded as another important factor of the capital structure of hospitality firms. There are two main theories underlying this; the trade-off theory and the pecking-order theory. According to the trade-off theory, high profitability allows firms to increase their borrowing, which is favorable because of tax reasons [8]. The pecking-order theory states the opposite; that high profitability is associated with a high amount of retained earnings, which can in turn be used for internal financing of new investments. It is argued that many successful and profitable firms exhibit a low level of debt relative to equity [52]. Economic profitability can be calculated using information from the profit and loss accounts, while accounting profitability uses balance sheet data. However, the accounting profit rate is not included in the final specification as it is clearly endogenous to the observed and unobserved characteristics of the ski lift operators.
Share of fixed (tangible) assets is commonly seen as another significant determinant of the capital structure. The trade-off theory predicts a positive relationship between the share of fixed assets and the debt ratio. Most studies for hotels find a positive association between the share of fixed assets and the debt ratio [11,19]. However, this relationship is less relevant in the ski lift industry because all companies have an extremely high proportion of fixed assets. Intangible assets such as investments in software activities or research and development do not play a role. Because this variable likely has no or little variation across operators, it is not considered in the empirical analysis. In addition, many other control variables are considered, including accommodation supply in the corresponding (wider) ski area, distance to the nearest agglomeration, and region.
The empirical model relates the debt-to-capital ratio to size, elevation of the ski area, presence of a neighboring ski area, and the ratio of tourist beds to the length of slopes as a measure of supply of accommodation establishments. In addition, regional dummy variables are included. The equation regarding the determinants of the debt-to-capital ratio can be specified as follows:
where i denotes the ski lift operator and ln () the natural logarithm. The dependent variable, DEBT/(DEBT + EQUITY), is defined as total debts divided by the sum of equity and debts in 2013. This measure exceeds one if the book value of the equity capital is negative. SIZECAT captures four size categories of length of slopes (see Table 1), with less than 10 km as the reference category. Here, length of ski runs includes the terrain of the neighboring ski area, which is connected by lifts or ski-runs. Each ski resort is also classified in five altitude categories (see Table 1), based on the elevation of its highest lift station (ELEVATIONCAT) with the lowest elevation category as the reference. Presence of a neighboring ski area (NEIGHBOR) is a dummy variable equal to one when there is another resort within the road distance of 15 km, and zero otherwise. BEDS/SIZE represents the number of guest beds in local accommodation establishments in the previous winter season of 2012/2013, SHFOREIGN is the share of foreign overnight stays in the previous winter season of 2012/2013, REGION denotes a set of dummy variables for the federal states and is the constant.
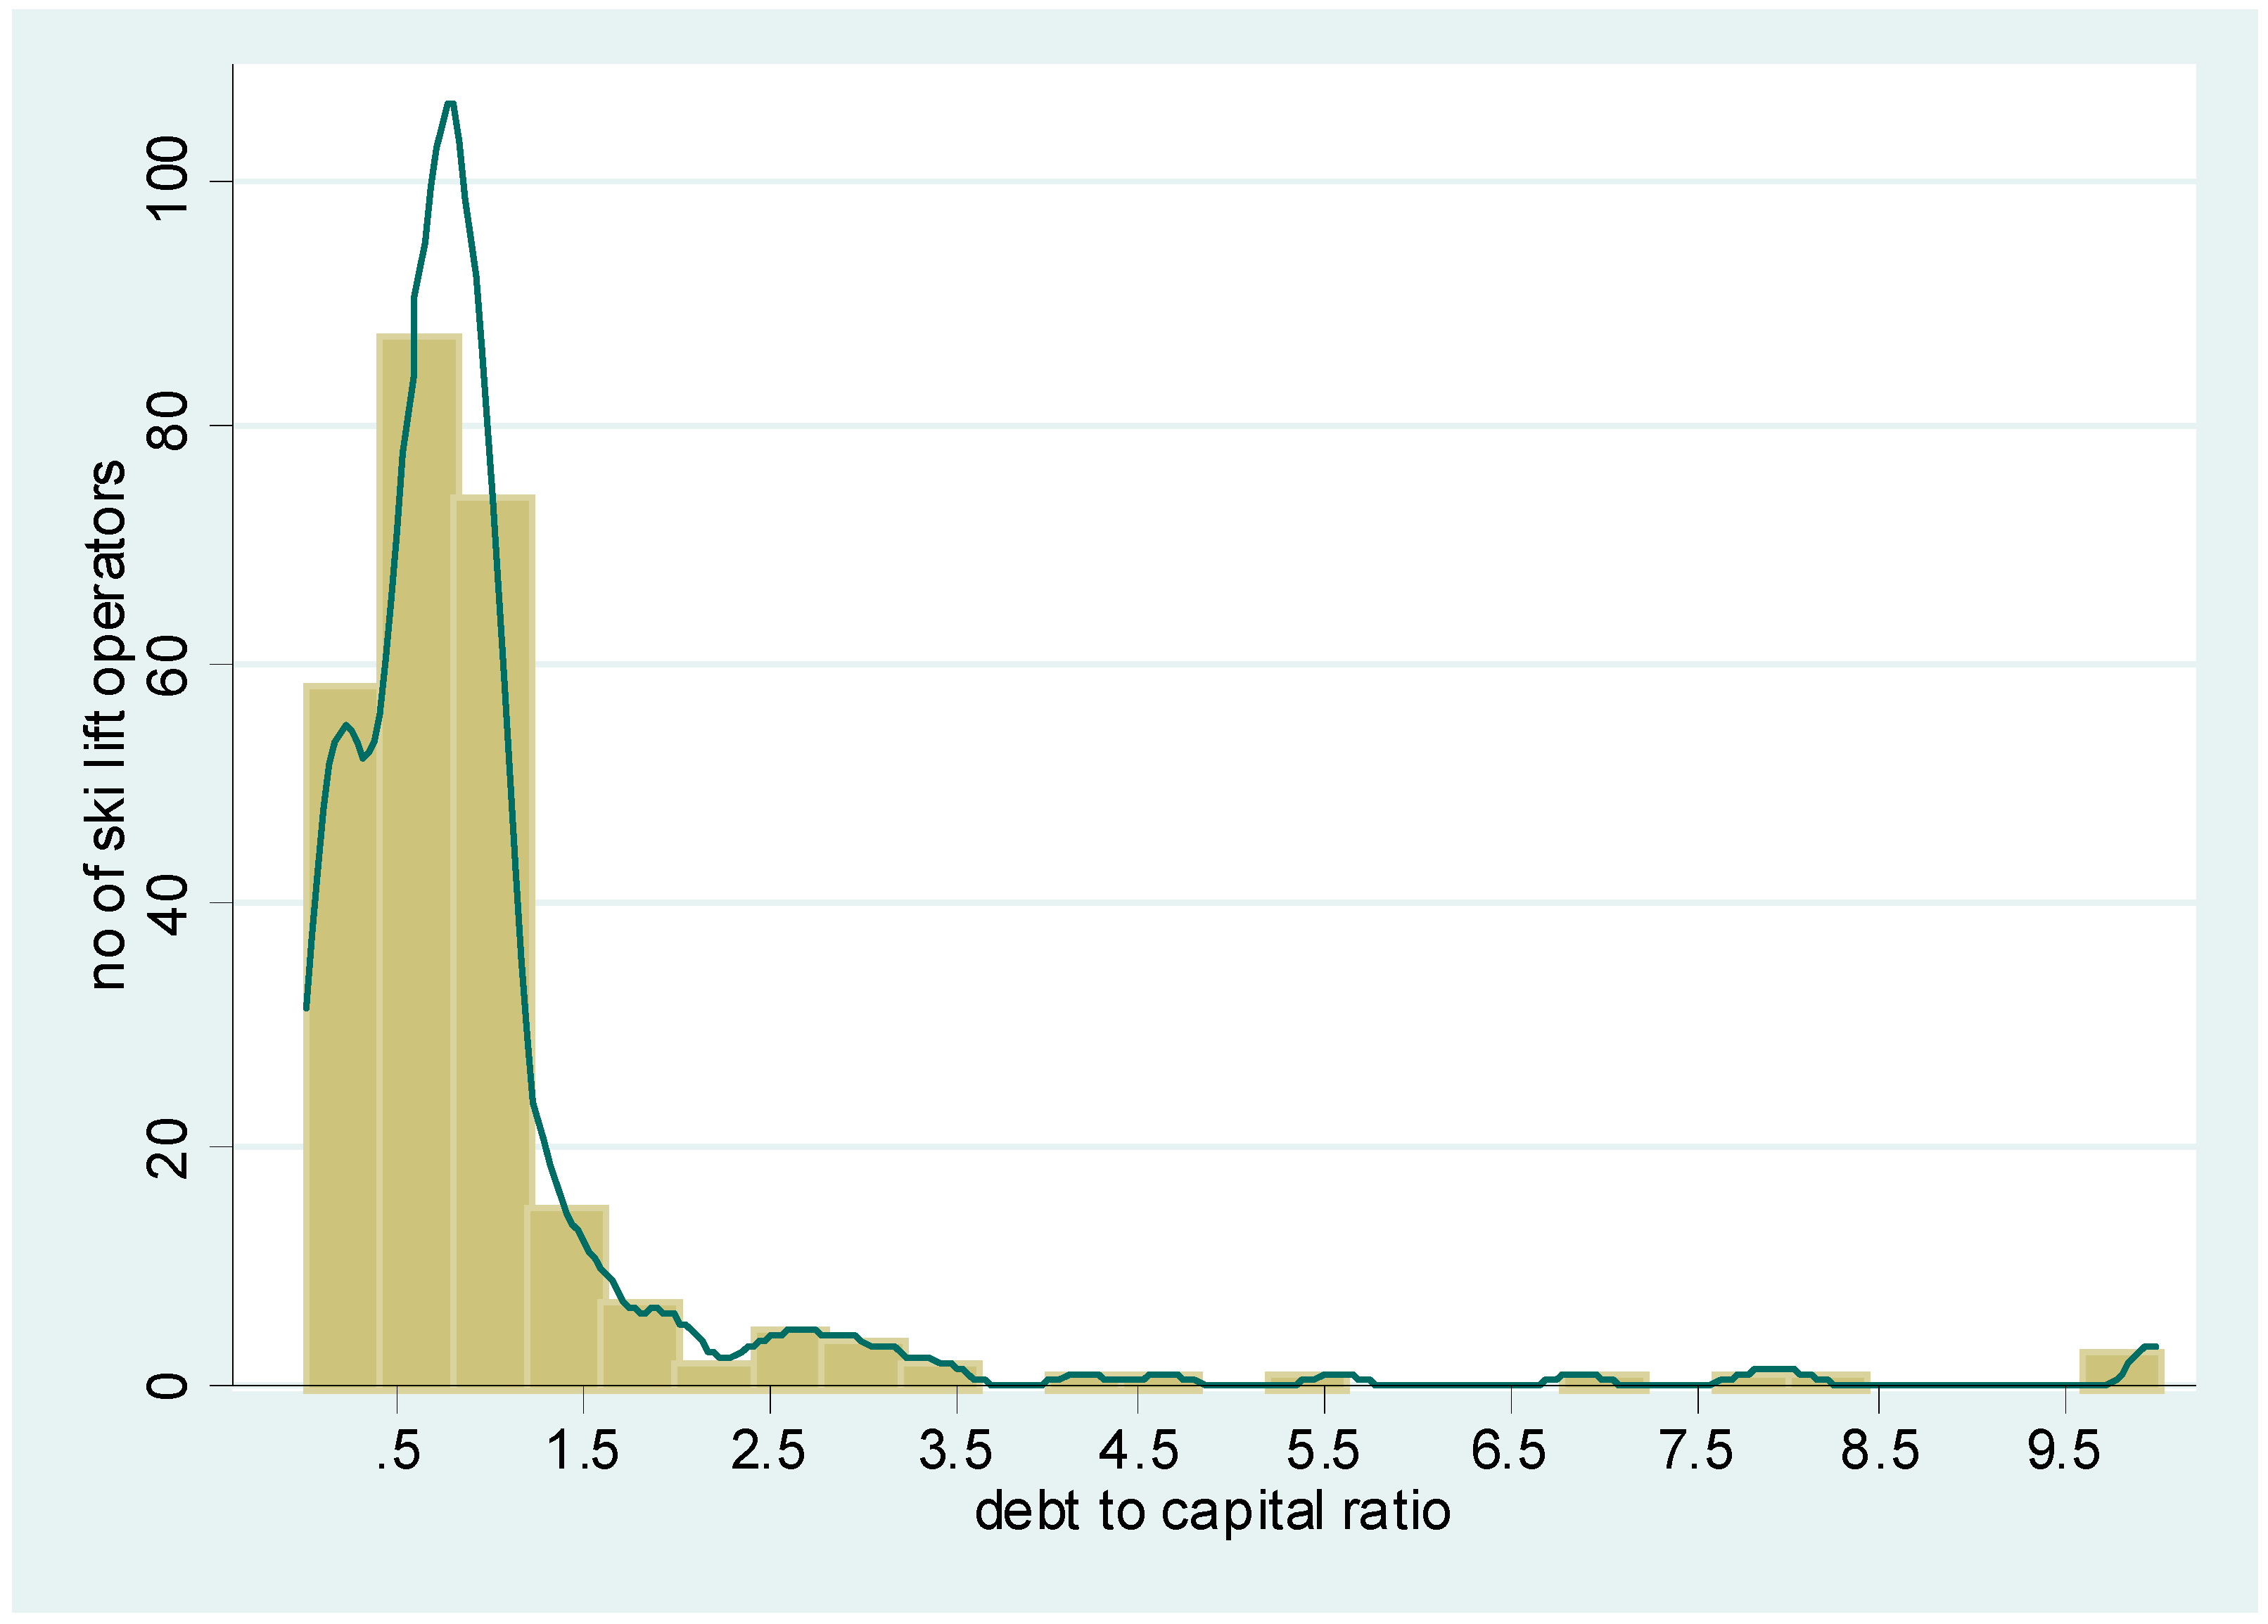
The empirical model can be estimated by ordinary least squares (OLS). However, OLS is extremely sensitive to influential observations and outliers because of the squaring of the residuals [63]. The estimation sample includes a large share of operators with a negative equity value, which leads to a debt-to-capital ratio of more than 100% (Figure 1). These extreme values can have a large impact on the estimates. One solution is to exclude these values, as conducted in the literature [54,64]. However, this leads to a sample selection bias. The other solution is to use robust regression methods that assign these observations less weight in the estimations [63]. Using balance sheet data drawn from the AMADEUS database, Farčnik et al. [65] apply the standard robust regression method developed by Huber [66]—referred to as the Huber robust regression model—to the determinants of the debt ratio of tourism firms in southern Europe. However, the Huber robust regression method cannot handle many influential observations, as is the case in this sample. It is suggested that the Huber estimator can only identify isolated outliers and is inappropriate when clusters of outliers exist [67]. Therefore, we use a variant of the MM-estimator developed by Yohai [68] and slightly modified by Verardia nd Croux [67]. This robust estimator can deal with a large share of influential observations and outliers (up to 50% of the sample, which is equal to a breakdown point of 0.50) and exhibit a higher statistical efficiency [67]. Ski resorts differ in their characteristics between eastern and western Austria, with ski areas in the East being located at lower altitudes, of smaller size, and less concentrated than in the West. Therefore, separate results are provided for eastern Austria (Carinthia, Styria, Lower Austrian, and Upper Austria) and for West Austria (Salzburg province, Tyrol, and Vorarlberg).
Data on debt and equity originates from annual financial accounts of the universe of private ski lift operators with three or more lifts (n = 248) (https://www.kompany.at/) (Data is available upon request). All ski lift operators are obliged to provide information on total equity capital and total debt, even the smaller ones. However, profit and loss accounts are only mandatory for operators with a yearly turnover above a specific threshold. Thus, profitability measures or specific debt measures such as long-term debts instead of total debts cannot be used. There are few multi-establishment firms, unlike in France or in North America, thus it can be assumed that each operator represents an establishment. The year 2013 is used for the empirical analysis. All winter seasons from 2008/09 to 2012/13 were cooler or equal to the 30-year average 1981–2000; whereas from 2013/14 to 2016/17, winter seasons were considerably warmer than the climatic average (Source: ZAMG; www.zamg.ac.at). It is possible that these extraordinary warm seasons led to increased investments into snowmaking facilities, while revenues might have declined because of insufficient snow conditions at times. Using a sample of Austrian hotels, the literature [69] shows that snow conditions have a significant impact on the return to assets, which in turn can also affect leverage. This is why we used the year 2013 for analysis, as the preceding seasons were climatically normal to cool and we wanted to exclude increased risk-taking by ski area managers in response to adverse climatic conditions.
Information on elevation of lift stations and year of installation of the first ski lift is available from the Austrian Federal Ministry for Transport, Innovation, and Technology (BMVIT). Information on the length of slopes as proxy of ski area size is obtained from the website of the operators. Bed capacity of accommodation and number of overnight stays of the municipality originates from Statistics Austria. Each ski area was assigned to all municipalities with direct connection by lift or ski-run. The presence of a neighboring ski area within 15 km road distance is calculated with Google Maps. In cases where one ski area is assigned to more than one municipality, the postal code of the largest village of the corresponding ski area is used to calculate the road distance to the neighboring ski areas.
4. Descriptive Statistics and Empirical Results
4.1. Descriptive Statistics
Descriptive statistics show a mean debt-to-capital ratio of about one and median of 0.73 (Table 1). This is relatively large when compared with mean values of other industries. For U.S. listed firms, Welch [58] reports a median value of the debt-to-capital ratio of 0.30. For a group of selected industrialized countries, Rajan and Zingales [62] show debt-to-capital ratios ranging between 0.28 and 0.55. However, capital intensive industries typically exhibit higher than average debt-to-capital ratios.
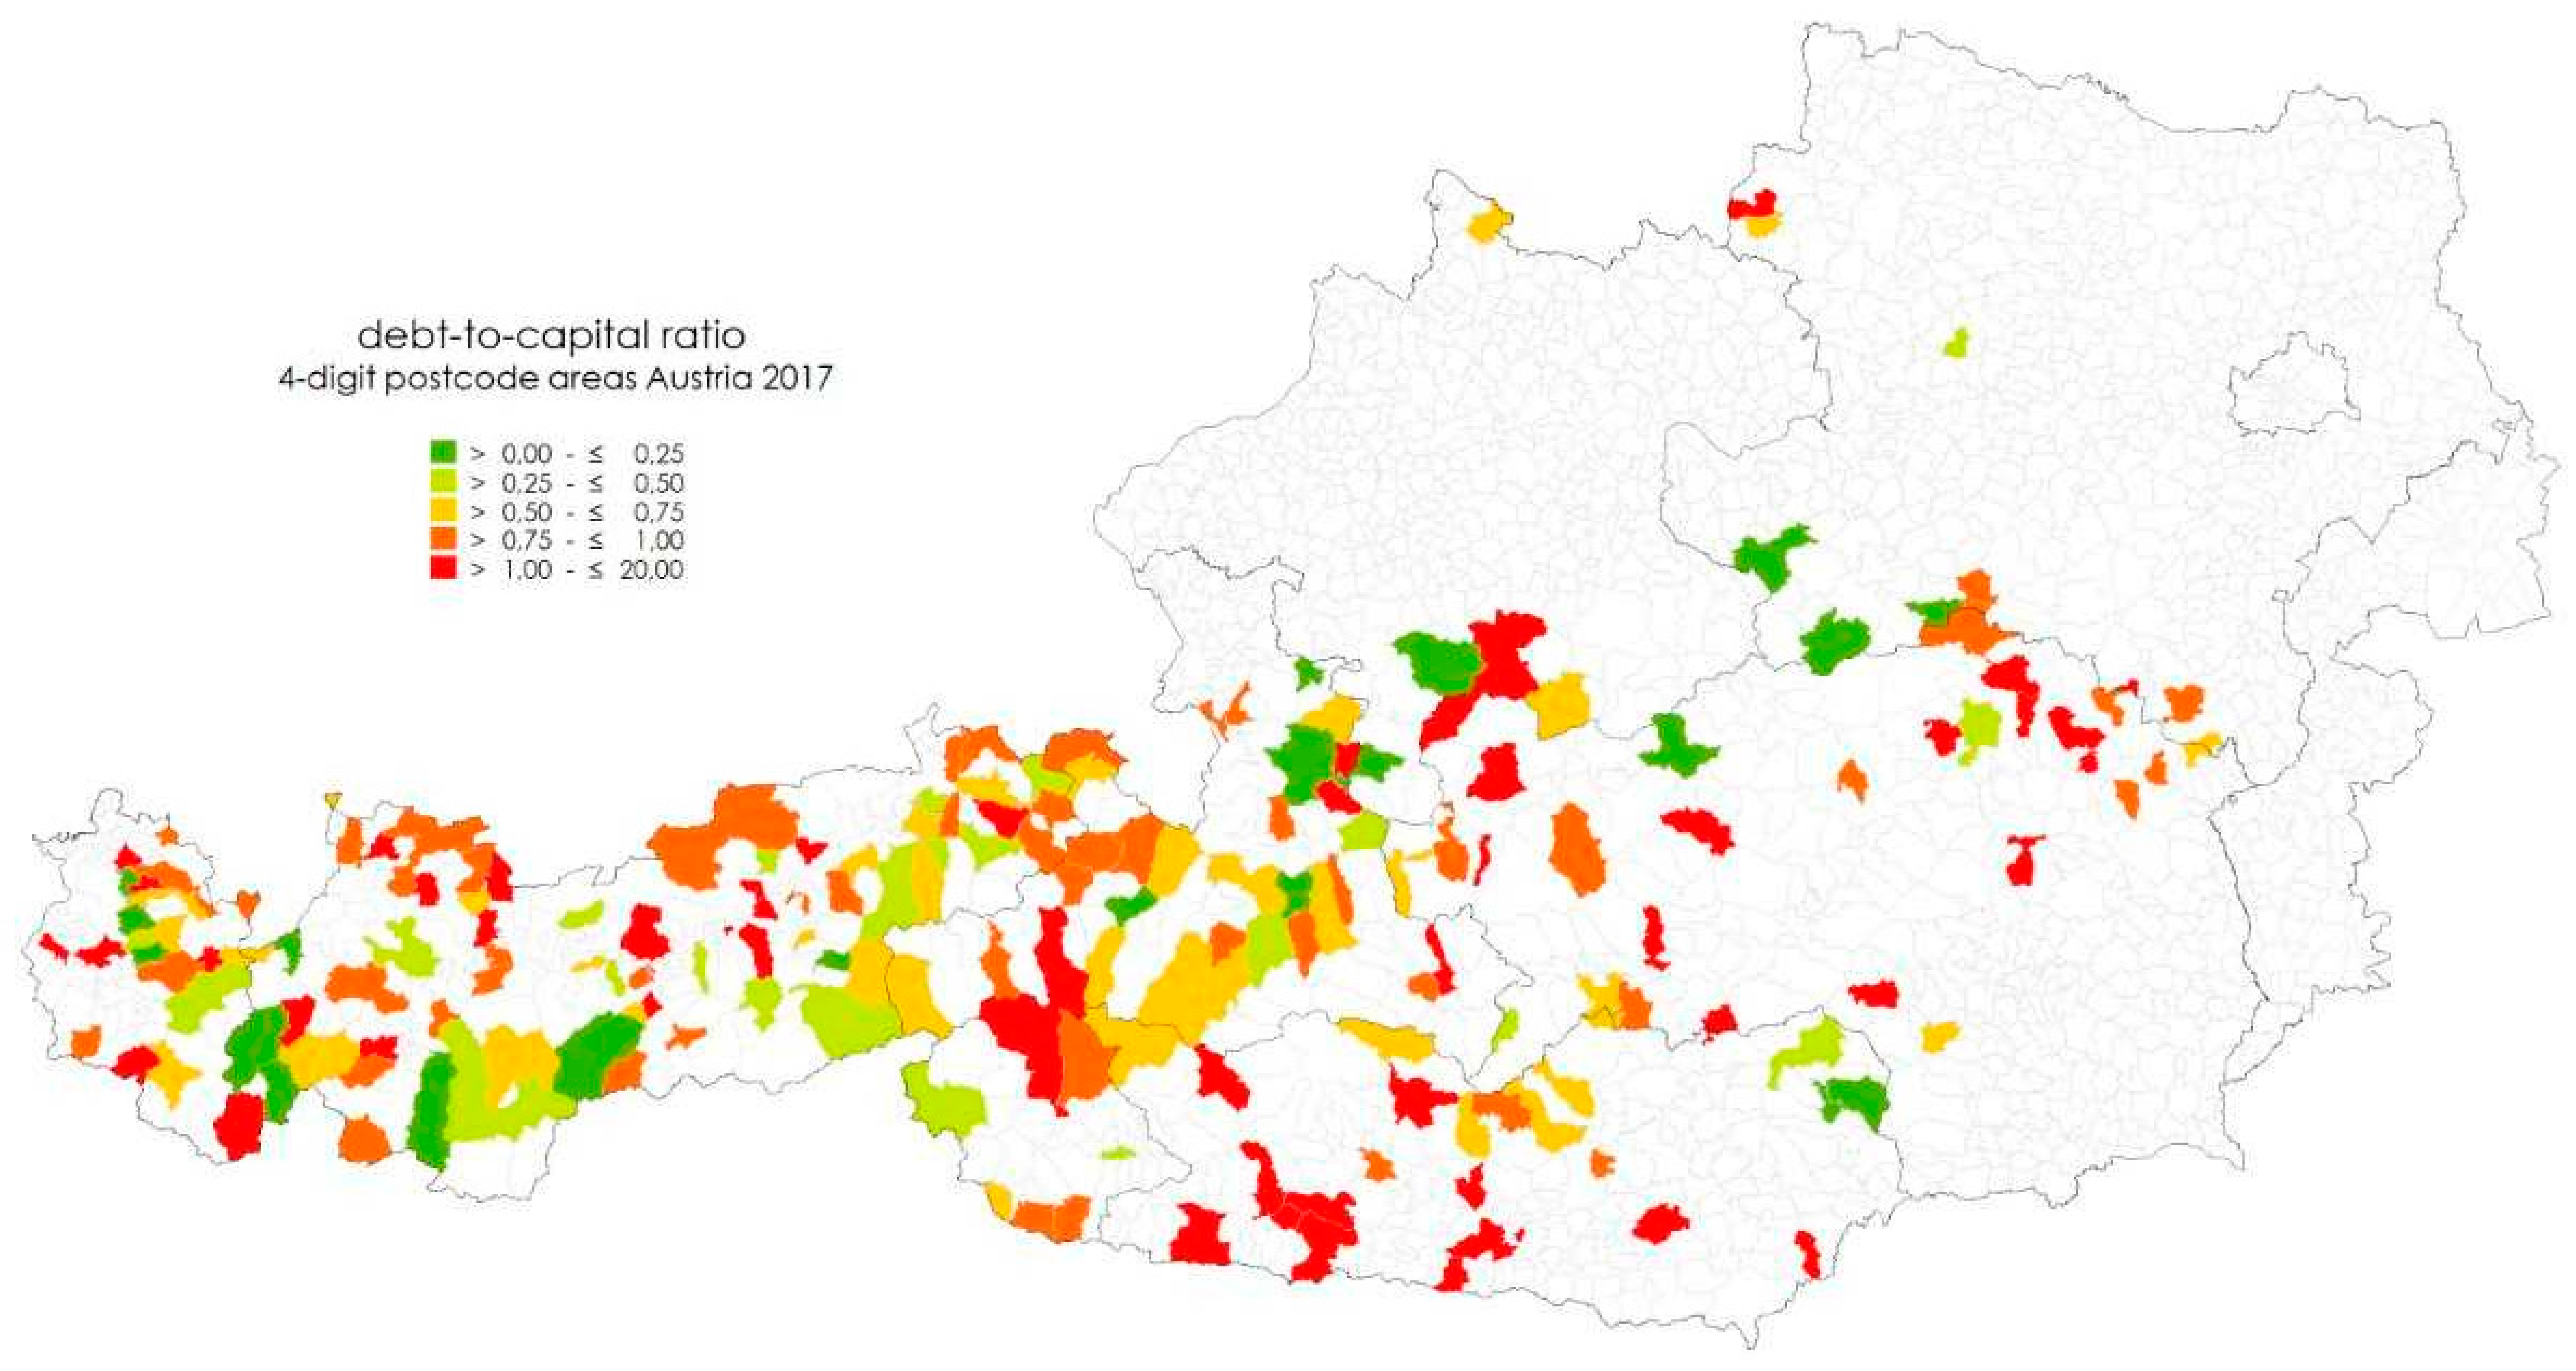
Figure A1 in the Appendix shows the spatial pattern of the debt-to-capital ratio of ski lift operators. About one-fourth of the operators exhibit negative equity. Clusters of low debt ratios can be observed particularly in the West. Table 2 shows that the debt-to-capital ratio is largest for ski areas with a maximum elevation of the ski area between 1350 and 1700 m above sea level and lowest for those at 2250 m or higher. The difference in the median across the two groups is about 30 percentage points. In addition, the debt ratio is twice the size for smaller operators than for the larger ones, measured as the median value (1.22 versus 0.61). Operators with a neighbor nearby (within 15 km road distance) have a lower debt ratio (median of 0.83 versus 0.69). Ski lift operators located in the federal states Carinthia and Styria have the highest debt-to-capital ratio, while Upper Austria, Lower Austria, and Salzburg exhibit the lowest ones. Besides the debt-to-capital ratio, Table 2 contains the percentage of operators with negative equity capital. The percentage of ski lift operators with a negative equity position is largest among small ski lift operators with 45% and lowest among the largest ones with 12%. This large proportion of small companies with a negative equity position is in line with the work of Singh and Schmidgall [5], in which it is shown that the group of smallest hotels (assets under $500,000) has a negative equity position on average. In addition, the percentage of operators with a negative equity position is highest among low lying ski areas and higher for operators in remote areas. The descriptive statistics already indicate that the debt ratio and the equity position vary greatly across characteristics of the operators and location-specific factors.
4.2. Estimations
The results obtained from the MM robust regression method reveal that the debt-to-capital ratio depends significantly on size of the ski area, maximum elevation, presence of a neighboring ski area, number of beds in accommodation establishments relative to size, share of foreign overnight stays, and region of the operators (Table 3). However, the significance and magnitude of these factors differ between eastern and western Austria. Geographical proximity is of great importance to operators. The debt ratio of companies with neighbors in the vicinity is between 21 and 18 percentage points lower than that of companies without nearby neighbors. Therefore, Hypothesis 1 cannot be rejected. The finding that a co-location matters for the debt ratio is a new finding in the financial literature that relates to hospitality and leisure businesses.
Size, measured as length of slopes, is highly significant for the smaller sample of eastern Austrian operators. Here, medium and large ski lift operators have a between 41- and 52-percentage-point lower debt ratio than the group of the smallest operators with length of slopes of 9 km or less. Elevation is not significant for the sample of eastern Austrian resorts except for operators in the highest elevation category, but is highly relevant for the sample of western European operators. Here, ski operators with the highest lift stations of between 1700 and 1900 m above sea level have a 42-percentage-point lower debt ratio as compared with the reference category consisting of ski areas below 1350 m above sea level. In the sample of western Austrian ski resorts, ski areas in the highest elevation category (2250 m above sea level or higher) have the lowest debt ratio. Surprisingly, for the smaller subsample of eastern Austria, the highest elevation category is significantly positive. However, this should be interpreted with caution because this category consists of only four operators. Overall, neither of Hypotheses 2 or 3 can be rejected.
In addition, not only the co-location but also the region in which the operator is located plays a role. Ski operators located in Styria (province in South East Austria) have a 30-percentage-point higher debt ratio on average than the reference category, Tyrol if controlled for the different characteristics such as size, elevation and presence of neighbors. For the other federal states, the debt ratios do not differ significantly from the reference category.
Supply of accommodation is a significant determinant of the debt ratio in the sample of eastern Austrian operators, while it is not relevant in the other sample. For the sample of eastern Austrian operators, a 10 percent increase in the number of beds in accommodation establishments relative to size is associated with a reduction of the debt ratio by 1.5 percentage points. The magnitude of the relationship is not large. For the larger subsample, there is a positive relationship between the share of foreign overnight stays and the debt ratio. This indicates that a large concentration of foreign tourists is a financial risk for the operators. For the eastern Austrian resorts, we find the opposite result; however, the coefficient is only significant at the 10 percent level.
Several robustness checks have been performed. For instance, the debt ratio equation is re-estimated by OLS and compared with the MM robust regression estimators. The results show that elevation and proximity to a neighboring ski area are no longer significant, which is probably because of outliers. In addition, the standard Huber robust regression method is used. Coefficients are quite similar, but standard errors are much higher (all results are available upon request). Note that standard goodness-of-fit measures such as R2 are not calculated because they are difficult to interpret in the case of observations that are down weighted.
5. Discussion and Conclusions
The aim of this study was to identify determinants relevant for differences in debt-to equity ratios among ski lift companies in Austria. Excessive debts are a risk for business operations and an indication of financial distress. This is not compatible with long term economically sustainable business operations. A special emphasis was put on the importance of location-specific factors that have been neglected in previous studies. Using the total population of operators, the results show that about 23% of companies have a negative equity position and the median debt ratio is around 73%.
Robust regression results show that operators without distant neighbors have significantly higher debt ratios of about 15 percentage points. As neighboring ski areas collaborate with each other in several aspects, this indicates that ski lift operators that are part of a larger ski network have lower debt ratios. In addition, the debt ratio is significantly higher for smaller and low elevation ski areas. The difference in the debt ratio between low-lying and high-elevation on one hand and between small and large ones on the other hand is very high and amounts to up to 40 percentage points. The higher debt ratio of small operators is likely related to that fact that smaller ski resorts are more vulnerable to extraordinarily mild winter seasons [29]. For ski areas in Ontario, Rutty et al. [70] finds that small resorts experience the greatest loss in season length during an extremely warm winter season. In addition, there is little difference in the debt ratio between medium-sized and large ski areas. The finding that size and elevation is relevant for debts is in line with studies on their importance in determining survival [30,48] or performance [29]. Higher elevation, and thus more favorable climatic conditions, brings less snowmaking costs, which may add up to 20% of total costs in lower lying ski areas [71]. Larger ski area size leads to higher economies of scale and allows higher lift ticket prices as size is among the most important factors for destination choice [72].
Another significant location-specific determinant is the federal state in which the ski area is located. Ski operators located in Styria (province in South East Austria) have a 30-percentage-point higher debt ratio as compared with the reference category, Tyrol, on average. One reason for these differences in the debt ratio could be the degree of state participation in the companies, which varies across federal states. Furthermore, ski areas with a ten-percentage-point higher share of foreign tourist overnight stays have a 5-percentage-points higher debt ratio in the total sample. One possible explanation for this relationship is that to be visible and competitive on the international market, higher comfort levels (e.g., modern ski lifts), infrastructure (e.g., high snowmaking capacity), and service quality (e.g., better trained and costly staff) in general are required to attract tourists that choose their destination from a large number of ski areas. These higher standards are associated with higher investments and costs, which might lead to higher debt ratios.
Several managerial implications can be drawn from the results. Understanding the determinants of debts is of great relevance for managers and stakeholders. Size and elevation are key predictors of debt ratio. This implies that small and low elevation ski lift operators also have a higher failure risk, as debt ratio and firm survival are highly correlated. This, in turn, might lead to concentration of high elevation and large operators. The detected trend towards larger and higher elevated ski resorts [73] together with a high concentration of ski resorts, especially in western Austria, has led to concerns about the carrying capacity of sensitive high alpine environments and is subject to public debate. As size and elevation are significant components of debt-to-capital ratio, it is to be expected that the pressure on un- or underdeveloped space will increase.
Presence of a neighboring ski area within 15 km road distance was identified as another significant factor. While both elevation and location can hardly be changed, size can be altered by possible lift linkages with the neighboring ski areas. However, this is only possible for those who have neighbors nearby. For those who have no neighbors and are also small and low, the debt level is high and that makes it difficult to get loans for new investments. These ski resorts must come up with a new strategy.
These results also contain some aspects for society. First and foremost, ski tourism represents the backbone of the economy in many rural valleys in Austria. Therefore, the regional economy and living standards are heavily dependent on the performance of this sector. Second, public authorities are involved in this sector by granting investment subsidies or even by public ownership. Deteriorating conditions (e.g., stagnating demand, increased competitive pressure, climate change) might increase the pressure on government support. An urgent question is how many and which ski resorts in the future can and should be supported by the authorities. Last, but not least, the identified determinants point to a further concentration of ski tourism at higher elevations. Thus, in order to sustain economic sustainability of this sector, environmental sustainability in favorable locations will increasingly be a challenge for operator, society, and politics.
Despite the promising and novel results on determinants of the capital structure of ski lift operators, the study suffers from some limitations that hamper the comparability with studies for other tourism and hospitality industries. First, there are several factors that could not be considered because of the lack of data. Small firms do not have to provide a profit and loss account. Thus, the impact of growth opportunities and profitability could not be examined in the study. Another limitation is the cross-sectional approach. It would be preferable to use longitudinal data. However, the main factors such as size, elevation, and presence of neighboring ski resorts are time-independent or barely change over time. Panel data is helpful in studying the impact of climate variability on the debt ratio. The increase in the snow-poor winter seasons in recent years could lead to an increase in the debt ratio of ski lift operators in low elevations. However, this requires data for a longer period. The comparison of the debt ratio before and after the economic and financial crisis is also worth investigating. One main result of the study is that co-location is associated with a lower debt ratio. It might well be the case that these agglomeration benefits differ with respect to the type of operator (price segment, product differentiation), as is shown for hotels [74]. Another idea for future work is to account for the spatial dependence by including the spatial lag of the debt ratio of the neighboring ski area. However, this requires similar balance sheet data for the neighboring countries, that is, Switzerland and Italy.
Author Contributions
Each author contributed 50 percent to the manuscript. Conceptualization, each 50 percent; Methodology and specification, M.F. (60 percent) and R.S. (40 percent); Writing—review & editing, M.F. (40 percent) and R.S. (60 percent).
Funding
This research received no external funding.
Acknowledgments
The authors would like to thank Eva Hagsten, Markku Vieru, and the participants of the 3rd World Research Summit for Tourism and Hospitality in Orlando 2015 and the ASTRES conference in Grenoble 2017 for helpful comments on earlier version. The authors would also like to thank Caroline Wigerstad and Tess Landon for careful proofreading of the manuscript, as well as Dietmar Weinberger for creation of Figure A1.
Conflicts of Interest
The authors declare no conflict of interest. The funders had no role in the design of the study; in the collection, analyses, or interpretation of data; in the writing of the manuscript; and in the decision to publish the results.
Appendix A
Figure A1.
Debt-to-capital ratio in 2013 across municipalities (mean). Note: Measured as four-digit postal codes. Source: Balance sheet data.
Figure A1.
Debt-to-capital ratio in 2013 across municipalities (mean). Note: Measured as four-digit postal codes. Source: Balance sheet data.

References
- Dyllick, T.; Hockerts, K. Beyond the business case for corporate sustainability. Bus. Strategy Environ. 2002, 11, 130–141. [Google Scholar] [CrossRef]
- Ohlson, J.A. Financial ratios and the probabilistic prediction of bankruptcy. J. Account. Res. 1980, 109–131. [Google Scholar] [CrossRef]
- Altman, E.I. Financial ratios, discriminant analysis and the prediction of corporate bankruptcy. J. Financ. 1968, 23, 589–609. [Google Scholar] [CrossRef]
- Myers, S.C.; Majluf, N.S. Corporate financing and investment decisions when firms have information that investors do not have. J. Financ. Econ. 1984, 13, 187–221. [Google Scholar] [CrossRef]
- Singh, A.J.; Schmidgall, R.S. Does financial performance depend on hotel size? Analysis of the financial profile of the US lodging industry. FIU Hosp. Rev. 2013, 30, 239–256. [Google Scholar]
- Kizildag, M. Financial leverage phenomenon in hospitality industry sub-sector portfolios. Int. J. Contemp. Hosp. Manag. 2015, 27, 1949–1978. [Google Scholar] [CrossRef]
- Kim, W.G. The determinants of capital structure choice in the US restaurant industry. Tour. Econ. 1997, 3, 329–340. [Google Scholar] [CrossRef]
- Frank, M.Z.; Goyal, V.K. Capital structure decisions: Which factors are reliably important? Financ. Manag. 2009, 38, 1–37. [Google Scholar] [CrossRef]
- Sheel, A. Determinants of capital structure choice and empirics on leverage behavior: A comparative analysis of hotel and manufacturing firms. Hosp. Res. J. 1994, 17, 1–16. [Google Scholar] [CrossRef]
- Madan, K. An analysis of the debt-equity structure of leading hotel chains in India. Int. J. Contemp. Hosp. Manag. 2007, 19, 397–414. [Google Scholar] [CrossRef]
- Tang, C.H.H.; Jang, S.S. Revisit to the determinants of capital structure: A comparison between lodging firms and software firms. Int. J. Contemp. Hosp. Manag. 2007, 26, 175–187. [Google Scholar] [CrossRef]
- Dalbor, M.C.; Upneja, A. The investment opportunity set and the long-term debt decision of US lodging firms. J. Hosp. Tour. Res. 2004, 28, 346–355. [Google Scholar] [CrossRef]
- Devesa, M.J.S.; Esteban, L.P.; Martínez, A.G. The financial structure of the Spanish hotel industry: Evidence from cluster analysis. Tour. Econ. 2009, 15, 121–138. [Google Scholar] [CrossRef]
- Karadeniz, E.; Yilmaz Kandir, S.; Balcilar, M.; Beyazit Onal, Y. Determinants of capital structure: Evidence from Turkish lodging companies. Int. J. Contemp. Hosp. Manag. 2009, 21, 594–609. [Google Scholar] [CrossRef]
- Devesa, M.; Esteban, L. Spanish hotel industry: Indebtedness determinants. Appl. Econ. 2011, 43, 4227–4238. [Google Scholar] [CrossRef]
- Serrasqueiro, Z.; Nunes, P.M. Financing behaviour of Portuguese SMEs in hotel industry. Int. J. Hosp. Manag. 2014, 43, 98–107. [Google Scholar] [CrossRef]
- Nunes, P.M.; Serrasqueiro, Z. Short-term debt and long-term debt determinants in small and medium-sized hospitality firms. Tour. Econ. 2017, 23, 543–560. [Google Scholar] [CrossRef]
- Pacheco, L.; Tavares, F. Capital structure determinants of hospitality sector SMEs. Tour. Econ. 2017, 23, 113–132. [Google Scholar] [CrossRef]
- Upneja, A.; Dalbor, M.C. An examination of capital structure in the restaurant industry. Int. J. Contemp. Hosp. Manag. 2001, 13, 54–59. [Google Scholar] [CrossRef] [Green Version]
- Kim, W.G.; Ayoun, B. Ratio analysis for the hospitality industry: A cross sector comparison of financial trends in the lodging, restaurant, airline, and amusement sectors. J. Hosp. Financ. Manag. 2005, 13, 59–78. [Google Scholar] [CrossRef]
- Steiger, R.; Scott, D.; Abegg, B.; Pons, M.; Aall, C. A critical review of climate change risk for ski tourism. Curr. Issues Tour. 2017, 1–37. [Google Scholar] [CrossRef]
- Brida, J.G.; Deidda, M.; Pulina, M. Tourism and transport systems in mountain environments: Analysis of the economic efficiency of cableways in South Tyrol. J. Transp. Geogr. 2014, 36, 1–11. [Google Scholar] [CrossRef]
- Roberts, S.; Tribe, J. Sustainability indicators for small tourism enterprises—An exploratory perspective. J. Sustain. Tour. 2008, 16, 575–594. [Google Scholar] [CrossRef]
- Mueller, D.C.; Cubbin, J. (Eds.) The Dynamics of Company Profits; Cambridge University Press: Cambridge, UK, 2005. [Google Scholar]
- Baum, J.A.; Mezias, S.J. Localized competition and organizational failure in the Manhattan hotel industry. 1898–1990. Adm. Sci. Q. 1992, 37, 580–604. [Google Scholar] [CrossRef]
- Sainaghi, R. RevPAR determinants of individual hotels: Evidences from Milan. Int. J. Contemp. Hosp. Manag. 2011, 23, 297–311. [Google Scholar] [CrossRef]
- Chung, W.; Kalnins, A. Agglomeration effects and performance: A test of the Texas lodging industry. Strateg. Manag. J. 2001, 22, 969–988. [Google Scholar] [CrossRef]
- Yang, Y.; Luo, H.; Law, R. Theoretical, empirical, and operational models in hotel location research. Int. J. Hosp. Manag. 2014, 36, 209–220. [Google Scholar] [CrossRef]
- Steiger, R. The impact of snow scarcity on ski tourism. An analysis of the record warm season 2006/07 in Tyrol (Austria). Tour. Rev. 2011, 66, 4–13. [Google Scholar] [CrossRef]
- Falk, M. A survival analysis of ski lift companies. Tour. Manag. 2013, 36, 377–390. [Google Scholar] [CrossRef]
- Marshall, A. Industry and Trade: A Study of Industrial Technique and Business Organization; and of Their Influences on the Conditions of Various Classes and Nations; Macmillan: London, UK, 1920. [Google Scholar]
- Fischer, J.H.; Harrington, J.E., Jr. Product variety and firm agglomeration. RAND J. Econ. 1996, 281–309. [Google Scholar] [CrossRef]
- Kalnins, A.; Chung, W. Resource-seeking agglomeration: A study of market entry in the lodging industry. Strateg. Manag. J. 2004, 25, 689–699. [Google Scholar] [CrossRef]
- Appold, S.J. Agglomeration, interorganizational networks, and competitive performance in the US metalworking sector. Econ. Geogr. 1995, 71, 27–54. [Google Scholar] [CrossRef]
- Baum, J.A.; Haveman, H.A. Love thy neighbor? Differentiation and agglomeration in the Manhattan hotel industry 1898–1990. Adm. Sci. Q. 1997, 42, 304–338. [Google Scholar] [CrossRef]
- Canina, L.; Enz, C.A.; Harrison, J.S. Agglomeration effects and strategic orientations: Evidence from the US lodging industry. Acad. Manag. J. 2005, 48, 565–581. [Google Scholar] [CrossRef]
- Peiró-Signes, A.; Segarra-Oña, M.D.V.; Miret-Pastor, L.; Verma, R. The effect of tourism clusters on US hotel performance. Cornell Hosp. Q. 2015, 56, 155–167. [Google Scholar] [CrossRef]
- Marco-Lajara, B.; Claver-Cortés, E.; Úbeda-García, M.; Zaragoza-Sáez, P.D.C. Hotel performance and agglomeration of tourist districts. Reg. Stud. 2016, 50, 1016–1035. [Google Scholar] [CrossRef]
- Firgo, M.; Kügler, A. Cooperative pricing in spatially differentiated markets. Reg. Sci. Urban Econ. 2018. [Google Scholar] [CrossRef]
- Myers, S.C. The capital structure puzzle. J. Financ. 1984, 39, 574–592. [Google Scholar] [CrossRef]
- Bark, R.H.; Colby, B.G.; Dominguez, F. Snow days? Snowmaking adaptation and the future of low latitude, high elevation skiing in Arizona, USA. Clim. Chang. 2010, 102, 467–491. [Google Scholar] [CrossRef]
- Gonseth, C. Impact of snow variability on the Swiss winter tourism sector: Implications in an era of climate change. Clim. Chang. 2013, 119, 307–320. [Google Scholar] [CrossRef]
- Pickering, C. Changes in demand for tourism with climate change: A case study of visitation patterns to six ski resorts in Australia. J. Sustain. Tour. 2011, 19, 767–781. [Google Scholar] [CrossRef]
- Scott, D.; McBoyle, G. Climate change adaptation in the ski industry. Mitigat. Adapt. Strateg. Glob. Chang. 2007, 12, 1411–1431. [Google Scholar] [CrossRef]
- Hamilton, L.C.; Rohall, D.E.; Hayward, G.F.; Keim, B.D. Warming winters and New Hampshire’s lost ski areas: An integrated case study. Int. J. Sociol. Soc. Policy 2003, 23, 52–73. [Google Scholar] [CrossRef]
- Steiger, R.; Abegg, B. The Sensitivity of Austrian Ski Areas to Climate Change. Tour. Plan. Dev. 2013, 10, 480–493. [Google Scholar] [CrossRef]
- Williamson, O.E. Hierarchical control and optimum firm size. J. Polit. Econ. 1967, 75, 123–138. [Google Scholar] [CrossRef]
- Beaudin, L.; Huang, J.-C. Weather conditions and outdoor recreation: A study of New England ski areas. Ecol. Econ. 2014, 106, 56–68. [Google Scholar] [CrossRef]
- Dalbor, M.C.; Upneja, A. Factors affecting the long-term debt decision of restaurant firms. J. Hosp. Tour. Res. 2002, 26, 422–432. [Google Scholar] [CrossRef]
- Dalbor, M.C.; Kim, A.; Upneja, A. An initial investigation of firm size and debt use by small restaurant firms. J. Hosp. Financ. Manag. 2004, 12, 41–48. [Google Scholar] [CrossRef]
- Harris, M.; Raviv, A. The theory of capital structure. J. Financ. 1991, 46, 297–355. [Google Scholar] [CrossRef]
- Myers, S.C. Capital structure. J. Econ. Perspect. 2001, 15, 81–102. [Google Scholar] [CrossRef]
- Marsh, P. The choice between equity and debt: An empirical study. J. Financ. 1982, 37, 121–144. [Google Scholar] [CrossRef]
- Chang, S.J.; Hong, J. Economic performance of group-affiliated companies in Korea: Intragroup resource sharing and internal business transactions. Acad. Manag. J. 2000, 43, 429–448. [Google Scholar] [CrossRef]
- Lee, S.H.; Peng, M.W.; Barney, J.B. Bankruptcy law and entrepreneurship development: A real options perspective. Acad. Manag. Rev. 2007, 32, 257–272. [Google Scholar] [CrossRef]
- Kim, H.; Gu, Z. Predicting restaurant bankruptcy: A logit model in comparison with a discriminant model. J. Hosp. Tour. Res. 2006, 30, 474–493. [Google Scholar] [CrossRef]
- White, G.L.; Sondh, A.C.; Fried, D. Analysis of Financial Statement Analysis; John Wiley & Sons: New York, NY, USA, 2005. [Google Scholar]
- Welch, I. Capital structure and stock returns. J. Polit. Econ. 2004, 112, 106–132. [Google Scholar] [CrossRef]
- Varaiya, N.; Kerin, R.A.; Weeks, D. The relationship between growth, profitability, and firm value. Strateg. Manag. J. 1987, 8, 487–497. [Google Scholar] [CrossRef]
- Myers, S.C. Determinants of corporate borrowing. J. Financ. Econ. 1977, 5, 147–175. [Google Scholar] [CrossRef]
- Barth, M.E.; Beaver, W.H.; Landsman, W.R. Relative valuation roles of equity book value and net income as a function of financial health. J. Account. Econ. 1998, 25, 1–34. [Google Scholar] [CrossRef]
- Rajan, R.G.; Zingales, L. What do we know about capital structure? Some evidence from international data. J. Financ. 1995, 50, 1421–1460. [Google Scholar] [CrossRef]
- Leroy, A.M.; Rousseeuw, P.J. Robust Regression and Outlier Detection; Wiley Series in Probability and Mathematical Statistics; Wiley: New York, NY, USA, 1987. [Google Scholar]
- Cassar, G. The financing of business start-ups. J. Bus. Ventur. 2004, 19, 261–283. [Google Scholar] [CrossRef]
- Farčnik, D.; Kuščer, K.; Trobec, D. Indebtedness of the tourism sector in Mediterranean countries. Tour. Econ. 2015, 21, 141–157. [Google Scholar] [CrossRef]
- Huber, P. Robust Estimation of a Location Parameter. Ann. Math. Stat. 1964, 35, 73–101. [Google Scholar] [CrossRef]
- Verardi, V.; Croux, C. Robust regression in Stata. Stata J. 2009, 9, 439–453. [Google Scholar] [CrossRef]
- Yohai, V. High Breakdown-point and High Efficiency Estimates for Regression. Ann. Stat. 1987, 15, 642–665. [Google Scholar] [CrossRef]
- Giroud, X.; Mueller, H.M.; Stomper, A.; Westerkamp, A. Snow and leverage. Rev. Financ. Stud. 2011, 25, 680–710. [Google Scholar] [CrossRef]
- Rutty, M.; Scott, D.; Johnson, P.; Pons, M.; Steiger, R.; Vilella, M. Using ski industry response to climatic variability to assess climate change risk: An analogue study in Eastern Canada. Tour. Manag. 2017, 58, 196–204. [Google Scholar] [CrossRef]
- Steiger, R. The impact of climate change on ski season length and snowmaking requirements. Clim. Res. 2010, 43, 251–262. [Google Scholar] [CrossRef]
- Partel, M. Best Ski Resort Report 2012; Mountain Management: Ruggell, Liechtenstein, 2012. [Google Scholar]
- Falk, M. Gains from horizontal collaboration among ski areas. Tour. Manag. 2017, 60, 92–104. [Google Scholar] [CrossRef]
- Freedman, M.L.; Kosová, R. Agglomeration, product heterogeneity and firm entry. J. Econ. Geogr. 2011, 12, 601–626. [Google Scholar] [CrossRef]
Figure 1.
Distribution of the debt-to-capital ratio. Note: Annual reports.


Table 1.
Descriptive statistics.
| Mean | Std. Dev. | Min | Max | |
|---|---|---|---|---|
| Debt-to-capital ratio in 2013 in % | 1.01 | 1.31 | 0.00 | 10.0 |
| Distance to nearest agglomeration in km | 66.28 | 28.55 | 6.80 | 148.0 |
| Number of beds per km of ski-runs (#) | 123.38 | 331.70 | 4.47 | 4664 |
| Share of foreign overnight stays | 0.771 | 0.238 | 0.005 | 0.998 |
| Dummy variables: | ||||
| Presence of neighbor within 15 km | 0.669 | |||
| Size (length of slopes, X, in km): | ||||
| <10 km | 0.129 | |||
| 10 ≤ X ≤ 25 km | 0.302 | |||
| 25 ≤ X = 75 km | 0.242 | |||
| X ≥ 75 km | 0.327 | |||
| Max elevation (E): | ||||
| <1350 m | 0.093 | |||
| 1350 m ≥ E < 1700 m | 0.137 | |||
| 1700 m ≥ E < 1900 m | 0.202 | |||
| 1900 m ≥ E < 2250 m | 0.286 | |||
| E ≥ 2250 m | 0.282 | |||
| Federal state: | ||||
| Carinthia | 0.093 | |||
| Upper Austria | 0.044 | |||
| Lower Austria | 0.020 | |||
| Salzburg province | 0.206 | |||
| Styria | 0.133 | |||
| Tyrol | 0.379 | |||
| Vorarlberg | 0.125 |
Table 2.
Debt-to-capital ratio for different types of operators.
| Debt-To-Capital Ratio in 2013 | Negative Equity Position in 2013 | ||
|---|---|---|---|
| Mean | Median | Mean | |
| Maximum Elevation, E, in meters a.s.l (m) | |||
| <1350 m | 1.276 | 0.916 | 0.300 |
| 1350 m ≥ E < 1700 m | 1.439 | 0.949 | 0.386 |
| 1700 m ≥ E < 1900 m | 1.045 | 0.664 | 0.196 |
| 1900 m ≥ E < 2250 m | 0.919 | 0.768 | 0.191 |
| E ≥ 2250 m | 0.566 | 0.558 | 0.138 |
| Federal states | |||
| Carinthia | 1.676 | 0.967 | 0.500 |
| Lower Austria | 0.603 | 0.514 | 0.182 |
| Upper Austria | 0.667 | 0.661 | 0.200 |
| Salzburg province | 0.698 | 0.709 | 0.115 |
| Styria | 1.322 | 0.903 | 0.371 |
| Tyrol | 0.921 | 0.667 | 0.192 |
| Vorarlberg | 1.152 | 0.646 | 0.129 |
| Size (Length of slopes, X, in km) | |||
| <10 km | 1.696 | 1.216 | 0.447 |
| 10 ≤ X ≤ 25 km | 1.207 | 0.784 | 0.253 |
| 25 ≤ X = 75 km | 0.897 | 0.797 | 0.197 |
| X ≥ 75 km | 0.635 | 0.609 | 0.124 |
| Proximity | |||
| No neighbor within 15 km | 1.145 | 0.831 | 0.292 |
| Presence of a neighbor within 15 km | 0.941 | 0.692 | 0.186 |
Table 3.
Determinants of the debt-to-capital ratio in 2013 (MM robust regression estimates).
| (i) | (ii) | (iii) | |||||||
|---|---|---|---|---|---|---|---|---|---|
| Total Sample | Eastern Austria | Western Austria | |||||||
| Coeff. | t-stat | Coeff. | t-stat | Coeff. | t-stat | ||||
| 10 ≤ X ≤ 25 km (ref. cat. <10 km) | −0.237 | −1.07 | −0.405 | *** | −2.87 | −0.042 | −0.22 | ||
| 25 ≤ X = 75 km | −0.162 | −0.68 | −0.515 | *** | −3.17 | 0.034 | 0.18 | ||
| X >=75 km | −0.361 | −1.50 | −0.473 | ** | −2.30 | −0.168 | −0.87 | ||
| 1350 m ≥ E < 1700 m (ref. cat. <1350 m) | −0.163 | −0.78 | 0.066 | 0.49 | −0.297 | −1.41 | |||
| 1700 m ≥ E < 1900 m | −0.310 | * | −1.88 | −0.049 | −0.30 | −0.422 | ** | −2.46 | |
| 1900 m ≥ E < 2250 m | −0.258 | −1.59 | 0.076 | 0.55 | −0.449 | *** | −2.69 | ||
| E ≥ 2250 m | −0.304 | * | −1.73 | 0.477 | *** | 2.66 | −0.483 | *** | −2.74 |
| Presence of neighbor within 15 km | −0.145 | ** | −2.46 | −0.213 | *** | −2.78 | −0.177 | ** | −2.37 |
| ln distance to nearest agglomeration | −0.010 | −0.13 | −0.447 | *** | −5.29 | 0.038 | 0.49 | ||
| ln number of beds per km of ski-runs | −0.067 | * | −1.67 | −0.147 | *** | −3.15 | −0.064 | −1.47 | |
| Share of foreign overnight stays | 0.491 | ** | 2.07 | −0.275 | * | −1.71 | 0.755 | *** | 2.63 |
| Federal states (ref Tyrol specification (i) and (iii)) | |||||||||
| Carinthia | 0.192 | 1.35 | −0.549 | *** | −5.20 | ||||
| Upper Austria | −0.258 | −1.17 | −0.877 | *** | −5.54 | ||||
| Lower Austria | −0.092 | −0.50 | −0.534 | *** | −4.37 | ||||
| Salzburg province | 0.113 | 1.55 | 0.145 | * | 1.92 | ||||
| Styria (ref specification (ii)) | 0.300 | ** | 2.56 | ||||||
| Vorarlberg | −0.055 | -0.58 | −0.020 | −0.19 | |||||
| Constant | 1.148 | *** | 2.77 | 4.064 | *** | 7.53 | 0.694 | ** | 2.15 |
| Number of observations | 248 | 72 | 176 | ||||||
Note: Asterisks ***, **, and * denotes significance at the 1, 5, and 10 percent levels. The dependent variable is the debt ratio calculated as the total debts divided by the sum of total debts and total equity in 2013. X and E denote size and elevation, respectively. The STATA command mmregress is used to estimate the debt ratio equation.
© 2018 by the authors. Licensee MDPI, Basel, Switzerland. This article is an open access article distributed under the terms and conditions of the Creative Commons Attribution (CC BY) license (http://creativecommons.org/licenses/by/4.0/).
Share and Cite
MDPI and ACS Style
Falk, M.; Steiger, R. An Exploration of the Debt Ratio of Ski Lift Operators. Sustainability 2018, 10, 2985. https://doi.org/10.3390/su10092985
AMA Style
Falk M, Steiger R. An Exploration of the Debt Ratio of Ski Lift Operators. Sustainability. 2018; 10(9):2985. https://doi.org/10.3390/su10092985
Chicago/Turabian StyleFalk, Martin, and Robert Steiger. 2018. "An Exploration of the Debt Ratio of Ski Lift Operators" Sustainability 10, no. 9: 2985. https://doi.org/10.3390/su10092985
Note that from the first issue of 2016, this journal uses article numbers instead of page numbers. See further details here.