Article

Below-Ground Interspecific Competition of Apple (Malus pumila M.)–Soybean (Glycine max L. Merr.) Intercropping Systems Based on Niche Overlap on the Loess Plateau of China

1
College of Water and Soil Conservation, Beijing Forestry University, Beijing 100083, China
2
Ji County Station, Chinese National Ecosystem Research Network (CNERN), Beijing 100083, China
3
Beijing Collaborative Innovation Center for Eco-environmental Improvement with Forestry and Fruit Trees, Beijing 102206, China
4
Key Laboratory of State Forestry Administration on Soil and Water Conservation, Beijing Forestry University, Beijing 100083, China
5
Beijing Engineering Research Center of Soil and Water Conservation, Beijing Forestry University, Beijing 100083, China
6
Engineering Research Center of Forestry Ecological Engineering, Ministry of Education, Beijing Forestry University, Beijing 100083, China
7
College of Resources and Environmental Sciences, China Agricultural University, Beijing 100094, China
*
Author to whom correspondence should be addressed.
Sustainability 2018, 10(9), 3022; https://doi.org/10.3390/su10093022
Submission received: 31 July 2018 / Revised: 12 August 2018 / Accepted: 20 August 2018 / Published: 24 August 2018
(This article belongs to the Section Environmental Sustainability and Applications)

Abstract

:
To provide a scientific basis and technical support for agroforestry management practices, such as interrow configuration and soil water and fertilizer management, a stratified excavation method was performed both to explore the fine-root spatial distribution and niche differentiation and to quantify the below-ground interspecific competition status of 3-, 5-, and 7-year-old apple (Malus pumila M.)–soybean (Glycine max L. Merr.) intercropping systems and monocropping systems. The fine roots of older trees occupied a larger soil space and had both a greater fine-root biomass density (FRMD) and a greater ability to reduce the FRMD of soybean, but this ability decreased with the distance from the apple tree row. Similarly, the FRMD of apple trees was also adversely affected by soybean plants, but this effect gradually increased with a decrease in tree age or with the distance from the tree row. Compared with that of the 3- and 5-year-old monocropped apple trees, the FRMD of the 3- and 5-year-old intercropped apple trees increased in the 40–100 cm and 60–100 cm soil layers, respectively. However, compared with that of the 7-year-old apple and soybean monocropping systems, the FRMD of the 7-year-old intercropped apple trees and soybean plants decreased in each soil layer. Compared with that of the corresponding monocropped systems, the fine-root vertical barycenter (FRVB) of the intercropped apple trees displaced deeper soil and that of the intercropped soybean plants displaced shallower soil. Furthermore, the FRVB of both intercropped apple trees and intercropped soybean plants displaced shallower soil with increasing tree age. Intense below-ground interspecific competition in the 3-, 5-, and 7-year-old apple–soybean intercropping systems occurred in the 0–40 cm soil layer at distances of 0.5–0.9, 0.5–1.3, and 0.5–1.7 m from the apple tree row, respectively.

1. Introduction

Agroforestry management plays an important role in both alleviating conflicts between forestry and agriculture and improving land productivity. However, these advantages may be offset by competition between trees and crops [1]. Therefore, taking full advantage of trees and crops, minimizing competition among species, and maximizing the use of available resources are key to improving the yield and overall productivity of agroforestry systems [2,3]. Competition between trees and crops for soil water and nutrients in agroforestry systems is often more intense than is competition for light [4,5,6,7]. The spatial distribution and morphology of the roots of trees and crops in an agroforestry system not only determine individual competitive ability to reach below-ground resources [8,9,10], but also constitute the main factor that determines the degree of below-ground competition among species [1].
Because of their morphological and physiological plasticity, the fine roots of trees and crops have the inherent capability to adapt to the spatial heterogeneity of soil water and nutrients in agroforestry systems [3]. Competition between trees and crops species reduces the quantity of fine roots [10,11,12]. Some studies reported that the fine roots of wheat (Triticum aestivum L.) decreased with increasing jujube tree (Zizyphus jujuba Mill.) age [13,14]. In response to below-ground competition for soil water and nutrients, the fine roots of trees move to deeper soil [6,11,15] or shallower soil [13], but the fine roots of crop species move to shallower soil [12,13]. The responses of root niche differentiation to resource availability and/or plant competition constitute the main mechanism used by plant roots to avoid competition [4,16,17]. To reduce competition between trees and crops for below-ground resources, the roots of ideal agroforestry trees are mostly distributed away from the top of the soil profile and instead gather resources from deep soil layers so that the crop species can use the resources that are near the soil surface [18]. However, since the roots of trees always dominate at all soil depths in agroforestry systems, there is no spatial separation between the rooting zones of trees and crops [10]. The niche differentiation of the fine roots of trees and crops ultimately determines the degree of fine-root niche overlap in agroforestry systems. Therefore, it is necessary to understand the niche differentiation of the fine roots of both trees and crop species and to analyze the adaptive tactics of the fine-root niche responses to below-ground interspecific competition in agroforestry intercropping systems. Both the quantity and niche differentiation of the fine roots of each component of an agroforestry system change with increasing tree age. However, no reports exist on the status of niche differentiation in response to increasing tree age.
The degree of overlap of neighboring root systems is particularly interesting when competitive relationships are considered [19]. According to theoretical ecology, competition occurs under conditions of an interspecific insufficient supply of resources and niche overlap [20,21]. Under agroforestry management conditions in which no irrigation is applied in the arid and semi-arid regions of the Loess Plateau of China, water is the main limiting factor for plant growth, and farmland nutrients are often insufficient [22]. Therefore, the competition between trees and crops for soil water and nutrients in intercropping systems in this region is determined mainly by the niche characteristics of their roots [22]. Xu et al. [23] reported that the relative distance of the fine-root vertical barycenter (FRVB) between walnut trees (Juglans regia L.) and soybean plants increased gradually as the distance from the walnut tree row increased in the region. This means that the niche overlap between the fine roots of walnut and soybean decreased with the distance from the walnut tree row and that the below-ground interspecific competition decreased gradually. To the authors’ knowledge, no study has investigated the below-ground competition status in agroforestry systems, especially in response to increasing tree age.
The Loess Plateau is one of the main apple-producing areas in China, and intercropping apple trees with soybean plants, which is an effective way to increase land use efficiency and increase farmers’ economic returns, represents one of the major agroforestry systems in the region. However, the extensive management practices for agroforestry systems lead to intense competition among species for soil water and nutrients, which results in low overall economic efficiency and affects the efficient and sustainable development of agroforestry systems. Therefore, after analyzing the spatial distribution of fine roots both in apple–soybean intercropping systems and their corresponding monocropping systems, it was possible to characterize the niche differentiation of intercropped apple trees and intercropped soybean plants and further quantitatively determine the below-ground competition status among species. The results from this study provide a scientific basis and technical support for management practices, such as interrow configuration and water and fertilizer management practices.

2. Materials and Methods

2.1. Experimental Site

This study was conducted at the Experimental Demonstration Base of Water Resource Saving Agroforestry System (36°01′ N, 110°43′ E) in Ji County, Shanxi Province, China. Ji County lies in a typical hill and gully region of the Loess Plateau; the climate is temperate continental monsoon. The annual precipitation is 521 mm, and the potential evaporation is 1729 mm. The annual mean temperature is 9.9 °C, and the annual cumulative temperature greater than 10 °C is 3358 °C. The mean number of sunlit hours is 2563.8 h, and there are 172 frost-free days. The soil parent material is loess, and the soil is uniform. The soil properties within the 0–100 cm layer are as follows: 1.32 g·cm−3 bulk density, pH = 7.97, 0.81 g·kg−1 total N, 19.7 g·kg−1 available P, 235.7 mg·kg−1 available K, and 13.5 g·kg−1 organic C. The major economic species of trees planted for use in agroforestry systems include apple (Malus pumila M.), walnut (Juglans regia L.), and apricot (Prunus armeniaca L.), and the major intercropped crop species include soybean (Glycine max L. Merr.), peanut (Arachis hypogaea L.), and maize (Zea mays L.). The trees and crops depend mainly on rain as a source of water, and no irrigation was available at any of the experimental areas throughout the year under study.

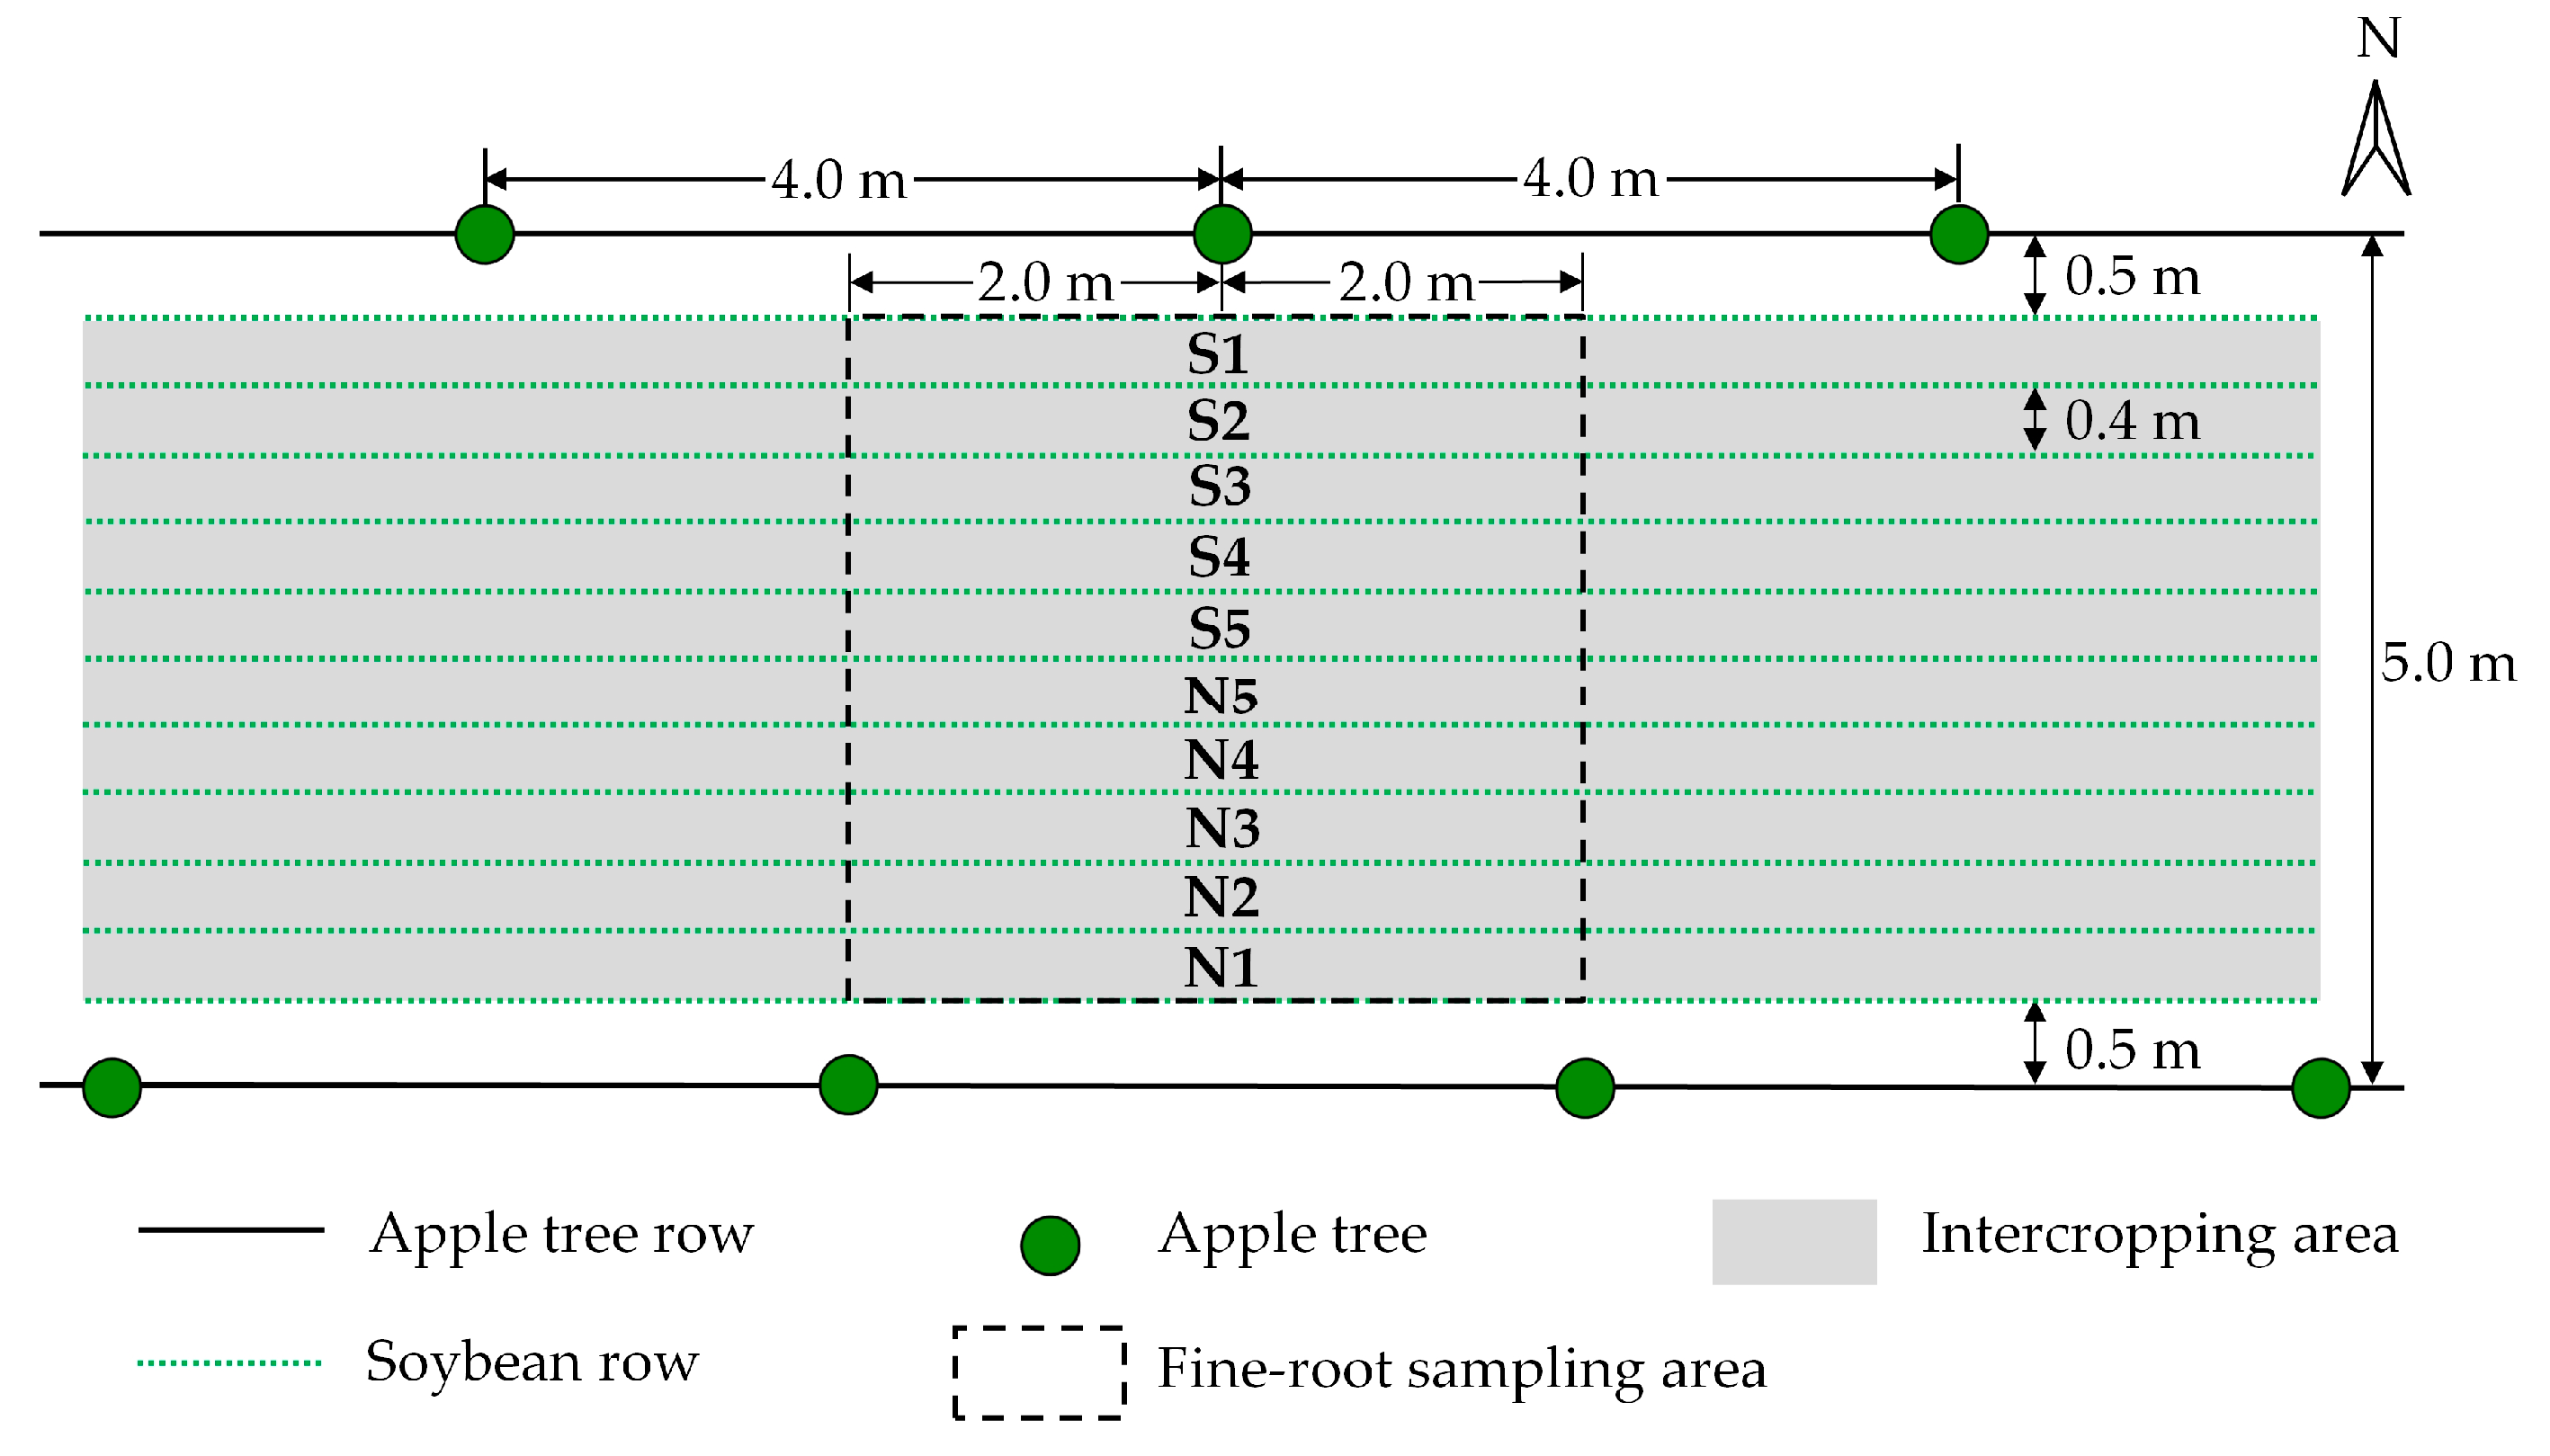
2.2. Materials and Experimental Design

The experiment was conducted in August 2017. There were seven treatments in this study: apple–soybean intercropping systems (the apple trees were 3, 5, or 7 years old), apple monocropping systems (the apples trees were 3, 5, or 7 years old), and soybean monocropping systems. The apple trees were planted at a spacing of 4.0 × 5.0 m in an east-west direction in 2010, 2012, and 2014. In August 2017, the average tree crown width of the 3-, 5-, and 7-year-old apple trees was 1.3, 1.7, and 2.0 m, respectively, and the tree heights were 3.2, 3.6, and 3.7 m, respectively. The intercropped apple trees were continually intercropped with soybean crops, and the monocropped apple trees were not intercropped with any species. The soybean plants were cultivated at a spacing of 0.3 × 0.4 m and were situated 0.5 m from the apple tree row. The monocropped soybean plants were planted on farmland near the apple orchards. The same agricultural management practices were used for all treatments.
The experimental design included three replications per treatment. The apple–soybean intercropping treatments included a 12.0 × 15.0 m plot that consisted of fourteen apple trees intercropped with soybean plants. The monocropped apple tree treatments were the same size (12.0 × 15.0 m) but consisted of only fourteen apple trees; the monocrop soybean treatment was also the same size (12.0 × 15.0 m). The area within 0.5 m of the apple tree row was used for fine-root sampling (4.0 × 4.0 m) in both the apple–soybean intercropping system and the apple tree monocropping system treatments (see Figure 1). The fine-root sampling area was divided into ten equally sized sections denoted as S1, S2, S3, S4, S5, N5, N4, N3, N2, and N1. Among them, S1, S2, S3, S4, and S5 were south of the apple tree row at a distance of 0.5–0.9, 0.9–1.3, 1.3–1.7, 1.7–2.1, and 2.1–2.5 m, respectively, and N1, N2, N3, N4, and N5 were north of the apple tree row at a distance of 0.5–0.9, 0.9–1.3, 1.3–1.7, 1.7–2.1, and 2.1–2.5 m, respectively. Three sections (4.0 × 0.4 m) were randomly selected in the soybean monocropping treatment. The vertical soil profile in each section was divided into five soil layers (0–20, 20–40, 40–60, 60–80, and 80–100 cm) to excavate and collect the apple roots and soybean roots.
Root samples were collected and placed into mesh bags (0.15 mm pores), after which the samples were carefully cleaned with tap water to remove any adhered soil particles and then soaked in water for 24 h. The fine roots (≤2 mm) of the apple trees and soybean plants were then measured with an electronic Vernier caliper. Dark roots, partially decayed roots, brittle roots and other extraneous materials were removed. All the root samples were weighed immediately after drying at 70 °C for 48 h.

2.3. Fine-Root Biomass Density

The fine-root biomass density (FRMD) is an index used to measure the growth of fine roots of plants and is calculated via the following equation:
FRMD = W d , / V s
where FRMD is the fine-root biomass density (g·m−3), Wd represents the fine-root dry weight (g), and Vs represents the soil volume (m3).

2.4. Fine-Root Niche Differentiation

The depth of the fine-root vertical barycenter (FRVB) can be used to quantify the vertical barycenter of both tree and crop roots to explore their niche differentiation [12,23]. The FRVB of the apple trees and soybean plants was then calculated via the following equation:
FRVB = i = 1 , r D i P i
where FRVB is the depth of the fine-root vertical barycenter (cm), r (r ≤ 5) represents the soil layer, Di is the depth of the middle of the ith soil layer (cm), and Pi is the proportion of FRMD in the ith soil layer to the total FRMD (0–100 cm).

2.5. Below-Ground Interspecific Competition Intensity Index

The niche overlap formula [24] can be used to effectively calculate the degree of competition among species for common resources under conditions of resource shortage [25,26]. The formula can be used to calculate the below-ground interspecific competition intensity of apple–soybean intercropping systems. The equation is as follows:
BICII = j = 1 , r P A j P S j / j = 1 r P A j 2 j = 1 r P S j 2
where BICII (0 ≤ BICII ≤ 1) represents the below-ground interspecific competition intensity index (BICII) between apple trees and soybean plants, r (r ≤ 5) represents the soil layer, PAj represents the proportion of apple tree FRMD in the jth soil layer to the total apple tree FRMD (0–100 cm), and PSj represents the proportion of soybean FRMD in the jth soil layer to the total soybean FRMD (0–100 cm).

2.6. Statistical Analyses

An analysis of variance (ANOVA) was performed using SPSS 22.0 (IBM Inc., Armonk, NY, USA). The FRMD, FRVB, and BICII of each treatment were described by mean values (n = 3) followed by standard deviations. Differences between the apple trees or soybean plants at different distances or depths were analyzed by one-way ANOVA, and significant differences between the mean values were compared by the least significant difference (LSD) test. Paired-sample t-tests were used to examine differences in FRMD, FRVB, and BICII between the treatments. The statistical results accompanied by error bars and significance level (p) are shown, and differences were considered statistically significant when p ≤ 0.05.

3. Results

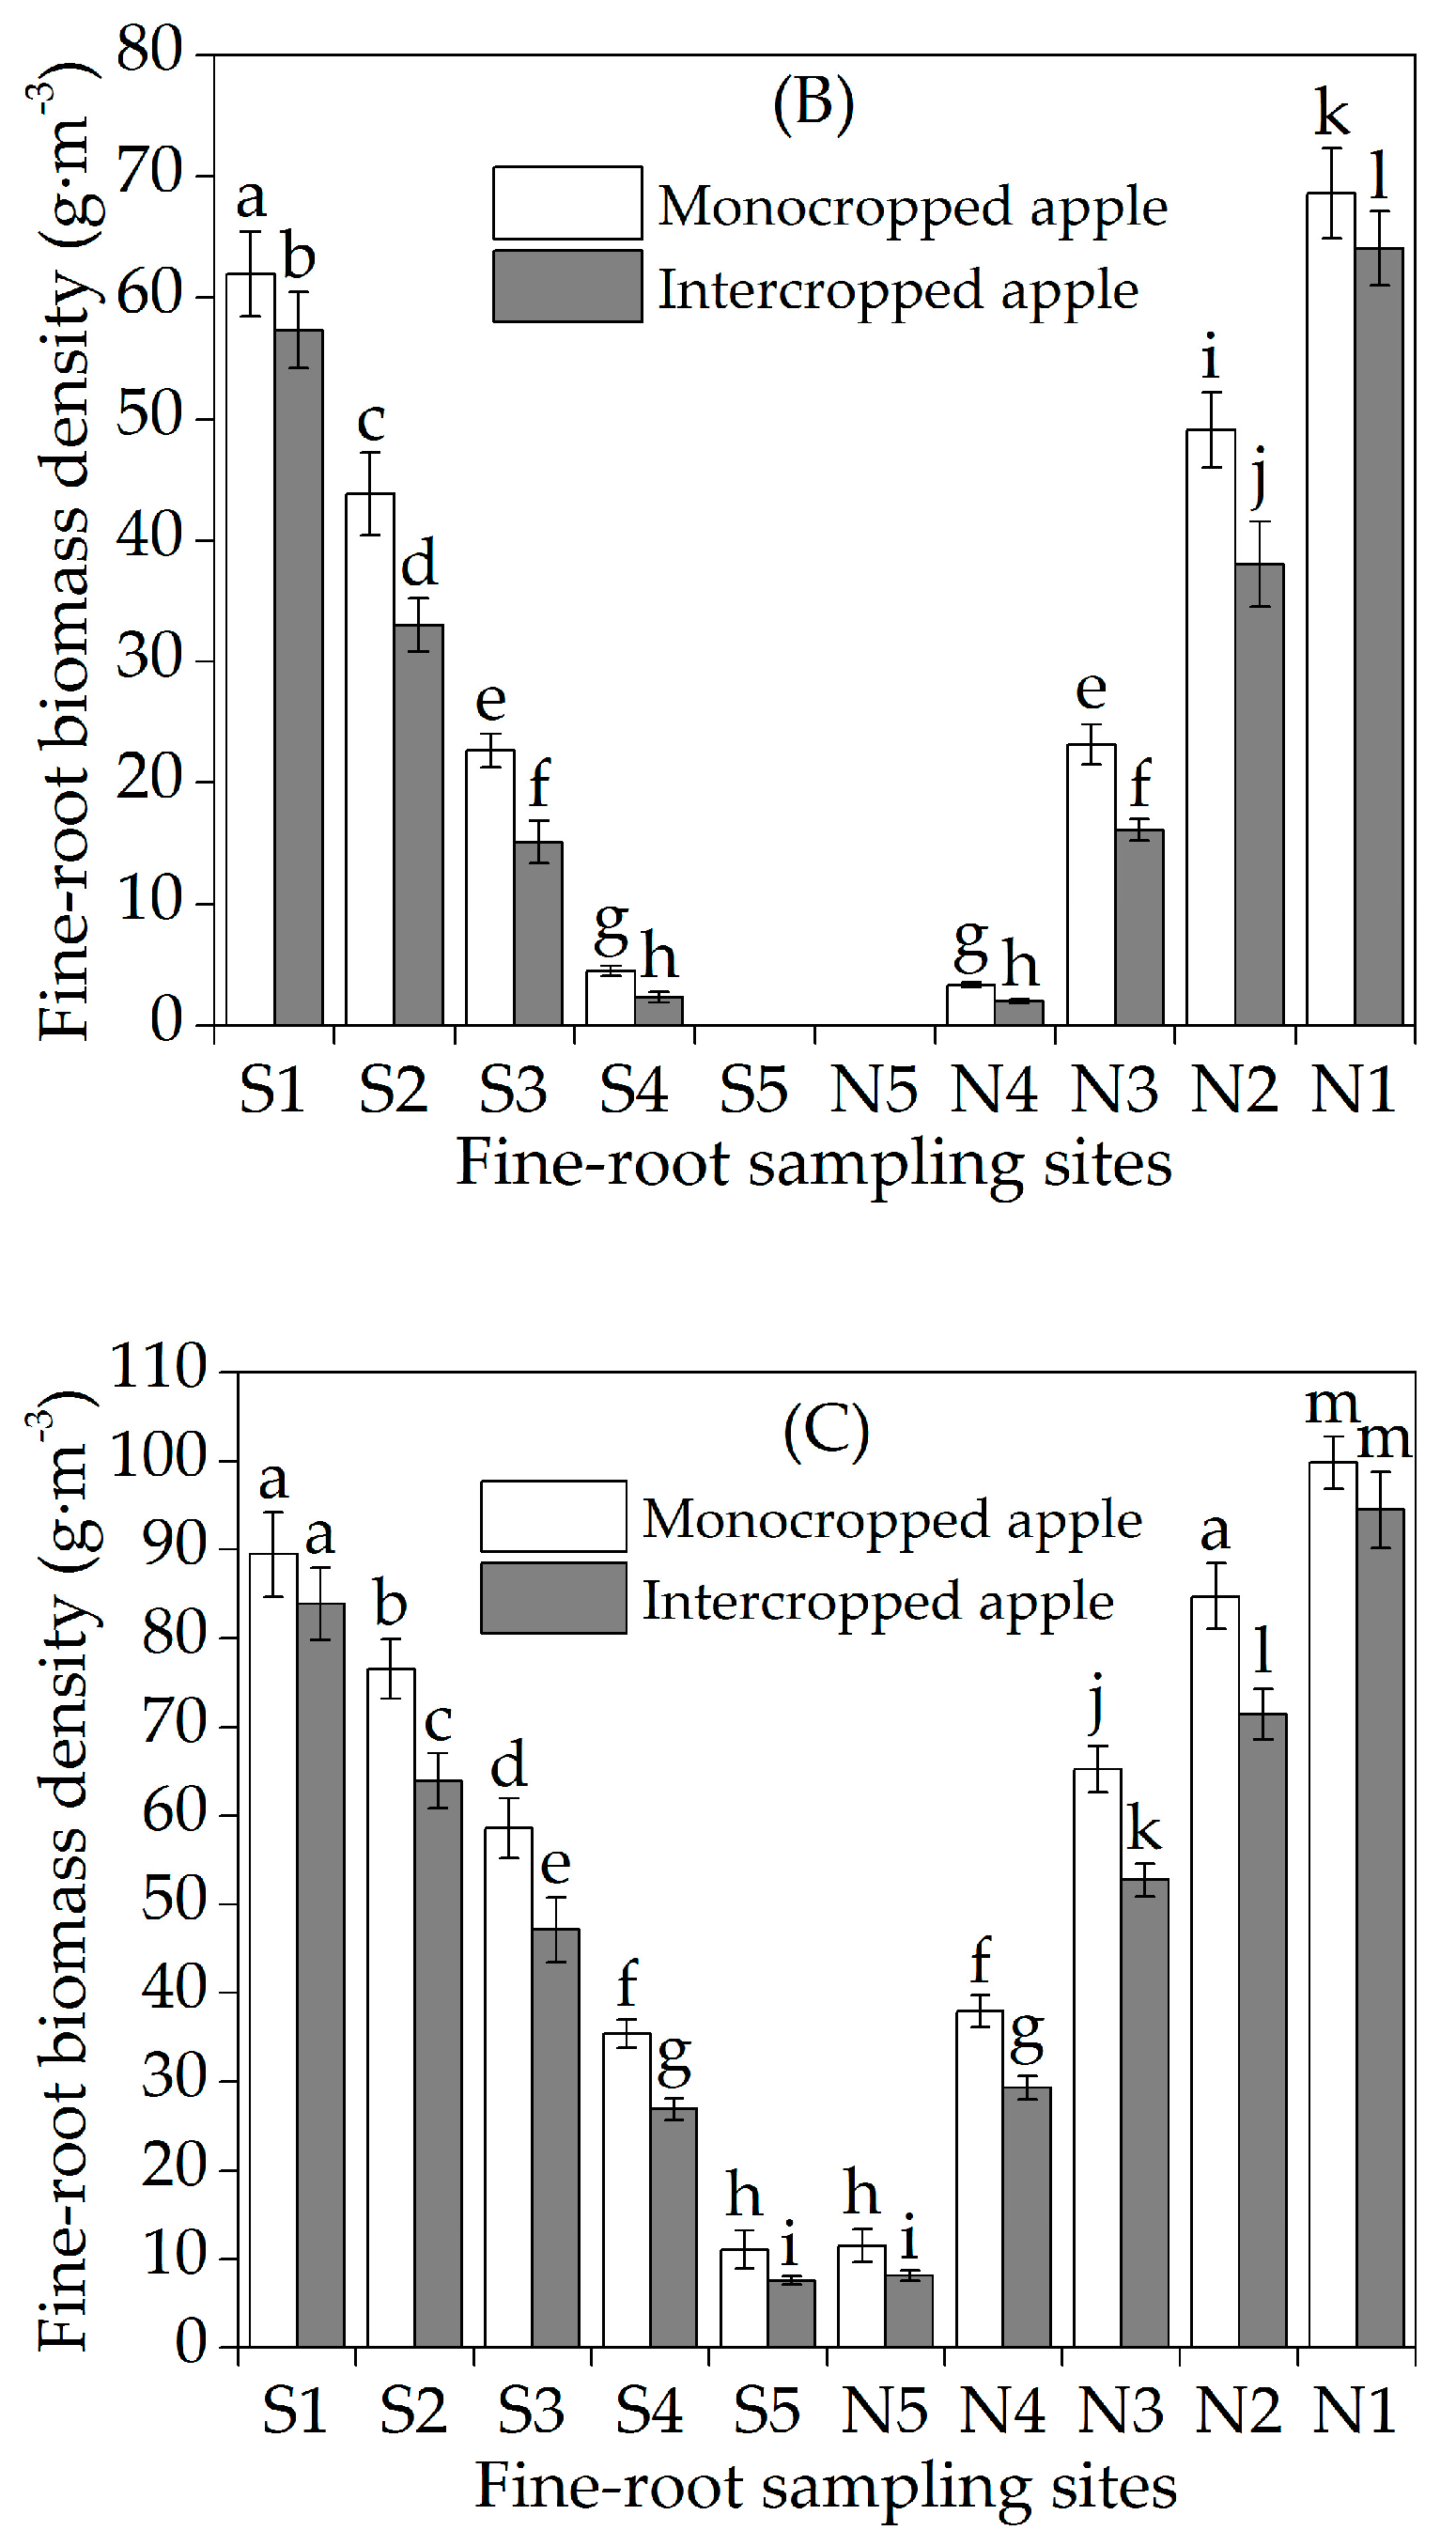
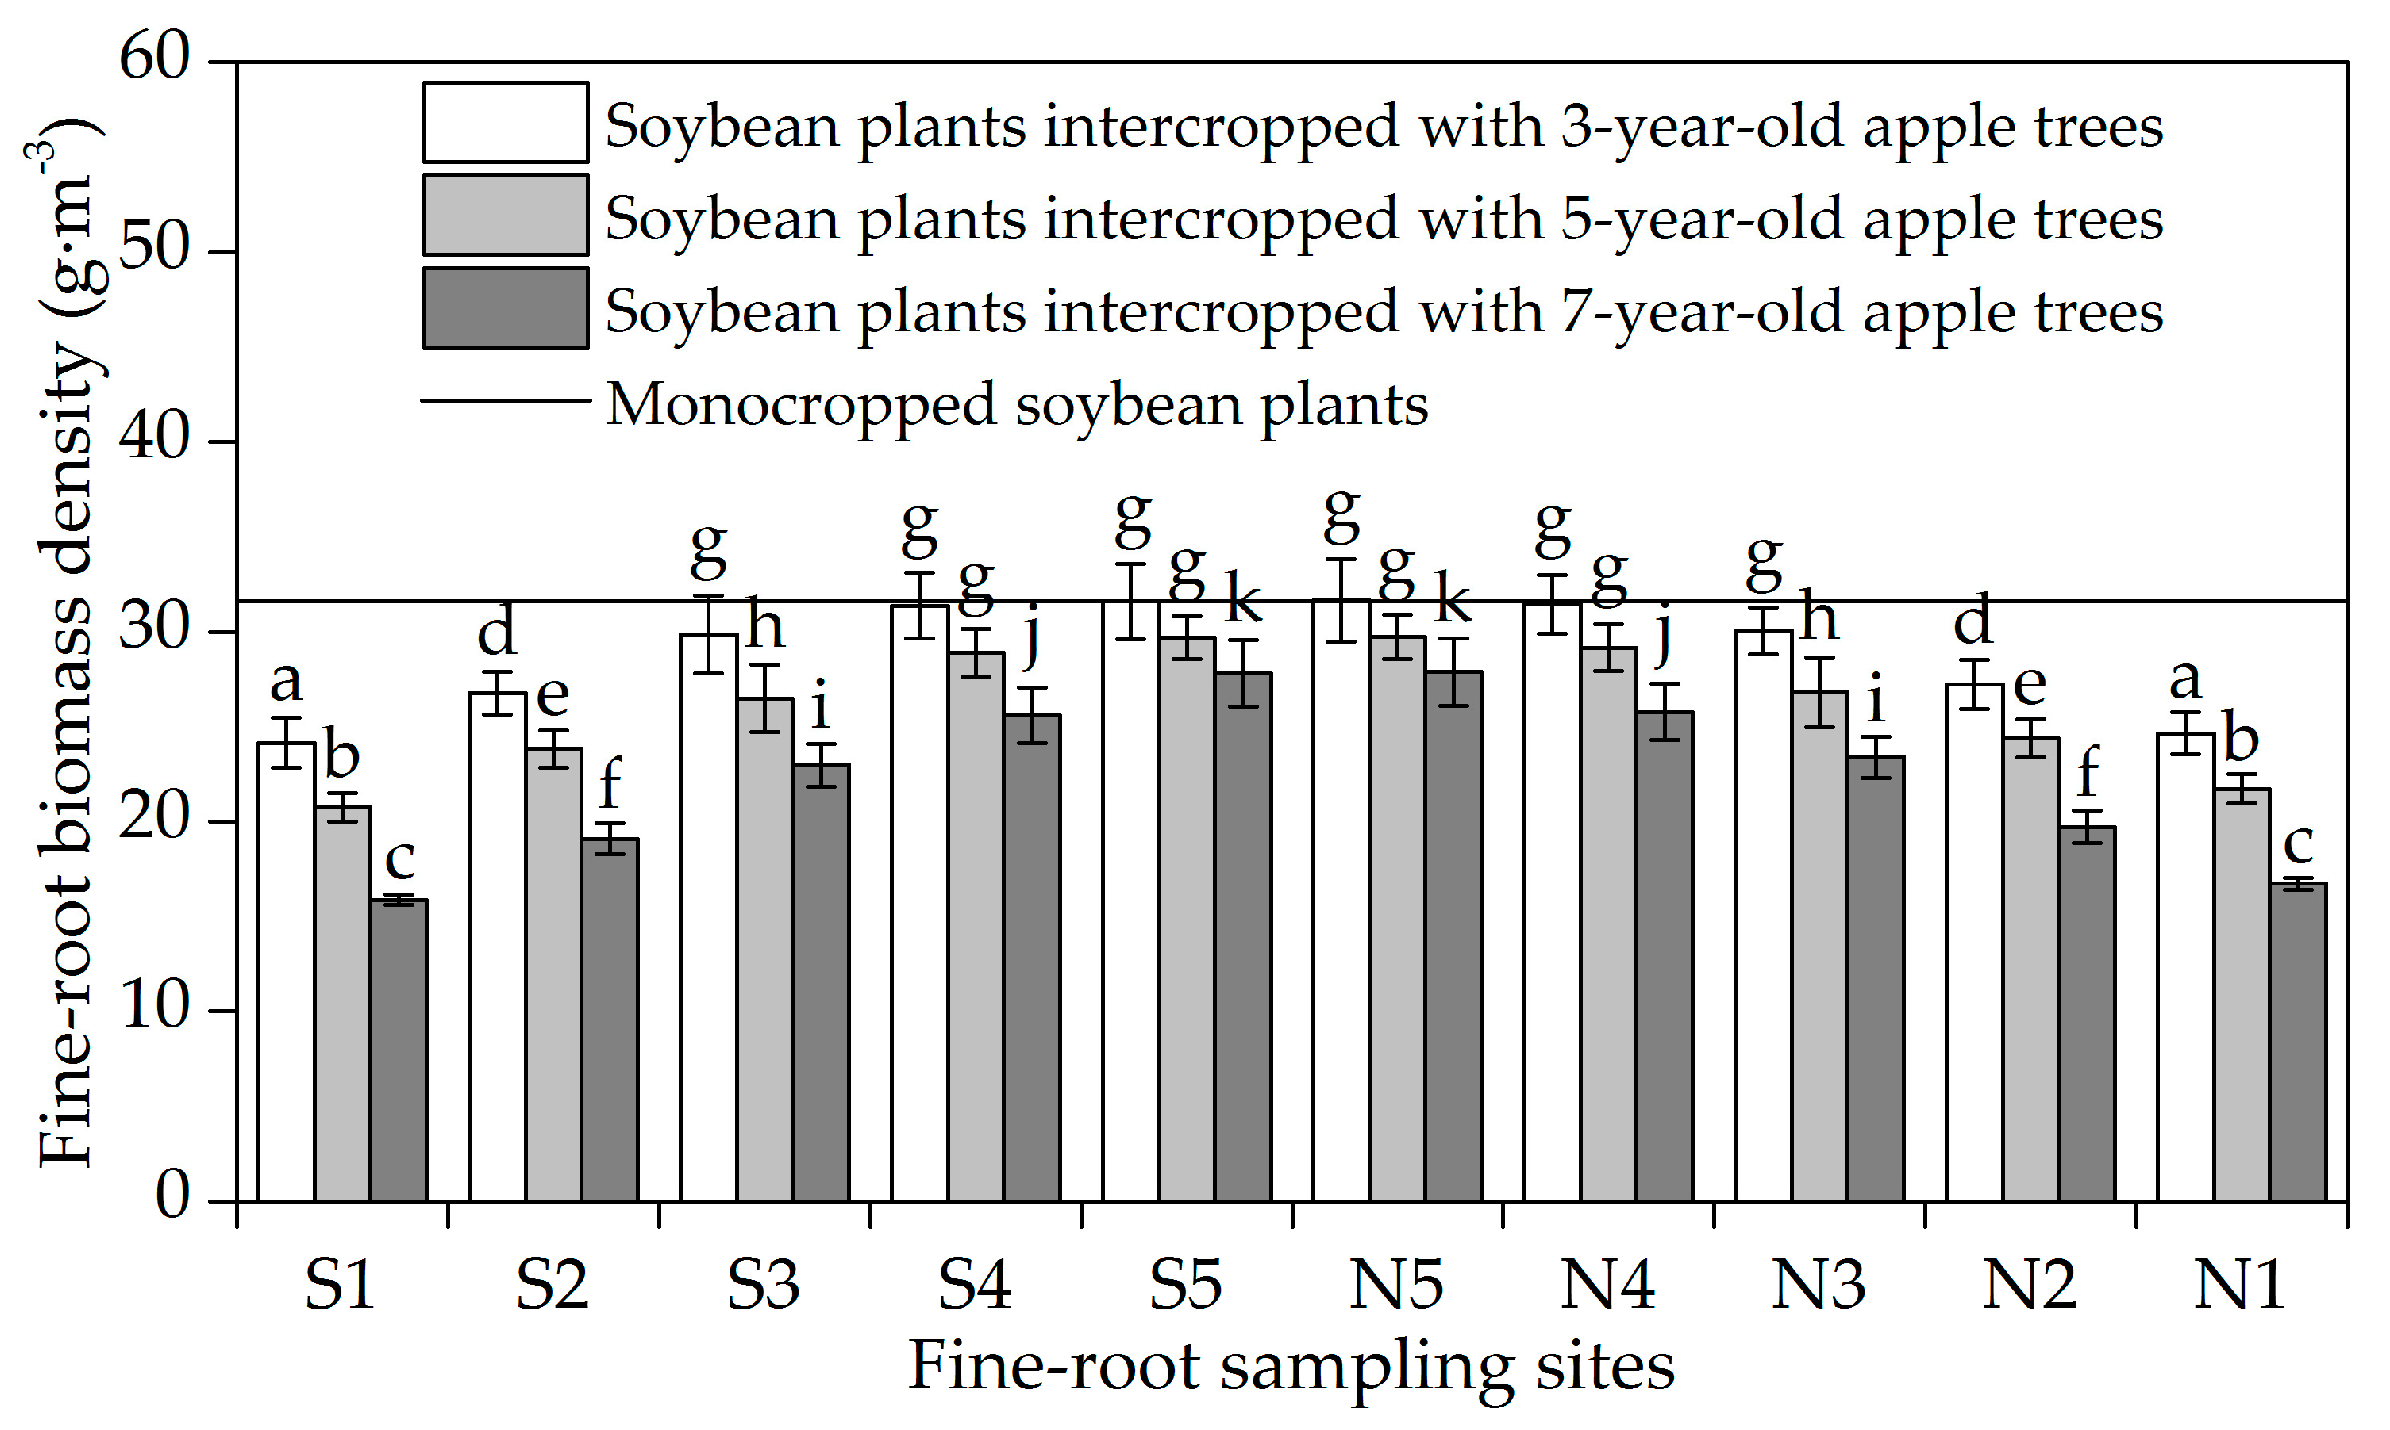
3.1. Horizontal Fine-Root Distribution

The FRMD of the intercropped apple trees was less than that of the monocropped apple trees of the same age (see Figure 2A–C). In general, the FRMD (the mean value of the 0–100 cm depth) of the 3-, 5-, and 7-year-old intercropped apple trees was 3.49, 6.14, and 8.46 g·m−3 less than that of the corresponding monocropped apple trees, respectively. In addition, the FRMD north (the mean value of Sections N1–N5) of the apple tree row was greater than that of the south (the mean value of Sections S1–S5) of the row in the 3-, 5-, and 7-year-old intercropped apple trees; the values were 7.10, 11.46, and 11.66% greater on the north side than on the south side, respectively. The closer the section was to the apple tree row, the greater the FRMD of the apple trees. In each section, compared with that of the corresponding monocropped apple trees, the FRMD of 3-, 5-, and 7-year-old intercropped apple trees decreased (see Figure 2A–C). Compared with the corresponding monocropped apple trees, the proportion of the FRMD reduction in 3-, 5-, and 7-year-old intercropped apple trees increased with the distance from the apple tree row, and the proportion of the FRMD reduction in each section decreased with increasing tree age.
The FRMD of the intercropped soybean plants was less than that of the monocropped soybean plants (see Figure 3). In addition, the FRMD of the northern apple tree row was greater than that of the southern soybean plants intercropped among 3-, 5-, and 7-year-old apple trees; the values were 0.89, 1.68, and 1.92% greater on the north side than on the south side, respectively. Overall, the FRMD of the soybean plants intercropped with 3-, 5-, and 7-year-old apple trees was 2.74, 5.48, and 9.14 g·m−3 less than that of the monocropped soybean plants, respectively. The closer the section was to the apple tree row, the lower the FRMD of the intercropped soybean plants. Compared with the monocropped soybean plants, the FRMD of the soybean plants intercropped with 3-, 5-, and 7-year-old apple trees was significantly lower (p < 0.05) in the 0.5–1.3, 0.5–1.7, and 0.5–2.5 m soil layers, respectively. Compared with the monocropped soybean plants, the proportion of the FRMD reduction in each section increased with increasing tree age. Overall, in the apple–soybean intercropping systems, the FRMD values of the 3-and 5-year-old apple trees were less than those of the corresponding soybean cropping systems, while the FRMD values of the 7-year-old apple trees were much larger than those of the corresponding soybean plants.

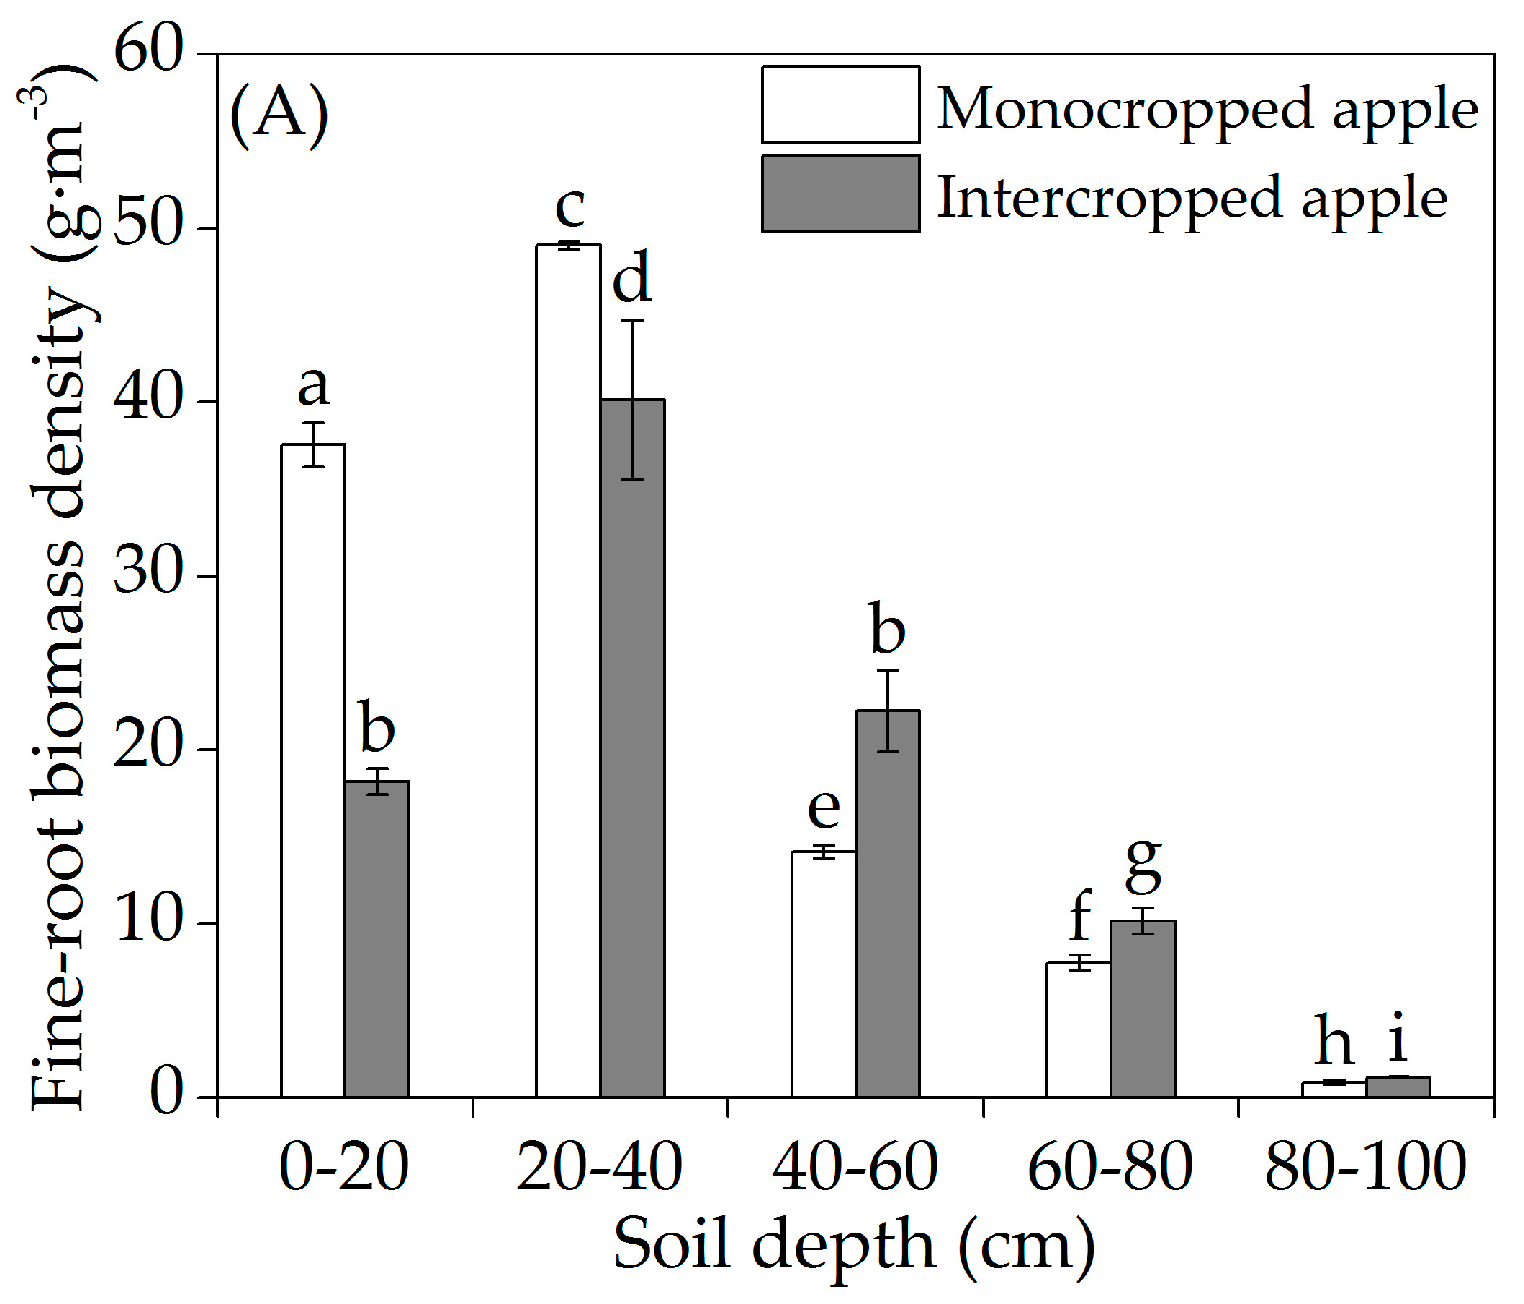
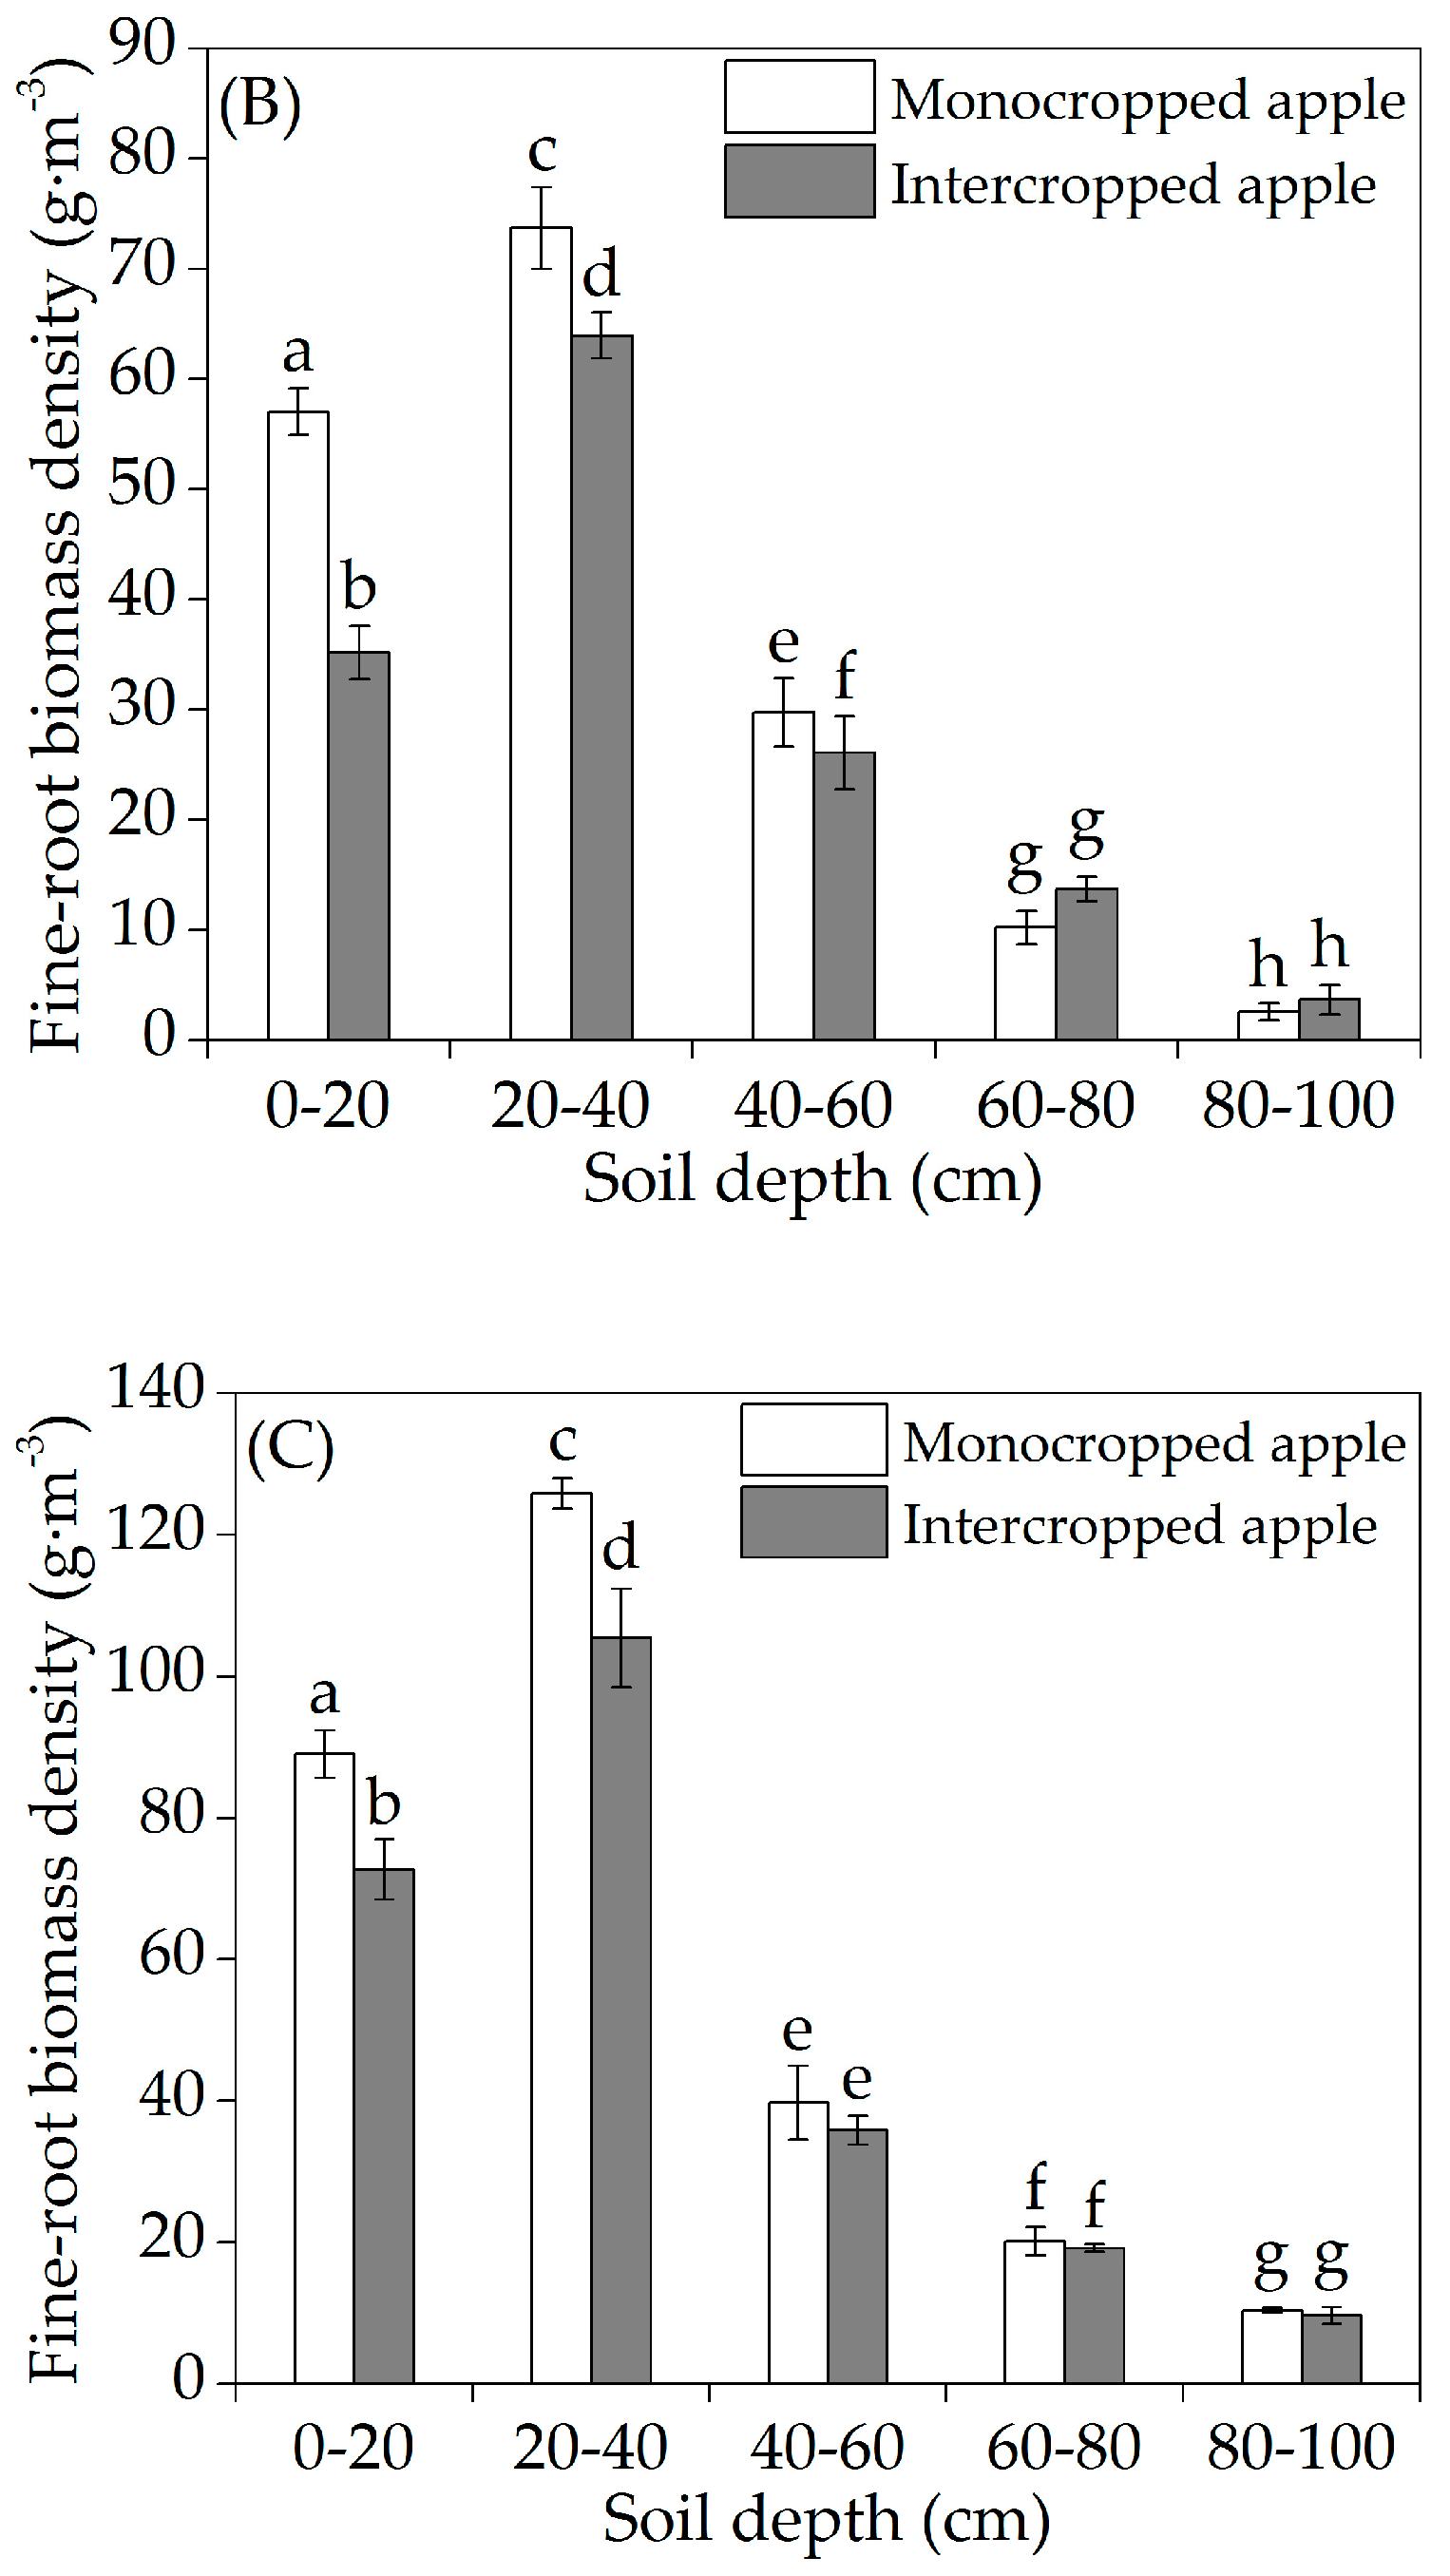
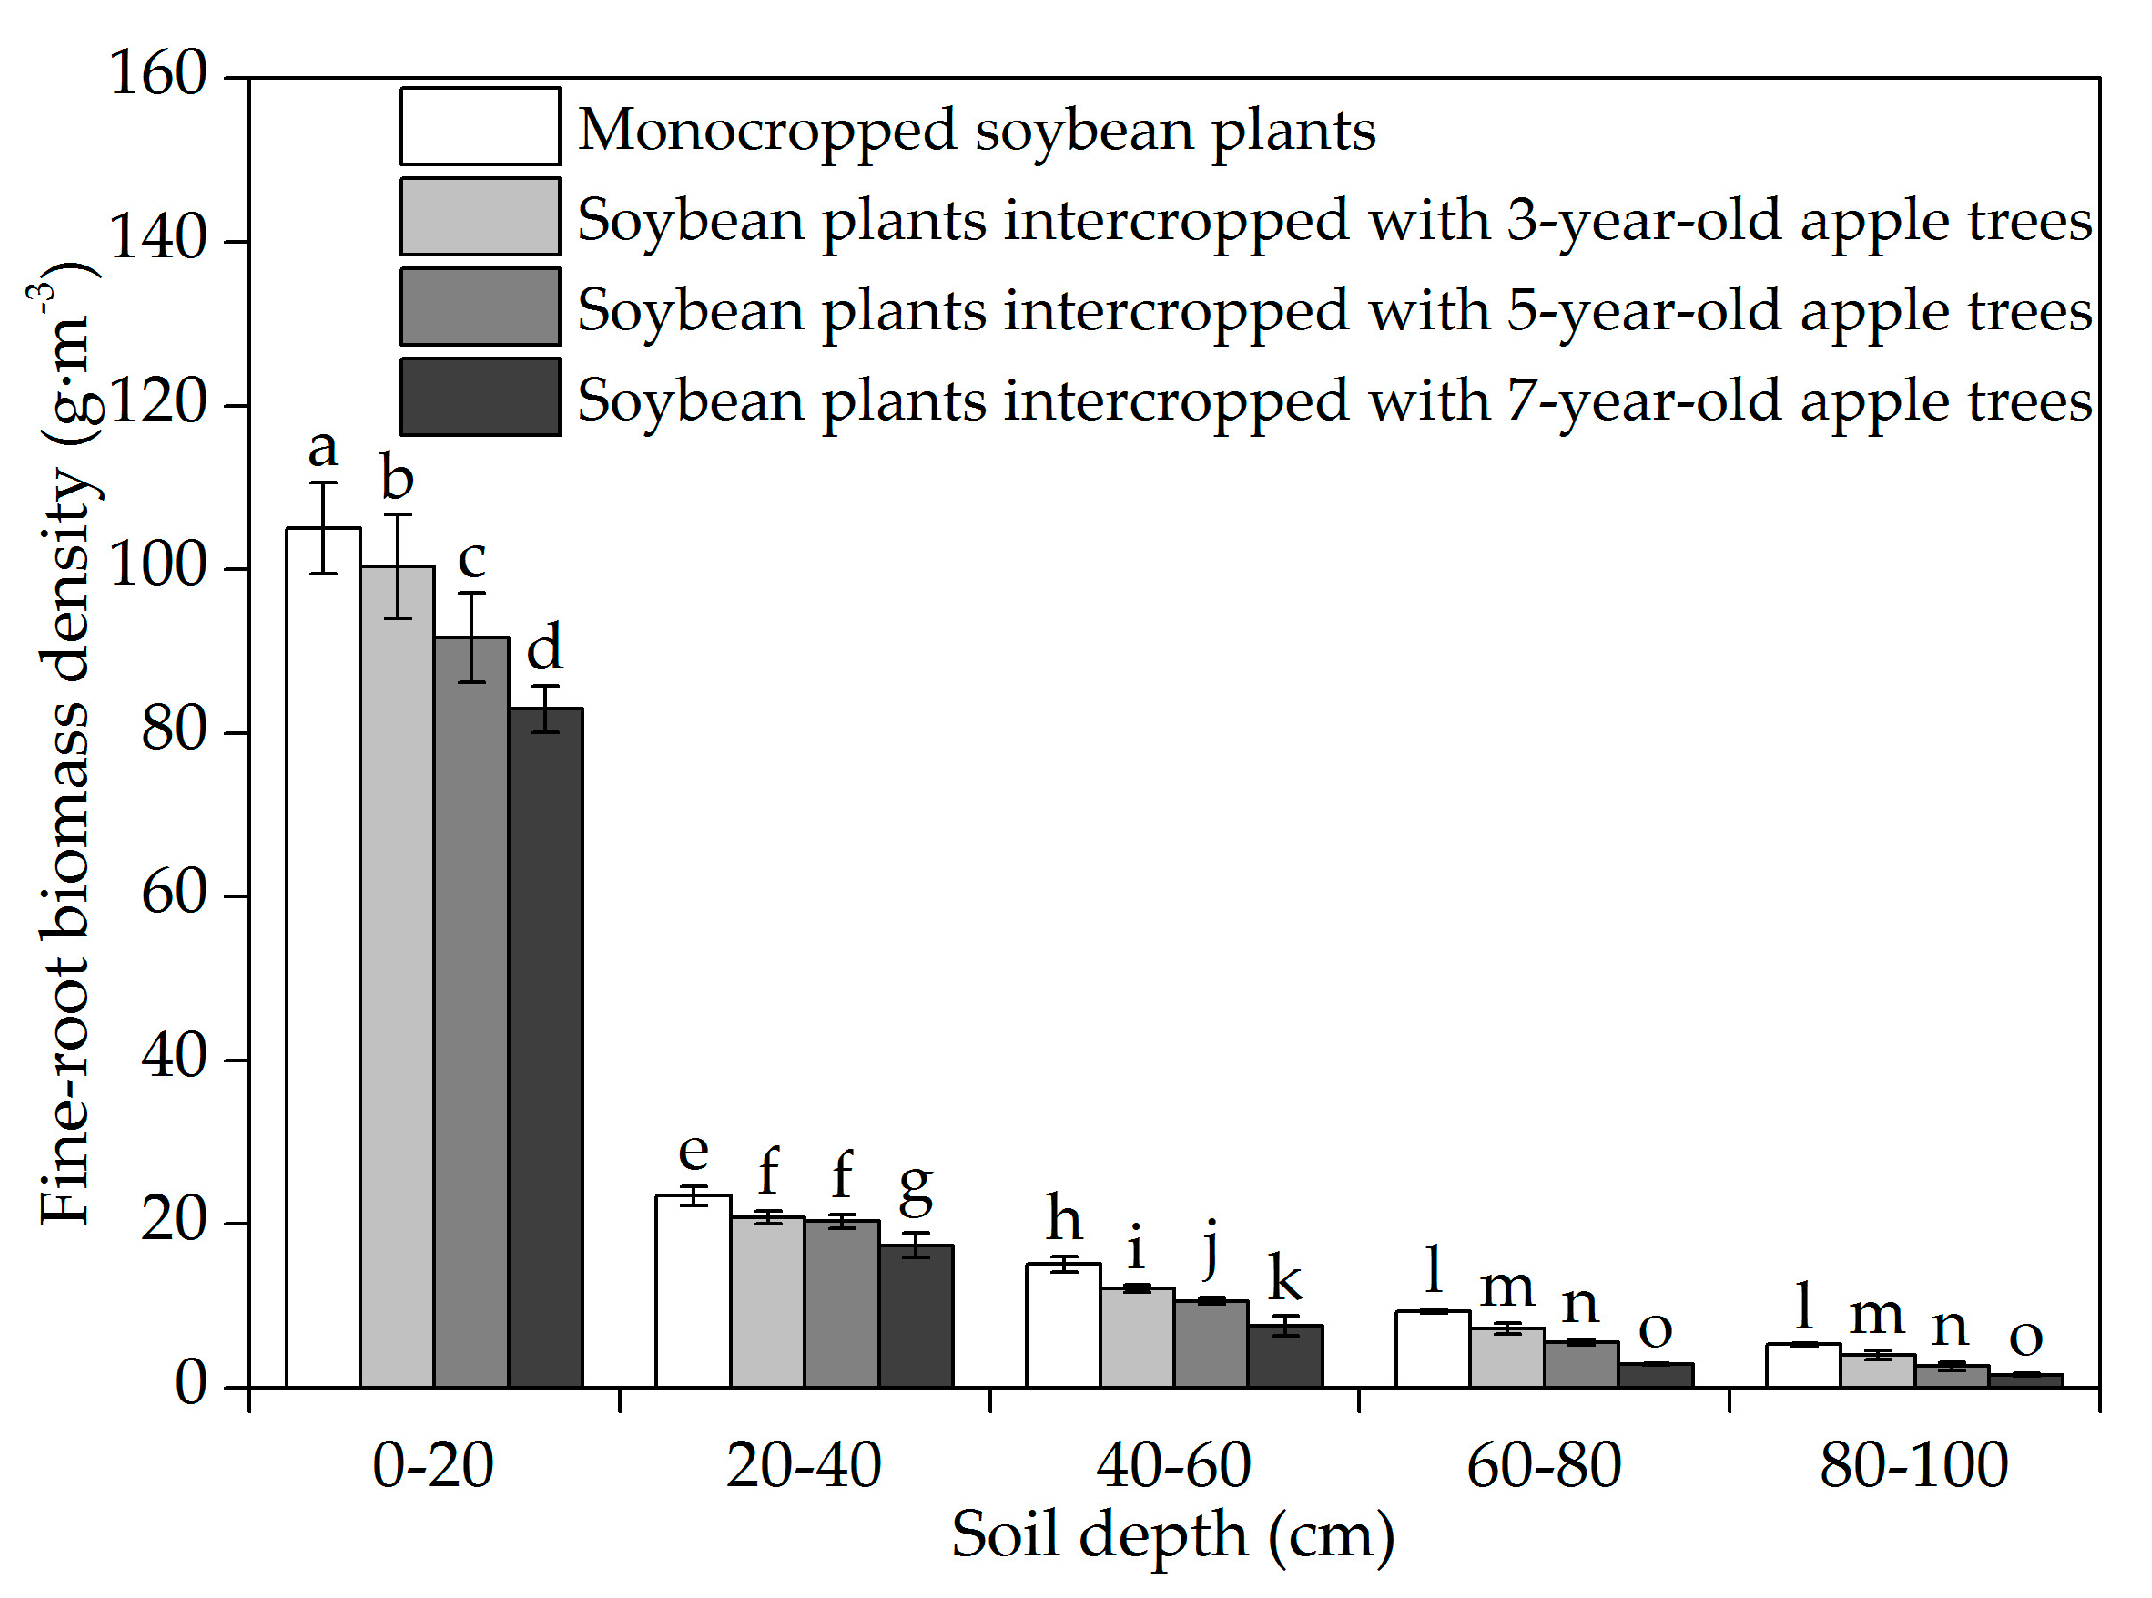
3.2. Vertical Fine-Root Distribution

The FRMD of the apple trees increased first but then decreased with increasing soil depth; the majority of the FRMD was distributed within the 20–40 cm soil layer (see Figure 4A–C). The FRMD of the intercropped apples was concentrated within the 0–60 cm soil depth, where the 3-, 5-, and 7-year-old apple trees accounted for 87.67, 87.82, and 88.10% of the total FRMD (0–100 cm), respectively. Compared with that of the 3-year-old monocropped apple trees, the FRMD of the 3-year-old intercropped apple trees was significantly lower (by 32.63%; p < 0.05) within the 0–40 cm soil layer; however, the FRMD of the intercropped apple trees was significantly greater (by 75.42%; p < 0.05) than that of the monocropped apple trees within the 40–100 cm soil layer (see Figure 4A). Compared with that of the monocropped apple trees, the FRMD of the 5-year-old intercropped apple trees significantly decreased (by 21.99%; p < 0.05) within the 0–60 cm soil layer and non-significantly increased (by 65.35%; p > 0.05) within the 60–100 cm soil layer (see Figure 4B). The FRMD of the 7-year-old intercropped apple trees was less than that of the monocropped apple trees in each soil layer (see Figure 4C), and the degree of the FRMD reduction decreased with soil depth.
The FRMD of the soybean plants decreased with increasing soil depth (see Figure 5). The FRMD of the soybean plants was concentrated within the 0–20 cm soil layer, where the FRMD of both the monocropped soybean plants and those intercropped with 3-, 5-, and 7-year-old apple trees accounted for 66.46, 69.46, 70.09, and 73.80% of the total FRMD, respectively. Compared with that of the monocropped soybean plants, the degree of the FRMD reduction of the soybean plants intercropped with 3-, 5-, and 7-year-old apple trees increased with increasing soil depth, and the degree of reduction in each soil layer increased with increasing tree age.

3.3. Fine-Root Niche Differentiation

The FRVB of both apple trees and intercropped soybean plants were tended to increase in depth with the distance from the apple tree row (see Figure 6). The FRVB of the intercropped apple trees was deeper than that of the corresponding monocropped apple trees in each section. The FRVB of the monocropped apple trees increased with increasing tree age, while that of the intercropped apple trees decreased. Generally, the relative distances between the 3-, 5-, and 7-year-old intercropped apple trees and the corresponding monocropped apple trees were 7.03, 4.02, and 0.97 cm, respectively. In general, compared with that of the monocropped soybean plants, the FRVB of the soybean plants intercropped with 3-, 5-, and 7-year-old apple trees was shallower, and the relative distances between the intercropped and monocropped soybean plants were 1.54, 2.47, and 4.53 cm, respectively (see Figure 6). The relative distance of the FRVB between the intercropped apple trees and corresponding soybean plants increased with the distance from the apple tree row and decreased with increasing tree age. In addition, the relative distance north of the apple tree row was slightly greater than that south of the row in the 3-, 5-, and 7-year-old apple–soybean intercropping systems; the values were 0.34, 0.09, and 0.61 cm greater on the north side than on the south side, respectively.

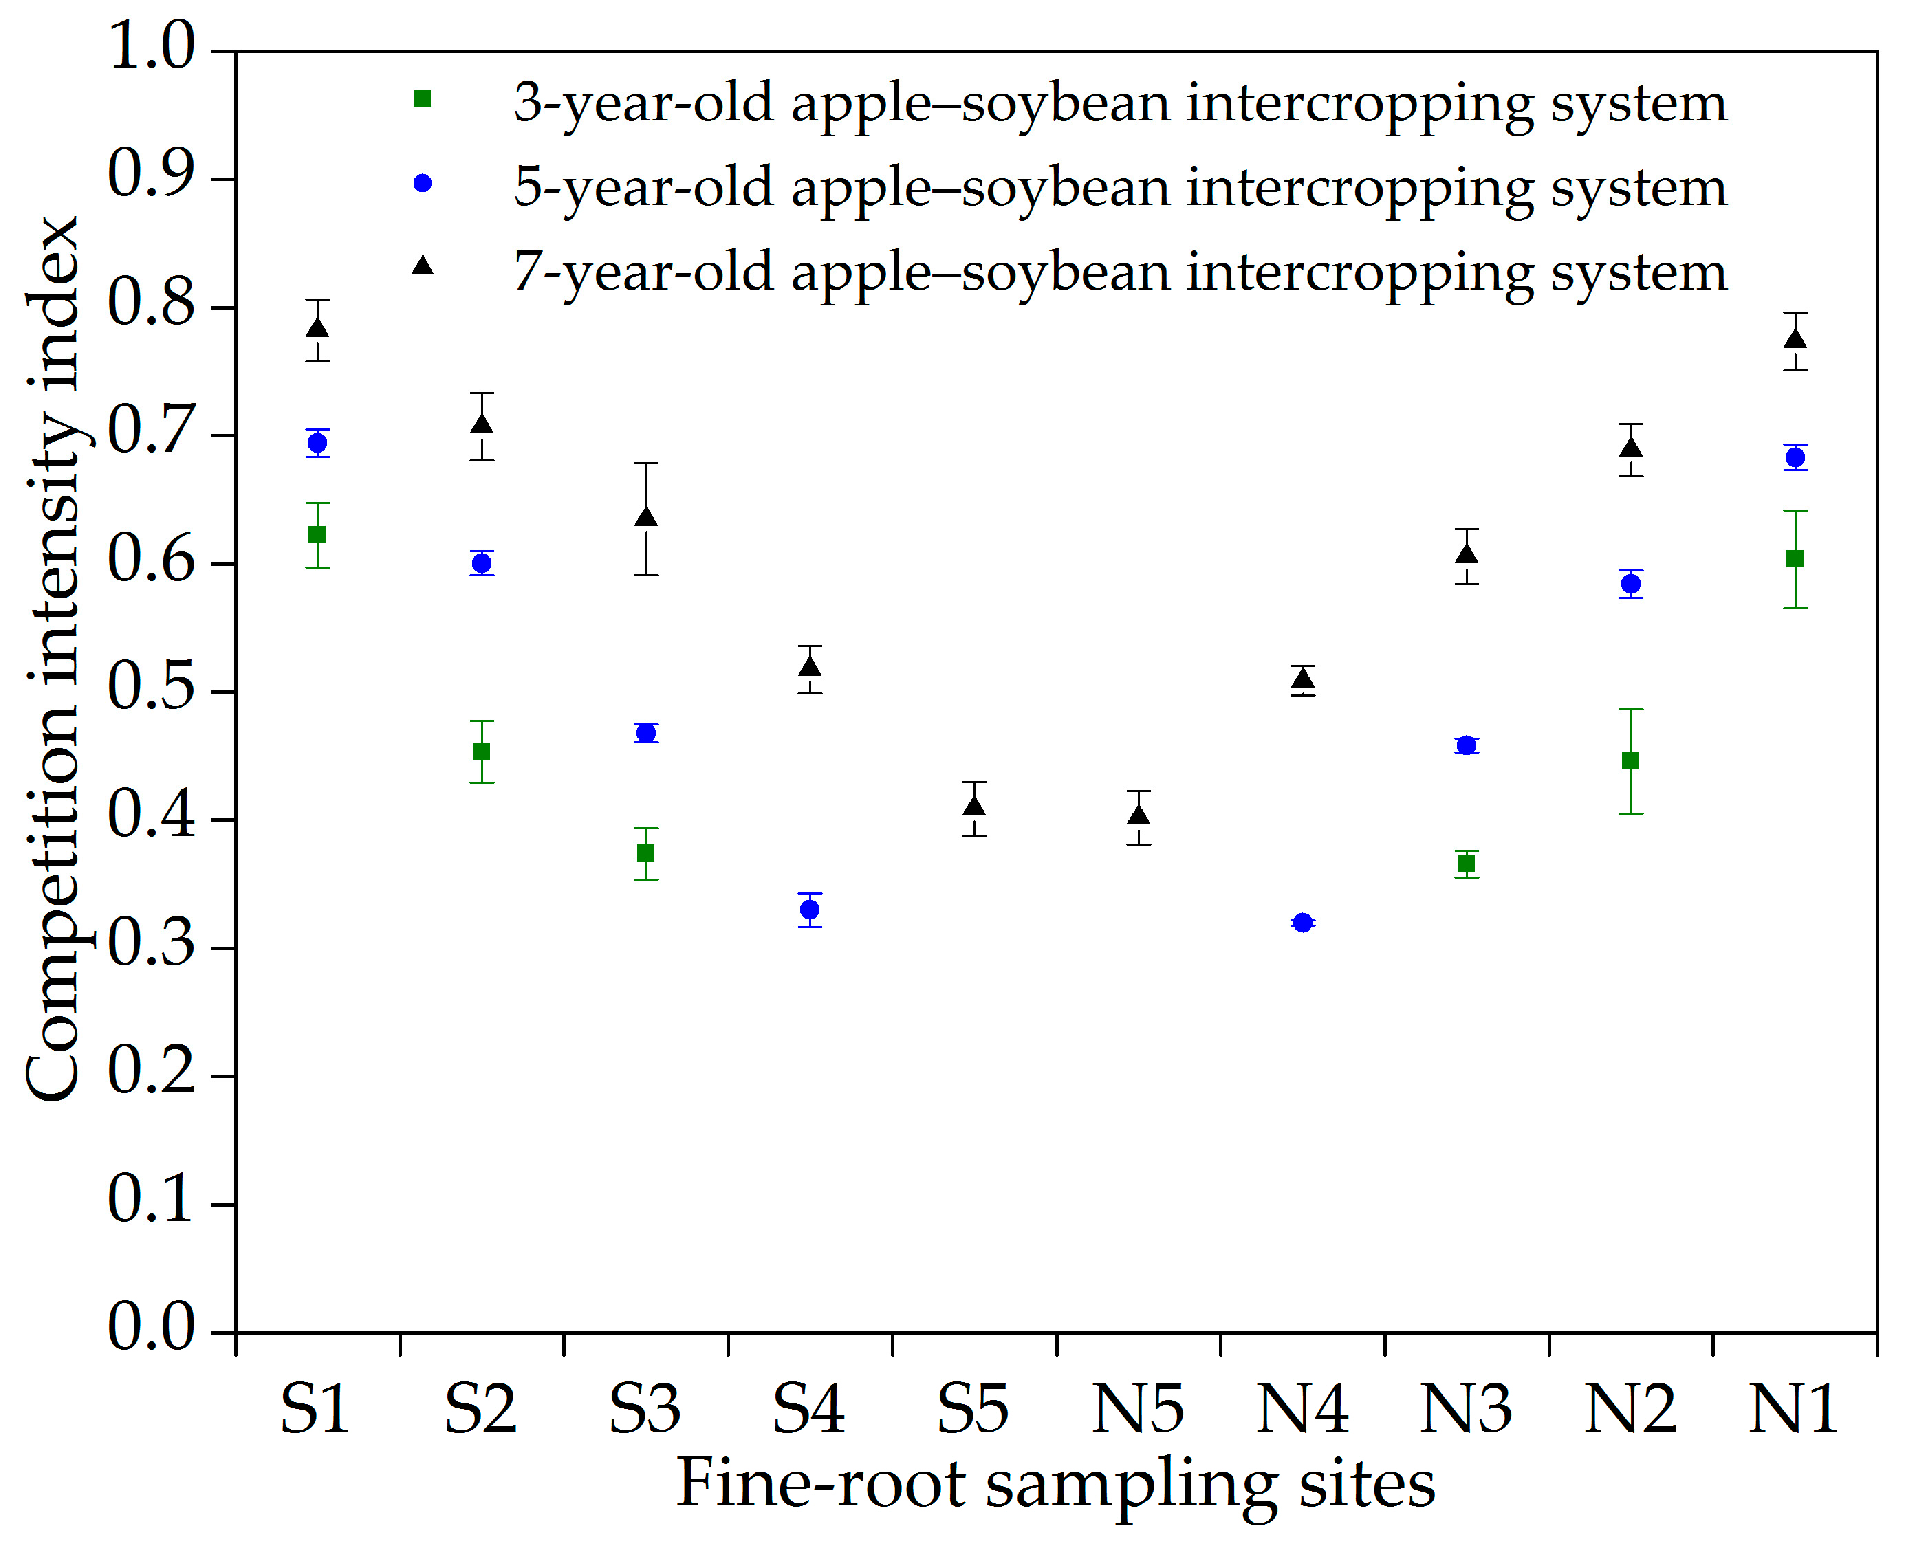
3.4. Below-Ground Interspecific Competition Intensity

The BICII of the apple–soybean intercropping systems decreased with the distance from the apple tree row (see Figure 7). The BICII was slightly greater south of the apple tree row than north of the row, but the difference was not significant (p > 0.05). The BICII increased significantly (p < 0.05) with age of the apple trees. The horizontal distribution of the BICII significantly differed (p < 0.05) between sections in the areas whose distance ranged from 0.5–2.5 m from the tree row. Moreover, the BICII values of the 3-, 5-, and 7-year-old apple–soybean intercropping systems were much greater in the 0.5–0.9, 0.5–1.3, and 0.5–1.7 m sections than in the other sections.

4. Discussion

4.1. Horizontal Fine-Root Distribution

The FRMD of the apple trees and soybean plants in the apple–soybean intercropping systems was related to the age of the apple trees and the distance from the apple tree row. Compared with those of the younger apple trees, the fine roots of the older apple trees occupied a larger soil space and had both a greater quantity of fine roots (see Figure 2A–C) and a greater ability to shorten the fine roots of soybean plants (see Figure 3). Similar results have been reported in jujube–wheat intercropping systems [14]. In addition, the fine roots of the apple trees were also adversely affected by the soybean plants, and this effect gradually increased with a decrease in tree age or with increasing distance from the apple tree row (see Figure 2A–C). Overall, the FRMD values of the 3-, 5-, and 7-year-old intercropped apple trees were 3.49, 6.14, and 8.46 g·m−3 less than those of corresponding monocropped apple trees, respectively (see Figure 2A–C). The FRMD values of the soybean plants intercropped with 3-, 5-, and 7-year-old apple trees were 2.74, 5.48, and 9.14 g·m−3 less than those of the monocropped soybean plants, respectively (see Figure 3). Therefore, competition in fine-root growth occurred between the apple trees and soybean plants. The competitiveness of soybean was greater that of apple in the 3-and 5-year-old appl–-soybean intercropping systems, while the competitiveness of soybean was less than that of apple in the 7-year-old apple–soybean intercropping systems. The FRMD values of the 3-and 5-year-old intercropped apple trees were less than those of the corresponding soybean plants, while the FRMD of the 7-year-old apple trees was much greater than that of the corresponding soybean plants (see Figure 2A–C and Figure 3). Consequently, plants with a greater quantity of fine roots are likely to be more competitive than plants with fewer fine roots, which is similar to the conclusions of Schroth [27] and Zhang et al. [13]. The farther the section was to the apple tree row, the fewer the fine roots of the apple trees and the greater the fine roots of the soybean plants. This phenomenon indicated that the fine roots of the soybean plants were inhibited by the apple trees. This inhibition is a response to strong below-ground interspecific competition [13], and it potentially increases the competitive absorption of soybean for soil water and nutrients [28] and reflects a positive response to the weakened competitiveness of apple trees. The direct reason for spatial differences in soybean root distributions is soil spatial heterogeneity [29]. In this study, the FRMD for both apple trees and soybean plants north of the apple tree row was greater than that south of the apple tree row. This discrepancy might be affected by canopy shading and it resulted in a better soil water status north of the tree row than south of the row [30], which caused the fine roots on the north of the tree row to grow vigorously.

4.2. Vertical Fine-Root Distribution

The fine roots of the intercropped apple trees were concentrated within the 0–60 cm soil layer, and those of the intercropped apple trees and soybean plants were distributed mostly within the 20–40 cm and 0–20 cm soil layers (see Figure 4A–C and Figure 5), respectively. These results indicated that the vertical distribution of the fine roots between the apple trees and soybean plants were both skewed and overlapped. Soybean plants use mainly shallow soil resources, while apple trees can use relatively deep soil resources. Compared with those of the apple trees and soybean plants in this study, the fine roots of both walnut and soybean were distributed relatively more in the 0–20 cm soil layer in a walnut–soybean intercropping system in the same region [23]. Therefore, compared with that of the walnut–soybean intercropping system, the fine-root distribution of the apple–soybean intercropping systems displayed a better spatial structure and reduced competition for shallow soil resources among the apple trees and soybean plants. Compared with the FRMD of the monocropped apple trees, those of the 3-and 5-year-old intercropped apple trees were larger in the 40–100 cm and 60–100 cm soil layers, respectively (see Figure 4A,B). This difference is direct evidence of the niche differentiation of fine roots in apple–soybean intercropping systems. When competition is unavoidable, plants exhibit greater root development in the deep layers of the soil to obtain more resources [31,32]. However, the FRMD of the 7-year-old intercropped apple trees was lower than that of the monocropped apple trees in each soil layer (see Figure 4C), which might occur because the 7-year-old apple trees had a greater quantity of fine roots and because the competitiveness of soybean was much weaker than that of apple. Similarly, Bolte and Villanueva [33] reported that the fine roots of European beech (Fagus sylvatica L.) and Norway spruce (Picea abies (L.) Karst.) were greater in pure forests than in mixed forests. The FRMD of the intercropped soybean plants was lower than that of the monocropped soybean plants in each soil layer (see Figure 5). Similarly, Zamora et al. [3] reported that the fine roots of cotton (Gossypium hirsutum L.) intercropped with pecan (Carya illinoensis K. Koch) were less abundant than those of monocropped systems in each soil layer. Interspecific interactions between trees and crops may result in increased capture of growth-limiting resources [34,35].

4.3. Fine-Root Niche Differentiation

Responses in terms of root morphological plasticity to resource availability and/or plant competition constitute the main mechanism used by plant roots to avoid competition [16,17]. Changes in root morphology cause niche differentiation in plants, and ecologists believe that niche differentiation is the key to species coexistence [36]. It was observed that interspecific interactions in apple–soybean intercropping systems caused the fine roots of the intercropped apple trees to move toward deep soil and caused the fine roots of the intercropped soybean plants to move toward the soil surface (see Figure 6). Many researchers have reached similar conclusions [6,11,12,15]. This niche differentiation of fine roots is conducive to alleviating below-ground interspecific competition and improving the efficiency of deep soil resource utilization in apple–soybean intercropping systems. Nevertheless, Zhang et al. [13] reported that the fine roots of intercropped jujube presented a shallower distribution in the soil profile than did those of monocropped jujube. This discrepancy may be due to differences in jujube’s own characteristics or resources. Furthermore, in this study, the competitiveness of the soybean fine roots gradually weakened with increasing tree age, while the competitiveness of the apple fine roots gradually increased. Therefore, the fine roots of both intercropped apple trees and intercropped soybean plants were gradually displaced to the shallow soil with an increase in tree age (see Figure 6), which was an adaptive tactic of the fine roots of each component in the apple–soybean intercropping systems in response to intense below-ground interspecific competition. The differentiation of the intercropped apple and intercropped soybean fine-root niches ultimately determined the degree of niche overlap in the apple–soybean intercropping systems. The niche overlap between the intercropped apple trees and the corresponding soybean plants decreased with increasing distance from the apple tree row and increased with increasing tree age.

4.4. Below-Ground Interspecific Competition Intensity

Below-ground competition is most likely to occur when two species absorb soil resources from the same soil layer or at the same time [37]. The competition between populations must meet the conditions for population niche overlap and an insufficient supply of shared resources [20,21]. Under the conditions of non-irrigated agroforestry management in the arid and semi-arid regions of the Loess Plateau, soil water and farmland nutrients are often insufficient [21]. Therefore, the niche overlap of the fine-root components of apple–soybean intercropping systems on the Loess Plateau will inevitably lead to competition for soil water and soil nutrients. The results from this study showed that the components of the 3-, 5-, and 7-year-old apple–soybean intercropping systems competed for soil water and nutrients at distances of 0.5–1.7, 0.5–2.1, and 0.5–2.5 m from the apple tree row (see Figure 7), respectively. The below-ground interspecific competition intensity increased with increasing tree age, which was caused by the niche differentiation between the apple trees and soybean plants. The below-ground interspecific competition intensity was slightly greater south of the apple tree row than north of the row. Furthermore, a relatively greater intensity of below-ground interspecific competition in the 3-, 5-, and 7-year-old apple–soybean intercropping systems for soil water and nutrients occurred within distances of 0.5–0.9, 0.5–1.3, and 0.5–1.7 m from the apple tree row (see Figure 7), respectively. These ranges were related not only to the age of the apple trees but also to the variety of intercropping crops and planting density of the apple trees and crop species. Niche overlap is the degree of shared use of the same resource by two species or the frequency of encounter between two species for the same resource [38,39]. Therefore, the degree of below-ground interspecific competition in the apple–soybean intercropping system was determined by the degree of common use for resources within the same soil layer by the apple trees and soybean plants.

5. Conclusions

In conclusion, the fine roots of the apple trees and soybean plants were distributed mostly within the 20–40 cm and 0–20 cm soil layers, respectively. In addition, the intercropped apple trees and intercropped soybean plants had lower FRMD values than did the monocropped apple trees and monocropped soybean plants, respectively. Compared with that of the corresponding monocropped systems, the FRVB of the intercropped apple trees displaced deeper soil and that of the intercropped soybean plants displaced shallower soil. Furthermore, the FRVB of both intercropped apple trees and intercropped soybean plants displaced shallow soil with increasing tree age. The niche differentiation of the fine roots caused the niche overlap between the intercropped apple trees and the intercropped soybean plants to decrease as the distance from the apple tree row increased, while the overlap increased with increasing tree age. To effectively alleviate the below-ground interspecific competition in apple–soybean intercropping systems and obtain increased production, farmers should appropriately increase the distance between soybean plants and apple tree rows. Soybean plants intercropped with 3-, 5-, and 7-year-old apple trees should be planted in areas at distances of 0.9, 1.3, and 1.7 m away from apple tree rows, respectively. Furthermore, farmers should also increase water and fertilizer inputs within the 0–40 cm soil layer in intercropping areas. Irrigation and fertilization can be appropriately increased as the tree age increases, and the input should increase with the distance from the apple tree row; in addition, inputs south of apple tree rows should be slightly greater than those north of the rows. Additional research is needed on the amount of fertilizer and irrigation that should be reasonably invested.

Author Contributions

Y.S. and H.B. conceived and designed the experiments; Y.S., H.D., R.P., and J.W. performed the experiments; Y.S. analyzed the data; Y.S. wrote the paper; Y.S., H.B., and H.X. revised the paper.

Funding

This work was financially supported by the National Natural Science Foundation of China (No. 31470638), the National Key Technology R & D Program of the Ministry of Science and Technology of China (No. 2015BAD07B0502), the National Key R & D Program of China (No. 2016YFC0501704) and the Beijing Municipal Education Commission (CEFF-PXM2018_014207_000024).

Acknowledgments

The authors are grateful for the support received from the Ji County Forest Ecosystem Research Station. Many thanks are given to the anonymous reviewers and the editors for their helpful comments.

Conflicts of Interest

The authors declare no conflicts of interest.

References

  1. George, S.J.; Kumar, B.M.; Wahid, P.A.; Kamalam, N.V. Root competition for phosphorus between the tree and herbaceous components of silvopastoral systems in Kerala, India. Plant Soil 1996, 179, 189–196. [Google Scholar] [CrossRef]
  2. Cannell, M.G.R.; Van Noordwijk, M.; Ong, C.K. The central agroforestry hypothesis: The tree must acquire resources that the crop would not otherwise acquire. Agofor. Syst. 1996, 34, 27–31. [Google Scholar] [CrossRef]
  3. Zamora, D.S.; Jose, S.; Nair, P.K.R. Morphological plasticity of cotton roots in response to interspecific competition with pecan in an alley cropping system in the southern United States. Agrofor. Syst. 2007, 69, 107–116. [Google Scholar] [CrossRef]
  4. Ong, C.K.; Corlett, J.E.; Singh, R.P. Above and below ground interaction in agroforestry systems. For. Ecol. Manag. 1991, 45, 45–57. [Google Scholar] [CrossRef]
  5. Anderson, L.S.; Sinclair, F.L. Ecological interactions in agroforestry systems. Agrofor. Abstr. 1993, 6, 57–91. [Google Scholar]
  6. Huxley, P.A.; Pinney, A.; Akunda, E.; Muraya, P. A tree/crop interface orientation experiment with a Grevillea robusta, hedgerow and maize. Agofor. Syst. 1994, 26, 23–45. [Google Scholar] [CrossRef]
  7. Gao, L.; Xu, H.; Bi, H.; Xi, W.; Bao, B.; Wang, X.; Bi, C.; Chang, Y. Intercropping competition between apple trees and crops in agroforestry systems on the Loess Plateau of China. PLoS ONE 2013, 8, e70739. [Google Scholar] [CrossRef] [PubMed]
  8. Mutua, J.N. Tree Root Architecture and Competition for Water in an Agroforestry System in Semi Arid Kenya. Ph.D. Thesis, University of Nairobi, Nairobi, Kenya, September 1998. [Google Scholar]
  9. Kumar, S.S.; Kumar, B.M.; Wahid, P.A.; Kamalam, N.V.; Fisher, R.F. Root competition for phosphorus between coconut, multipurpose trees and kacholam (Kaempferia galanga L.) in Kerala, India. Agrofor. Syst. 1999, 46, 131–146. [Google Scholar] [CrossRef]
  10. Smith, D.M.; Jackson, N.A.; Roberts, J.M.; Ong, C.K. Root distributions in a Grevillea robusta-maize agroforestry system in semi-arid Kenya. Plant Soil 1999, 211, 191–205. [Google Scholar] [CrossRef]
  11. Livesley, S.J.; Gregory, P.J.; Buresh, R.J. Competition in tree row agroforestry systems. 1. Distribution and dynamics of fine roots length and biomass. Plant Soil 2000, 227, 149–161. [Google Scholar] [CrossRef]
  12. Xu, H.; Bi, H.; Xi, W.; Powell, R.L.; Gao, L.; Yun, L. Root distribution variation of crops under walnut-based intercropping systems in the Loess Plateau of China. Pak. J. Agric. Sci. 2014, 51, 773–778. [Google Scholar]
  13. Zhang, W.; Ahanbieke, P.; Wang, B.J.; Xu, W.L.; Li, L.H.; Christie, P.; Li, L. Root distribution and interactions in jujube tree/wheat agroforestry system. Agrofor. Syst. 2013, 87, 929–939. [Google Scholar] [CrossRef]
  14. Zhang, W.; Wang, B.J.; Gan, Y.W.; Duan, Z.P.; Hao, X.D.; Xu, W.L.; Lv, X.; Li, L.H. Competitive interaction in a jujube tree/wheat agroforestry system in northwest China’s Xinjiang Province. Agrofor. Syst. 2016, 91, 881–893. [Google Scholar] [CrossRef]
  15. Mulia, R.; Dupraz, C. Unusual fine root distributions of two deciduous tree species in southern France: What consequences for modelling of tree root dynamics? Plant Soil 2006, 281, 71–85. [Google Scholar] [CrossRef]
  16. Hinsinger, P.; Bengough, A.G.; Vetterlein, D.; Young, I.M. Rhizosphere: Biophysics, biogeochemistry and ecological relevance. Plant Soil 2009, 321, 117–152. [Google Scholar] [CrossRef]
  17. Cahill, J.F.; McNickle, G.G.; Haag, J.J.; Lamb, E.G.; Nyanumba, S.M.; Clair, C.C.S. Plants integrate information about nutrients and neighbors. Science 2010, 328, 1657–1666. [Google Scholar] [CrossRef] [PubMed]
  18. Schroth, G. Tree root characteristics as criteria for species selection and systems design in agroforestry. Agrofor. Syst. 1995, 30, 125–143. [Google Scholar] [CrossRef]
  19. Caldwell, M.M.; Richards, J.H. Competing root systems: Morphology and models of absorption. In On the Economy of Plant Form and Function; Givnish, T.J., Ed.; Cambridge University Press: Cambridge, UK, 1986; pp. 251–273. [Google Scholar]
  20. McIntyre, B.D.; Riha, S.J.; Ong, C.K. Light interception and evapotranspiration in hedgerow agroforestry systems. Agric. For. Meteorol. 1996, 81, 31–40. [Google Scholar] [CrossRef]
  21. May, R.; McLean, A.R. Interspecific competition and multispecies coexistence. In Theoretical Ecology: Principles and Applications, 3rd ed.; McLean, A.R., Ed.; Oxford University Press: New York, NY, USA, 2007; pp. 84–97. [Google Scholar]
  22. Zhu, Q.K.; Zhu, J.Z. Sustainable Management Technology for Conversion of Cropland to Forest in Loess Area; Chinese Forestry Press: Beijing, China, 2003; pp. 179–186. [Google Scholar]
  23. Xu, H.; Bi, H.; Gao, L.; Yun, L.; Chang, Y.; Xi, W.; Liao, W.; Bao, B. Distribution and morphological variation of fine root in a walnut-soybean intercropping system in the Loess plateau of China. Int. J. Agric. Biol. 2013, 15, 998–1002. [Google Scholar]
  24. Pianka, E.R. The structure of lizard communities. Annu. Rev. Ecol. Syst. 1973, 4, 53–74. [Google Scholar] [CrossRef]
  25. Yang, X.W.; Ma, J.S. A review on some terms related to niche and their measurements. Chin. J. Ecol. 1992, 11, 44–49. [Google Scholar]
  26. Liu, W.; Cao, W. Niche characteristics of main plant species in spruce-fir forests in Changbai Mountains. Chin. J. Ecol. 2011, 30, 1766–1774. [Google Scholar]
  27. Schroth, G. A review of belowground interactions in agroforestry, focussing on mechanisms and management options. Agrofor. Syst. 1999, 43, 5–34. [Google Scholar] [CrossRef]
  28. Eastham, J.; Rose, C.W. Tree/pasture interactions at a range of tree densities in an agroforestry experiment. 1. Rooting patterns. Aust. J. Agric. Res. 1990, 41, 683–695. [Google Scholar] [CrossRef]
  29. Jackson, R.B.; Canadell, J.; Ehleringer, J.R.; Mooney, H.A.; Sala, O.E.; Schulze, E.D. A global analysis of root distribution for terrestrial biomass. Oecologia 1996, 108, 389–411. [Google Scholar] [CrossRef] [PubMed]
  30. Yun, L.; Bi, H.; Ren, Y.; Wu, J.; Chen, P.P.; Ma, W.J. Research on soil moisture relations among types of agroforestry system in the Loess Region. Bull. Soil Water Conserv. 2008, 28, 110–114. [Google Scholar]
  31. Kasperbauer, M.J.; Busscher, W.J. Genotypic differences in cotton root penetration of a compacted sub-soil layer. Crop Sci. 1991, 31, 1376–1378. [Google Scholar] [CrossRef]
  32. Van Noordwijk, M.; Purnomosidhi, P. Root architecture in relation to tree-soil-crop interactions and shoot pruning in agroforestry. Agrofor. Syst. 1995, 30, 161–173. [Google Scholar] [CrossRef]
  33. Bolte, A.; Villanueva, I. Interspecific competition impacts on the morphology and distribution of fine roots in European beech (Fagus sylvatica L.) and Norway spruce (Picea abies (L.) Karst.). Eur. J. For. Res. 2006, 125, 15–26. [Google Scholar] [CrossRef]
  34. Ong, C.K.; Black, C.R.; Marshall, F.M.; Corlett, J.E. Principles of resource capture and utilization of light and water. In Tree-Crop Interactions: A Physiological Approach; Ong, C.K., Huxley, P., Eds.; CAB International: Wallingford, UK, 1996; pp. 73–158. [Google Scholar]
  35. Wanvestraut, R.H.; Jose, S.; Nair, P.K.R.; Brecke, B.J. Competition for water in a pecan (Carya illinoensis K. Koch)-cotton (Gossypium hirsutum L.) alley cropping system in the southern United States. Agrofor. Syst. 2004, 60, 167–179. [Google Scholar] [CrossRef]
  36. Harpole, W. Neutral theory of species diversity. Nat. Educ. Knowl. 2012, 1, 31–36. [Google Scholar]
  37. Jose, S.; Gillespie, A.R.; Pallardy, S.G. Interspecific interactions in temperate agroforestry. Agrofor. Syst. 2004, 61, 237–255. [Google Scholar] [CrossRef]
  38. Hanski, L. Some comments on the measurement of niche metrics. Ecology 1978, 59, 168–174. [Google Scholar] [CrossRef]
  39. Abrams, P. Some comments on measuring niche overlap. Ecology 1980, 61, 44–49. [Google Scholar] [CrossRef]
Figure 1. Core fine-root sampling plot of the apple–soybean intercropping system treatments. The fine-root sampling areas in the intercropping area were divided into ten equally sized sections denoted as S1, S2, S3, S4, S5, N5, N4, N3, N2, and N1.
Sustainability 10 03022 g001
Figure 2. Horizontal distributions of fine-root biomass density in (A) apple trees monocropped for 3 years and 3-year-old apple trees intercropped with soybean plants; (B) apple trees monocropped for 5 years and 5-year-old apple trees intercropped with soybean plants; and (C) apple trees monocropped for 7 years and 7-year-old apple trees intercropped with soybean plants. The error bars indicate the standard deviations. The means with different letters within a row and column are statistically significant (p < 0.05).
Sustainability 10 03022 g002aSustainability 10 03022 g002b
Figure 3. Horizontal distributions of fine-root biomass density in monocropped soybean plants and soybean plants intercropped with 3-, 5-, and 7-year-old apple trees. The error bars indicate the standard deviations. The means with different letters within a row and column are statistically significant (p < 0.05).
Sustainability 10 03022 g003
Figure 4. Vertical distributions of fine-root biomass density in (A) apple trees monocropped for 3 years and 3-year-old apple trees intercropped with soybean plants; (B) apple trees monocropped for 5 years and 5-year-old apple trees intercropped with soybean plants; and (C) apple trees monocropped for 7 years and 7-year-old apple trees intercropped with soybean plants. The error bars indicate the standard deviations. The means with different letters within a row and column are statistically significant (p < 0.05).
Sustainability 10 03022 g004aSustainability 10 03022 g004b
Figure 5. Vertical distributions of fine-root biomass density in monocropped soybean plants and soybean plants intercropped with 3-, 5-, and 7-year-old apple trees. The error bars indicate the standard deviations. The means with different letters within a row and column are statistically significant (p < 0.05).
Sustainability 10 03022 g005
Figure 6. Depths of the fine-root vertical barycenter for apple trees and soybean plants with the distance from the apple tree row. The error bars indicate the standard deviations.
Sustainability 10 03022 g006
Figure 7. Below-ground interspecific competition intensity index of 3-, 5-, and 7-year-old apple–soybean intercropping systems. The error bars indicate the standard deviations.
Sustainability 10 03022 g007

