Article

Spatial Equilibrium Allocation of Urban Large Public General Hospitals Based on the Welfare Maximization Principle: A Case Study of Nanjing, China

School of Geographical Sciences, Nanjing University of Information Science & Technology, Nanjing 210044, China
*
Author to whom correspondence should be addressed.
Sustainability 2018, 10(9), 3024; https://doi.org/10.3390/su10093024
Submission received: 18 July 2018 / Revised: 22 August 2018 / Accepted: 22 August 2018 / Published: 25 August 2018
(This article belongs to the Section Sustainable Urban and Rural Development)

Abstract

:
This study aims to utilize the new gravity P-median model to conduct an empirical study for the spatial equilibrium layout of general hospitals in the urban area of Nanjing City, based on multiple requirements for spatial equilibrium, involving spatial equity-efficiency, service utility fairness, and utilization efficiency. The major results are as follows: (1) the new layout can achieve the goal of obtaining a proximate, high-quality medical service in 30 min even for those who reside on the outskirts, which is less than the current 65.6 min. Moreover, the new layout corresponds better to the population distribution and traffic network layout. (2) When compared with several typical characteristics of accessibility to hospitals, including severe gradient variation, five high-value centers, and the efficiency orientation in the current layout, the new demonstrates distinctive ones: comparatively moderate accessibility variation; more relatively high-value areas scattered in different parts of the city; more convenient accessibility on the outskirts; a better balance of the equitable appeal from the inhabitants residing in different areas. (3) The new layout can attain spatial equilibrium at a higher level, the representative indices to measure spatial equity, spatial efficiency, chance fairness, and utilization efficiency have been ameliorated by 54%, 13%, 63%, 14%, respectively. The study reveals that: (1) The new gravity P-median model has the validity and practicability in solving facility location and scale configuration problems with high time complexity, under complicated situations due to multiple targets and multi-agent competition. (2) The model can be applied to decision making related to public infrastructure planning in different types of development areas, by setting concerning parameters or making some minor adjustments to the model in different scenarios. Such research can provide some reference for the location-allocation problem of high-grade facilities in metropolises, and support the decision-making basis for urban infrastructure planning.

1. Introduction

Spatial equilibrium allocation of public facilities is an effective approach to maximize social welfare by allocating public resources rationally [1]. How to balance the equity and efficiency is a critical step to achieve spatial equilibrium in public service resources distribution [2]. Yet, in many circumstances during the process of city development, the authorities concerned have been prone to put more emphasis upon either equity or efficiency at certain development stages, subject to the level of social and economic development. Just as in China, fairness or efficiency have alternately been the dominant orientation for public service resources distribution in each period from the 1950s to the opening up of the economy, and then to the present day. Since the opening up of the economy, especially during the 1990s, China has suffered from a comparatively severe spatial differentiation in the accessibility of city dwellers to high-grade public facilities due to inappropriate allocation. Not surprisingly, the local planning and management authorities tended to lay particular emphasis on efficiency, accordingly, numerous large-scale public facilities, especially the large public general hospitals, have been located in densely-populated areas in numerous Chinese metropolises. Here, large public general hospitals mean the secondary and tertiary general hospitals where the number of beds is no less than 100, hereinafter referred to as general hospitals.
Since the 1990s, the rapid residential population influx to the suburbs has continued, for example, in Nanjing, the resident population has increased from about 5.17 million in 1990 to 8.24 million in 2015, and most of the new residents have forced urban areas to spread outward constantly. Whereas, the allocation of general hospitals has failed to achieve better adaptability to metropolitan spatial expansion due to weak attraction of hospitals caused by a low scale, lower quantity, and insufficient consumption. Inversely, the facilities in central urban areas have suffered from some problems, such as excessive agglomeration, scale expansion, and overload. Therefore, the spatial structural imbalance occurred after the spatial difference between the core area and the suburbs had reached a certain level. Such a spatial structural imbalance has caused the dilemma of realizing spatial equity, financial utilization efficiency, and service utility fairness. Thus, geographical redistribution becomes the necessary approach to rectify the maldistribution of public service resources. How to shift the allocation of general hospitals from relatively severe spatial differentiation to moderate equilibrium has been a focus in some areas in recent years, such as planning, management, and geography [3,4,5,6]. Given these circumstances, this study focuses on the layout optimization and location-allocation problem of general hospitals.
Since the 1980s, the spatial strategic planning of general hospitals has inspired a multitude of scholars from different fields. With the advancement of public facility location theory, operational research models (location-allocation models) have been widely applied by scholars to achieve optimal facility allocation. Given the importance of health and safety in the hierarchy of demands, various and ever-growing studies to discuss the location and allocation of medical facilities have emerged.
The research on medical facility location optimization began in the quantitative era. It continues to develop as a fusion of new welfare economics, operational research, and geography [4]. The research in this field has been very active in the past 40 years. In early studies, Bennett (1981) [7], Phillips (1986) [8], and Scarpaci (1987) [9], as well as others, discussed the location selection and location effect of different medical facilities. Later, a group of scholars applied location-allocation models [10,11,12,13], spatial analysis and calculation [14,15,16,17,18,19], and other methods to discuss the location problems of medical facilities. Among them, the general hospitals [14,17,19,20,21] and emergency facilities [22,23,24] location issues have attracted more attention. Overall, since the 1990s, with increasingly complicated social backgrounds due to the impact of supply policy, market demand, capital operation, and other factors, major attention has been paid to research on complex models. The construction or improvement of multi-objective, hierarchical, random, competitive, and other complex location-allocation models has aroused great interest in scholars [3,10,11,21,25,26].
On the whole, scholars have brought public behavior patterns and the external spatial effects of facilities into the location models more accurately. They have been striving to promote the birth of more scientific, standardized, structured location-allocation models by absorbing oriented policy and integrating social reality scenarios. Given such ideas, the new gravity P-median model was built based on integrating a list of partial modifications to the P-median model [6].
The new gravity P-median model was introduced to cope with the imbalance and new competition situation [6], which has been enhanced among different providers due to governmental deregulation of health care systems [27], and to explore the model’s validity for the spatial equilibrium allocation of general hospitals on a large spatial scale, such as that of a metropolis. The logical framework of this model is shown in Figure 1, and the model construction process is explained in Section 2.2. The conceptual framework can be seen in Figure 2 and Section 2.1. Other relevant subjects will be elaborated in the other sections below.
The rest of this paper has four parts: Section 2 shows the methodology and material, including the connotation analysis and decomposition of “spatial equilibrium”, the mathematical expression, and construction ideas of the new gravity P-median model, the explanation of related data and parameter selection; Section 3 carries out the analysis of the empirical results; Section 4 includes related discussions; and Section 5 presents the final conclusions.

2. Methodology and Materials

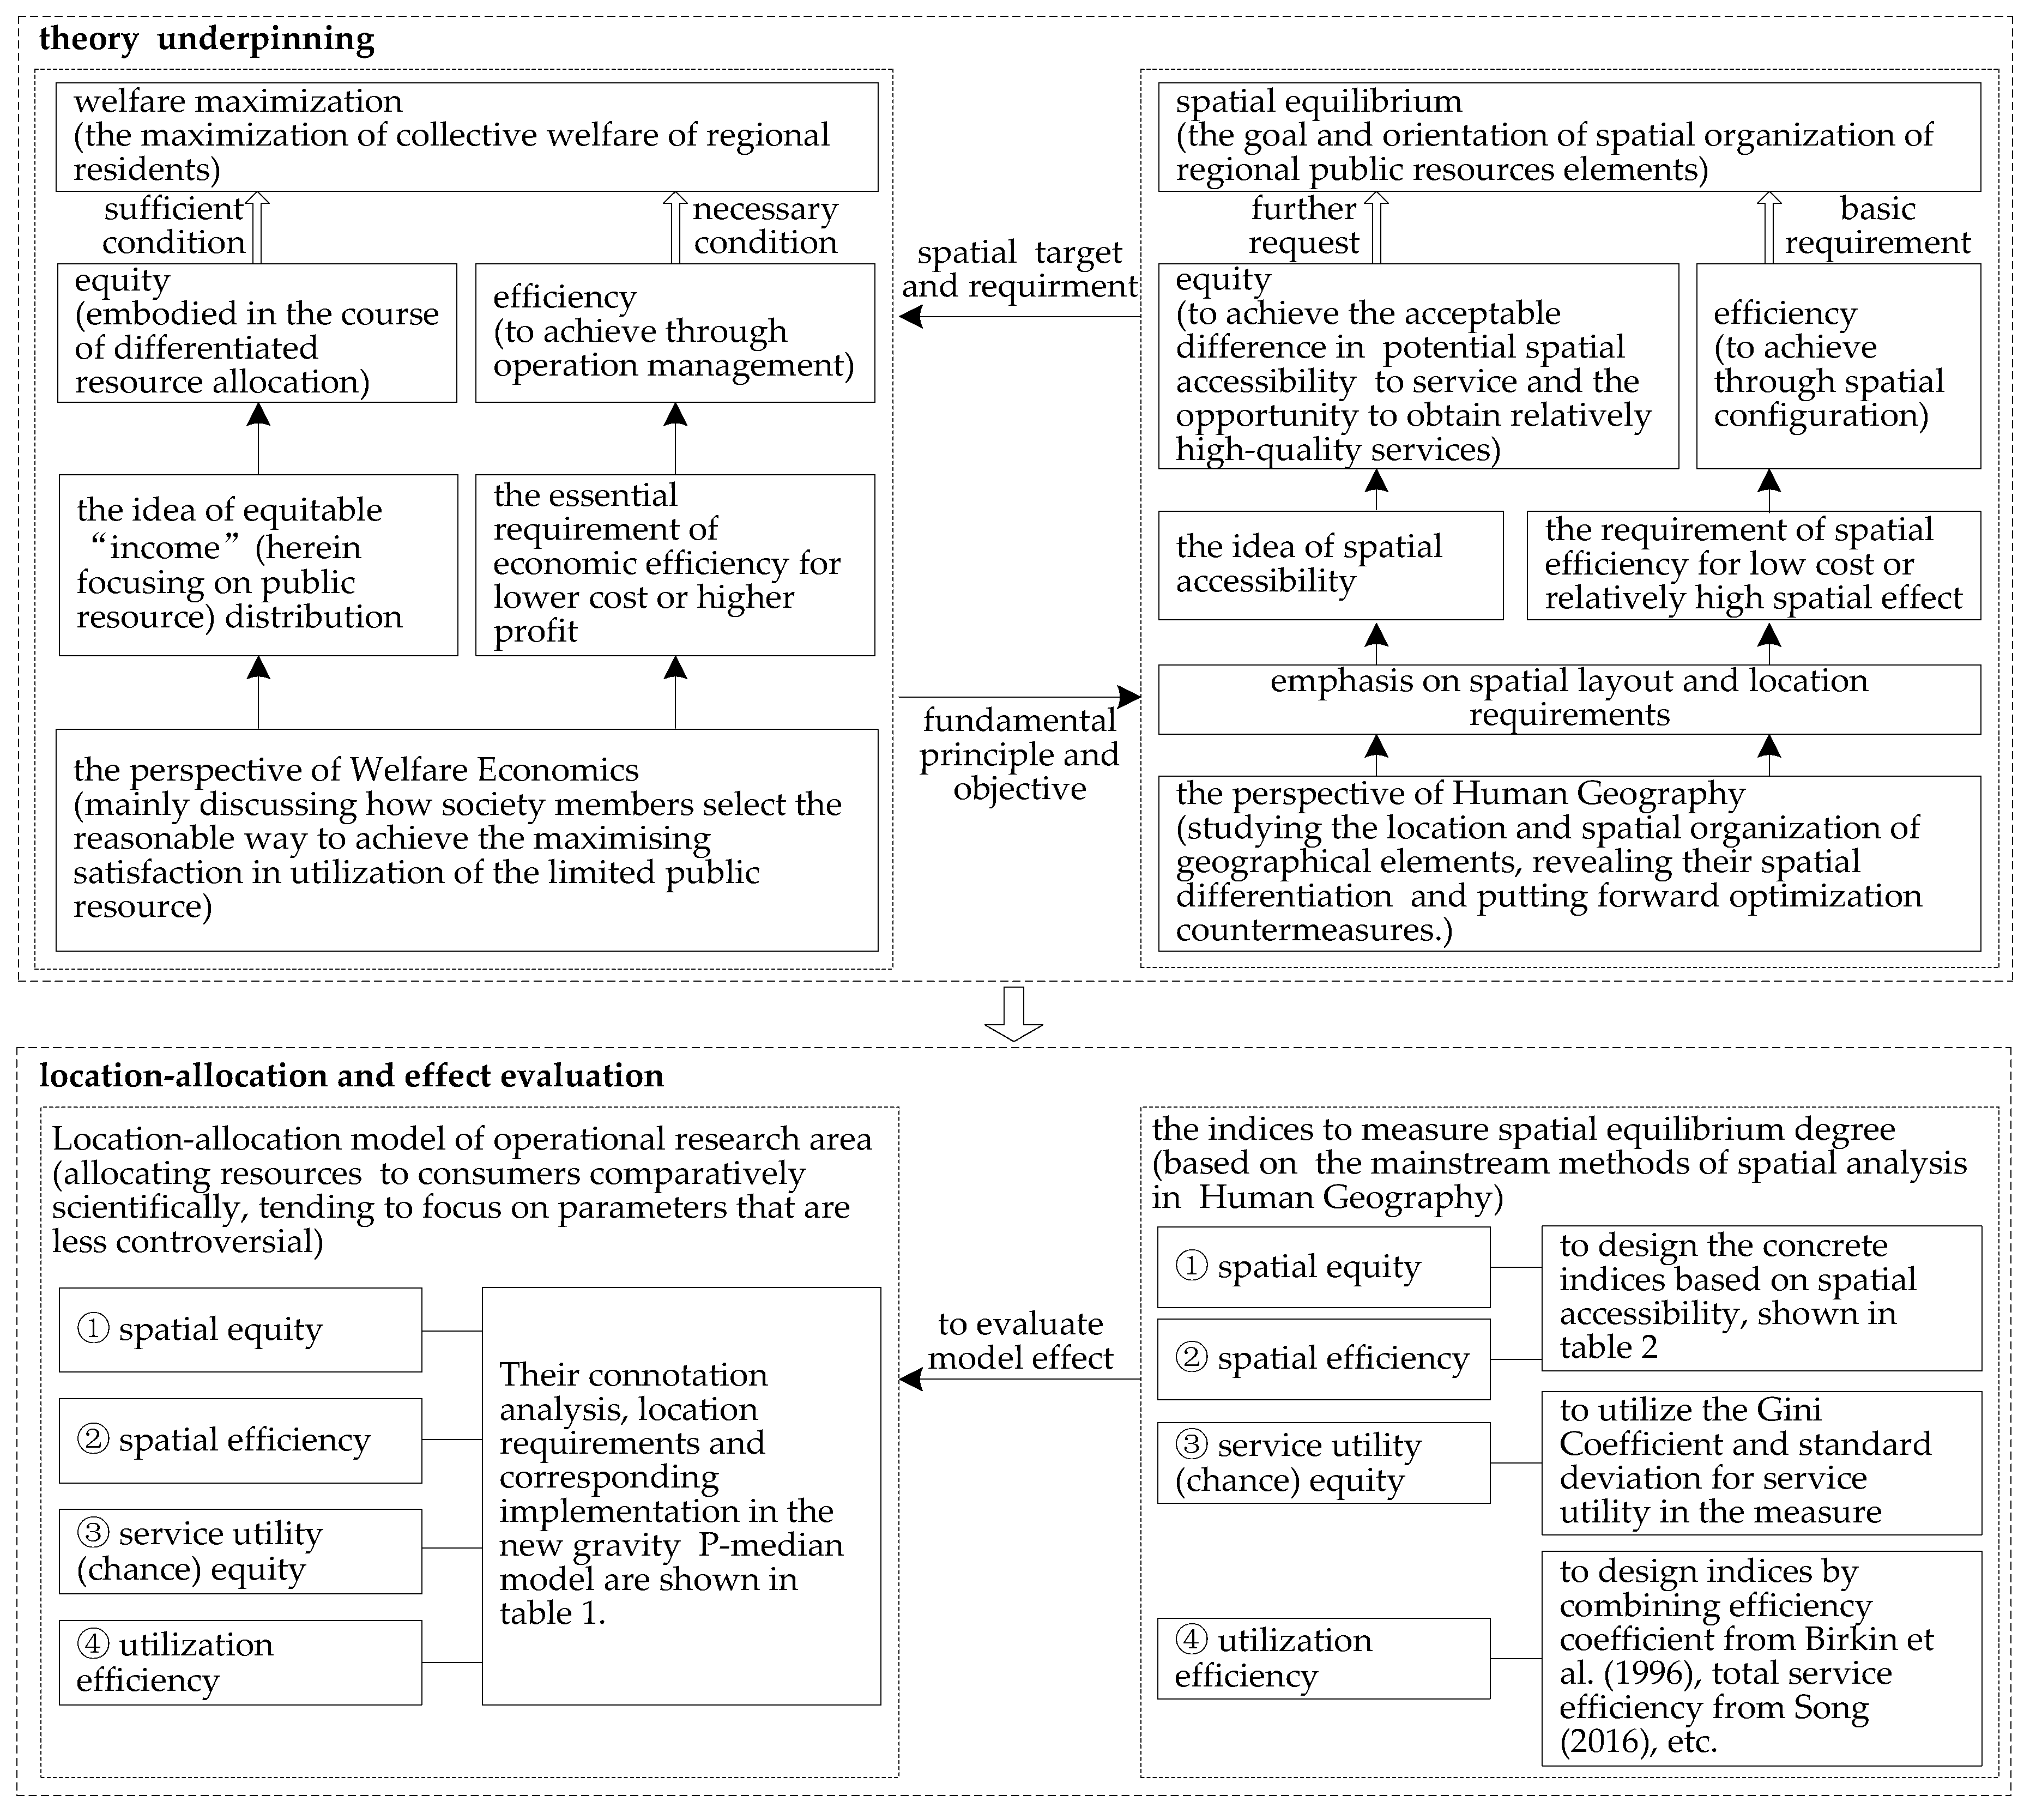
2.1. Spatial Allocation Goal of Urban General Hospitals—Spatial Equilibrium

The definition of the term ‘welfare maximization’ has long been discussed by scholars. We claim that it is welfare maximization for the majority of regional residents, achieving a relatively high spatial effect with a low total cost, based on balancing the efficiency and equity [28]. Moreover, the realization of integrating efficiency and fairness at the spatial level can be considered to achieve the decision orientation of spatial equilibrium [5,6,11,29].
Spatial equilibrium is almost the fundamental goal of public facility spatial distribution, which can bring about numerous profits to regional social sustainability and public welfare rational distribution [1]. Currently, numerous scholars have discussed and focused on either spatial efficiency or equity in the distribution of facilities, including Mirchandani and Francis (1990) [30], Marsh and Schilling (1994) [31], Drezner (2004) [32], Tsou et al. (2005) [33], Drezner and Drezner (2007) [34], Yasenovskiy and Hodgson (2007) [11], Puerto et al. (2009) [35], Ma et al. (2017) [36], Wu et al. (2018) [37], and so forth. Nevertheless, there is less literature discussing how to achieve all-round “social welfare maximization” and “spatial equilibrium” at the level of the location of public facilities.
Obviously, to achieve spatial equilibrium of general hospitals, the coordination of both equity and efficiency are required [38]. Taking one city as an example, on the one hand, it is necessary to serve as many social members as possible within the limited resources of the public financial budget, based on the overall interest of all citizens, which is consistent with the idea of economic efficiency as the primary aim in Welfare Economics (shown Figure 2). On the other hand, the equality of opportunity to access high-quality medical resources should be valued, based on the desire of the social individual, which is in accordance with the concept of reasonable distribution as the desirably critical aim in Welfare Economics (shown in Figure 2).
It will be more comprehensive to analyze equity and efficiency as based on the interests of both the supply and demand sides from the perspectives of geography and economics (Table 1). When taking public demand as the starting point, spatial equity mainly refers to the fairness of convenient travel to health facilities for residents, which puts emphasis on nearby access to services within certain travel costs [33]. According to the same starting point, from the perspective of economic service utility, equity means the fairness of service quality to ensure that residents can receive relatively fair and high-quality services within the range of acceptable difference, which is closely associated with appropriate scale selection for each facility [5,6]. Whilst, starting from the strategic orientation of governmental financial resource utilization, spatial efficiency from the geography perspective mainly refers to the pursuit of overall travel cost minimization [4,5,6,10,34]. Consequently, the majority of large-scale facilities are usually located in densely populated areas to achieve this goal. From the perspective of economics, efficiency refers to financial utilization efficiency, which is largely determined by the facility scale effect, and is also achieved by guaranteeing the minimal scale.
Considering the interaction of supply–demand and the connotation of spatial equilibrium, the goal of spatial allocation of general hospitals in the vast proportion of Chinese metropolises should be positioned inclining slightly toward efficiency, meanwhile, ensuring equity over a long period of time. The spatial configuration requirement can be positioned as follows: the hospitals should have a relatively concentrated distribution owing to more emphasis on spatial efficiency by configuring those superior resources to densely-populated areas with excellent traffic conditions, which can contribute to efficient travel for almost all residents, whilst, from the angle of spatial equity, convenient access by all residents to services should be ensured, by establishing restrictions of maximal travel distance to the facilities. Additionally, limiting the minimum scale of hospitals and calculating the appropriate scale of each facility under the total scale constraint can be conducive to achieving the equity and efficiency requirements from the perspective of Economics.
It is notable that the key point is to clarify the correlation among welfare maximization, spatial equilibrium, and equity-efficiency (shown in Figure 2). Additionally, the aforementioned allocation goal will be decomposed into an objective function and constraint conditions in Section 2.3. Briefly, the idea of welfare maximization is linked with spatial equilibrium under the equity-efficiency game, and can be realized in the decision-making of facility location. Then, spatial equilibrium measurement is directed to a series of layout evaluation indices (shown in Table 2 in Section 3.2).

2.2. The Construction Process and Mathematical Expression of the New Gravity P-Median Model

2.2.1. Probability Rule

Notably, location-allocation model construction or application is actually an optimization problem or mathematical programming problem [10,39,40]. The allocating rule is the core part of the framework of location-allocation models, and it refers to how the demand point makes a spatial connection with the target point. Generally, for general hospitals, when residents go for the first visit before diagnosis, which is a specific condition in this paper, the spatial interaction between supply and demand is highly consistent with the random probability rule [6].
The realistic scenario of the probability (gravity) rule was illustrated and abstracted based on the spatial interaction between the supply side and the demand side. Primarily, the geographical implications for the supply and demand sides should be explained. The supply side is usually characterized by facilities located at certain points in spatial analysis. The demand side refers to the groups who reside at each demand point respectively corresponding to geographical units for the certain scale, which can usually be characterized by the community point, town point, and what not. In many studies, one settlement point is usually taken as the entire unit. Hence, the choice of these dwellers in one unit is assumed to be consistent. Given the interaction between supply and demand, the probability that the customers originating from one demand point divide their patronage among all the general hospitals of the study area is proportional to the technical level of one hospital, usually characterized by the hospital scale, and is inversely proportional to the distance to the freely-selected hospital. This approach is consistent with the idea of the Huff model [41]. Such a method of assigning consumers to the linked facilities based on the probability calculation is the probability (gravity) rule [34].

2.2.2. The Construction Process of the New Gravity P-Median Model

The classic P-median model has been well researched in the literature (see, e.g., Reference [34,42,43,44]), as the basic formation to build the new model. As noted by Owen and Daskin [43], the P-median model is used to find the location of P facilities so as to minimize the total demand-weighted travel distance between customers and facilities. In this model, demands will naturally be assigned entirely to the nearest facility, and all facilities are implicitly assumed to have equal capacity. Accordingly, three limits can be found in it. Firstly, the objective is limited to be a one-way efficiency orientation [44]. Secondly, the consumers are directed by a central command to the closest facility [34]. Thirdly, the scales of all facilities are neglected and assumed to be equal [45,46]. To overcome these limitations, the corresponding improvements were achieved in the new gravity P-median model, which were constructed and tested by us in a smaller area with a lower data magnitude [5,6].
We developed the new gravity P-median model through the modification of the P-median model, from four aspects of the distribution rule, spatial equilibrium achievement, minimum capacity threshold, and appropriate scale, for each facility. It is notable that we formulate the problem on a network. The construction process is as follows, and the relevant parameters and formulas can be found in the “notations and models” below.
(1) The allocation rule was innovated based on the probability (gravity) rule, as mentioned above in Section 2.2.1 and absorbed from Drezner and Drezner (2007) [34], to replace the central command rule. The concrete process is that: first, we define the free selection probability that the customer residing at demand point i is served by a facility located at node j is Aij/Ai, in Equation (1) below. “Aij” refers to the potential accessibility that the customer residing at demand point i patronizes the selected facility located at node j, and “Ai” refers to the potential accessibility that a demand point i is served by all the facilities for the set of facilities P [47]. Second, the “probability” is brought into the objective function of the “classical” P-median model. Third, the parameter “Yij” in the P-median model is replaced with “Xj”, which can enable all demand points to establish contact with their selected facility for the set of facilities P. Thus, the new objective function Z of Equation (1) below was formed.
(2) The spatial equity target was introduced in the model, which can contribute to the spatial equilibrium achievement with efficiency, rather than the single spatial efficiency orientation, as in the P-median model. The spatial efficiency target can be achieved by the objective function, as Equation (1). Such fulfilment can be beneficial to the welfare authorities to support relatively convenient and efficient health services with limited financial resources.
Whilst, the spatial equity can be achieved through drawing the maximum travel cost D0 into the constraint conditions, which can ensure that each demand point can harbor the opportunity to access the relatively high-quality service, it can remedy the deficiency caused by the single efficiency target. The relevant constraint conditions involve Equations (8)–(11).
(3) Solving both the location and scale simultaneously was achieved by imbedding the scale factor Qj which characterize the service capacity of facility j into the “classical” P-median model, as in Equation (1). Each Qj can contribute to the chance fairness of city dwellers to access the public service [44] and the facilities’ utilization efficiency [5,6]. The relevant constraint conditions are related with Equations (4) and (5).
(4) The introduction of “Q0”, the minimal scale of a single facility, is the basic guarantee of high-quality service and is selected based on the current facilities management guidelines. It will exert positive effects in supporting the differential services within the acceptable range, accomplishing the chance equity for service quality, and effectively guaranteeing the utilization efficiency of facilities. The relevant constraint conditions are related with Equations (6) and (7).
Through the modification, the new gravity P-median model can be written as Equations (1)–(11). The necessary notations are as follows:
Notations:
Let:
Z 
be the objective function;
N 
of cardinality n, be the set of all numbers of alternative facility nodes or, N = {1, 2, …, n};
M 
of cardinality m, be the set of demand points, M = {1, 2, …, m};
N0 
be the set of non-negative integers;
i  
be the index of the demand node;
j 
be the index of the potential facility site;
P 
be the amount of facilities located, and the set of facilities, jP;
Wi 
be the demand quantity for demand point i;
Dij 
be the travel cost between demand point i and facility j, which can be distance, time, expense, and the like;
Ej 
be the demand population scale competition coefficient of a facility located at node j;
K 
be the total scale of all facilities;
β 
be the distance attenuation coefficient, in this study the distance function applies the power exponent form;
Aij 
be the amount of potentially accessible service resources of the customers residing at demand point i served by the facility located at node j, which in this article refers to the general hospital j;
Ai 
be the total amount of the potentially accessible service resources of demand point i patronizing all facilities in the study area;
D0 
be the maximum travel cost between a demand point i and the corresponding adjacent facility;
Qj 
be the capacity (scale) of each facility j, and, for general hospitals, it is usually characterized by the number of beds or personnel;
Q0 
be the minimum scale of a single facility;
Xj 
be the 0/1 decision variable, taking 1 to indicate that the location of j has one facility, and taking 0 to represent the opposite;
Yij 
be 0/1 decision variable, taking 1 to indicate that the facility j can provide service for the demand point i, taking 0 to means the opposite.
Models:
Min   Z = i M j N A i j A i W i D i j X j ,   among   them ,   A i = j = 1 n A i j = j = 1 n Q j D i j β E j ,   E j = i = 1 m W i D i j β
Equation (1) minimizes the total demand-weighted distance based on the probability. This is the distance travelled by all customers residing at each demand point to the facilities for the set of facilities P.
  j N   X j = P
Equation (2) refers to the total number of all the located facilities, P, within the study area.
X j { 0 , 1 } ,   j N
Equation (3) refers to whether there is a facility located at the candidate j; 0 means no, 1 means yes.
Q j N 0 ,   j N
Equation (4) refers to service capacity or scale Qj of each facility, Qj is a non-negative integer.
  j N   Q j = K
Equation (5) refers to the total service capacity of all facilities located within study area is K.
Q 0 Q j ( 1 X j ) × 1000000 ,   j N
Equation (6) limits the scale of candidate points with facilities to be more than Q0, and 1,000,000 represents a very large number.
Q j 1000000 × X j ,   j N
Equation (7) limits the scale of candidate points without facilities located to be 0, and 1,000,000 represents a very large number.
Y i j   { 0 , 1 } ,   i M ,   j N
Equation (8) means whether the demand point located at node i can establish a connection with a facility located at node j; 0 is no, 1 is yes.
Y i j X j ,   i M ,   j N
Equation (9) limits that one demand point i can only patronize the candidate point where a facility is located.
j N Y i j = 1 ,   i M
Equation (10) means one demand point must, and can, only select one facility at a time.
D i j Y i j D 0 ,   i M ,   j N
Equation (11) refers to the distance between one demand point i and the connected facility j which should be within Do.
As stated in Song et al. (2016) [6], according to the classical P-median model, the facilities tend to be located in densely populated areas with convenient transportation conditions to ensure total travel efficiency. Nonetheless, the new gravity P-median model endeavors to simultaneously consider the population and traffic situation, the interaction between supply and demand, financial costs, and other factors, and to search for a new layout solution relatively close to the actual needs.

2.3. Empirical Area and Data Preparation

2.3.1. Empirical Regional Introduction and Basic Data Acquisition

In this paper, the nine counties of Nanjing City, except Gaochun District and Lishui, hereinafter referred to as the Nanjing urban area, were selected as the empirical area. Given that we have lived in Nanjing, one of China’s metropolises, for many years and have gone through the process, in which urban expansion was incompatible with public service resources allocation, we selected this city as our study area. Fortunately, we can obtain the necessary and reliable data more swiftly. The basic data of the general hospitals, communities, population, and traffic network were from obtained from the respective authorities, and their locations were verified according to a Baidu map to confirm whether the location was unchanged, which disclosed and updated the basic geographic information of the overwhelming majority of social and economic objects of each Chinese city.
(1)
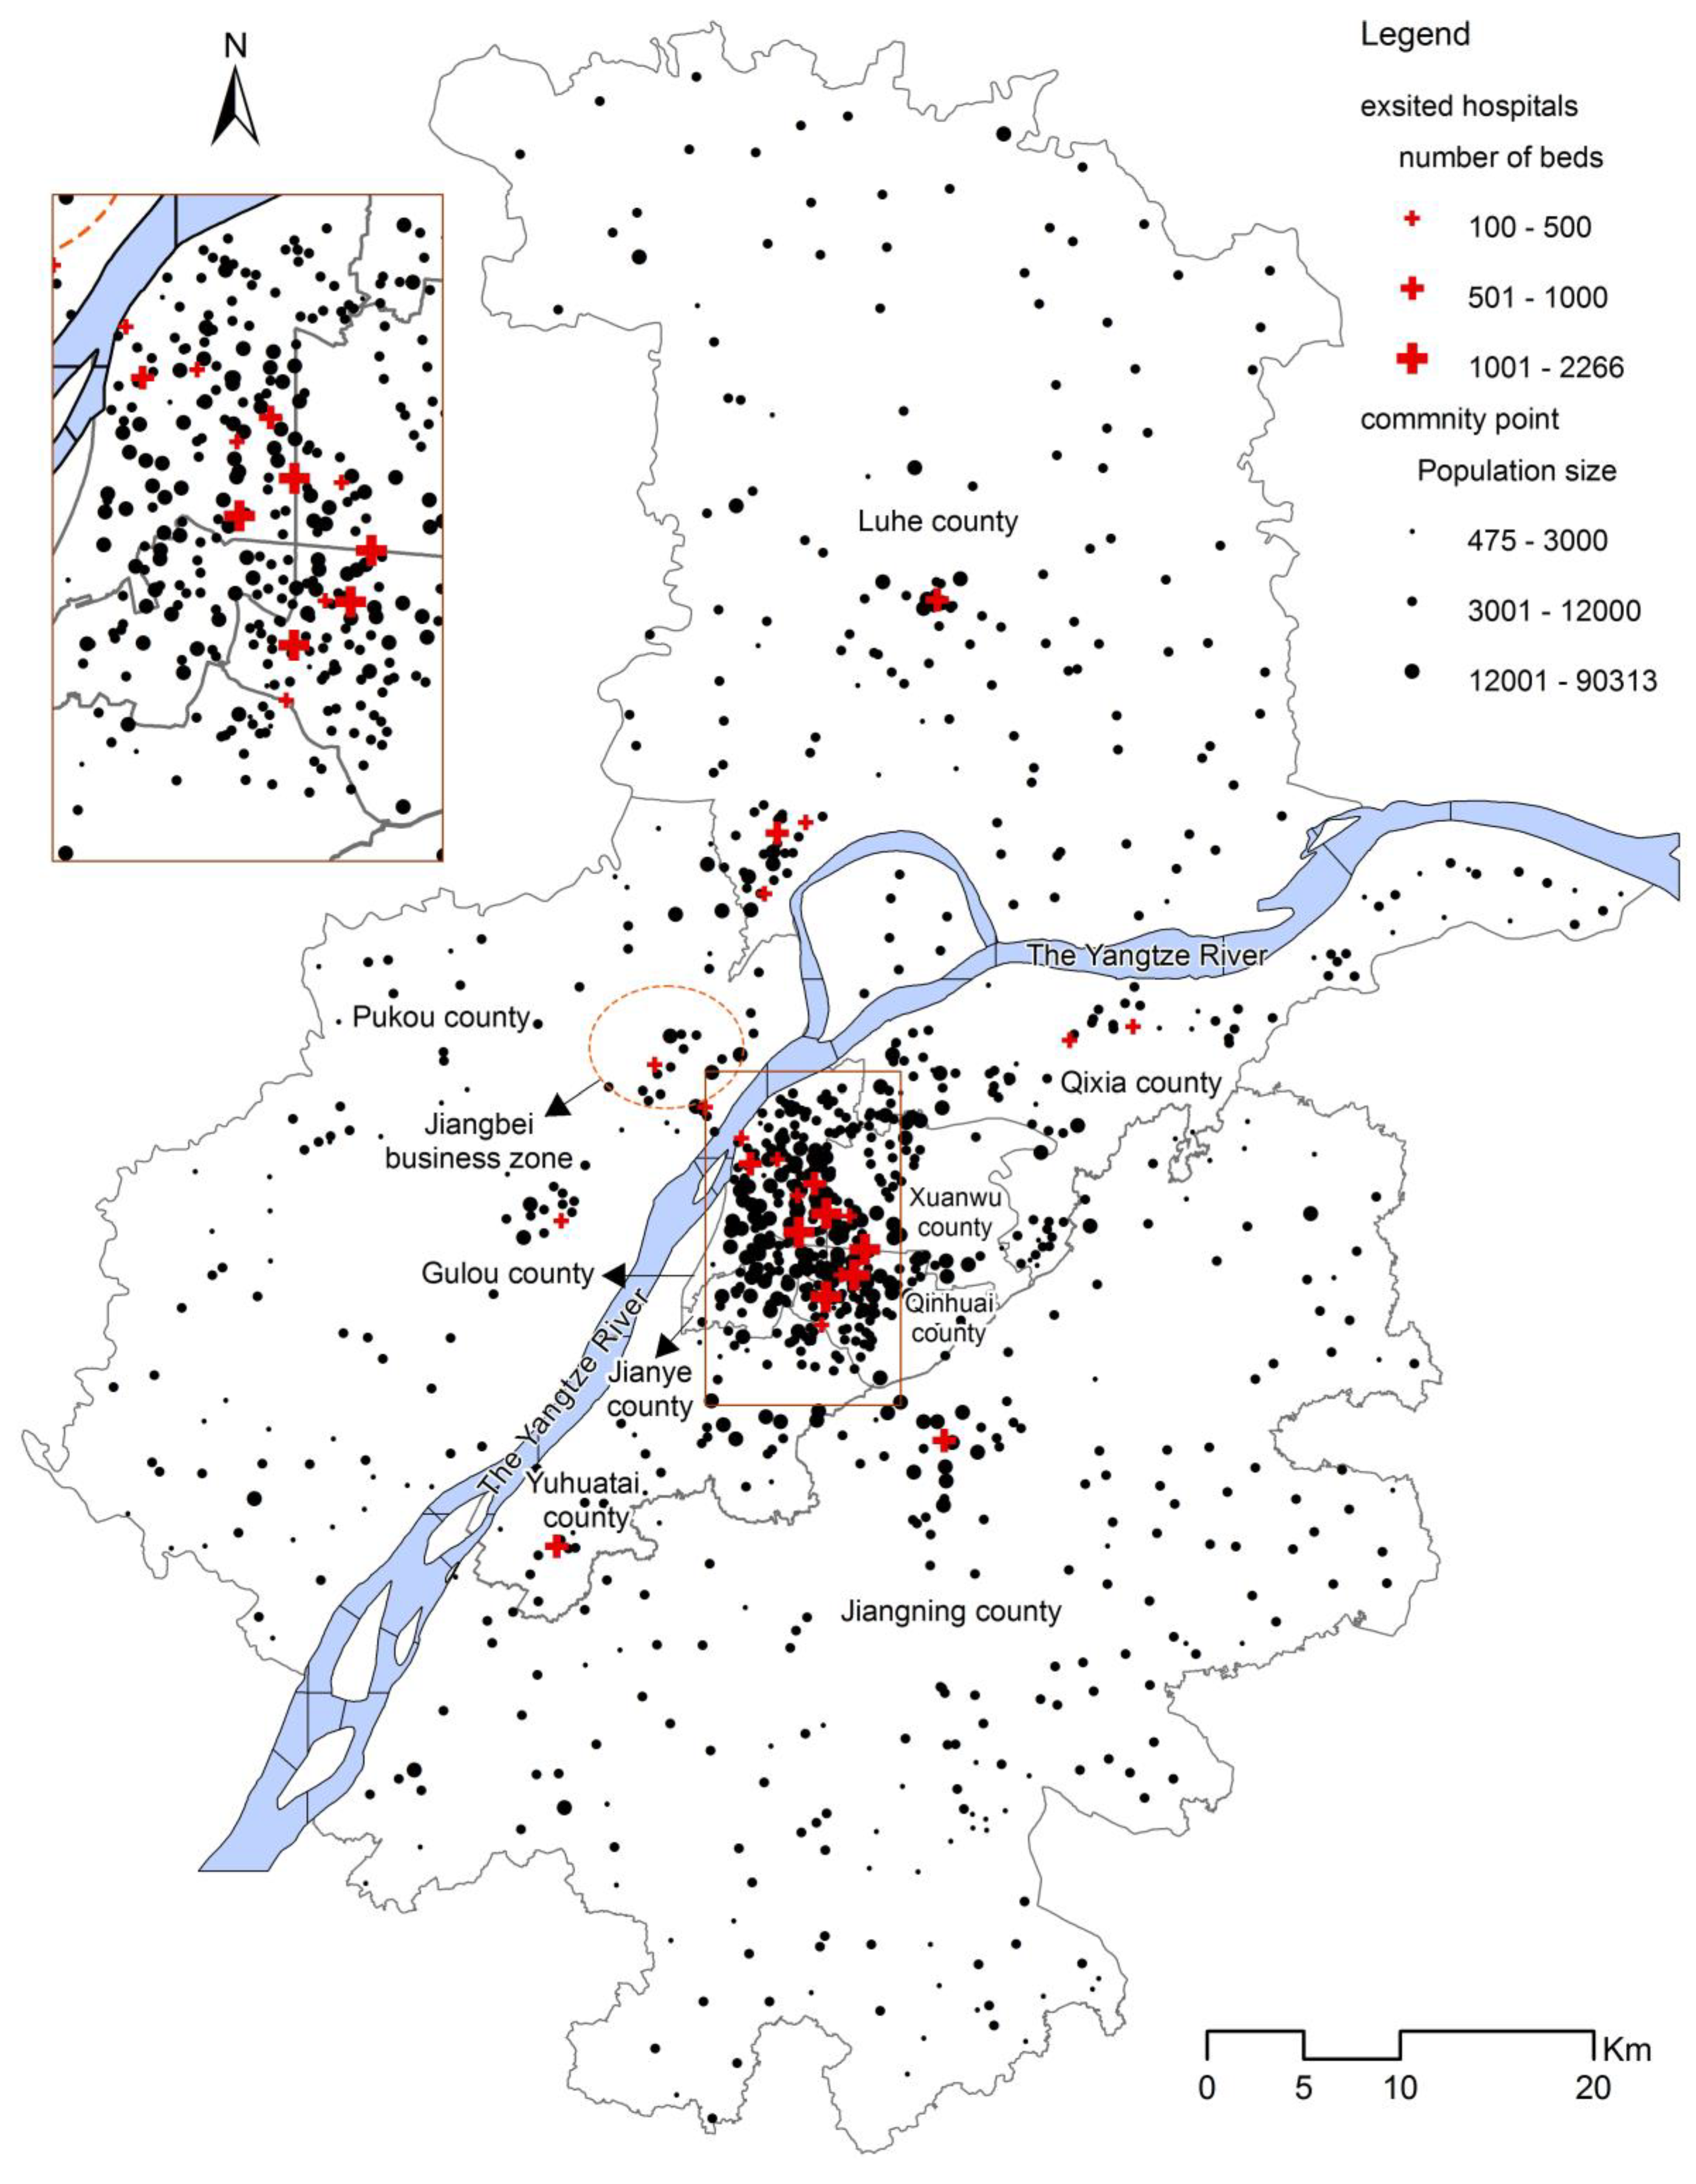
Current facility locations and scales: By the end of 2013, there were 25 secondary and tertiary general hospitals and about 7,348,000 residents in the study area (Figure 3). They were mainly located in Gulou, Xuanwu, and Qinhuai District, all with dense populations. The bed number is selected to represent the hospital’s scale. Thus, the total beds of 25 hospitals amounted to 15,843, with an average number of beds per thousand people of approximately 2.16.
(2)
Determination of demand points: The 949 communities (villages) were selected as study units, and the administrative centers as demand points for all i.
(3)
Facility candidates: The candidate locations for all j consisted of 949 settlements and 25 current hospitals.
(4)
The travel time calculation under traffic network optimal path: The travel time Dij by car (bus and taxi) or subway was selected to measure the travel cost of residents to go to hospitals. The speed for each level road was determined by Technical Standard of Highway Engineering (JTG B01-2003) issued by Ministry of Communications of China in 2004. The main road network was supplemented by the 500 m × 500 m grid, to replace the lane (a street, often a narrow one with buildings on both sides), and the default speed for the roads that the grids represented was 10 km/h. The calculation of the shortest access time between hospitals (alternative points) and demand points was completed based on the optimal route in the ArcGIS Workstation or ArcView 3.3 software from American ESRI Company.

2.3.2. Determination of Key Constraints or Variables in the New Gravity P-Median Model

(1)
Facilities amount, P:
The first step to decide where to locate the hospital is to determine the number, which is based on the current hospital allocation policy for preliminary judgment and, ultimately, can be determined by comparing the fairness and efficiency of different layout schemes. In this study, the hospital number is not taken as an object of inquiry. In fact, the determination of the number will require significant effort. We assumed that the number of secondary and tertiary general hospitals in the optimization was the same with the current layout, that is, P = 25.
(2)
The minimum facility scale, Q0:
According to the current regulation on the minimum scale of secondary general hospitals, a bed number of 100 is the minimum scale of each facility.
(3)
The maximum travel cost, D0, among the costs of all demand points to the nearest hospitals:
The D0 value was determined by the present accessibility situation and by questionnaires. The parents or other family members of elementary and middle school students completed about 400 questionnaires. In this survey, we sent out 600 questionnaires. The ideal travel time of the residents to the nearest hospital was determined to be 30 min.
(4)
The service capacity amount, K, of all facilities:
The new model was discussed in a relatively static framework. The total service capacity of all facilities was set to be remain at 15,843 beds.
(5)
Attenuation coefficient, β:
It was determined to be 2, based on the experimental comparison.

3. Results and Analysis

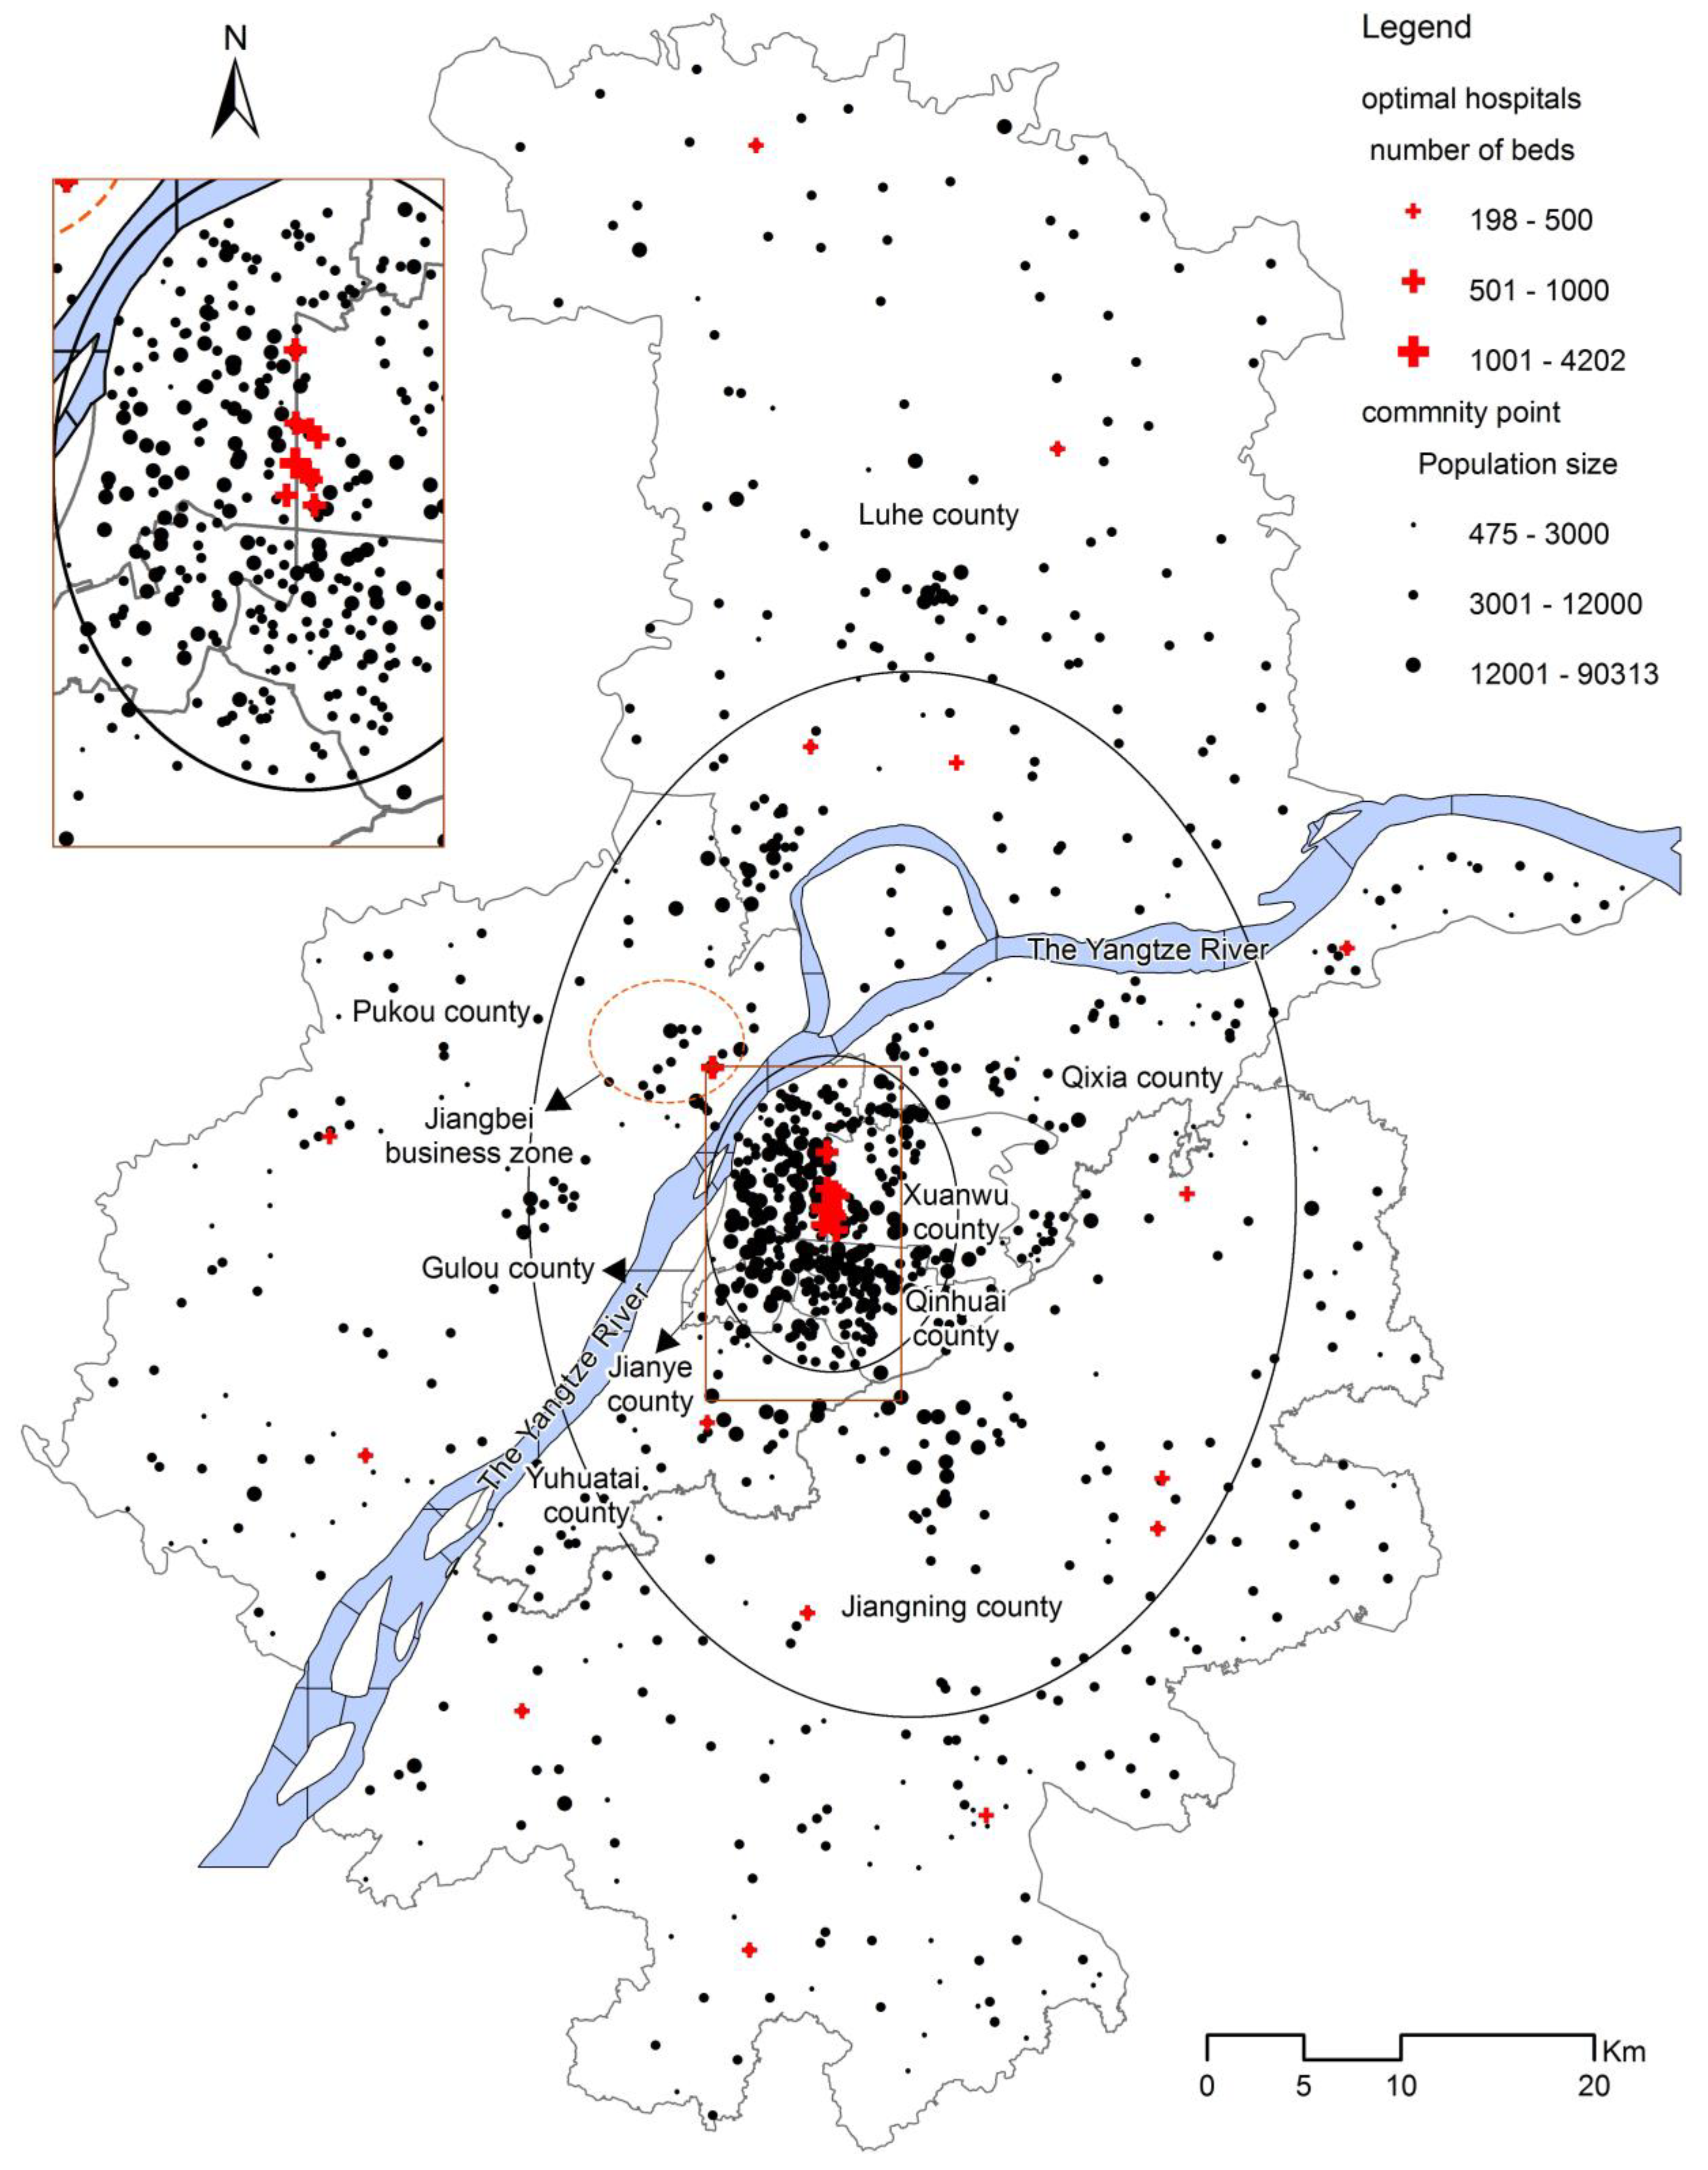
3.1. Spatial Distribution Description of Current and Suggested Hospitals Layouts

We selected AIMMS (3.13 Edition) as the operating platform, which is one of the five most important algebraic modelling languages and is from AIMMS B.V. (formerly named Paragon Decision Technology B.V.) with offices in The Netherlands, United States, China, and Singapore. We applied the Cplex12.5 solver to perform calculations. The model solution was achieved by an embedded branch and bound algorithm. After a number of experiments, the relatively appropriate result was selected.
In the current layout, some areas with rapid population expansion, such as the east of Qixia County (Xianlin region and Longtan town), Jiangning District, and part of the Jiangbei New Area (Pukou District, Luhe District and Baguazhou Town of Qixia District) suffered from a shortage of hospitals (Figure 3). It is obvious that many parts of the current layout are incompatible with the population distribution and overall transportation conformation.
On the contrary, among the calculated locations, a hospital is in the same location, and the remaining 24 are reconfigured (Figure 4). The new layout of the hospitals is relatively balanced and can achieve a convenient medical service for residents. On the basis of the scale gradient, the distribution presents three major levels: First, in the core area of the city, there are nine large hospitals, which can effectively guarantee the medical needs of the most densely populated areas. Among them, one is located in the site of current Gulou hospital with 4202 beds, and the number of beds of each of the other eight hospitals is approximately 700–800. Second, eight hospitals in the second scale gradient can mainly ensure the residents of the transition region have access to adjacent hospitals. Among them, most hospitals have 300–500 beds, and only the scale of the hospital near the Jiangbei business zone reaches 600 beds. Third, the eight smaller hospital scales are 200–350 beds, which can effectively realize the requirement of residents of the marginal area to obtain relatively high-quality medical services from nearby hospitals within 30 min. In short, it can achieve the goal of enabling the residents to reach the nearby high-quality medical service in 30 min even for those dwelling in the outskirts, which is less than the current 65.6 min.

3.2. The Spatial Effect of Optimal Allocation

The location result is able to meet a series of requirements: to match with the population distribution and traffic conditions, to ensure convenient access to high-quality medical services, and so on. Accordingly, it is relatively effective in achieving spatial equilibrium. Concretely, the new spatial layout of hospitals can coordinate the equity with efficiency in terms of spatial travel and economic utility.
On the basis of the accessibility analysis by the improved potential model [47], the rationality of hospital layouts was evaluated before and after optimization. In the current layout, more general hospitals are concentrated in the urban core area and, oppositely, the majority of others are scattered in the outskirts or those transitive areas between the core and the outskirts. Moreover, Figure 5 shows that the current spatial accessibility is significantly different and more hierarchical, with five high-value centers, which fully characterizes the spatial efficiency orientation. It is notable that this has been interpolated by the Kriging interpolation method, based on the value of accessibility for Ai that the demand point i patronized all the selected facilities. It enables us to obtain the area-covering information using this geo-statistical analysis.
The reason why Kriging interpolation is selected is that the Kriging method, as the typical geo-statistical method, can not only quantify the spatial autocorrelation among the given points, but also explains the spatial distribution trend or characteristics of sampling points within the predicted area. Consequently, it is better than other ordinary deterministic interpolation methods. In terms of the spatial autocorrelation of data, the verification is achieved by semivariogram/covariance analysis in Kriging interpolation in the ArcMap 9.3 software from American ESRI Company. Through the analysis, the “Partial_Sill/Sill” values of the current and suggested layout are 0.93 and 0.45, respectively. Meanwhile, the values of Moran I exponential in the current and suggested layout are 0.18 and 0.25, respectively. It is notable that the Moran′s I index is positive, indicating a clustering trend. Accordingly, it can be concluded that the spatial autocorrelation exists among the accessibility values of the demand points in the current and new situation, and as the regionalized variables, which can satisfy the applicability constraint to conduct Kriging interpolation. Another item, in terms of the different types of Kriging, technically and theoretically, there is no denying that the interpolation of the Universal Kriging is better than the Ordinary Kriging and the Simple Kriging. Accordingly, the Universal Kriging is determined to reveal the spatial distribution feature of Ai, by integrating the scope of the application and advantage of each kind of Kriging method.
In contrast, Figure 6 shows that the accessibility gradation is more moderate in the new layout. The standard deviation of it is about 3.10, less than 22.71 in the current situation. There exist no fewer comparatively high-value areas which belong to several different levels, respectively, and they are scattered in different parts of the city, which is distinctly different with fewer outstanding high-value areas concentrated in the central urban area in the current situation. What specifically needs to be explained is why the standardized values of Ai are comparatively high in the west of Pukou County and moderate in other areas, for example, in the east, southeast, and northwest areas of the city. The reason for this is that the dwellers in the west of Pukou County are fewer in number than many other areas. Consequently, even if there is only one hospital located in this area, it can be conducive in bringing about the comparatively high potentially accessible service resources of demand point i by patronizing the adjacent general hospital(s) here. Meanwhile, there are more dwellers residing in many other areas, and even if there are comparatively more hospitals located to support the convenient service resources, the Ai values can just reach a moderate level.
Notably, the new layout can improve the accessibility of the dwellers residing in the outskirts. Hence, the new layout can better balance the equitable appeals from the dwellers originating in different areas. In essence, comparing the current layout, the equitable degree for all the residents to potentially access the service resources has been feasibly improved in the new situation.
One intractable flaw is that several hospitals are not located in the current urban functional centers, such as the administrative centers or population centers, but are basically in line with the population agglomeration centers of planning or developing regions.
Table 2 presents the new layout according to the new gravity P-median model calculation, showing the relative superiority in the comparison of key indices. First, compared with the current layout, the optional one shows a significant advantage in the promotion of fairness. The maximum time and average travel time from the demand points to the nearest hospitals, which is usually used to evaluate the spatial equity [5,6], reduces by 54% and 30%, respectively. The promotion of service utility (chance) fairness is also very prominent, and the Gini Coefficient of potentially accessible service resources to the number of residents decreases by nearly 30% after distribution optimization, and the standard deviation of the service utility with the time factor reduces to 37% of the current situation. Notably, it emphasizes the opportunity to reach the service for each settlement and is closely related to the time accessibility to one hospital, which can reflect the access chance fairness within a certain time, different from the common public economic utility [33]. Second, in the new layout, regarding the two indices of spatial efficiency, the residents covered by the quantity ratio within 30 min has risen by 13%, and the total travel efficiency can maintain a considerable level of strength, which was measured by the weighted average travel time from all the demand points to hospitals [5,6]. The calculation process is stated as follows: the initial step is to calculate the weighted travel time sum based on the probability of each demand point to patronize one hospital with Equation (1), and then it is divided by the population of the empirical area. In terms of the utilization efficiency, whose formation is based on the inspiration from Neo-utilitarianism social welfare function put forward by Vickrey W. and Harsanyi J. C., and some service efficiency calculation methods raised by Birkin et al. (1996) [48], Deverteuil (2000) [4] and Song (2016) [5], the service utility scale has been improved by 14%, and the average of potentially accessible service resources of all demand points has increased by 14%.
Through the above comparative study of spatial distribution and spatial effect before and after optimal layout, a list of further recognitions based on the elementary results can be drawn as follows:
(1)
The new layout of the hospitals is relatively more convenient for residents, more fitting for the population distribution and traffic network layout. Moreover, the new location-allocation result is consistent with the three circles of population and transportation distribution.
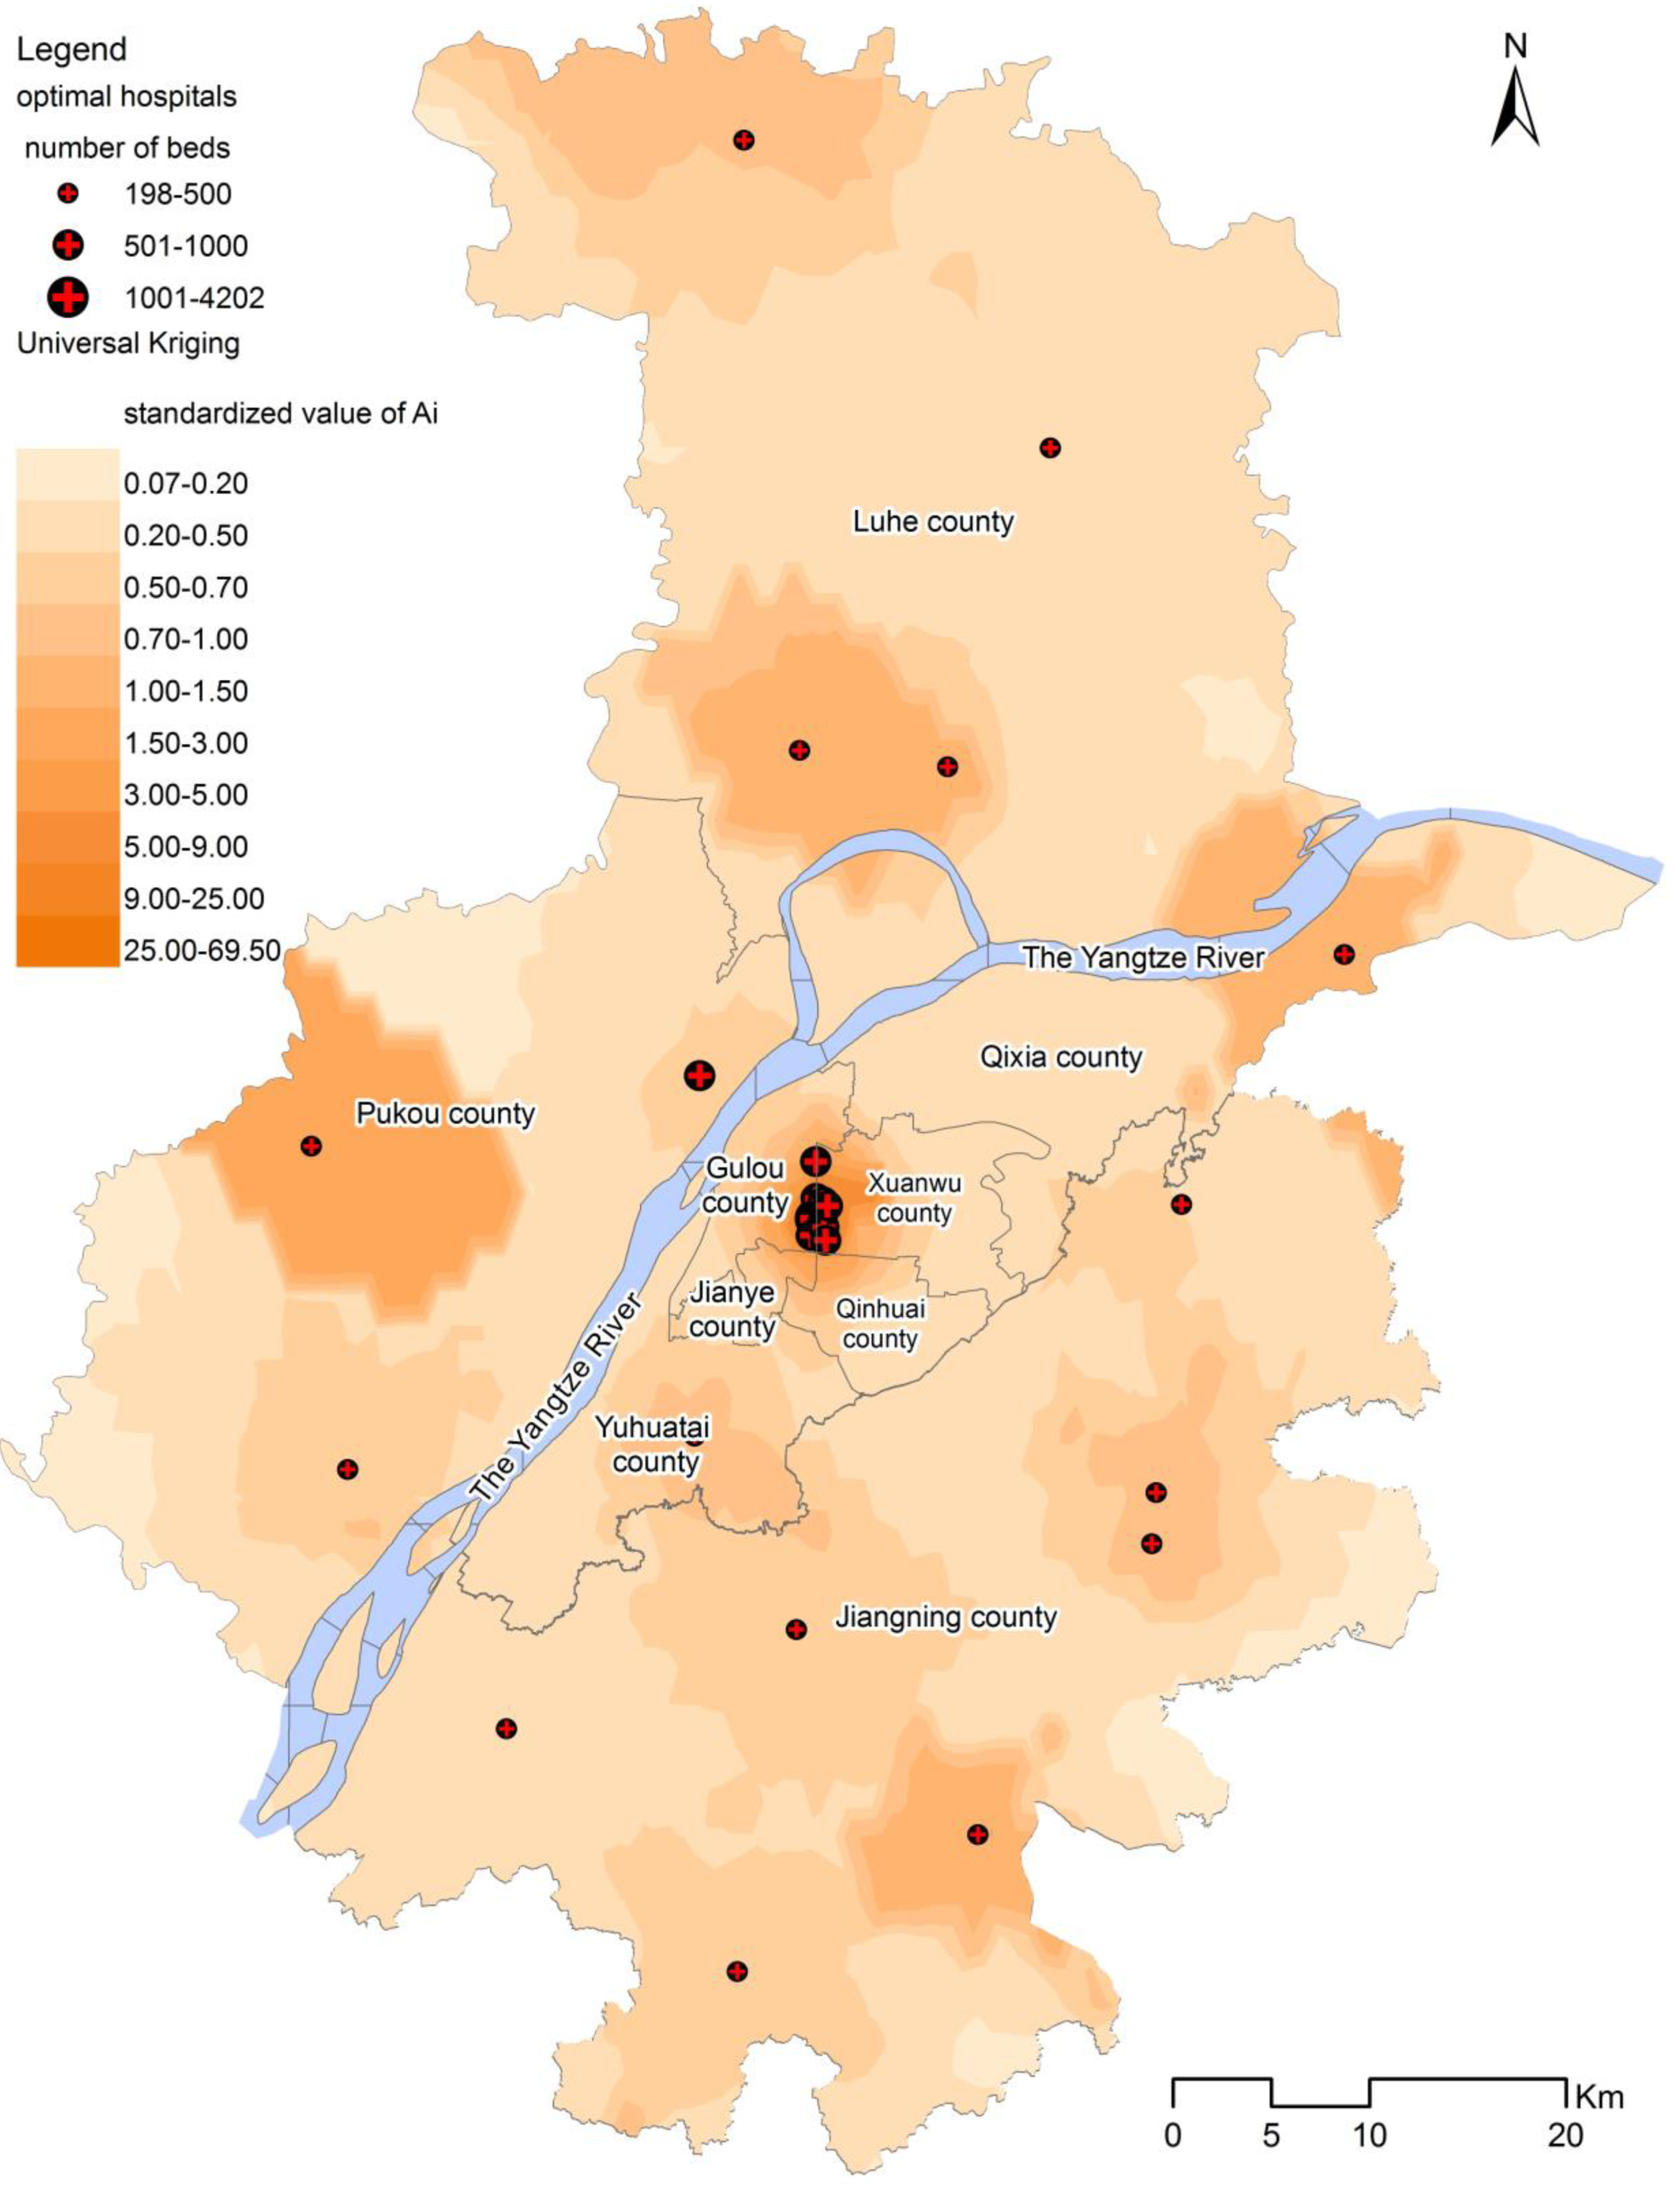
(2)
The utility fairness in accordance with the accessibility opportunity of the new layout is more prominent than the current situation, and the equity orientation is more striking.
(3)
The degree of spatial equilibrium can be significantly improved in the new layout by the measure with a series of indicators. From the effect of judgement, the indicator system tailored for spatial equilibrium assessment is relatively reliable and objective.

4. Discussion

4.1. The Discussion on the Deficiency of Model Solving

The new layout is better able to meet multiple requirements under the interaction between supply and demand. The requirements include moderate equilibrium distribution, selecting a facility to patronize by the random-probability approach as the allocation rule, and providing a simultaneous solution for location and scale. However, there are some defects in the three hospital locations. First, the hospital in the west of the urban area near the Laoshan area can support convenient medical service for the newly-developed residential area, but it is relatively close to the administrative boundary, which is likely to cause a certain degree of financial wastage. Second, both hospitals are located in Chunhua Town of Jiangning County. This result is considered inappropriate for two reasons. First, owing to the barrier effect from the current freeway, the accessibility to the residents in the vicinity is poor; hence, the model calculation result shows the necessity for two hospitals located in the same town. Second, the new gravity P-median model is an NP-hard problem, and the data size is so large that it is difficult to obtain the global optimal solution in a reasonable time. After weighing the accuracy and time cost, a local optimal solution can be accepted in the empirical study. In many cases, the local optimum can closely reach the desired results to the maximum extent. It is likely that the individual location results, which need to be revised, could be calculated again by the improved or created algorithm. Additionally, because of the partial deviation of the traffic network, population, accessibility, and other data due to manipulation or another factor, the accuracy of the model calculation result is affected to some extent. If the relevant data acquisition is further improved, a better solution closer to the global optimum may be achieved.
Accordingly, since the complicated optimization problem based on large-scale data is quite difficult to solve, we focus on the static stochastic location problem. Contemporarily, quite a few dynamic models have been converted into the static problem by a very large number of scholars, at least the soluble thought originating from “static” model solutions has usually been introduced into dynamic model solutions, which can contribute to decreasing the degree of solving difficulty [43]. However, in reality, the residents′ demand is often an elastic variable. How to simulate the elastic demand, to determine the key parameters, to build a dynamic location model or scenario planning models [43], and to design a more efficient algorithm have become a valuable area of study and challenging topic for the future. The simulation of demand involved here is usually based on the third paradigm of scientific research (Computational Science, simulation of complex phenomena). In fact, with the development of the fourth paradigm (Data-Intensive Science [49]), we will be able to obtain the global multivariate big data to simulate the regular pattern of elastic demand, and to improve the current model or construct the new spatial interaction model. Perhaps the solution of such a critical dynamic factor can also play an unexpected role in promoting the development of a very challenging dynamic location model.

4.2. The Complexity of the Solution to the New Gravity P-Median Model

In the past 20 years, some scholars have discussed a series of spatial interaction models which integrate spatial interaction and classical operational research models, from principle elaboration, experiment simulation, or empirical study [3,11,34,44,50,51,52,53,54]. However, there are still three problems that cannot be ignored and need to be discussed.
First, the current research is mainly based on small-scale data. Accordingly, the practical planning problems at the metropolitan-scale level, with a greater data magnitude and problem scale, have been discussed less. Second, in the numerous recent studies, the “scale” factor has usually been “neglected” or assumed to be equal, which has been a relatively intractable issue. However, it is as important as facility location and needs to be matched with other urban functional elements. Third, more scholars have put emphasis on the “efficiency” target.
To tackle the aforementioned limits, a new gravity P-median model proposed by Song et al. [6] integrates several kinds of modifications for P-median model from other scholars into a framework (2016). However, in the empirical study of this article, the problem scale in the Wuxi urban area is still not comparable to the metropolis. It is, therefore, necessary to perform the empirical research and to test the applicability of the new gravity P-median model for the larger spatial scale and larger data magnitude. There is a significant difference in the data magnitude at different spatial scales. The time matrix data calculated for Wuxi City is for 193 (candidate facilities sites) × 202 (settlements) [5,6]. However, in this paper, the corresponding time matrix of empirical data in the Nanjing urban area is 974 (candidate facilities sites) × 959 (settlements). It is obvious that the time complexity of the program calculation is much higher than the former calculated for Wuxi City.
It is widely acknowledged that the P-median problem was proved to be an NP-hard problem [43,55], and the new gravity P-median model used in the study should also be an NP-hard problem. Thus far, there is no efficient algorithm for the NPC problem with polynomial complexity, only the search with the exponential, and even factorial complexity can be used. True, just on account of the high time complexity, it is the solution to the optional locations of the Nanjing urban area that has been the intractable point.

4.3. How to Combine the Ideal Results with Urban Planning and Construction?

Initially, in which type of urban regions can the new gravity P-median model be applied? This model can be utilized in different kinds of development areas, such as developing cities or regions, built-up areas, even a totally new development region, and the like [5,6]. As the ideal location result is a theoretical discussion, accordingly, the model could be more suitable for the public facilities of developing cities or regions, for example, new expanding areas in metropolises. The circumstance is that the city has been in a period of development, a large number of residents have been gathered, but the facilities are lagging behind. For built-up areas (especially inner-city areas), considering the cost of relocation, the model parameters can be adjusted, or constraint conditions can be added to retain the majority of the facilities as far as possible and only transfer those facilities with poor suitability. To save on financial costs, to “move less” in the built-up areas or establish high-standard branches of large hospitals in the outskirts would be more effective. It could be effective to restrict the locations, or even scales, of some facilities to remain unchanged, and reset others. The major point in this process is which ones should remain intact, which can be identified by comparing different schemes.
Secondly, how the effect of the different scenarios can be assessed? In the course of selecting decision-making schemes of facility locations, we can attempt to compare several location results corresponding to different scenarios, for example, to restrict some unremoved facilities as aforementioned, to set different numbers of facilities, or to set the total service capacity. Then we should assess their respective degree of spatial equilibrium by measuring the degree of equity and efficiency. Accordingly, a relatively feasible scheme appropriate for urban construction will be selected.
Additionally, what other aspects should be noted? In large public facility planning and layout adjustment of the metropolis, owing to limited land use, it will be significant to discuss how to determine the number of facility alternatives and introduce the related factors, including the maximal facility capacity, the relocation cost, etc.

5. Conclusions and Prospects

5.1. The Further Deepening of the Main Logical Framework, Ideas, and Feasibility of the Model

Notably, the welfare maximization principle is a relatively abstract concept in many fields. How to achieve the target in practical urban planning and construction has been an intractable issue, although some concerning theories or measures have been proposed in public economics or management [4,16,17]. We have made attempts to transfer the welfare maximization principle, an intricate notion, into spatial equilibrium from economic geography, which can be divided into spatial equity, spatial efficiency, utility (chance) fairness, and facility utilization efficiency, with a concrete and implementable methodology. Additionally, these four spatial layout requirements have been integrated into location-allocation model building and spatial distribution rationality evaluation. In essence, whichever one of the two sections is designed in accordance with the aforementioned four requirements, which brings positive merits to the achievement of welfare maximization and spatial equilibrium.
The issue concerning the feasibility of new hospital layouts is worth thinking about and has been discussed through comparisons based on a series of indices and methods between before and after hospital layout optimization. Moreover, what is more convincing, based on the empirical analysis approach, the new gravity P-median model has been tested in two different regions, which are Nanjing City in this paper and Wuxi City, a major city of China [5,6]. Frankly, it is undeniable that there are several flaws in the new layout result; nevertheless, the problem can be tackled with more specialized and advanced algorithms. Furthermore, the model can be applied to decision-making regarding public infrastructure locations and scales in urban planning and construction in developing areas, the inner city, and even areas already developed to a certain extent. In these circumstances, the ability to make specific, local adjustments to the concerning parameters or to add new constraint conditions to the model will be of great value. Notably, there are many studies which can be explored in depth to help manage the various interests of planners and scholars.

5.2. The Research Value of Equilibrium Allocation Based on the New Gravity P-Median Model

In the process of urban spatial expansion in the past, there were some oversights in the overall spatial planning and precise dynamic planning of general hospitals which led to the local spatial structure imbalance in the current layout [5,6]. Thus, the effectiveness of social welfare and the geographical effects of the financial expenditure have been questioned. To achieve a new spatial layout of hospitals with rational thought is a moderately attractive proposition. With the advancement of medical reform and the introduction of market mechanisms, general public hospitals in metropolises have been pushed into the competitive environment to strive for a “patients market”. Hence, new supply and demand scenarios need to be included in the framework of the location decision. How to deal with the layout structure imbalance of hospitals and the interaction between supply and demand in the new competitive situation, and to relatively accurately determine their location and scale, have become important and challenging problems.
Correspondingly, there are a series of requirements or objectives for large public hospitals that need to be considered simultaneously [5,6,11,34,44]. The requirements refer to public welfare maximization, the balance of fairness and efficiency, the probability allocation rule to reflect the competitive situation, the scale factor embedded to characterize service quality equity, and utilization efficiency. The new gravity P-median model can be selected to deal with the above requirements. Such a study can verify the effectiveness of the new gravity P-median model in solving the facility location problem under the conditions of large spatial scale and multi-agent competition, providing a reference for the construction of those facilities’ location-allocation models with multiple facilities and multiple objectives in the interaction of the multiple factors, and providing a decision-making basis for urban facility allocation as well.

5.3. The Research Value Clarified from the Perspective of a Greater Board Research Scope

Through the overview of the current literature since the 1960s, from the fields of geography, urban planning, management, and the like, location allocation and layout rationality assessment are the major sections in public facility locations research and in the course of urban public service resources configuration [4,56,57], typically represented by public general hospitals. Such a location rationality issue will be closely related, and contribute significantly, to social public welfare sustainable distribution.
As for the layout rationality assessment, the main direction is to evaluate the equity degree of the layout base on spatial accessibility analysis [31,33], whilst the research of location efficiency seems to be less prosperous and mature. In terms of this distinctive contrast, it is not unusual for scholars to prefer the equity topic [36,37]. Numerous scholars tend to place more emphasis on the realization of equitable appeal from the social members who initiatively tend to strive for fairness. Whereas the planning and construction authorities are usually inclined towards efficiency within the limited financial budget [58]. As for facility location allocation, the effective approach is to build or modify corresponding operational research models for the concrete location selection or optimization target. How to achieve the spatial equilibrium in such models has attracted a large number of scholars to trying to tackle this issue. Whereas, in fact, numerous models for public facility allocation usually focus on the single orientation objective, equity, or efficiency [11,30,32,34,35], fewer models lay the emphasis on both of the two objectives (for example, Reference [44,59]).
Accordingly, on the basis of coordinating the equity objective with efficiency, we have combined location allocation with layout evaluation while designing the corresponding location optimization models and spatial equilibrium evaluation indices. Particularly, we endeavored to advance the relevant study in the field of public service resource spatial rational distribution, from the construction of a methodological system to practical solution process exploration.

5.4. Deficiency and Prospect

The limitation of our above study mainly involves three aspects. First, it is unsatisfactory to obtain four unsuitable hospitals locations, although the whole optimization layout result is comparatively feasible with the new gravity P-median model. Second, this study only involves the elementary link of the facilities planning and construction system. On the basis of the location scheme, some key items will be taken into consideration, for example, stakeholder participation in the subsequent construction phase. Third, from the aspects of theory and application, currently, it is a bit difficult to promote this model on a large scale in practical urban management and planning because of the comparatively high complexity and difficulty finding a solution.
Moreover, the following four aspects could be of interest to future researchers. First, there are some study cases on the location selection of hierarchical facilities [11,12,60,61], and these subjects deserve more attention. Second, the coordination between the different types of public facilities in recent years has been sought after [62,63], among them, the harmonious construction of medical facilities and pension facilities is worthy of attention. Third, it will be a valuable issue to discuss the planning and construction stages and the framework of stakeholder participation [64]. Furthermore, facility planning and construction is not only a spatial location issue, but also a social issue, herein it could involve the interests of existing residents, industrial and commercial enterprises, and other groups, particularly in the subsequent construction phase. Fourth, it will be possible to improve the model’s applicability by integrating it with GIS (Geographic Information System), which will enable the urban construction authorities to apply it as a solution more easily and effectively. How it will be possible to manipulate it is the major concern. To tackle the difficulty of considering multiple factors at the same time in the new gravity P-median model, the location results could be corrected by human-computer interaction according to the information of land use, topography, hydrology, and other geographical elements in the GIS. Additionally, on the basis of this integration, the spatial decision support system could be constructed to calculate the location results more responsively to the distribution of urban functional elements.

Author Contributions

Conceptualization, Z.S.; Methodology, Z.S.; Software, T.Y.; Validation, Z.S., T.Y. and Y.G.; Formal Analysis, Z.S.; Investigation, T.Y.; Resources, Z.S.; Data Curation, Y.G.; Writing-Original Draft Preparation, Z.S.; Writing-Review & Editing, Z.S.; Supervision, T.Y. and Y.G.; Funding Acquisition, Z.S. and Y.G.

Funding

This research was funded by [National Natural Science Foundation of China] grant number [41201170], and [41501157].

Acknowledgments

The presented work has been funded by the National Natural Science Foundation of China [grant number 41201170, 41501157]. At the stage of solving the model, Shuping Qiu (graduate student) of Nanjing University of Aeronautics & Astronautics, based on the AIMMS platform, wrote the program and obtained the corresponding results. In the model building phase, Jian Ding (Nanjing University of Information Science and Technology) and Guizhen Feng (Nanjing Institute of Industry Technology) provided useful suggestions. At the stage of language editing, MDPI English Editing has given us much help. The authors are grateful to the participants for their time and efforts.

Conflicts of Interest

The authors declare no conflict of interest.

References

  1. Thisse, J.F.; Wildasin, D.E. Public facility location and urban spatial structure: Equilibrium and welfare analysis. J. Public Econ. 1992, 48, 83–118. [Google Scholar] [CrossRef]
  2. Alexiadis, S. Compatibility between equity and efficiency. In The Dilemma of Regional Policy; Palgrave Pivot: Cham, Switzerland, 2018; pp. 73–105. [Google Scholar]
  3. Ammari, F.; Ogawa, K.; Miyagi, T. Spatial interaction model in health-care facility location-allocation. Infrastruct. Plan. Rev. 2000, 17, 219–228. [Google Scholar] [CrossRef]
  4. Deverteuil, G. Reconsidering the legacy of urban public facility location theory in human geography. Prog. Hum. Geogr. 2000, 24, 47–69. [Google Scholar] [CrossRef]
  5. Song, Z.N. Competitive public facilities location decision: Concept, location selection principle and model construction. Sci. Geogr. Sin. 2016, 36, 1485–1494. [Google Scholar]
  6. Song, Z.N.; Yan, T.G.; Liu, T.; Huang, T. Anew gravity P-median model and empirical test in urban comprehensive hospital location decision making: Take Wuxi as an example. Prog. Geogr. 2016, 35, 420–430. [Google Scholar]
  7. Bennett, W.D. A location-allocation approach to health care facility location: A study of the undoctored population in Lansing, Michigan. Soc. Sci. Med. Part D 1981, 15, 305–312. [Google Scholar] [CrossRef]
  8. Phillips, D.R. Urban hospital location: London research series in geography no 4: Leslie Mayhew George Allen and Unwin, London. Cities 1986, 3, 357–358. [Google Scholar] [CrossRef]
  9. Scarpaci, J.L. Urban Hospital Location. Econ. Geogr. 1987, 63, 97–99. [Google Scholar] [CrossRef]
  10. Cho, C. An equity-efficiency trade-off model for the optimum location of medical care facilities. Socio-Econ. Plan. Sci. 1998, 32, 99–112. [Google Scholar] [CrossRef]
  11. Yasenovskiy, V.; Hodgson, J. Hierarchical location-allocation with spatial choice interaction modelling. Ann. Assoc. Am. Geogr. 2007, 97, 496–511. [Google Scholar] [CrossRef]
  12. Baray, J.; Cliquet, G. Optimizing locations through a maximum covering/p-median hierarchical model: Maternity hospitals in France. J. Bus. Res. 2013, 66, 127–132. [Google Scholar] [CrossRef]
  13. Guerriero, F.; Miglionico, G.; Olivito, F. Location and reorganization problems: The Calabrian health care system case. Eur. J. Oper. Res. 2016, 250, 939–954. [Google Scholar] [CrossRef]
  14. Marks, A.P.; Thrall, G.I.; Arno, M. Siting hospitals to provide cost-effective health care. Geo. Inf. Syst. 1992, 2, 58–66. [Google Scholar]
  15. Brown, L.; Barnett, J.R. Is the corporate transformation of hospitals creating a new hybrid health care space? A case study of the impact of co-location of public and private hospitals in Australia. Soc. Sci. Med. 2004, 58, 427–444. [Google Scholar] [CrossRef]
  16. Tulchinsky, T.H.; Varavikova, E.A. Chapter 12-planning and managing health systems. In The New Public Health, 3rd ed.; Tulchinsky, T.H., Varavikova, E.A., Bickford, J.D., Eds.; Academic Press: San Diego, CA, USA, 2014; pp. 613–641. [Google Scholar]
  17. Moscelli, G.; Siciliani, L.; Gutacker, N.; Gravelle, H. Location, quality and choice of hospital: Evidence from England 2002–2013. Reg. Sci. Urban Econ. 2016, 60, 112–124. [Google Scholar] [CrossRef] [PubMed]
  18. Shortt, N.K.; Moore, A.J. Functional localities: An integrated spatial approach towards health care locality definition. GeoJournal 2006, 67, 27–40. [Google Scholar] [CrossRef]
  19. Wu, C.; Lin, C.; Chen, H. Optimal selection of location for Taiwanese hospitals to ensure a competitive advantage by using the analytic hierarchy process and sensitivity analysis. Build. Environ. 2007, 42, 1431–1444. [Google Scholar] [CrossRef]
  20. Sinuany-Stern, Z.; Mehrez, A.; Tal, A.G.; Shemuel, B. The location of a hospital in a rural region: The case of the Negev. Locat. Sci. 1995, 3, 255–266. [Google Scholar] [CrossRef]
  21. Mestre, A.M.; Oliveira, M.D.; Barbosa-Póvoa, A.P. Location–allocation approaches for hospital network planning under uncertainty. Eur. J. Oper. Res. 2015, 240, 791–806. [Google Scholar] [CrossRef]
  22. Revelle, C.; Snyder, S. Integrated fire and ambulance sitting: A deterministic model. Socio-Econ. Plan. Sci. 1995, 29, 261–271. [Google Scholar] [CrossRef]
  23. Knight, V.A.; Harper, P.R.; Smith, L. Ambulance allocation for maximal survival with heterogeneous outcome measures. Omega 2012, 40, 918–926. [Google Scholar] [CrossRef]
  24. Salman, F.S.; Yücel, E. Emergency facility location under random network damage: Insights from the Istanbul case. Comput. Oper. Res. 2015, 62, 266–281. [Google Scholar] [CrossRef]
  25. Schweikhart, S.B.; Smith-Daniels, V.L. Location and service mix decisions for a managed health care network. Socio-Econ. Plan. Sci. 1993, 27, 289–302. [Google Scholar] [CrossRef]
  26. Zhang, W.; Cao, K.; Liu, S.; Huang, B. A multi-objective optimization approach for health-care facility location-allocation problems in highly developed cities such as Hong Kong. Comput. Environ. Urban Syst. 2016, 59, 220–230. [Google Scholar] [CrossRef]
  27. Marianov, V.; Serra, D.; New Trends in Public Facility Location Modeling. Economics Working Papers 2004. Available online: http://www.econ.upf.edu/docs/papers/downloads/755.pdf (accessed on 4 January 2010).
  28. Surhone, L.M.; Timpledon, M.T.; Marseken, S.F. Welfare Economics; Betascript Publishing: Whitefish, MT, USA, 2010. [Google Scholar]
  29. Chen, W. Economic Analysis of Spatial Equilibrium; Commercial Press: Beijing, China, 2008. [Google Scholar]
  30. Mirchandani, P.B.; Francis, R.L. Discrete Location Theory; John Wiley & Sons: New York, NY, USA, 1990. [Google Scholar]
  31. Marsh, M.T.; Schilling, D.A. Equity measurement in facility location analysis: A review and framework. Eur. J. Oper. Res. 1994, 74, 1–17. [Google Scholar] [CrossRef]
  32. Drezner, T. Location of casualty collection points. Environ. Plan. C Gov. Policy 2004, 22, 899–912. [Google Scholar] [CrossRef]
  33. Tsou, K.W.; Hung, Y.T.; Chang, Y.L. An accessibility-based integrated measure of relative spatial equity in urban public facilities. Cities 2005, 22, 424–435. [Google Scholar] [CrossRef]
  34. Drezner, T.; Drezner, Z. The gravity p-median model. Eur. J. Oper. Res. 2007, 179, 1239–1251. [Google Scholar] [CrossRef]
  35. Puerto, J.; Ricca, F.; Scozzari, A. Extensive facility location problems on networks with equity measures. Discret. Appl. Math. 2009, 157, 1069–1085. [Google Scholar] [CrossRef] [Green Version]
  36. Ma, L.; Xie, Q.; Shi, S.; Ye, X.; Zhao, A. Regional maldistribution of China’s hospitals based on their structural system. Sustainability 2017, 9, 1046. [Google Scholar] [CrossRef]
  37. Wu, H.; Liu, L.; Yu, Y.; Peng, Z. Evaluation and planning of urban green space distribution based on mobile phone data and two-step floating catchment area method. Sustainability 2018, 10, 214. [Google Scholar] [CrossRef]
  38. Burkey, M.L.; Bhadury, J.; Eiselt, H.A. A location-based comparison of health care services in four U.S. states with efficiency and equity. Socio-Econ. Plan. Sci. 2012, 46, 157–163. [Google Scholar] [CrossRef]
  39. Cromley, E.; McLafferty, S. GIS and Public Health; The Guilford Press: New York, NY, USA, 2002. [Google Scholar]
  40. Rais, A.; Viana, A. Operations research in healthcare: A survey. Int. Trans. Oper. Res. 2010, 18, 1–31. [Google Scholar] [CrossRef]
  41. Huff, D.L. A programmed solution for approximating an optimum retail location. Land Econ. 1966, 42, 293–303. [Google Scholar] [CrossRef]
  42. Daskin, M.S. Network and Discrete Location: Models, Algorithms, and Applications; John Wiley & Sons: New York, NY, USA, 1995. [Google Scholar]
  43. Owen, S.H.; Daskin, M.S. Strategic facility location: A review. Eur. J. Oper. Res. 1998, 111, 423–447. [Google Scholar] [CrossRef]
  44. Church, R.L.; ReVelle, C.S. Theoretical and computational links between the p-median, location set-covering, and the maximal covering location problem. Geogr. Anal. 1976, 8, 406–415. [Google Scholar] [CrossRef]
  45. Drezner, T.; Drezner, Z. Multiple facilities location in the plane using the gravity model. Geogr. Anal. 2006, 38, 391–406. [Google Scholar] [CrossRef]
  46. Carreras, M.; Serra, D. On optimal location with threshold requirements. Socio-Econ. Plan. Sci. 1999, 33, 91–103. [Google Scholar] [CrossRef]
  47. Wang, F.; Luo, W. Assessing spatial and non-spatial factors for healthcare access: Towards an integrated approach to defining health professional shortage areas. Health Place 2005, 11, 131–146. [Google Scholar] [CrossRef] [PubMed]
  48. Birkin, M.; Clarke, G.; Clarke, M.; Wilson, A. Intelligent GIS: Location Decisions and Strategic Planning; Wiley: New York, USA, 1996; pp. 265–267. [Google Scholar]
  49. Tolle, K.M.; Tansley, D.S.W.; Hey, A.J.G. The fourth paradigm: Data-intensive scientific discovery. Proc. IEEE 2011, 99, 1334–1337. [Google Scholar] [CrossRef]
  50. Fotheringham, A.S.; O’Kelly, M.E. Spatial Interaction Models: Formulations and Applications; Kluwer Academic Publishers: Dordrecht, The Netherlands, 1989. [Google Scholar]
  51. Yamashita, J. Effects of spatial interaction on spatial structure: A case of day centre location in Malinti. Geogr. Rev. Jpn. 1993, 66, 156–172. [Google Scholar] [CrossRef]
  52. Drezner, T.; Drezner, Z. A note on applying the gravity rule to the airline hub problem. J. Reg. Sci. 2001, 41, 67–73. [Google Scholar] [CrossRef]
  53. Drezner, T.; Drezner, Z. The gravity multiple server location problem. Comput. Oper. Res. 2011, 38, 694–701. [Google Scholar] [CrossRef]
  54. Wan, B. Study on the Public Service Facility Location Problem. Ph.D. Thesis, Huazhong University of Science and Technology, Wuhan, China, 2012. [Google Scholar]
  55. Garey, M.R.; Johnson, D.S. Computers and Intractability: A Guide to the Theory of NP-Completeness; W.H. Freeman and Company: New York, NY, USA, 1979. [Google Scholar]
  56. White, A. Accessibility and public facility location. Econ. Geogr. 1979, 55, 18–35. [Google Scholar] [CrossRef]
  57. Murad, A. A GIS Application for modeling accessibility to health care centers in Jeddah, Saudi Arabia. In GIS for Health and the Environment; Springer: Berlin/Heidelberg, Germany, 2007; pp. 57–70. [Google Scholar]
  58. Revelle, C. Handbook of Regional & Urban Economics. In Urban Economics; Chapter 27 Urban public facility location; Mills, E.S., Ed.; Elsevier: Amsterdam, North-Holland, 1987; Volume 2, pp. 291–326. [Google Scholar]
  59. Smith, H.K.; Potts, C.N. Bicriteria efficiency/equity hierarchical location models for public service application. J. Oper. Res. Soc. 2013, 64, 500–512. [Google Scholar] [CrossRef]
  60. Hodgson, M.J. An hierarchical location-allocation model for primary health care delivery in a developing area. Soc. Sci. Med. 1988, 26, 153–161. [Google Scholar] [CrossRef]
  61. Chan, Y.; Mahan, J.M.; Chrissis, J.W.; Drake, D.A.; Wang, D. Hierarchical maximal-coverage location–allocation: Case of generalized search-and-rescue. Comput. Oper. Res. 2008, 35, 1886–1904. [Google Scholar] [CrossRef]
  62. Minde, J.M. Building a Framework for a Spatial Decision Support System for Co-Locating Public Facilities. Master’s Thesis, University of Iowa, Iowa City, IA, USA, 1997. [Google Scholar]
  63. Huang, R.B. Network Location Problems with Multiple Types of Facilities; Library and Archives Canada (Bibliothèque et Archives Canada): Ottawa, ON, Canada, 2006. [Google Scholar]
  64. Sikder, S.K.; Eanes, F.; Asmelash, H.B.; Kar, S.; Koetter, T. The contribution of energy-optimized urban planning to efficient resource use—A case study on residential settlement development in Dhaka City, Bangladesh. Sustainability 2016, 8, 119. [Google Scholar] [CrossRef]
Figure 1. A logical framework for the construction of the location-allocation model on large public general hospitals.
Sustainability 10 03024 g001
Figure 2. A diagram for conceptual framework.
Sustainability 10 03024 g002
Figure 3. The distribution of study unit (community) points, population size of units, and current hospital locations in Nanjing urban area.
Sustainability 10 03024 g003
Figure 4. The locations and scales of the calculated hospitals in Nanjing urban area after optimization by the new gravity P-median model.
Sustainability 10 03024 g004
Figure 5. Kriging interpolation for the standardized value of Ai (the accessibility of each demand point to all hospitals, measured by the number of beds of general hospitals per 1000 people) in the current layout.
Sustainability 10 03024 g005
Figure 6. Kriging interpolation for the standardized value of Ai (measured by the number of beds of general hospitals per 1000 people) in the optimization layout.
Sustainability 10 03024 g006
Table 1. The two-step two-dimensional matrix of equity and efficiency.
Interpretation PerspectiveGeography (Spatial)Economics
Starting Point
Fairness: On the basis of public demand and individual considerationsfairness according to the travel convenience of dwellersservice utility equity (providing relatively high-level service, whose differentiation can be acceptable)
Location-allocation requirementto limit travel costs to nearby facilities① to set a minimum facility scale, ② to set an appropriate scale for each facility based on population distribution and the accessibility to all facilities
The corresponding items in the following model of Section 2.2.2Equations (8)–(11) in step (2)① Equations (6) and (7) in step (4); ② Equations (4) and (5) in step (3)
Efficiency: On the basis of the consideration of the governmental fiscal orientation and the integrity of the audienceThe total travel cost to all facilities is minimized, and a larger proportion of inhabitants can conveniently reach the facilitiesutilization efficiency, which is the efficiency of dwellers to utilize facilities based on scale attractiveness
Location-allocation requirementto minimize the total weighted travel cost① to set a minimum facility scale, ② to set an appropriate scale for each facility according to population distribution and traffic layout
The corresponding items in the following model of Section 2.2.2Equation (1) in step (2)① Equations (6) and (7) in step (4); ② Equations (4) and (5) in step (3)
Table 2. The comparative analysis of the key indices for spatial equilibrium between the optimization and current hospital layouts based on Ai.
The Contrast IndicatorThe Current LayoutOptimal LayoutAmeliorated Degree (by %)
Spatial equityThe maximum time from the demand points to the nearest hospitals (min)65.6030.0054
The average travel time from the demand points to the nearest hospitals (min)17.2511.9930
Spatial efficiencyThe residents covered quantity ratio within 30 min (%)87.3310013
The weighted average travel time from all the demand points to hospitals (min)22.9524.78
Service utility(chance) fairnessThe Gini Coefficient of potentially accessible service resources amount of residents0.400.2830
The standard deviation of the service utility with the time factor (the population of each demand point potentially going for one facility by probability/time scale)2,547,941.34945,443.1763
The standard deviation of potentially accessible service resources amount of all demand points (Std of all Aij)1.130.9615
Utilization efficiencyThe average of potentially accessible service resources amount of all demand points (AVG of all Aij) (the number s of beds per 1000 people)0.070.0814
The average of each hospital service utility (to sum the population of each community potentially going for some facility by probability × hospital scale/hospital number, population size × the number of beds)260,482,453297,479,20514

