The Energy and Carbon Footprint of the Global ICT and E&M Sectors 2010–2015

Ericsson Research, Ericsson AB, Torshamnsgatan 23, 164 80 Stockholm, Sweden 2 Telia Company AB, Stjärntorget 1, 16994 Solna, Sweden
*
Authors to whom correspondence should be addressed.
Sustainability 2018, 10(9), 3027; https://doi.org/10.3390/su10093027
Submission received: 31 May 2018
/
Revised: 6 August 2018
/
Accepted: 14 August 2018
/
Published: 25 August 2018
(This article belongs to the Special Issue Information and Communications Technologies (ICT) for Sustainability)
Abstract
:This article presents estimations of the energy and carbon footprint of the Information and Communication Technology (ICT) and Entertainment & Media (E&M) sectors globally for 2010–2015 including a forecast to 2020. It builds on three previous global studies (2007, 2011, and 2018) and a Swedish study (2015) by the same authors. The study is based on an extensive dataset which combines primary and secondary data for operational (use stage) energy consumption and life cycle greenhouse gas emissions (CO2e) for the included sub-sectors, including energy and carbon footprint data from about 100 of the major global manufacturers, operators, and ICT and E&M service providers. The data set also includes sales statistics and forecasts for equipment to estimate product volumes in addition to published LCA studies and primary manufacturing data to estimate the embodied carbon footprint of products. The result shows that the ICT and E&M sectors have turned their previously growing footprints into shrinking ones despite a continuous increase in subscriptions and data traffic. Furthermore, the results of this study are also indicating that these footprints are significantly smaller than previously forecasted.
Keywords:
ICT; ICT sector; media; TV and media sector; E&M sector; energy footprint; carbon footprint1. Introduction
The term carbon footprint is a well-established concept commonly understood as the life cycle carbon equivalent emissions and effects related to a product or service. The carbon footprint, its relative magnitude and the development trends are important matters to investigate for any sector due to the growing concern of global warming. In 2016, experts associated to the World Economic Forum ranked global warming as the no.1 threat to society and the economy [1]. For the ICT (Information and Communication Technology) and E&M (Entertainment and Media) sectors, there is a strong connection between carbon footprint, the energy consumption, and the supply of energy, which makes it important to also study the energy consumption.
This study is the fourth global study by Malmodin and Lundén following a study that estimated the global carbon footprints of the ICT and E&M sectors in 2007, published in 2010 [2], a similar study estimating the footprints in 2011 including forecasts to 2020, published in 2013 [3], and an initial paper on the energy and carbon footprint of the global ICT and E&M sectors 2010–2015 [4] presented at the ICT4S 2018 conference in Toronto. This article is an expansion and goes more into detail regarding methods and results, and it also presents additional data and sources. Furthermore, additional network data have been added.
The magnitude of the ICT sector´s carbon footprint and its footprint in comparison to other sectors has been discussed for some years, both among scientists and in society. In several articles and papers [5,6,7,8], the assumed growth of the ICT footprint is described as a high and increasing, mostly based on the assumption that the ICT sector’s carbon and energy footprints are growing fast and in line with the exponential data traffic increase. Estimates like those are usually based on limited and/or uncertain data, often of a certain age, that, as shown in earlier research by the authors [3,4], overstates the ICT footprint. In addition, the modelling may be deficient and may not consider the complexity of the sector, as further discussed in Section 6. This is the reason why in-depth studies and extensive data sets are needed to create a better understanding of the energy and carbon footprint related to any product, service, or the whole sector. This is best achieved if the studies are based on as large samples of measured data as possible, which has been a guiding principle for this study. Thus, broad data collection efforts and studies are needed to get accurate estimates of the ICT sector´s energy and carbon footprints and to maintain a well-founded and up-to-date view on their development,
Until recently, most studies have estimated a growing energy and carbon footprint for the ICT sector, see references [5,6,7,8,9,10,11,12,13,14]. But in 2016, a study for Sweden [15] saw that the energy and carbon footprints of the ICT and E&M sectors had peaked around 2010 and then started to decrease, despite growing number of usage (data traffic), see Figure 1.
Similar decreasing energy consumption trends as in Sweden have also been reported for Germany and the US. Figure 2 shows the results of two recent studies estimating the electricity consumption of the ICT sector in Germany [16] and data centers in the US [17] combined with a study on the electricity consumption of consumer electronics in the US [18].
The trigger for this change can be discussed. An important development that has been identified in earlier papers by the authors [15], is the introduction of the smartphone and similar terminal platforms, which replaces older, energy inefficient hardware and solutions, and makes all the previous as well as additional new services available via one single platform, just by downloading software applications, i.e., “apps”. Thereby, a number of functionalities (such as alarm clocks, calculators, navigators, etc), which previously required separate products and hardware, have been replaced by one single device which, in addition, can be updated with additional functionalities over time. This has for sure been a transformative change for the industry as well as for the users.
The starting point for this study was the question whether the same trends as in the Swedish study could be seen at a global scale or not? Had the aggregated annual global energy and carbon footprints of the ICT and E&M sectors also peaked and started to decrease globally as the German and US studies indicates?
2. Scope
2.1. Definition of Footprints
The scope of this study is the carbon footprint, defined as the full life cycle carbon equivalent emissions and effects from all products and services related to the global ICT and the E&M sectors, according to the boundaries defined in Section 2.2 and further described in Section 3, Section 4 and Section 5.
The study also includes the energy footprint, defined as the operational electricity consumption or use stage electricity consumption. This means that the energy footprint has a narrower scope than the carbon footprint which considers the full life cycle. The major reason for this difference is that a full life cycle primary energy footprint is hard to estimate due to data gaps or lack of publicly available data related to total primary energy in the production stage. Furthermore, the mix of primary and secondary energy data (e.g., electricity) converted to primary energy also includes conversion losses, which makes such results hard to interpret and use.
This study estimates the footprints for 2015, as well as a forecast for 2020 including a comparison with previous studies. The 2010 estimates build on earlier studies by the authors [3].
2.2. The ICT and E&M Sector Boundaries
At a high level, the ICT sector can be described as the result of the convergence of the telecom and IT sectors, while the E&M sector is the combination of the entertainment and media sectors. The more detailed boundaries of this study are summarized in Figure 3 and further outlined in the following paragraphs.
Even if ICT user devices like PCs are used for entertainment and media purposes, they have been fully allocated to the ICT sector. Likewise, all use of TVs, cameras, and other E&M consumer electronics has been fully allocated to the E&M sector, even if the use could alternatively be related to ICT. This boundary setting is in line with earlier studies [2,3,4], and it also reflects the uses for which those product categories were originally designed. This study thus reuses established boundary settings for the different hardware categories which do not consider how the hardware usage might have changed.
For the E&M sector, cinemas, theatres, and other arenas or physical site events (e.g., sports) that require physical human presence, have been excluded, as the focus of this study is on the use of electronic equipment for entertainment and media purposes. However, physical paper media and printing have always been an important part of the media sector and is therefore included in the E&M sector.
In addition to the earlier specified sector boundaries [2,3,4], an additional sub-sector has been added to ICT user devices: “New connected devices”. This sub-sector consists of public displays, surveillance cameras, payment terminals, smart meters’ connectivity, and wearables, representing a growing range of Internet of Things (IoT) devices. It can be argued that surveillance cameras would better fit in the E&M or security sector but as their main function is to send and store data over a network they have been allocated to the ICT sector. A similar approach can be applied also for other kinds of wearables, although it can be argued that some of these would better fit into the E&M sector. To simplify, all wearables (for which data was accessible) have been allocated to the ICT sector.
The choice of devices to include in the sub-sector for IoT user devices is at least partly an arbitrary one—it is not obvious where the boundaries should be drawn between the ICT sector and other sectors as the examples in this section shows.
The ability to connect to a network to communicate and exchange information is being built in to an increasing number of new electronic devices and in equipment used by other sectors. The question is thus if all, some, or none, of these devices should be considered as part of the ICT and E&M sector. A modern car can be used as an example. Most electronics in a car is not defined as ICT or E&M, even if they include advanced microprocessors and communication, only the display and the related control unit is allocated to the E&M sector due to its traditional use as a radio and music player. Today, this unit is often referred to as the car’s central unit for infotainment and it can also be used for car information and navigation (GPS) purposes. Despite its changed use, it is considered as an E&M device in this study. Another example is the portable GPS that was considered as an E&M device already in the first global study by the authors [2]. The GPS functionality is nowadays often included in new smartphones and sometimes in the car’s infotainment system. As a result, the sales of standalone portable GPS devices have decreased from nearly 50 million in 2010 to about 20 million in 2015 and the sales will most likely continue to decrease as the smartphone, which is classified as an ICT user device, has become the primarily device used for navigation.
The IoT devices and their sector allocation are further discussed in in Section 6.
In many regions, such as in North America, entertainment has traditionally been distributed over the Cable-TV (CATV) networks which uses coaxial cupper cables for distribution. These networks are still in use, and in many cases, they have been modernized and evolved to also include broadband communication services. The CATV networks are also included in this study and have been allocated to the E&M sector. However, the broadband data distribution part is allocated to the ICT sector. Other means of TV and radio distribution via traditional FM/TV broadcasting services have been included in in the E&M sector.
ATMs and other types of equipment for monetary transactions have not been included in the previous footprint studies. However, new small payment terminals for cards mainly based on wireless technology and, to some extent, smartphones, have in this study been allocated to the ICT sector. Also, vending machines have been considered in the study, or to be more precise, the communication devices that connects the vending machine with the Internet. As already explained, it would be unreasonable to also include the vending machine itself in the ICT sector’s footprint, particularly since the vending machine would normally form part of the commercial trading sector.
The electricity consumption of cryptocurrencies, especially Bitcoin, have been discussed in media in recent years. The most cited source, Digiconomist estimated Bitcoin to about 40 TWh in early 2018 but other estimates are typically lower from 18 TWh to about 30 TWh, see [19]. Bitcoin’s electricity consumption in 2015 before its strong market expansion in 2017 can be estimated to <3 TWh but crypto currencies are not included in this study as ICT.
This study includes the footprints related to the data center operations and the servers of the financial system. Also included are the terminals, PC/laptops, servers, TV and supporting networks used by the financial sector to manage all the transactions, trading etc. The impact from Bitcoin mining and similar processes are excluded, mainly because the mining processes are not operated on regular servers but specific hardware that cannot be used for information and communication.
In relation to the devices already mentioned, specific electronic equipment for buildings, vehicles, production, medical care, military, industry, and security, are not seen as part of the ICT and E&M sectors unless belonging to the general product categories already mentioned. However, energy meters have been included in terms of their communication modules, as they were the largest contributor among the IoT devices in 2015, see [20]. A future IoT scenario where figures for new communication points, modules, sensors, and tags that are stretched “to the limit” and what that could mean for the future carbon footprint of ICT is further evolved in Section 5.7.
3. Methodology, Definitions, and Key Data Sources
The methodology and definitions used in this study have been reused from previous studies [2,3,15] by the authors. In all these studies, both top-down and bottom-up data collection and modelling approaches have been used. One of the major differences compared to the author’s previous global studies [2,3] is that a larger amount of primary data has been collected directly from ICT and E&M companies this time. In total, data from about 100 of the world’s largest manufacturers, operators and ICT and E&M services companies have been collected, a large part of that as primary data, see supplementary information for details.
Table 1 summarizes the ICT and E&M sub-sectors and key data sources. It also lists the allocations performed to avoid double-accounting. Table 2 shows ICT and TV subscription data for 2010 and 2015 and other key data for the study. Key data sources for user devices are also listed in Table 1 and more detailed data and information for user devices are listed in Table 3.
Table 3 shows the data for user devices and their individual energy and carbon footprint results.
To derive the embodied footprint related to the raw materials acquisition and production, the annual shipments of devices were used together with emissions data for the different devices. The carbon footprint of the user devices could be distributed into use stage and embodied emissions. The embodied emissions can be split into materials acquisition, parts production, component production, and assembly. For the embodied emissions, two data collection approaches were applied. Firstly, the embodied carbon footprint of ICT and E&M user devices were modelled in a bottom-up approach based on the estimated footprint per device and number of shipped devices in 2015, see Table 3. Secondly, the energy and carbon footprints of the major ICT and E&M manufacturing companies were collected (35 in total), and scaled to a global level based on revenue, see results for the collected data in Section 4.10. The contribution from materials extraction was also derived top-down in accordance with Ref. [33], which estimates the material carbon footprint of the ICT and E&M sector to be about 45 Mt CO2e.
Using a combination of life cycle assessment (LCA) results and production data from leading ICT component and equipment manufacturers as done here, enables a more accurate estimate of the embodied emissions and prevent that outdated LCA data leads to overstated embodied footprints. As an example of the data coverage, for key contributors like IC and displays, the production data set covers about 50% of all IC manufacturers in terms of revenue, and the coverage of display manufacturer data corresponds to about 85%.
Despite the combined data sets, the embodied footprints of user devices represent the most uncertain part of the footprints as they cannot be easily measured in an accurate way. For the use stage, information is lacking regarding usage profiles, if the usage is extended or limited, if the device is on or off grid or if the connectivity is based on a fixed connection, a WiFi or 4G. All these aspects have a considerable impact on the estimated device’s footprint.
The life cycle impacts of fixed and mobile network parts were based on Ref. [22], a study performed by the authors during 2017. This study involved data collection of granular operational data from many of the major network operators in the world and contributed an extensive, previously lacking data set for the fixed and mobile network operator’s actual operational energy and carbon footprint. The results and findings from the network operators study is further evolved in Section 4.2.
For the data center operation, this study relies on recent publications by IEA [22] and research covering the situation in Germany [16] and US [17]. Due to the high quality of those data sets, only limited additional data has been collected, such as recent data from major data center operators (e.g., Google, Amazon, Facebook, and Microsoft).
Additional primary reported data related to carbon, energy, and material data for the following ICT and E&M related subsectors have been collected and extrapolated to represent global conditions, and the data coverage before extrapolation is as follows:
- -
- -
- ICT network operations: Publicly reported energy and carbon footprint data covers about 70% of global subscriptions, detailed reported data covers about 40% of mobile and 15% of fixed subscriptions [23]
- -
- ICT and E&M manufacturing: Data from 35 of the largest ICT and E&M manufacturers globally representing nearly 40% of estimated final total embodied carbon footprint
- -
- Upstream supply chain related to materials: A global ICT and E&M material footprint study presented at the ICT4S conference 2018 [33]
An important factor when estimating the actual carbon footprint is the electricity mix. This is due to the fact that the mix varies depending of the country from where it origins. In this study, a world average electricity mix and electricity production emission factor have been used. This factor includes the full life cycle emissions and effects related to electricity production and is set to 0.6 kg CO2e/kWh [2,3], a value which has not changed much over the last 10 years and new data from IEA also support this figure [31].
Further details regarding each sector and sub-sector are given in Section 4 with regards to key parameters such as annual production, number of devices in use, and their usage profiles changes over time and how they impact the results. A complete overview of all data and calculations can be found in the Supplementary material.
4. Key Trends and Key Data
Figure 4 shows some key data and trends for the ICT sector 2005–2015. This study focuses on the period of 2010–2015, and during this period, the growth in number of subscriptions has started to decline. Up to 2010, the subscription growth was more rapid due to the more rapid growth in wireless subscriptions. Despite a declining subscription growth, the global data traffic has continued to increase exponentially, almost at the same rate as before. One reason for this is the increased demand for video and also to the sales of smartphones, which took off around 2010. For 2015, the number of smart phones is estimated to equal about 3.7 billion devices.
4.1. Data Centers and Enterprise Networks
The term data center is in this study used for all server installations ranging from “in closets” to “hyper scale” data centers. The electricity consumption of data centers has in many earlier studies, e.g., Ref. [5,6,7,8,13], been assumed to increase significantly in the future based on the assumption that electricity consumption to some degree follows the projected exponential increase of data traffic. As this study and the studies it relies upon shows, this has not happened. According to Cisco [29], the total global data traffic has increased about 30 times over 2005–2015 but the computing capacity per amount of energy for a typical one socket rack server has increased 100-fold over 2005–2015 [34]. There has been a strong focus in this study to collect as much up-to-date data as possible and to avoid uncertain assumptions as far as possible which in this case translates to collecting server market statistics and real energy measurements of data center operations from the most trustworthy sources.
According to Ref. [17], the electricity consumption of data centers in the US (nearly 1/3 of the global data center market) stopped growing around 2010 and has been stable since then at around 70 TWh, a situation that is expected to remain to 2020. In addition, the US study describes some possible reduction scenarios with up to 40% reductions of total electricity consumption in 2020, see Figure 2. IEA estimated in a more recent study, partly based on the same US study [17], that the electricity consumption of data centers globally has stabilized at a lower level of about 200 TWh in 2010–2014, forecasted to remain stable to 2020 [22]. This figure is a revision of earlier estimates of 203–272 TWh for 2010 [21]. These studies use what can be called a bottom-up estimate based on server sales in recent years together with up-to-date measurements of how servers, storage, network, cooling, and power equipment perform in data centers and data rooms. The most recent published study of the US server and data center market [35] estimates even lower electricity consumption of data centers in the US compared to the previous study. The number of servers in active operation remains to be an uncertain parameter but a life time of on average 3 to 6 years is where most estimates are [35]; 4.5 years is used in this study.
Figure 5 show annual server sales, estimated servers in operation, and estimated electricity consumption of data centers and enterprise networks globally together with estimates of ICT network and ICT and E&M manufacturers own data centers to avoid double accounting.
In the present study, the electricity consumption of data centers is estimated to be slightly higher than IEA’s estimate, about 240 TWh for 2015. The differences compared to IEA is that slightly more servers are estimated to be in operation, and that electricity (and other energy) consumption in enterprise networks in, for example, offices is included.
Enterprise networks have been estimated based on estimates of number of network ports [17], number of work/office PCs, additional so-called small cells/WLAN network equipment, and the authors internal company information for operating such networks serving >100 k employees. As with most other equipment and devices, global annual sale figures from recent years have been used together with measured data from large samples. The sample size is in this case limited to our in-house operations, but our own large global IT service providers have also contributed with knowledge and data. The enterprise network overhead can be estimated to about 27 kWh/year on average per active employee with a PC.
The energy consumption related to offices and travel for the ICT and E&M service organizations which operates the data centers has been included in the footprints, together with the embodied footprint of equipment and infrastructure. These data are based on reports by Google [36] and Facebook [37], and the estimated total carbon footprint for data centers and enterprise networks is about 160 Mt CO2e. About 135 Mt of the carbon footprint is related to the electricity consumption (240 TWh) taking reported green electricity into account, and about 25 Mt comes from construction and manufacturing and a smaller share from non-electric energy used at sites, transports, and travel.
The authors consider it reasonable to consider the green electricity in use, which is substantial for data center operators, about 10 TWh for ICT companies in US alone in 2015 (has now increased to about 18 TWh in 2018) [38]. However, for extrapolations, the conservative approach of not considering any green energy was taken.
4.2. Network Operations (Operators)
Network operations as data centers have been considered a difficult part of ICT to study as ICT companies have not been transparent enough, which has led to uncertain estimates and future projections based on, e.g., data traffic which is problematic as described in the previous section.
During 2017, the authors in collaboration with network operators such as ETNO (European Telecom Network Operators organization) members made a substantial data collection effort to get a better understanding of the electricity consumption and the carbon footprint of ICT network operators [23] over time. The goal was to collect more granular information of fixed and mobile network operators’ actual energy consumption than could normally be obtained via the operators’ annual environmental reports. This kind of information has historically been considered competitive and is usually not shared with a larger audience. Thanks to good collaboration and networking it has been possible to receive a unique material representing the actual network energy consumption for the years 2010, 2013, and 2015 for a large share of the global subscriptions. The data collection questionnaire thus resulted in a dataset that covers about 40% of mobile and 15% of fixed network operators globally with regards to subscriptions. The consolidated dataset, extrapolated to a global scale, is the primary source for ICT network operators in this study. Details regarding methodological choices and data are found in Ref. [23]. For more information, see Supplementary Material (part II and V).
The operational energy consumed by network operators is generated either by the main electricity grid or is produced locally on-site. The locally produced electricity generally from diesel generators, but an increased usage of solar cells (PV) can be seen, especially in rural and non-industrialized regions where diesel logistics and availability might be challenging.
Figure 6 shows the operational electricity consumption for the global ICT network operations, including on-site generated electricity and the electricity consumption in the operators own data centers, offices, and stores.
ICT network operators’ internal data centers (also shown in Figure 5), representing about 20 TWh for 2015, are allocated to the data center sub-sector in this study and are therefore later subtracted from the totally reported values for ICT network operations in Section 5 to avoid double counting.
The embodied carbon footprint for ICT network operators is mainly related to the construction and deployment of the network infrastructure like digging down cable ducts and raising antenna towers. The footprint of these activities has been estimated based on extensive studies of construction and deployments of telecom networks in Sweden [24], see Table 4. Lower averages have been estimated globally as Sweden has both a low population density and high requirements on connectivity which increases the network infrastructure impact as well as costs. Note that the deployment or embodied carbon footprint has been spread out over the whole life time and the values in Table 4 represent the annual carbon footprint for the network infrastructure deployment and construction which can vary substantially over time.
TV and radio broadcasting networks and cable-TV networks (CATV) have been estimated based on the results from studies of Swedish CATV networks, which were modified with data from telecom operators in Sweden and a larger study by mainly US cable-TV operators [39]. These networks have been allocated to the E&M sector except for a share of the cable-TV networks (CATV) which is used for fixed broadband data, and by that allocated to the ICT sector.
4.3. Renewable Electricity Production—Renewable Electricity Consumption
Many large ICT data services (data centers) and network operators are large buyers of so called “green electricity” (certified “green” electricity produced from renewable energy sources). Several of them are also to a large extent investing in green electricity production like wind and solar, also beyond their own consumption. IEA estimates that more than 50% of the corporate usage of renewable power purchasing agreements (PPAs) can be related to the ICT sector [22]. In the network operator study [23], as much as 42% of all electricity used by the operators, from which data was directly collected, originated from renewable energy sources or had green certificates. However, a bias could exist as the operators that voluntarily participated in the study could be more energy- and environmentally aware than the average operator. This bias may be reinforced since several of the reporting operators are also active members of ETNO’s sustainability working group. On the other hand, the share of renewable energy is high among the ICT operators in general, so the ICT sectors’ actual usage is probably higher compared to other sectors. For the extrapolation of this data set to all subscriptions, a world average electricity mix was used.
4.4. PCs, Computer Displays, TVs, and Tablets
Figure 7 shows the global PC sales 2007–2016 with a persistent decline in sales since 2011. Figure 7 also shows TV and tablet sales, which have also declined but at a slower pace, and some historical forecast figures for PCs, TVs, and tablets, which have by now turned out to be too high. The way smartphones and tablets, at least early on, would change behaviors and the PC and TV markets, was hard to foresee. Previous studies (including previous studies by the authors) that have used these values to forecast the footprint of those sub-sectors and of the ICT and E&M sectors have thus made too high estimates.
The share of sales for high-end, energy-intensive desktops is declining, and there are also energy efficiency improvements across all types of PCs. The only PC segment that is expected to increase its total electricity consumption is the high-end gaming PCs, but their market share is quite limited, about 6 million “high-end” or “enthusiasts” add-in graphic boards (AIBs) out of a total of about 40 million AIBs was shipped in 2015 [40].
Though the sales of TVs have declined since 2010, the effect of the fast-paced display technology development and its energy efficiency improvements plays a larger role for the overall decreased footprint of TVs. The same trend of decreasing energy and carbon footprints can also be seen for computer displays. Another important trend is that all usage of displays “moves” from larger TVs and computer displays to smaller laptop, tablet and especially smartphone displays, and in terms of TVs it also means any additional TVs in a household are used much less. Figure 8 shows the estimated annual electricity consumption of all TVs in an average EU household in the period 1990–2020 [41]. New TV sets obviously consume less electricity despite their larger displays.
The efficiency improvements of new display technologies were very well projected in an earlier (2013) study of TVs [42], where it was estimated that new display technologies would enable a 40% to 60% reduction of new TVs electricity consumption compared to a BaU scenario in 2015.
4.5. Smartphones
The annual global sales of smartphones have increased from about 300 million in 2010 to more than 1.43 billion in 2015 which is about twice the sales of PCs, tablets, and TVs combined. During the same period, the total value of smartphones has increased from about 100 B$ to about 400 B$ and the smartphone market in 2015 had a higher value than the PC, tablet, and TV market combined. In this study, a high number of smartphones has been estimated to be in active use in 2015, about 3.7 billion. This is equal to sales for the period 2013–2015 and can be compared to the total sales of 2010–2015, about 5.3 billion.
The actual lifespan for a smartphone has a significant impact on the total lifecycle footprint of the ICT and E&M sector. Due to that, the actual lifespan length is under discussion. The types of phones and quality of the hardware including the pace of introducing new network generations seem to have an impact. Furthermore, lifespan is impacted by the existence of take back and reconditioning/refurbishment systems with well-functioning business models in place. A limited study on recycling, take back, and refurbishment of smartphones has been performed in Sweden as a part of this study and based on the outcome, an average lifespan of 3 years has been used. However, there’s a wide variance from 1 to at least 5 years depending on type, usage, and quality. For additional information, see Supplementary material.
In 2017, Ericsson and Sony published a detailed smartphone LCA [43] which has been used as a main data source for the smartphones. In addition, a large part of the component data could be reused to estimate the embodied footprints for similar products, like tablets and laptops.
The impact of smartphones is fundamental and goes beyond their own footprint by impacting the usage of all other devices in this paper. Smartphones are replacing PCs and TVs, resulting in large energy savings, consumer electronics are replaced by smartphone apps, and paper consumption decreases when paper media moves online. Cisco [29] estimate that the data traffic (mobile and WiFi) from smartphones has grown fast from <1% in 2010 to about 10% in 2015 and will continue to grow fast to about 30–40% in 2020.
4.6. Telephones, Home Network Equipment, and Set-Top Boxes
Cordless telephone base stations, CPE (modems/gateways) and STBs are constantly drawing power in households and because of that they have a significant energy footprint, about 200 TWh (see table III). Energy efficiency per device is improving, but more can be done in the future. The sales of CPE (modems/gateways) and STBs have increased 2010–2015 due to the expansion of fixed broadband and digital TV connections/subscriptions. For the future, it can be expected that shipments per year will enter a more constant volume.
Fiber connectivity (FTTH) is increasing and in ICT mature countries such as Sweden they are the dominating broadband connectivity service. When estimating the actual footprint of these services it is important to notice that the fiber is not connected directly to the router, mostly due to mechanical reasons. Instead, an active so-called media converter is often used to connect the fiber with the router, leading to additional energy consumption and materials usage.
4.7. Other Consumer Electronics, Peripherals, and IoT
The sales of many consumer electronic categories decrease fast due to the integration of the corresponding functions into the smartphones—this goes for, e.g., portable media players and gaming consoles, cameras, and radio and audio products. The same trend of decreasing sales is seen for storage media (HDDs, optical discs, memory sticks/cards), where the actual storage has moved to the cloud.
All ICT devices, and most E&M devices, have built-in connectivity. Other connected devices, a.k.a. IoT devices, that have been considered in this study are public displays, surveillance cameras, payment terminals. and wearables and smart meters with regards to their control units and communication modules. The total number of these devices was still low in 2015, which also the number of M2M subscriptions (350 million) indicate, but the numbers increase fast. IoT is further addressed in Section 6.
4.8. Paper Media and Hardcopy Devices
This sub-sector includes traditional paper media as well as office and home printers and similar equipment and their energy consumption.
The global paper consumption has decreased by about 20% 2007–2015, from about 160 Mton to about 126 Mton, see Figure 9. The total carbon footprint of paper media was estimated to about 300 Mton CO2e in 2007 [2]. For 2015, the carbon footprint was estimated to have decreased to about 220 Mton with paper production representing about half, or 110 Mton.
Global sales of hardcopy devices (i.e., printers, copiers, faxes, and combo-devices) have declined in recent years and are expected to further decline until 2020. The manufacturing of these devices has a small embodied footprint, but their operation contributes significantly. Based on paper and hardcopy sales and estimated energy consumption, this study estimates that their operational electricity consumption has decreased by about 50%, from about 150 TWh to about 75 TWh overall, due to decreased paper use in offices, less new device shipments, fewer devices in operation, and improved energy efficiency. It can also be shown that the results for 2010 were overestimated.
The carbon footprint related to forestry land use and land use change including forest fires (here defined as the secondary carbon footprint of paper) is very uncertain and is not included in this study. This issue has been discussed in previous estimates of the media paper sub-sector [2,3], where it was reported that the secondary footprint can be as large as the primary footprint.
4.9. ICT and E&M Services
In addition to the network and device categories, service-related activities have also been included in this study, which, to the knowledge of the authors, has not been done before for this kind of sectorial footprint estimates. As the use of network and devices are already accounted for in other sub-sectors, this part includes the additional offices and travels by employees in the service sector. The estimates of impacts per employee are based on the study of the ICT and E&M sectors in Sweden [15] and are thus considered as highly uncertain due to the limited sample. The impact per employee is scaled by an estimated number of employees in the sectors globally [44] which is again a very uncertain value. The estimated number of employees globally is more inclusive compared to what was described in the scope section by also including categories like actors, tourist guides. In summary, this sub-sector includes the physical footprints of services and media content production related to employee’s offices and travel.
4.10. Life Cycle Assessment (LCA)
Life cycle assessment is the preferred method to be used to estimate the embodied carbon footprint of user devices, network equipment, and supporting infrastructure (e.g., antenna towers for mobile networks), and this method has been used in previous studies by the authors. The embodied carbon footprint of ICT and E&M user devices have been modelled in a bottom-up approach based on the estimated footprint per device and number of shipped devices in 2015, see Table 3 and Figure 10, which show the footprints of some key devices. The challenge in a global study like this is to be able to model a typical or average device among all devices for each device type. An extensive investigation of publicly available LCA results for ICT and E&M devices has been carried out [24]. This work has continued since then and the dataset has been updated.
The embodied emissions can be split into materials acquisition, component production, parts production, and assembly. In addition, a top-down approach for the embodied footprints has also been explored in this study. Published primary data for about 35 major ICT and E&M manufacturing companies was used as input data for energy consumption (about 154 TWh electric energy for these 35 companies) and total carbon footprint data (about 73 Mt CO2e) that was used to estimate the footprints of specific components and assembly activities, see Table 5 and Figure 11. The revenue share was used to scale the reported data to a global level. For additional information, see Supplementary Material (part III).
The contribution from materials extraction was also derived top-down in accordance with Ref. [33], which estimates the material carbon footprint of the ICT and E&M sector to about 45 Mt CO2e. Note that this is just the footprint of the raw material itself and further processing and manufacturing into composites and components is included in the other stages in Figure 11.
The bottom-up LCA method and the top-down manufacturing data are used together to give a better estimate of the embodied footprint of the sectors user devices, see Figure 10. To only rely on LCA data, as in previous studies, is believed to be related to larger uncertainties as LCA results are typically based on older product and component data which can be especially sensitive for ICT and E&M electronics with their fast development. It is also hard to determine what an average product, to be used as a basis for extrapolation to a sub-sector level, will look like a given year. The overall energy usage for various key components as well as the materials and related mechanics based on Ref. [33] has therefore been used to estimate the footprint of each device type more accurately.
In this study, the embodied footprints are generally estimated to be a bit lower than what is estimated in previous studies and other new ICT sector studies, e.g., Ref. [6,7,8]. The reason is the use of top-down data to have a second source or method to estimate the embodied footprint of devices which is believed to better capture the fast development of technologies used in devices and to manufacture them. The top-down data, based on primary data for 2015 from a large sample of manufacturing and assembly companies including material acquisition and various component production stages, gives a more accurate estimate of the total embodied footprint and was extremely helpful to better estimate the embodied footprint of each device in the study, see e.g. Figure 10.
As seen in Figure 11, Integrated circuits (ICs) represent the largest embodied footprint. Materials, mechanics, displays, and assembly also have significant footprints. The range indicated for materials shows the impact of recycling as discussed in Ref. [33]. Note that the manufacturing and construction of network and data center infrastructure (about 48 Mt CO2e) is not included in Figure 11. The total global carbon footprint for some key user device categories is shown later in Section 5.
5. Results, Analysis, and Observations
See Section 7 (Conclusions) for a summary of absolute figures and share of global energy and carbon footprints.
5.1. Total Carbon Footprint Results
The result of this study shows that the growth in ICT and E&M footprints has not only declined, but the footprints have actually decreased over the period, which is in contrast to the previous global studies by the authors, as illustrated by Figure 12. At the same time, the growth in number of users (subscriptions) and usage (data traffic) has continued, as shown in Figure 4.
The footprint of the ICT sector itself is quite flat between the assessed years. However, the development of ICT is a key factor in the E&M consumption patterns which is likely to have contributed to the significantly decreased E&M footprints. This is mainly due to the increased usage of tablets and smartphones, which has led to decreased sales and usage of new TVs, PCs, and other consumer electronics. For the E&M sector, the energy efficiency improvement of new display technologies is an important reason for the reduction of the footprints. The consumption of graphical paper for news, printing, and writing shows a steady decrease since the economic downturn in 2008, as shown in Figure 12. The reason is considered to be that traditional paper media is used to a lower extent as activities increasingly moves online.
Figure 13 shows the distributions of the total carbon footprint of each sector for 2015. The largest portion of the carbon footprint is related to user devices and the use stage. However, the manufacturing stage also contributes significantly to the total carbon footprint.
Figure 13 also includes a rough estimate for ICT and E&M services and content production. Here, the two sectors have not been separated due to difficulties in allocating ICT and E&M service and content production employees to each sector. Note that this uncertain estimate is only included here and not in reported totals elsewhere.
5.2. Operational Electricity Consumption—The Energy Footprint
Figure 14 shows that the ICT sector’s energy footprint has been roughly constant, around 800 TWh in 2010 and 2015, an increase from the 2007 level of about 710 TWh [2]. Mobile network operation has increased its share, while the contribution from user devices has decreased.
The E&M sector’s energy footprint was earlier estimated to have increased from about 730 TWh in 2007 [2] to about 840 TWh in 2010 [3] but is now estimated to have decreased to about 585 TWh including hardcopy devices (printers etc.) in 2015—a decrease of about 30%. The main reason is the improved energy efficiency of TV displays.
According to the scope of the study, the energy footprint is defined as the operational electricity consumption. However, the electricity consumption part of the embodied energy consumption can be estimated to about 350 TWh by extrapolating input data from 35 major ICT and E&M manufacturing companies, see section IV L. Note that there are larger uncertainties compared to operational data due to limited access to primary data and allocation difficulties in long supply chains. Estimates of non-electric energy consumption involves even higher uncertainties as there are often energy data gaps in the supply chain which might not be transparent to the final device manufacturer as intermediate primary energy data is less studied and monitored than carbon emissions. It is also very important to not aggregate secondary energy like electricity and primary energy like vehicle and heating fuels. Producing electricity typically requires about 3 times as much primary energy as the resulting secondary electric energy, including all transmission and distribution losses before it is consumed. Figure 14 outlines the total energy footprint including also the estimated embodied part.
5.3. Carbon Footprint Results in Further Details
More detailed results for the user devices with the largest carbon footprints are shown in Figure 15. TVs and the various PC types together with the monitors have the largest footprints, but smartphones have also a significant footprint due to their large sales volumes. CPE (modems/gateways) and STBs have, due to being always active, a high operational carbon footprint.
The total carbon footprint of paper production and printing (including hardcopy devices at offices and households) is estimated to be as large as the footprint of TVs or as large as the combined footprint of PCs and smartphones.
5.4. Carbon Footprint Results as Intensity Metrics
Two basic carbon footprint intensity metrics can easily be calculated, the footprint per user (subscriptions and office PC users) and the footprint per amount of data traffic in the networks, see Figure 16.
Note that IoT subscriptions are not included in the overall number of users (these were still relatively few in 2015). The network data traffic, which is based on Cisco’s definition and data [29], is a different parameter than the data created and stored on all ICT devices which is many times greater. The amount of data represents data traffic in the ICT networks, not including internal data traffic in local networks and data centers. Correspondingly, the number of subscriptions is derived from Table 2.
Use of a wireless connection at home, in an office or a public space, e.g., over WiFi, is not allocated to the wireless sub-sector in the intensity metrics above. A share of laptops and tablets has been allocated to the mobile service, corresponding to the share of data traffic which goes over a cellular wireless network. In contrast, all use of smartphones has been allocated to the cellular system even if, e.g., WiFi connections are often used. The allocation between fixed and mobile can be discussed further.
5.5. The Current Trends
The connection between the data traffic (or amount of data) and energy consumption has been debated over the years. The estimated energy consumption of the whole ICT sector is shown in Figure 17 as a nearly flat line (note the logarithmic scale) which only increased about 3 times 1995 to 2015. During the same period, the data traffic has increased one million times—or about 10,000 times if voice telephony is also counted as data which make a huge difference for 1995 when voice was the dominant form of communication in terms of amount of data. The energy consumption and number of users (connections or subscriptions) are more correlated. The number of users has increased about 10 times and is also shown in Figure 17 as a slowly increasing line. The resulting total energy consumption per user has been reduced by 2/3 between 1995 and 2015. The main explanation is that the share of mobile subscriptions has grown fast, and it requires less energy to connect mobile users. Due to battery operation constrains, the energy consumption of mobile devices has been kept low.
Extrapolating from the current trends, it can be estimated that for the near future (up to 2020) the current energy consumption plateau will remain while the number of users continuous to grow but at a decreasing rate.
5.6. Benchmarking towards Moore
In 1965, Gordon Moore at IBM observed that the number of transistors per chip area doubled every year (revised to every two years shortly after) and in the mid 70’s the term “Moore’s law” got a wider spread following the increasing use of microprocessors and computers. Moore’s law has since then held true up to around 2012/2013 when the development slowed down a bit. It is noted that there is a time delay of many years between a slow-down of Moore’s law in the research labs, and a corresponding decline in the products that reach the market and, in their turn, impact software and user behaviors such as data usage.
Figure 17 uses a logarithmic scale to show the growth in data traffic since 1990—the era during which the interconnection of commercial networks transformed into the modern Internet. Figure 17 shows that the global data traffic seems to have followed Moore’s law in recent years. Residential data access networks and Internet use grew more slowly when they were first deployed, but the global data traffic caught-up and outpaced Moore’s law 1997 to 2005, but has, finally, in recent years, slowed down and is in line with Moore’s law.
5.7. A Future IoT Scenario
In an earlier study, the impact of what was then called “the networked society”—an estimate of the IoT development and its estimated carbon footprint for 2020—was described and discussed [3]. The applied scenario included a high amount (1 Billion) of new ICT access points (e.g., small-cell wireless base stations), new ICT communication modules built into non-ICT equipment (28 Billions) and devices representing the connectivity of the electronic equipment and devices of other sectors, a small part of the carbon footprint of other sectors was thus allocated to the ICT sector to understand the impact of an IoT society on the carbon footprint. In addition, an even higher number of sensors and tags (500 Billions) were modelled based on the existing technology. The main learning from that study was that the new connection points and new ICT modules would add a relatively small carbon footprint despite the large volumes of equipment and devices that could potentially be connected. Not even the many new sensors and tags included would add a large footprint.
In the present study, a similar approach was used to estimate the impact of a future IoT scenario. This scenario is similar to the previous one, but the number of communication modules is slightly lower (27 Billion). The new scenario by this modification acknowledges that most E&M devices already have built in connectivity. What was estimated in the earlier future scenario has in fact to a large degree already happened. Figure 18 shows the estimated added carbon footprint from that scenario.
The ICT sector in the new study includes a wider range of devices compared to the older study and many of them can also be labelled as “IoT”, e.g., public displays, surveillance cameras, payment terminals, smart meters, and wearables. These equipment and devices are labeled as existing (integrated ICT). The ability to communicate is also being built into electronic equipment and devices that belong to other sectors, e.g., vehicles, home appliances, HVAC-, health care-, meter-, security-, and industrial production equipment. This area is in fast development and ICT modules are estimated to add to the future footprint of other electronics.
There is a possibility that the increasing ability to connect make new types of products possible that creates new mass markets rapidly. However, such second order effects have not been included in this future scenario.
Figure 18 shows that the future IoT scenario only adds marginally to the overall carbon footprint of ICT and E&M.
6. Discussion
The outcome of this study shows that the ICT sector’s energy footprint is increasing, but not as often assumed, in line with the increased data volumes, but rather in correlation with the increased volume of subscriptions. Previous studies show that in some IT mature countries, such as Sweden, the energy consumption as well as the carbon footprint is decreasing. However, when interpreting the results, there are a number of other aspects to consider, as outlined in this section, since they may impact the results both in a positive and a negative direction.
This study has used the joint LCA standard by ITU/ETSI [45,46] for ICT networks and the principles of relevance, completeness, consistency, accuracy, and transparency to guide the work. In addition, the study has strived to be well aligned with the ITU standard for the carbon footprint of the ICT sector [47] (under publishing). Overall, the choice of functional units and boundary setting is in line with the standard and the study also takes a life cycle approach and considers both hardware and software. At a product level, a major data collection effort was undertaken to find data in line with the standards’ requirements. From a data quality point of view, the principles of completeness, uncertainty, data representativeness, data age, geographical and technological correlation have been considered in this process. Cut offs have been avoided as far as possible and the use of proxy data and extrapolations have been preferred, and energy emission factors are inclusive by considering the supply chain and distribution losses. Also, from an allocation perspective, the rules of the standard have been considered. No sensitivity analysis was performed but results for different parts are transparently presented to enable postprocessing. The reporting is not performed in accordance with the standards but adopts to the format of the journal. Finally, no third party critical review of standard compliance has been performed, but the authors preferred to send the study for review.
For the input studies performed by the authors themselves, the input data have high degree of compliance with the standard according to previous evaluations. For user devices, a detailed standardization review was performed during this study and it was noted that existing studies, in most cases, have a low degree of transparency, which makes it hard to judge their quality. Furthermore, none of the reviewed sources referred to any LCA standard [45,46,47,48]. For this reason, the used complementary top-down data sources were considered important to validate the LCA data collected. For data centers, no compliance review was performed but the quality of the input data should be secured through the scientific peer review of the academic papers and the broad consultation performed for the IEA deliverable.
One of the main questions is whether it is even possible to assess the ICT and E&M sectors, to define “internet”, when there is no clear definition. In this study, the same boundaries have been applied as in previous studies by the authors [2,3]. The ambition has been to collect the best data available to get a good basis for estimations and extrapolations, which resulted in an extensive collection of primary and published data.
ICT maturity differs between countries as well as among the ICT and E&M providers, manufacturers, and producers. That’s why input data is based on several and different sources. By this method, the collected data and the results will be less biased.
Operational data for networks are, in many cases, seen as sensitive and competitive business data which has been kept confidential and communicated only at an aggregated level. In this respect, the data set collected for this paper, with regards to networks in particular, are considered to substantially increase the data availability [23]. To ensure a sufficient and detailed data coverage, the operators that provided primary data were promised anonymity. In addition to this extensive primary data set, complementary data have been collected from the annual reports of other major network operators. Taken together, these sources correspond to a large share of the overall global subscriptions, representing a wide range of sources which gives good input for extrapolations.
To verify that confidential data from operators are reliable and accurate is a challenge, but since many of the operators also publish externally reviewed annual reports with the same data but presented with lower granularity, the data has, to a large extent, been compared to those sources which are verified through corporate audit reviews. The operators that reported their detailed data were promised anonymity. Through this, data gaps were avoided and access was given to data sets that would otherwise have remained internal. With an assurance of anonymity, there is no reason to fake data. In the end, in spite of the principal objections against anonymous data, from a quality perspective, these data enable more accurate results than a dataset based on theoretical models and one or a few estimated KPI’s.
For other input data, such as consumer devices, TVs, and PCs, the results are based on public sales statistics combined with applicable LCA data. Data center operation figures is based on a mix of publicly available annual reports and available information from data center owners, and information received via network operator data collection.
With regards to absolute footprints and the development of the footprints over time, it is observed that the trend results are less sensitive to the data quality as biases or uncertainties related to absolute levels are likely to have similar proportions between different years and thus even out.
When comparing the results and forecasts of this study with others, such as Ref. [7], that use more limited data sources with unclear data age, it seems reasonable to conclude that the footprint of ICT has sometimes been overstated due to shortcomings in data and models, as shown in previous studies by the authors [24]. Another parameter which may lead to excessive estimates is the neglected energy efficiency improvements that historically have had a considerable impact on network energy performance and footprint.
A challenge still to come is IoT, especially the expected increase of connected devices. Until now, the volumes have been low but they have started to increase. Devices such as Machine to Machine (M2M) are normally easy to track due to their mobile subscriptions, while IoT devices connected via other means, such as Bluetooth and WiFi, are more complicated to trace. Due to the early phase of the technology life cycle, it is highly uncertain to forecast the footprint for the IoT sector after 2020, especially the expected volumes. In 2015, the MaChina forecasted that 27 billion devices will be connected already in 2024. For 2015, the total number of connected devices can be estimated to approximately 600 million (from Table 3). There seems to be quite a step between the expected future volumes and the current usage.
Another aspect of IoT is the allocation of the connected devises between sectors—if everything is connected, what should be allocated to the ICT and E&M sector, and what should be allocated to other sectors? Should a self-driving car be allocated to the ICT and E&M sectors’ footprint since it is online? A similar question can be asked for drones, which are expected to be a part of the future ICT infrastructure carrying mobile microsites or local GPS positioning systems for enhanced data positioning accuracy. Will these be a part of the ICT sector or another sector? Allocation will obviously continue to be an important aspect to assess in future environmental impact studies.
In this study, only the electronic hardware of the IoT devices has been included. One may also claim that an IoT device which is primarily intended for communication purposes should be allocated to ICT, while one for which the connectivity is a feature should be allocated according to is primary purpose.
The ICT and E&M sectors use a higher share of renewables than other sectors. Approximately 40% of the reporting sectors electricity purchase today is “fossil free” and this is clearly visible among the reporting network operators [23]. This is an important factor to consider when comparing the development of different sectors.
The development over time indicates that the ICT & E&M sectors have started to decouple their sector expansion from their carbon footprint. This was first seen in ICT mature countries like Sweden, but the results and data of this study imply that this has also started to happen globally. This trend shift has come about quicker than expected based on earlier results. Furthermore, the expansion of ICT has influenced other sectors. When studying the development of the paper industry, it is reasonable to believe that the paper production decline has a strong correlation to the increased usage of digital media, and especially newspaper media which goes online. Even if the impact on the newspaper industry was expected, the change has been fast and considerable. For other sectors, such as transports, building etc., the effect is still to be seen.
Regarding the future, it can be expected that the subscription volumes will continue to grow, since a larger share of the population will be connected. In addition, increased machine to machine communication, including sensors, surveillance cameras, etc., as discussed in the text, will also lead to an increased number of subscriptions, either connected via WiFi or mobile connectivity solutions.
However, increased subscription volumes will not necessarily lead to a drastic increase in data volumes, especially in the area of IoT where the data volumes tend to be quite limited. Even if the number of connected IoT devices reaches 30 billion, this may not lead to a drastic increase in data volume in the network. It is more reasonable to believe that it is the increased usage of video and other streamed services that will be the actual driver for data volume increase. But, there is a limit also for these services. As can be seen in IT mature countries, such as Sweden, data volume increase is nowadays more linear than exponential, and the curve is flattening out, probably due to the fact that there’s a limit of how much video that can be consumed over time. It can be expected that the same trend will be seen also in the rest of the world as IT maturity increases.
How the footprints of the ICT and E&M sectors will continue to evolve remains to be seen, as does the continued development of the impact on other sectors from digitalization. Apparently, this is an area that will require further research, both to follow the development and to deal with the related uncertainties. However, this study has introduced an extensive dataset and results that should reasonably estimate the actual footprints.
7. Conclusions
This study estimates the footprints of the ICT and E&M sectors as summarized in Table 6.
The ICT sector has stopped growing its energy and carbon footprint and the footprint in 2015 is similar to what it was in 2010 (with a possible peak in 2012/2013). Networks continue to grow slowly but user device footprints are now decreasing.
The E&M sector has not only stopped growing, but has also decreased its footprint since around 2010. This is a major trend shift despite the fact that ICT subscriptions have grown from 6.7 billion to 9 billion, TV subscriptions have grown by 8% to nearly 1.6 billion, and data traffic in the world’s networks have increased by a factor of 4 during the same period (2010–2015).
Table 7 show two basic intensity metrics that describe the development for the ICT sector for the period of 2007–2015. The metrics are constructed from the results in Table 6 and key data in Table 2.
The major reasons for the trend shift are believed to be:
- -
- Decreased sales of new TVs and PCs and less use of existing ones in favor of smartphones (and tablets).
- -
- Consumer electronics are replaced by apps that primarily run on smartphones (and tablets).
- -
- Improved material and energy efficiency of display technologies.
- -
- Paper consumption is decreasing as media “moves online”.
- -
- Devices that grow in numbers are small and energy efficient, e.g., IoT devices and IoT communication modules.
The study builds on a large and extensive data set compiled over many years with important contributions from key industries.
Many previous studies have overestimated the negative impacts (the energy and carbon footprints) of the ICT and E&M sectors in the near future. In the light of earlier estimates, this study shows a result which is significantly lower than, for example, the carbon footprints projected by the Smart 2020 and Smarter 2020 reports.
The footprints per human, user, and subscription is naturally decreasing even more. At least for the ICT and E&M sectors, it seems that the age of dematerialization has finally arrived.
Supplementary Materials
The following are available online at https://www.mdpi.com/2071-1050/10/9/3027/s1, Part I: ICT and E&M product (equipment/devices) data; Part II: ICT network operators public data (2015); Part III: ICT and E&M manufacturing companies public data (2015); Part IV: The importance of lifetime and allocation when estimating the life cycle of Smartphones; Part V: ICT network operators questionnaire.
Author Contributions
J.M. and D.L. have contributed jointly in developing research methodology, required data collection, and writing the paper including introduction, scope, methodology, key trends and key data, results, discussion and conclusions. J.M. has been the main responsible person for data compilation and figure design.
Funding
This research received no external funding.
Acknowledgments
The authors wish to thank all the anonymous operators that willingly contributed measurements and by that made this study possible! In addition, we would like to send our gratitude to colleagues at Ericsson and Telia that have significantly contributed to the study, especially Pernilla Bergmark and Sepideh Matinfar who’s contribution has been of huge importance for the achieved results.
Conflicts of Interest
The authors declare no conflict of interest.
References
- World Economic Forum. 2016. Available online: http://www.weforum.org/agenda/2016/01/what-are-the-top-global-risks-for-2016 (accessed on 1 February 2016).
- Malmodin, J.; Moberg, Å.; Lundén, D.; Finnveden, G.; Lövehagen, N. Greenhouse gas emissions and operational electricity use in the ICT and Entertainment & media sectors. J. Ind. Ecol. 2010, 14, 770–790. [Google Scholar]
- Malmodin, J.; Bergmark, P.; Lundén, D. The future carbon footprint of the ICT and E&M sectors. In Proceedings of the ICT for Sustainability (ICT4S), Zurich, Switzerland, 9–12 February 2013. [Google Scholar]
- Malmodin, J.; Lundén, D. The Energy and Carbon Footprint of the Global ICT and E&M Sectors 2010–2015. In Proceedings of the ICT4S2018. 5th International Conference on Information and Communication Technology for Sustainability, Toronto, ON, Canada, 14–18 May 2018. [Google Scholar]
- The Guardian. Tsunami of Data’ Could Consume One Fifth of Global Electricity by 2025. Available online: https://www.theguardian.com/environment/2017/dec/11/tsunami-of-data-could-consume-fifth-global-electricity-by-2025 (accessed on 11 December 2017).
- Peter, C.; Andrae, A.S.G. Emerging Trends in Electricity Consumption for Consumer ICT. Available online: https://wireless.kth.se/wp-content/uploads/sites/19/2014/08/Emerging-Trends-in-Electricity-Consumption-for-Consumer-ICT.pdf (accessed on 1 April 2018).
- Andrae, A.S.G.; Edler, T. On Global Electricity Usage of Communication Technology: Trends to 2030. Challenges 2015, 6, 117–157. [Google Scholar] [CrossRef]
- Belkhir, L.; Elmeligi, A. Assessing ICT global emissions footprint: Trends to 2040 & recommendations. J. Clean. Prod. 2018, 177, 448–463. [Google Scholar] [CrossRef]
- Gartner. Green IT: The new industry shock wave. In Proceedings of the Symposium/ITXPO Conference, San Diego, CA, USA, 22–26 April 2007. [Google Scholar]
- Smart 2020: Enabling the Low Carbon Economy in the Information Age. A Report by The Climate Group on Behalf of GeSI. 2008. Available online: https://gesi.org/report/detail/smart-2020-enabling-the-low-carbon-economy-in-the-information-age (accessed on 1 April 2018).
- GeSI. Smarter 2020: The Role of ICT in Driving a Sustainable Future. A Report by Boston Consulting Group on Behalf of GeSI. 2012. Available online: https://gesi.org/report/detail/gesi-smarter2020-the-role-of-ict-in-driving-a-sustainable-future (accessed on 1 April 2018).
- GeSI. #SMARTer2030 ICT Solutions for the 21st Century Challenges. A Report by Accenture on Behalf of GeSI. 2015. Available online: https://gesi.org/report/detail/smarter-2030 (accessed on 1 April 2018).
- Van Heddeghem, W.; Lambert, S.; Lannoo, B.; Colle, D.; Pickavet, M.; Demeester, P. Trends in worldwide ICT electricity consumption from 2007 to 2012. Comput. Commun. 2014, 50, 64–76. [Google Scholar] [CrossRef] [Green Version]
- Kishita, Y.; Yamaguchi, Y.; Umeda, Y.; Shimoda, Y.; Hara, M.; Sakurai, A.; Oka, H.; Tanaka, Y. Describing Long-Term Electricity Demand Scenarios in the Telecommunications Industry: A Case Study of Japan. Sustainability 2016, 8, 52. [Google Scholar] [CrossRef]
- Malmodin, J.; Lundén, D. The Energy and Carbon Footprint of the ICT and E&M Sector in Sweden 1990–2015 and Beyond. In Proceedings of the 4th International Conference on ICT for Sustainability (ICT4S), Amsterdam, The Netherlands, 29 August–1 September 2016. [Google Scholar]
- Federal Ministry for Economic Affairs. Development of ICT-Related Electricity Demand in Germany (Report in German). 2015. Available online: https://www.bmwi.de/Redaktion/DE/Downloads/E/entwicklung-des-ikt-bedingten-strombedarfs-in-deutschland-abschlussbericht.pdf?__blob=publicationFile&v=3 (accessed on 1 April 2018).
- Shehabi, A.; Smith, S.J.; Sartor, D.A.; Brown, R.E.; Herrlin, M.; Koomey, J.G.; Masanet, E.R.; Horner, N.; Azevedo, I.L.; Lintner, W. United States Data Center Energy Usage Report. 2016. Available online: https://eta.lbl.gov/publications/united-states-data-center-energy (accessed on 1 April 2018).[Green Version]
- Urban, B.; Shmakova, V.; Lim, B.; Roth, K. Energy Consumption of Consumer Electronics in U.S. Homes in 2013; Final Report to the Consumer Electronics Association (CEA); Fraunhofer USA Center for Sustainable Energy Systems: Boston, MA, USA, 2014. [Google Scholar]
- Digiconomist. Bitcoin Energy Consumption Index. 2018. Available online: https://digiconomist.net/bitcoin-energy-consumption (accessed on 1 June 2018).
- Malmodin, J.; Coroama, V. Assessing ICT’s Enabling Effect through Case Study Extrapolation—The Example of Smart Metering. In Proceedings of the Electronics Goes Green 2016, Berlin, Germany, 6–9 September 2016; Available online: https://ieeexplore.ieee.org/document/7829814/ (accessed on 1 April 2018).
- Koomey, J.G. Growth in Data Center Electricity Use 2005 to 2010; Analytics Press: Oakland, CA, USA, 2011. [Google Scholar]
- IEA Report. Digitalization & Energy. International Energy Agency, 2017. Available online: https://www.iea.org/publications/freepublications/publication/DigitalizationandEnergy3.pdf (accessed on 1 April 2018).
- Malmodin, J.; Lundén, D. The Electricity Consumption and Operational Carbon Emissions of ICT Network Operators 2010–2015. 2018. Available online: http://www.diva-portal.org/smash/record.jsf?pid=diva2%3A1177210 (accessed on 1 July 2018).
- Malmodin, J.; Lundén, D.; Moberg, Å.; Andersson, G.; Nilsson, M. Life cycle assessment of ICT—Carbon footprint and operational electricity use from the operator, national and subscriber perspective in Sweden. J. Ind. Ecol. 2014, 18, 829–845. [Google Scholar] [CrossRef]
- RISI. Outlook for the World Paper Grade Pulp Market; Pulp and Paper Industry Intelligence: Bedford, MA, USA, 2015. [Google Scholar]
- ITU Key 2005–2017, ICT Data 2017. Available online: https://www.itu.int/en/ITUD/Statistics/Documents/statistics/2017/ITU_Key_2005-2017_ICT_data.xls (accessed on 1 November 2017).
- GSMA. The Mobile Economy 2015. 2015. Available online: https://www.gsma.com/mobileeconomy/archive/GSMA_ME_2015.pdf (accessed on 1 April 2018).
- Digital TV Research. Digital TV World Data Book 2016. 2016. Available online: https://www.digitaltvresearch.com/products/product?id=142 (accessed on 1 April 2018).
- Cisco Visual Networking Index (VNI). 2017. Available online: https://www.cisco.com/c/en/us/solutions/collateral/service-provider/visual-networking-index-vni/complete-white-paper-c11-481360.pdf (accessed on 1 November 2017).
- Enerdata. Global Statistical Yearbook 2017. Electricity Domestic Consumption. 2017. Available online: https://yearbook.enerdata.net/electricity/electricity-domestic-consumption-data.html (accessed on 1 November 2017).
- IEA. CO2 Emissions from Fuel Combustion Highlights. 2017. Available online: https://www.iea.org/publications/freepublications/publication/CO2EmissionsfromFuelCombustionHighlights2017.pdf (accessed on 1 April 2018).
- Olivier, J.G.J.; Schure, K.M.; Peters, J.A.H.W. Trends in Global CO2 and Total Greenhouse Gas Emissions: 2017 Report; PBL Netherlands Environmental Assessment Agency: The Hague, The Netherlands, 2017. [Google Scholar]
- Malmodin, J.; Bergmark, P.; Matinfar, S. A high-level estimate of the material footprints of the Information and Communication Technology and the Entertainment and Media sectors. In Proceedings of the ICT for Sustainability (ICT4S), Toronto, ON, Canada, 13–14 May 2018. [Google Scholar]
- Dell (Bruce Wagner Dell EMC/PG Enterprise Solutions Performance Analysis Team). Intergenerational Energy Efficiency of Dell EMC PowerEdge Servers. White Paper. 2018. Available online: http://en.community.dell.com/techcenter/extras/m/white_papers/20487412/download (accessed on 1 June 2018).
- Fuchs, H.; Shehabi, A.; Ganeshalingam, M.; Desroches, L.-B.; Lim, B.; Roth, K.; Tsao, A. Characteristics and Energy Use of Volume Servers in the United States. Lawrence Berkeley National Laboratory, 2017. Available online: https://escholarship.org/uc/item/8bb5j7ww (accessed on 1 April 2018).[Green Version]
- Google. Google Environmental Report: 2016. Alphabet’s 2016 CDP Climate Change Response. Available online: https://environment.google/resources/ (accessed on 1 April 2018).
- Facebook. Facebook Sustainability. Our Footprint. 2016. Available online: https://sustainability.fb.com/our-footprint/ (accessed on 1 April 2018).
- US EPA. Green Power Partnership. 2018. Available online: https://www.epa.gov/greenpower/green-power-partnership-top-30-tech-telecom (accessed on 1 June 2018).
- Society of Cable Telecommunications Engineers, Inc. Energy 2020. Powering Cable’s Success. 2015. Available online: www.scte.org/energy2020 (accessed on 1 April 2018).
- Jon Peddie Research. 201x. PC Gaming Hardware Market Report and the Add-in-Board Report. Available online: https://www.jonpeddie.com/reports/add-in-board-report (accessed on 1 April 2018).
- Department of Energy and Climate Change. Energy Efficient Products—Helping Us to Cut Energy Use. 2014. Available online: https://assets.publishing.service.gov.uk/government/uploads/system/uploads/attachment_data/file/328083/Energy_efficient_products_-helping_us_to_cut_energy_use_-_publication_version_final.pdf (accessed on 1 April 2018).
- Young, P.W.; Phadke, A.; Shah, N.; Letschert, V. Efficiency improvement opportunities in TVs: Implications for market transformation programs. Energy Policy 2013, 59, 361–372. [Google Scholar] [CrossRef]
- Ercan, M.; Malmodin, J.; Bergmark, P.; Kimfalk, E.; Nilsson, E. Life Cycle Assessment of a Smartphone. In Proceedings of the ICT for Sustainability (ICT4S), Amsterdam, The Netherlands, 30–31 August 2016. [Google Scholar]
- Ernst & Young (EY). Cultural Times. The First Global Map of Cultural and Creative Industries. 2015. Available online: http://unesdoc.unesco.org/images/0023/002357/235710E.pdf (accessed on 1 April 2018).
- International Telecommunication Union (ITU-T). Methodology for Environmental Life Cycle Assessment (LCA) of Information and Communication Technology (ICT) Goods, Networks and Services; ITU-T L.1410; ITU-T: Geneva, Switzerland, 2014. [Google Scholar]
- European Telecommunication Standardization Institute (ETSI). Methodology for Environmental Life Cycle Assessment (LCA) of Information and Communication Technology (ICT) Goods, Networks and Services; ETSI ES 203 199 V1.3.1; ETSI: Sophia Antipolis, France, 2015. [Google Scholar]
- International Telecommunication Union (ITU-T). Methodologies for the Assessment of the Environmental Impact of the Information and Communication Technology Sector; ITU-T L.1450; ITU-T: Geneva, Switzerland, 2018. [Google Scholar]
- International Standardization Organisation (ISO). Life Cycle Assessment—Requirements and Guidelines; ISO 14044:2006; ISO: Geneva, Switzerland, 2006. [Google Scholar]
Figure 1.
Total carbon footprint results for the ICT and E&M sectors in Sweden in 2015 [15]. The dotted line shows the emissions if world average electricity mix would have been used instead of the low-carbon Swedish mix (Mainly based on hydro and nuclear).
Figure 1.
Total carbon footprint results for the ICT and E&M sectors in Sweden in 2015 [15]. The dotted line shows the emissions if world average electricity mix would have been used instead of the low-carbon Swedish mix (Mainly based on hydro and nuclear).

Figure 2.
(A) Total electricity consumption of the ICT sector in Germany including also TVs and other consumer electronics [16]. Total electricity consumption of (B) data centers [17] and (C) consumer electronics [18] in the US. Note that the unit and scale of the Y-axis is the same in figure (A–C).

Figure 3.
The scope of the study: The ICT and E&M sectors globally. New connected devices in the ICT sector have been considered.
Figure 3.
The scope of the study: The ICT and E&M sectors globally. New connected devices in the ICT sector have been considered.

Figure 4.
Key ICT trends 2005 to 2015. Wireless subscriptions and total (ICT) subscriptions, total data traffic, smartphone sales, and smartphone users (a possible range is shown here, but it is the upper line that is used in this study). Smartphone sales and wireless subscription data to 2017.
Figure 4.
Key ICT trends 2005 to 2015. Wireless subscriptions and total (ICT) subscriptions, total data traffic, smartphone sales, and smartphone users (a possible range is shown here, but it is the upper line that is used in this study). Smartphone sales and wireless subscription data to 2017.

Figure 5.
Server statistics (A) and estimated electricity consumption (B) of data centers globally (all server installations, also “in closets”). Based on IDC, Koomey [21], and IEA [22]. ICT network operators own data centers (20 TWh) and ICT and E&M manufacturers own data centers (10 + TWh) reported as data centers here (have been subtracted from ICT networks and ICT manufacturing data to avoid double accounting).

Figure 6.
Total operational electricity consumption (A) and carbon footprint (B) of ICT network operations globally in 2010 and 2015, based on Ref. [23]. On-site generation is mainly done with diesel generators but solar (PV) is increasing fast. Note that the ICT network operators own data centers is included in this figure which is reused from Ref. [23], but in the present study, all data centers are allocated to the sub-sector data centers.

Figure 7.
Total global TV, PC, and tablet sales 2007–2017 including some historical forecasts later proved to be too high. Sources (see Table 1 for details): IDC, Gartner, his, and Digital TV Research. For additional information, see Supplementary Information.
Figure 7.
Total global TV, PC, and tablet sales 2007–2017 including some historical forecasts later proved to be too high. Sources (see Table 1 for details): IDC, Gartner, his, and Digital TV Research. For additional information, see Supplementary Information.

Figure 8.
Electricity consumption of TVs in EU households 1990–2020 [41].
Figure 8.
Electricity consumption of TVs in EU households 1990–2020 [41].

Figure 9.
Global production of graphical paper for news and printing & writing 2000–2016 [25].
Figure 9.
Global production of graphical paper for news and printing & writing 2000–2016 [25].

Figure 10.
The estimated embodied carbon footprint and use (active life time) carbon footprint for some key user devices. Note that desktop PCs include an LCD monitor and standard peripherals, but laptop PCs do not.
Figure 10.
The estimated embodied carbon footprint and use (active life time) carbon footprint for some key user devices. Note that desktop PCs include an LCD monitor and standard peripherals, but laptop PCs do not.

Figure 11.
Total carbon footprint of the materials acquisition and production stages of the user devices (often referred to as the “embodied” carbon footprint). The range indicated for materials shows the impact of recycling as discussed in Ref. [33].
Figure 11.
Total carbon footprint of the materials acquisition and production stages of the user devices (often referred to as the “embodied” carbon footprint). The range indicated for materials shows the impact of recycling as discussed in Ref. [33].

Figure 12.
Carbon footprint estimates 2000–2015 and 2020 forecasts for: (A) the ICT sector, (B) the E&M sector (excl. paper media) and (C) paper media. (1) Previous estimates by GeSI in SMART 2020 [10] and SMARTer 2020 [11]. (2) Previous estimates by the authors and Centre for Sustainable Communications (CESC) [2,3]. (3) New estimates in this study.

Figure 13.
Total carbon footprint results for the ICT (A) and E&M (B) sectors in 2015. Note that the uncertain estimate for ICT/E&M services is only included here and not in reported totals elsewhere.
Figure 13.
Total carbon footprint results for the ICT (A) and E&M (B) sectors in 2015. Note that the uncertain estimate for ICT/E&M services is only included here and not in reported totals elsewhere.

Figure 14.
The ICT (A) and E&M (B) sector’s total operational electricity consumption and estimates of the embodied energy (C). Results have only been estimated for 2010 and 2015, so the trend lines between those years are not showing exact behavior. Thus, the electricity consumption may have reached a possible max and then decreased, as illustrated by (a). Additionally, (b) shows on-site generated electricity at mobile base station sites and (c) the network operators own data centers (not reported separately in 2010, estimate shown here). Note that a secondary energy source as electricity cannot be compared directly to a primary energy source like vehicle or heating fuel. Note also that the embodied energy footprint of paper manufacturing is not included.

Figure 15.
The quantity (volume), carbon footprint, weight, and value for the ICT and E&M user devices with the largest carbon footprints. Paper and hardcopy devices are also included. The estimated total weight for each device type is also shown (note that the total weight of all papers used is out-of-scale.

Figure 16.
Total data traffic, operational electricity consumption, and number of users in the ICT sector 1990 to 2020. The figures are founded on Ref. [3], slightly updated with results from this study.
Figure 16.
Total data traffic, operational electricity consumption, and number of users in the ICT sector 1990 to 2020. The figures are founded on Ref. [3], slightly updated with results from this study.

Figure 17.
Total data traffic, operational electricity consumption, and number of users of the ICT sector 1990 to 2020. Note that only human users are counted in the subscription data available and not IoT connections.
Figure 17.
Total data traffic, operational electricity consumption, and number of users of the ICT sector 1990 to 2020. Note that only human users are counted in the subscription data available and not IoT connections.

Figure 18.
A future IoT scenario.


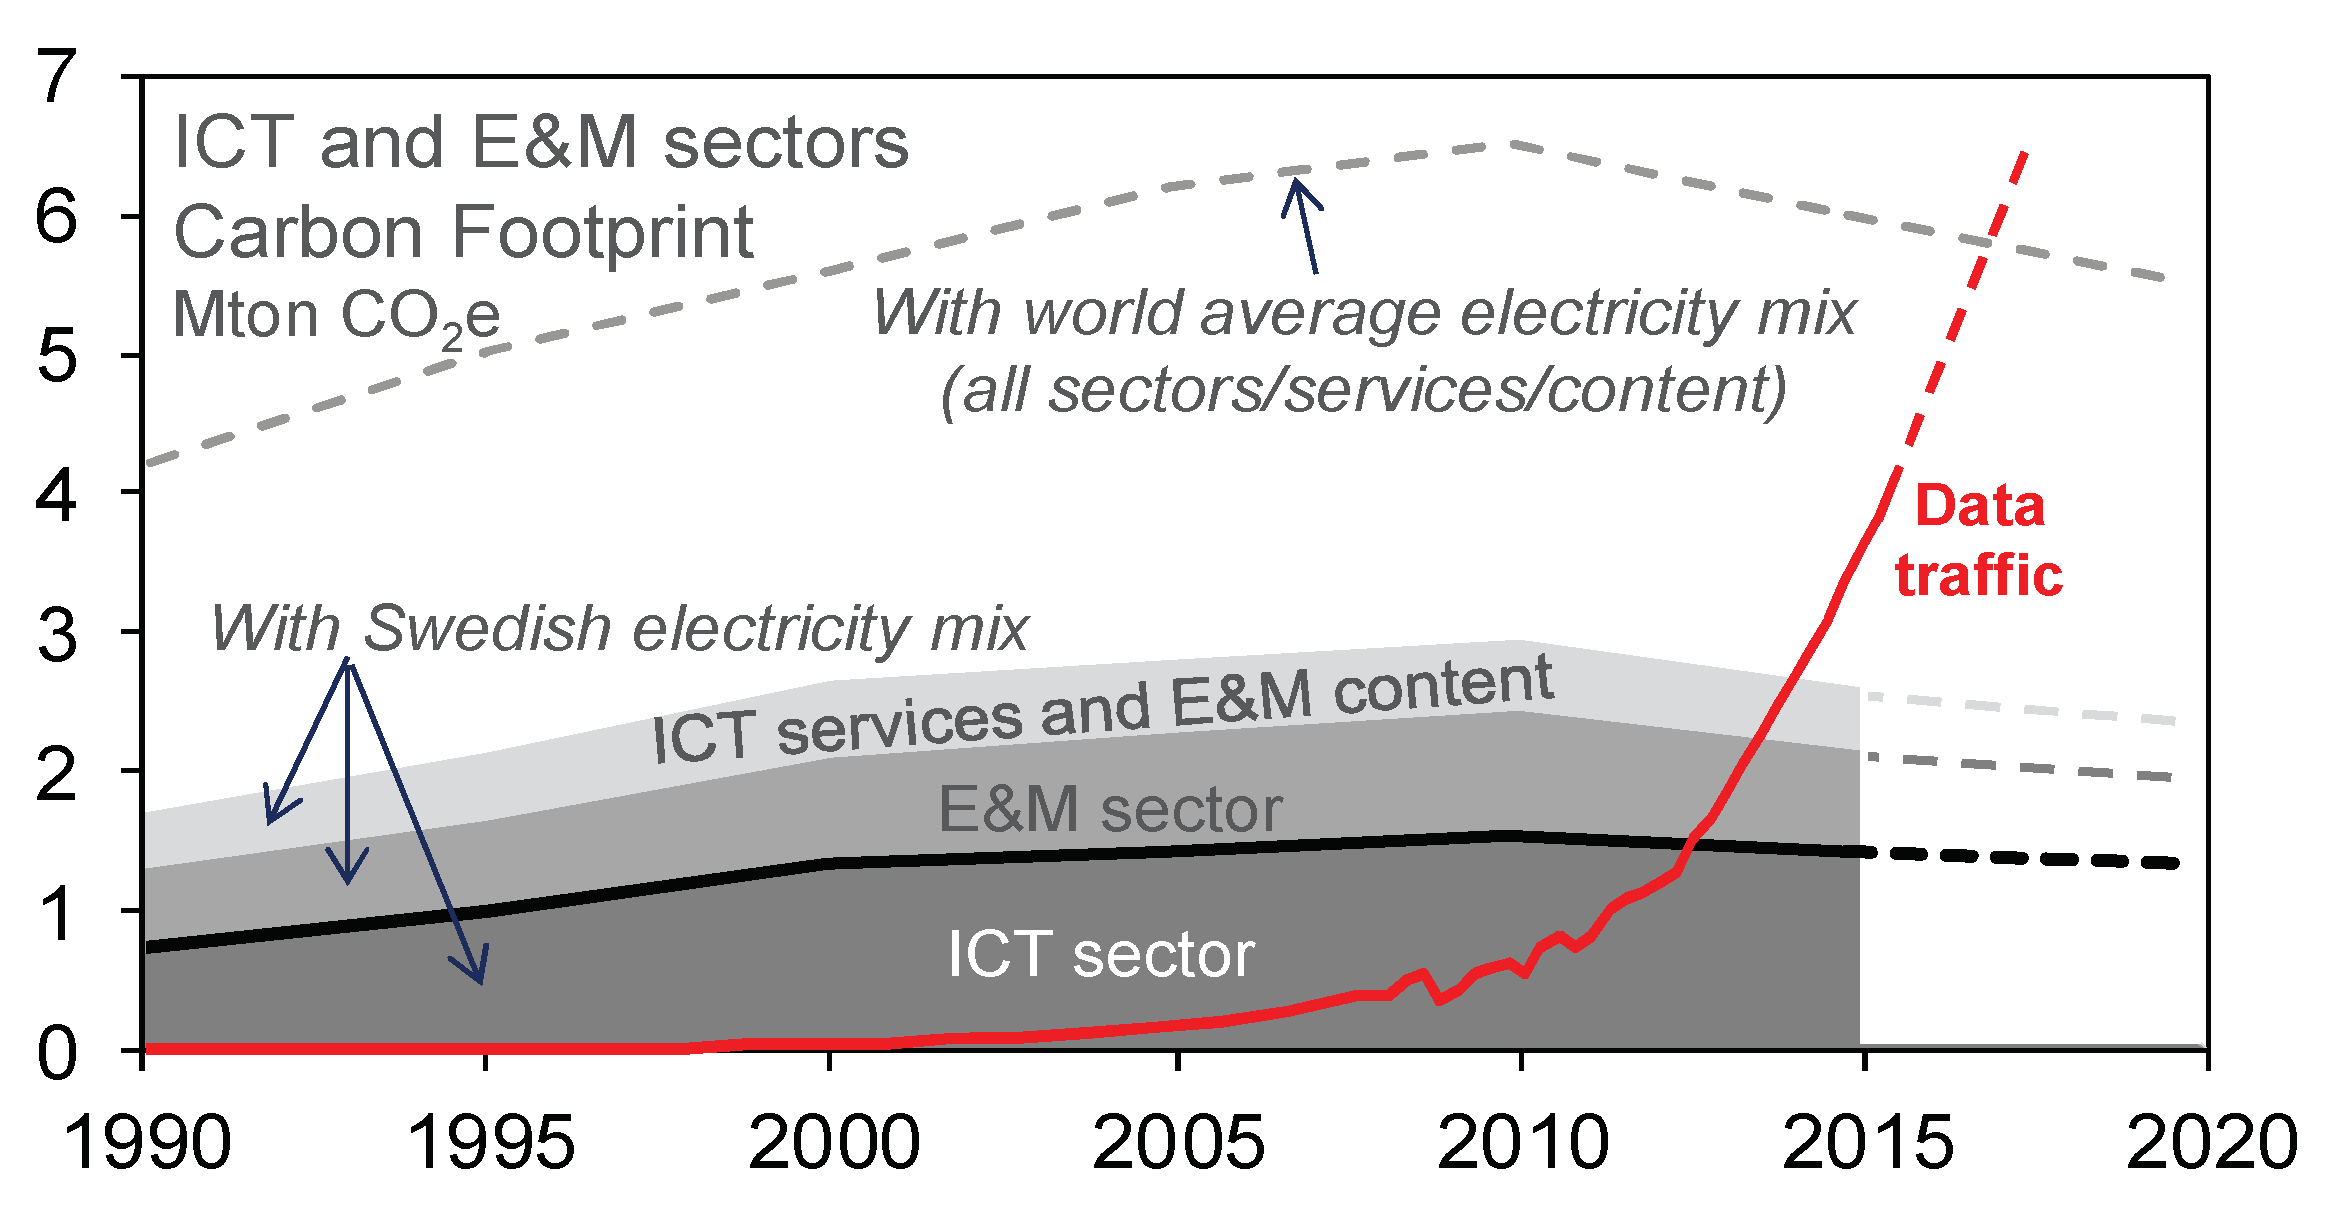
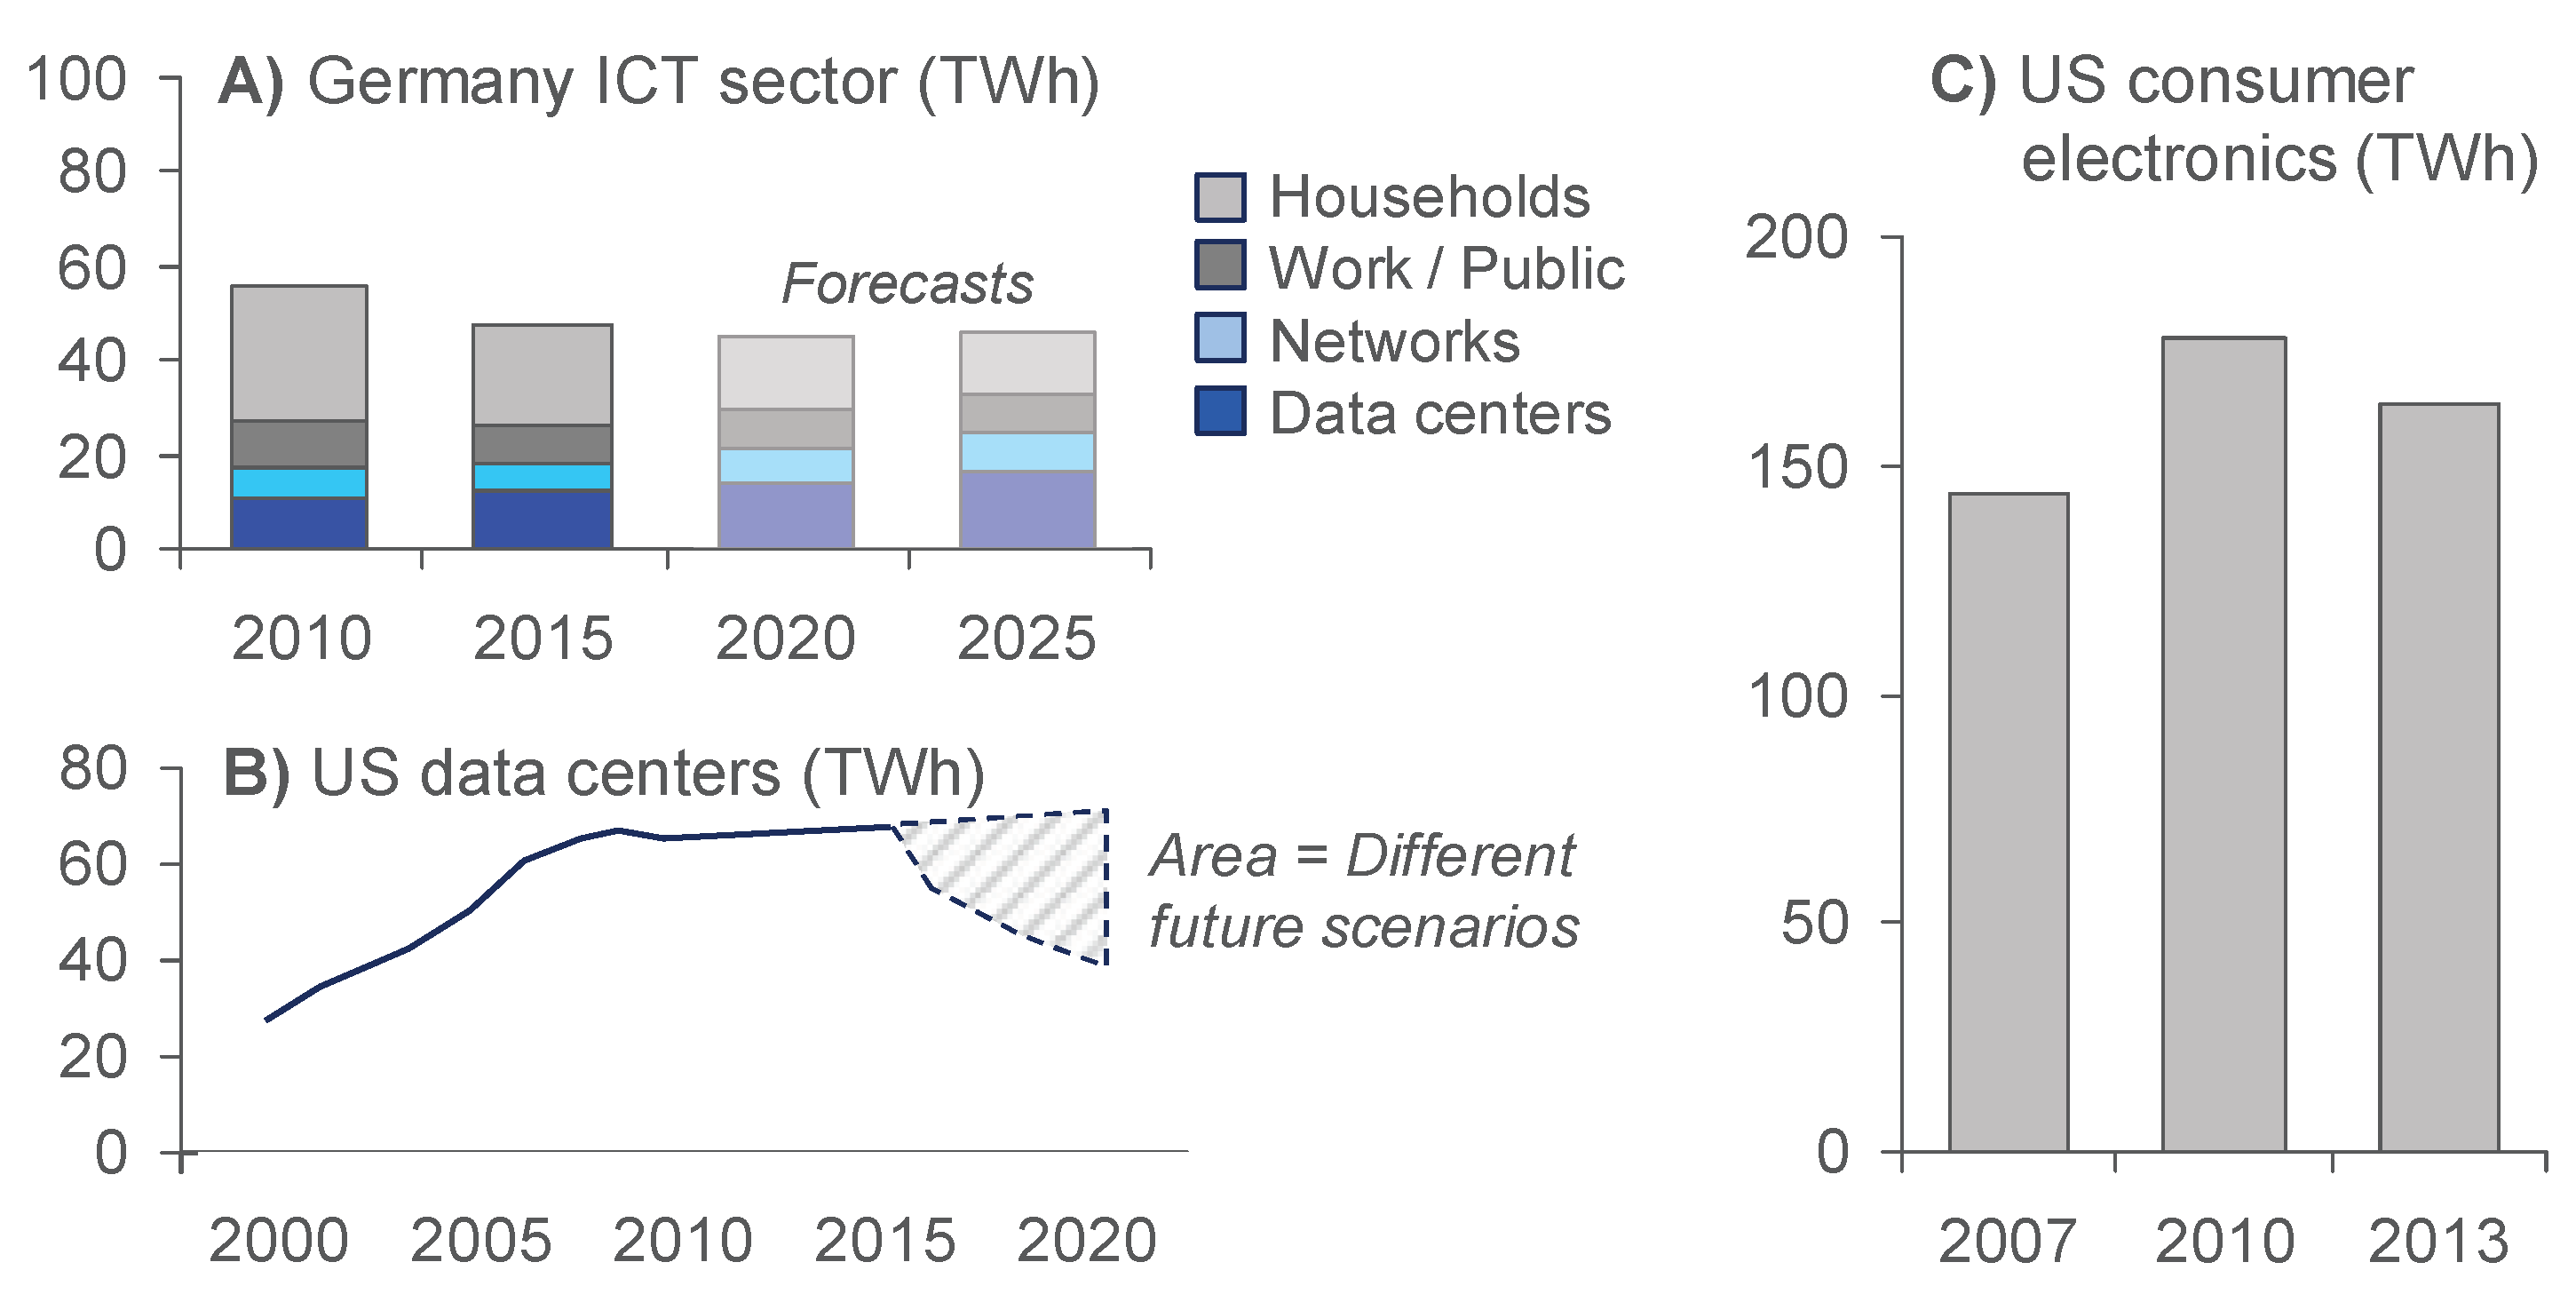
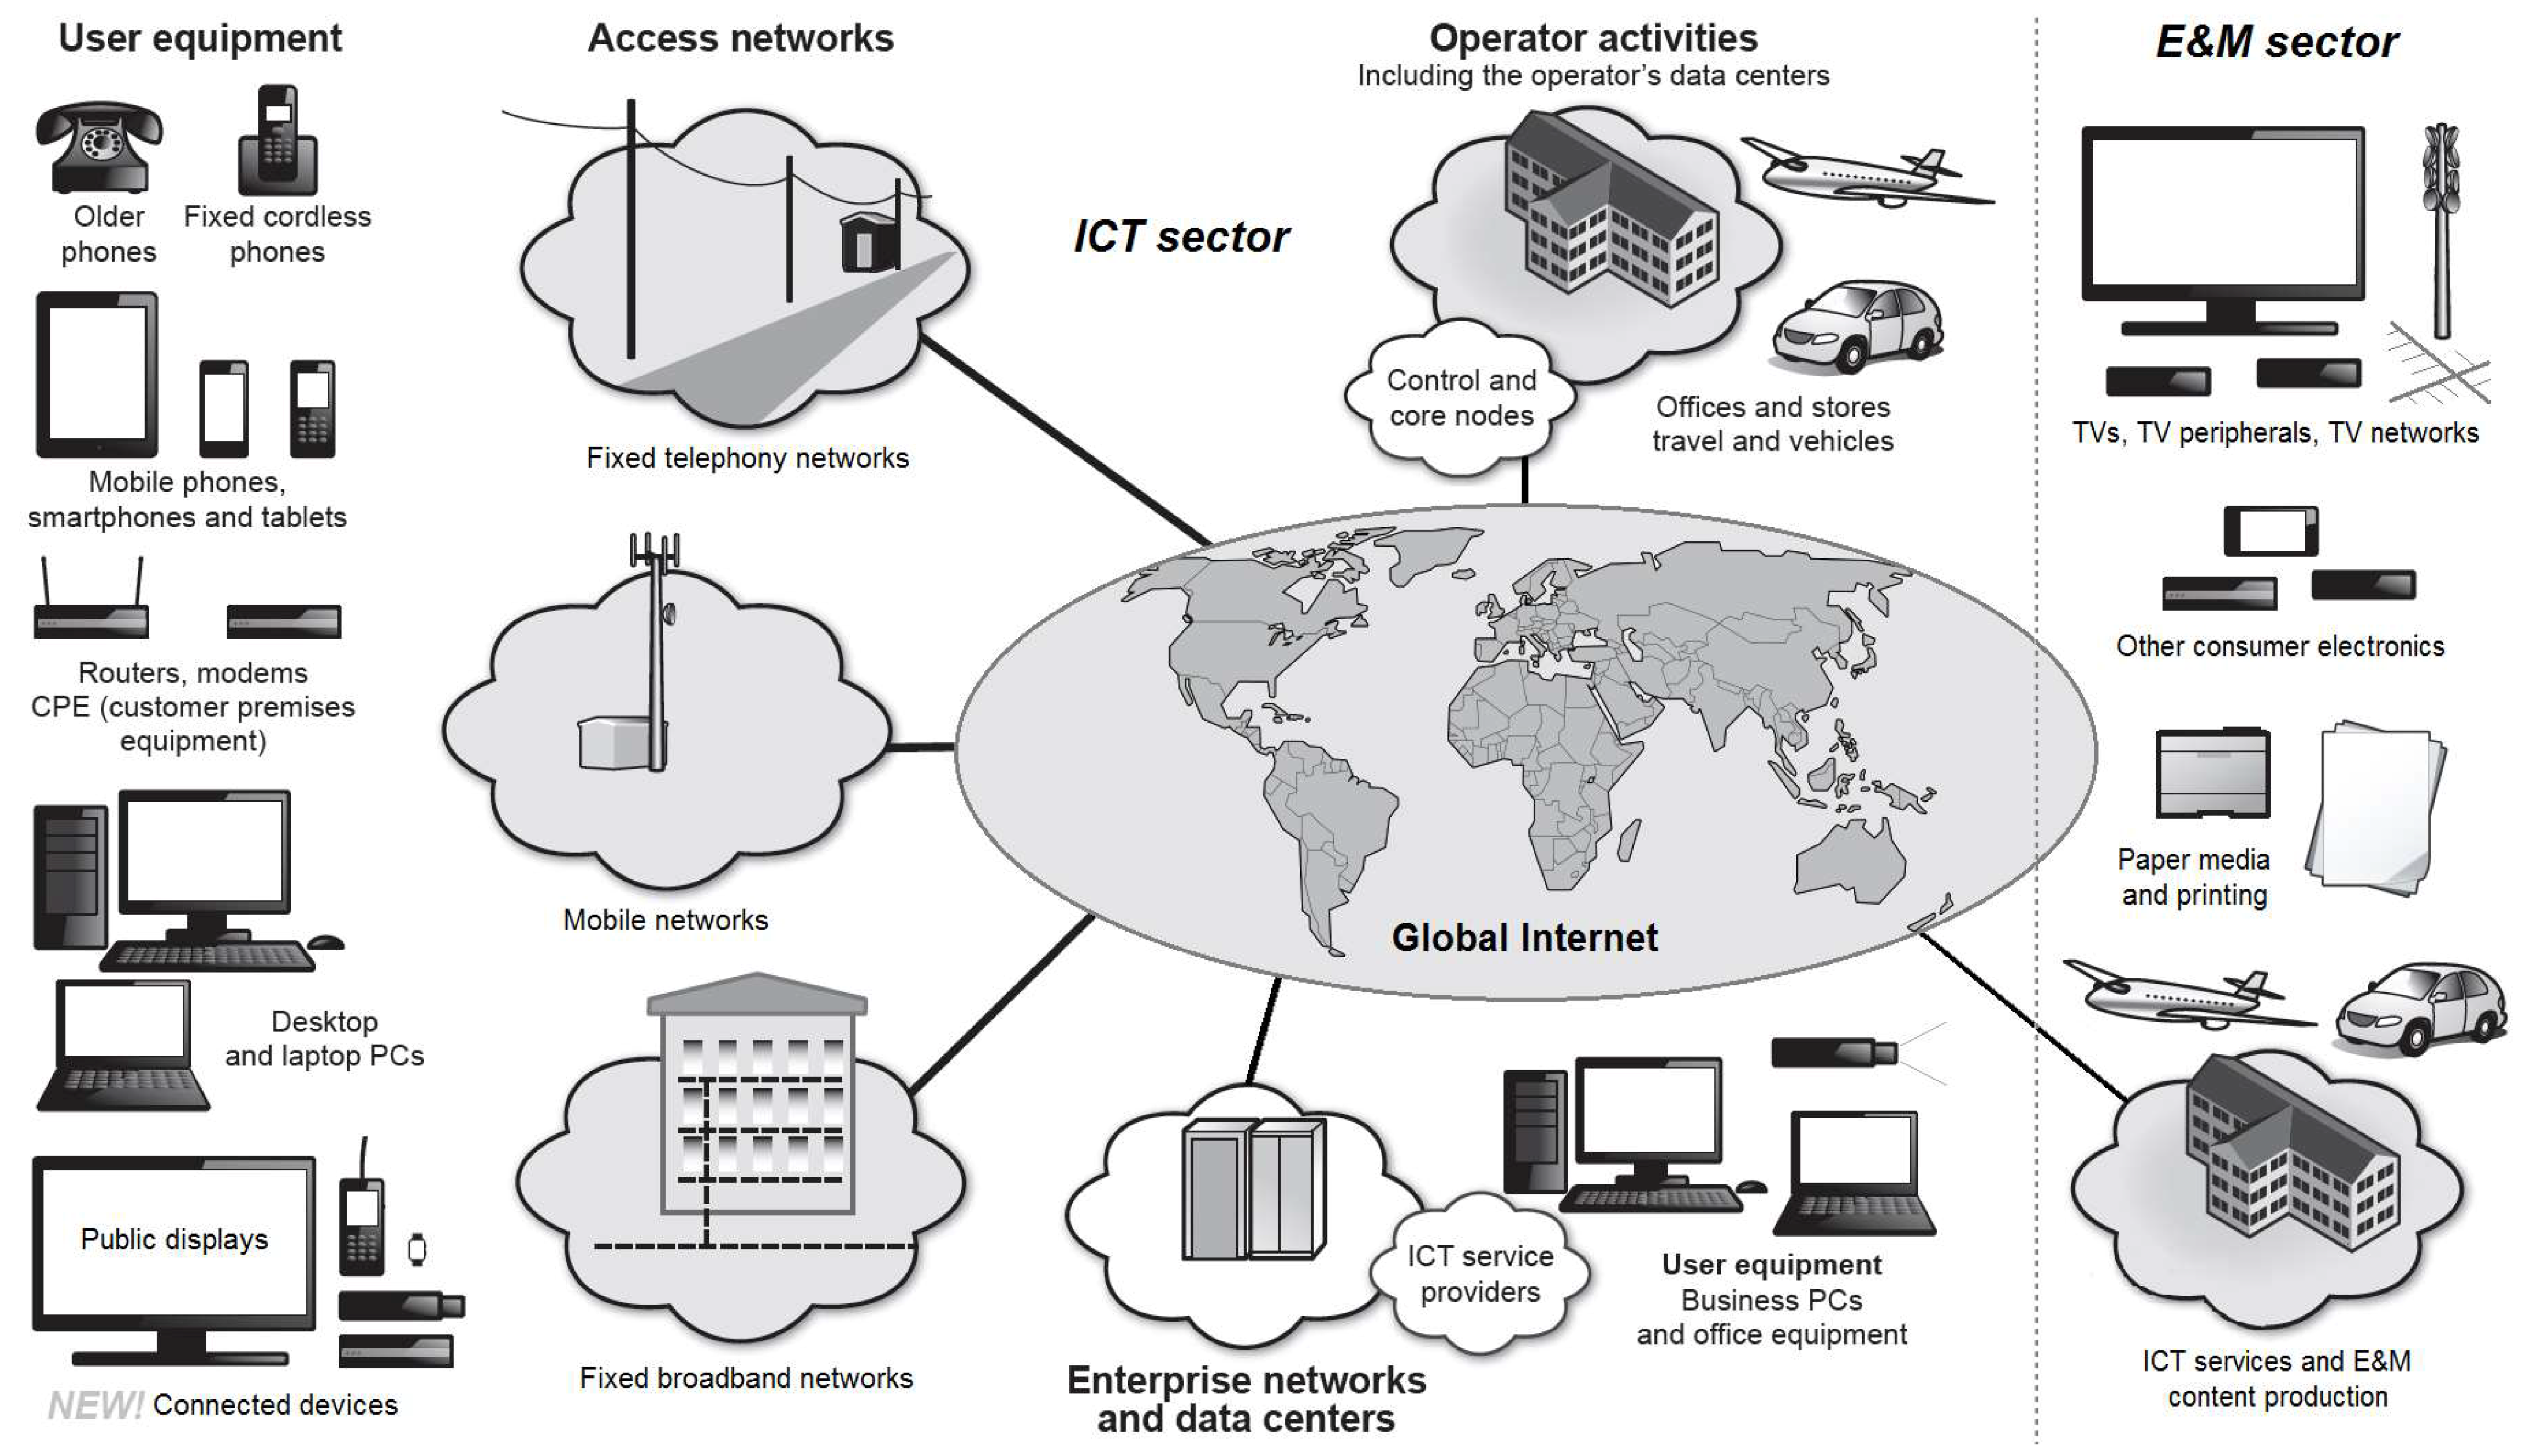
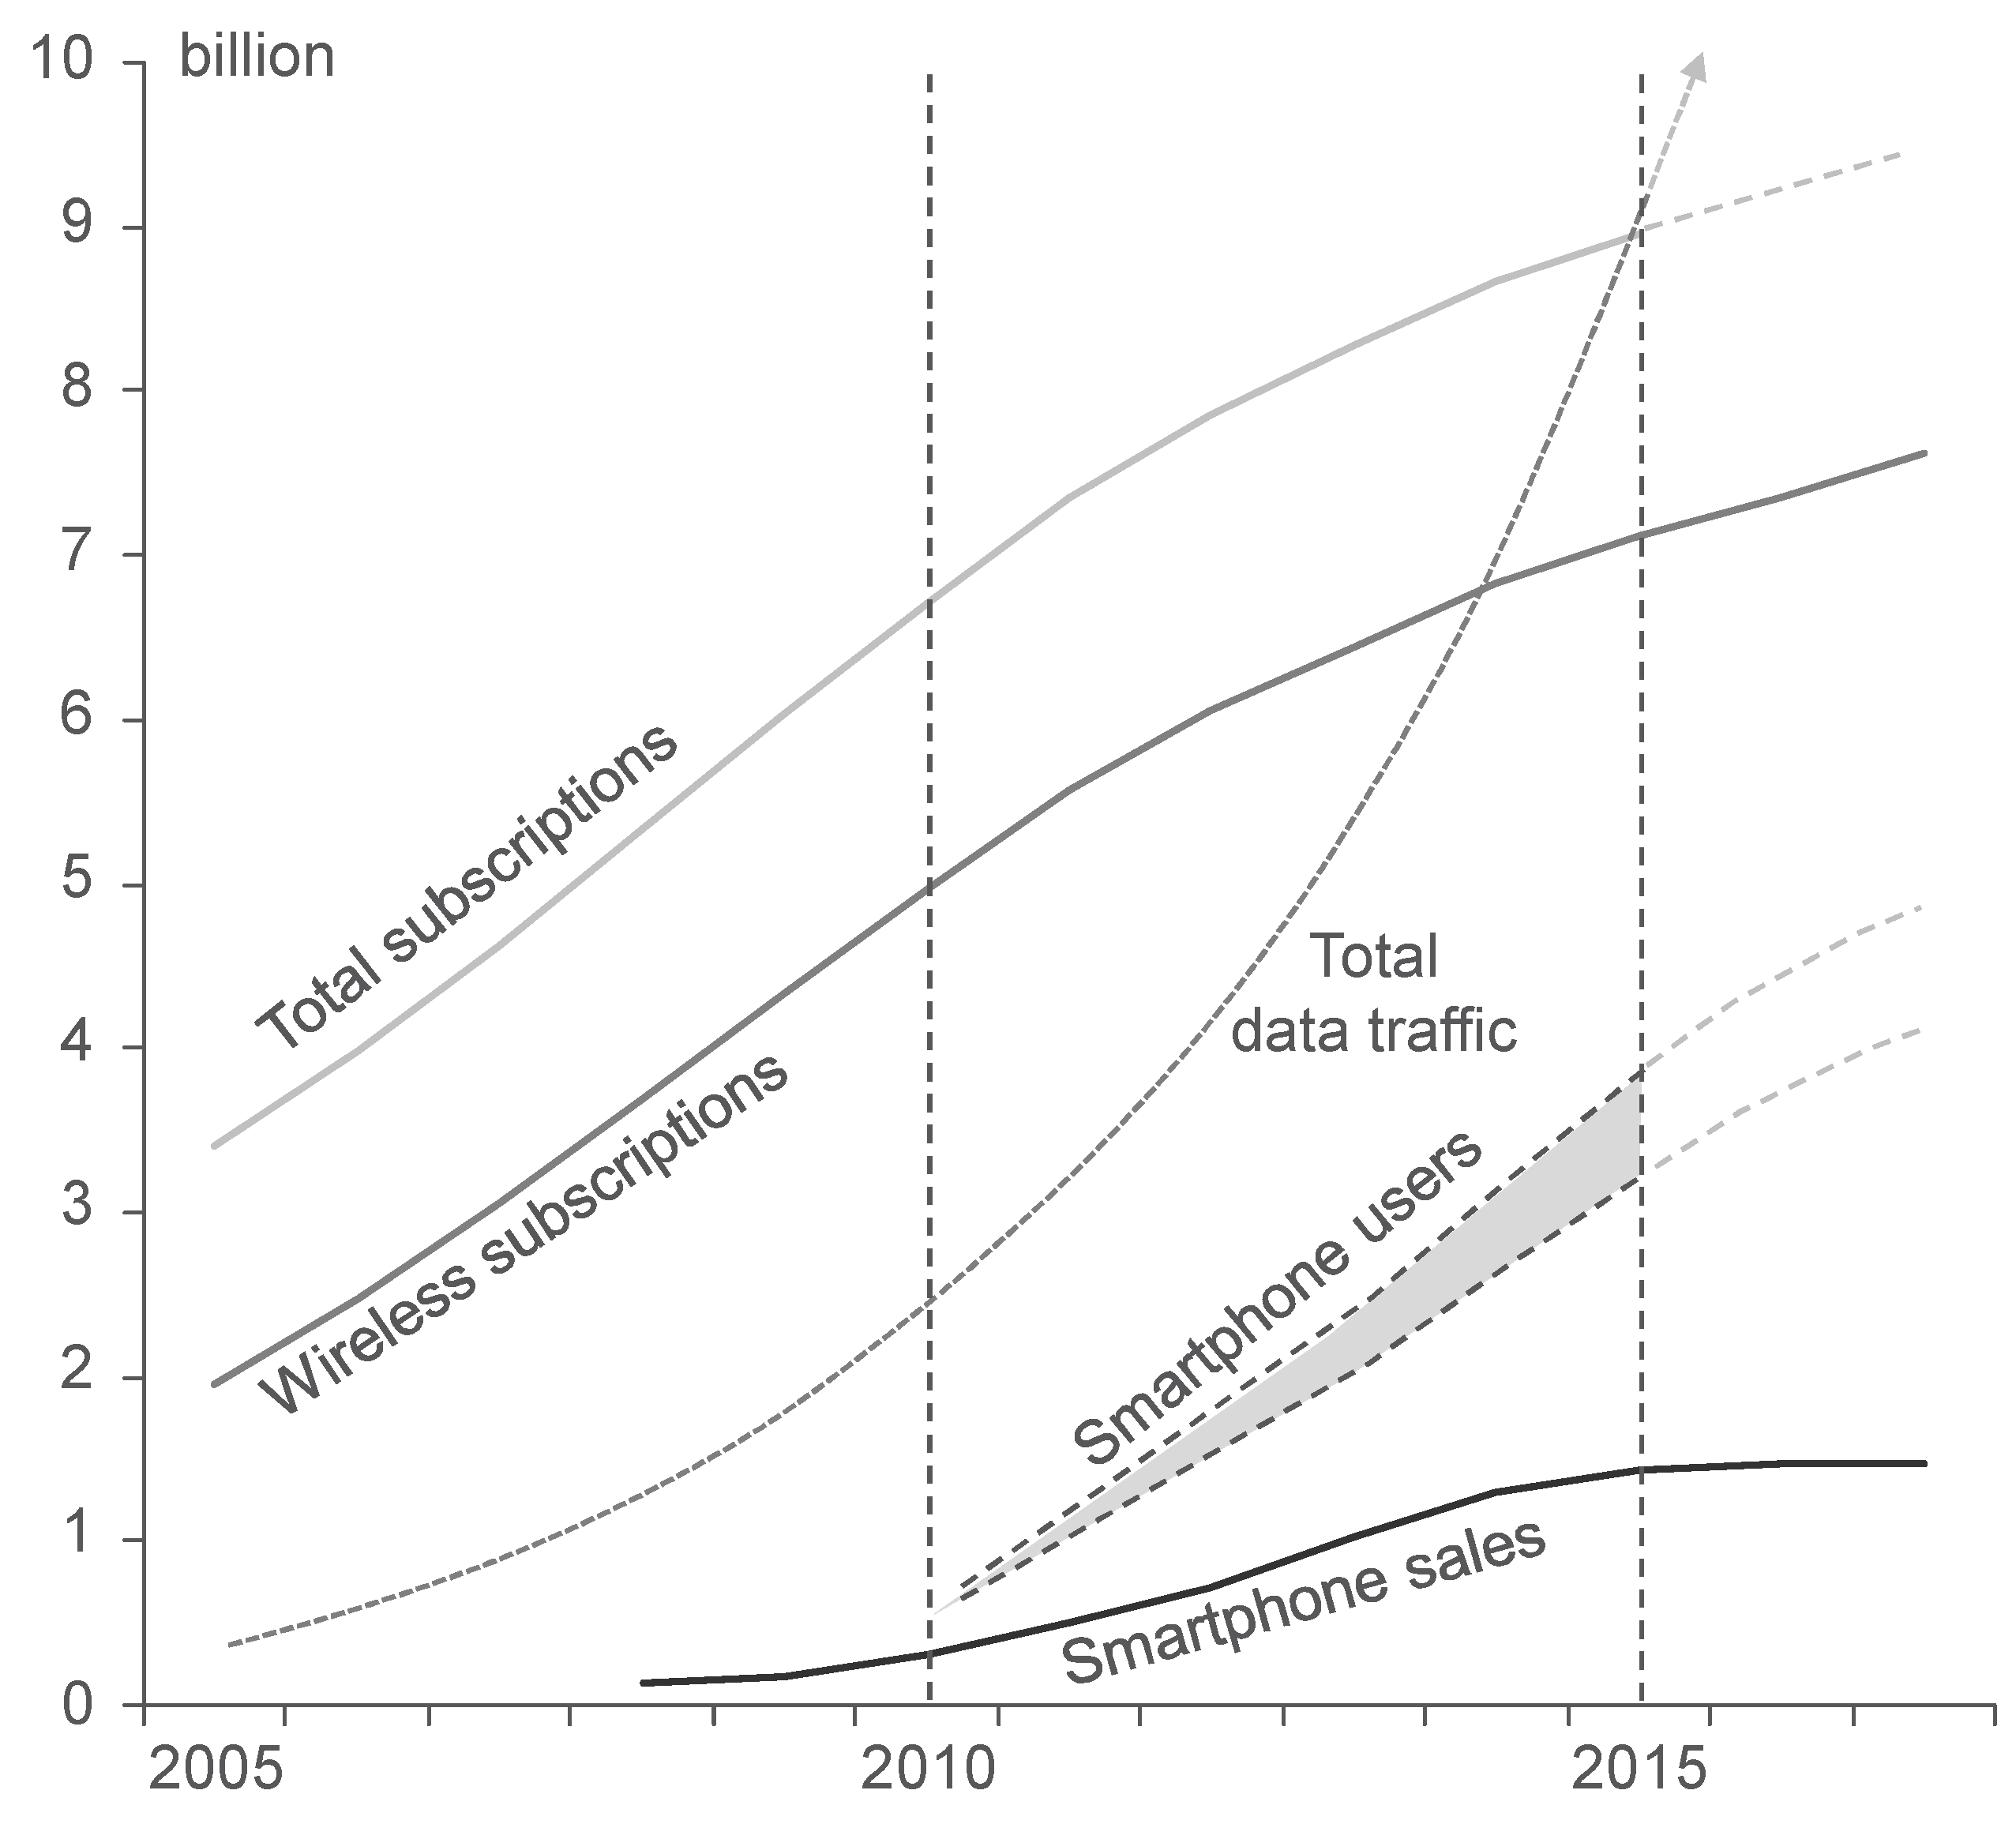
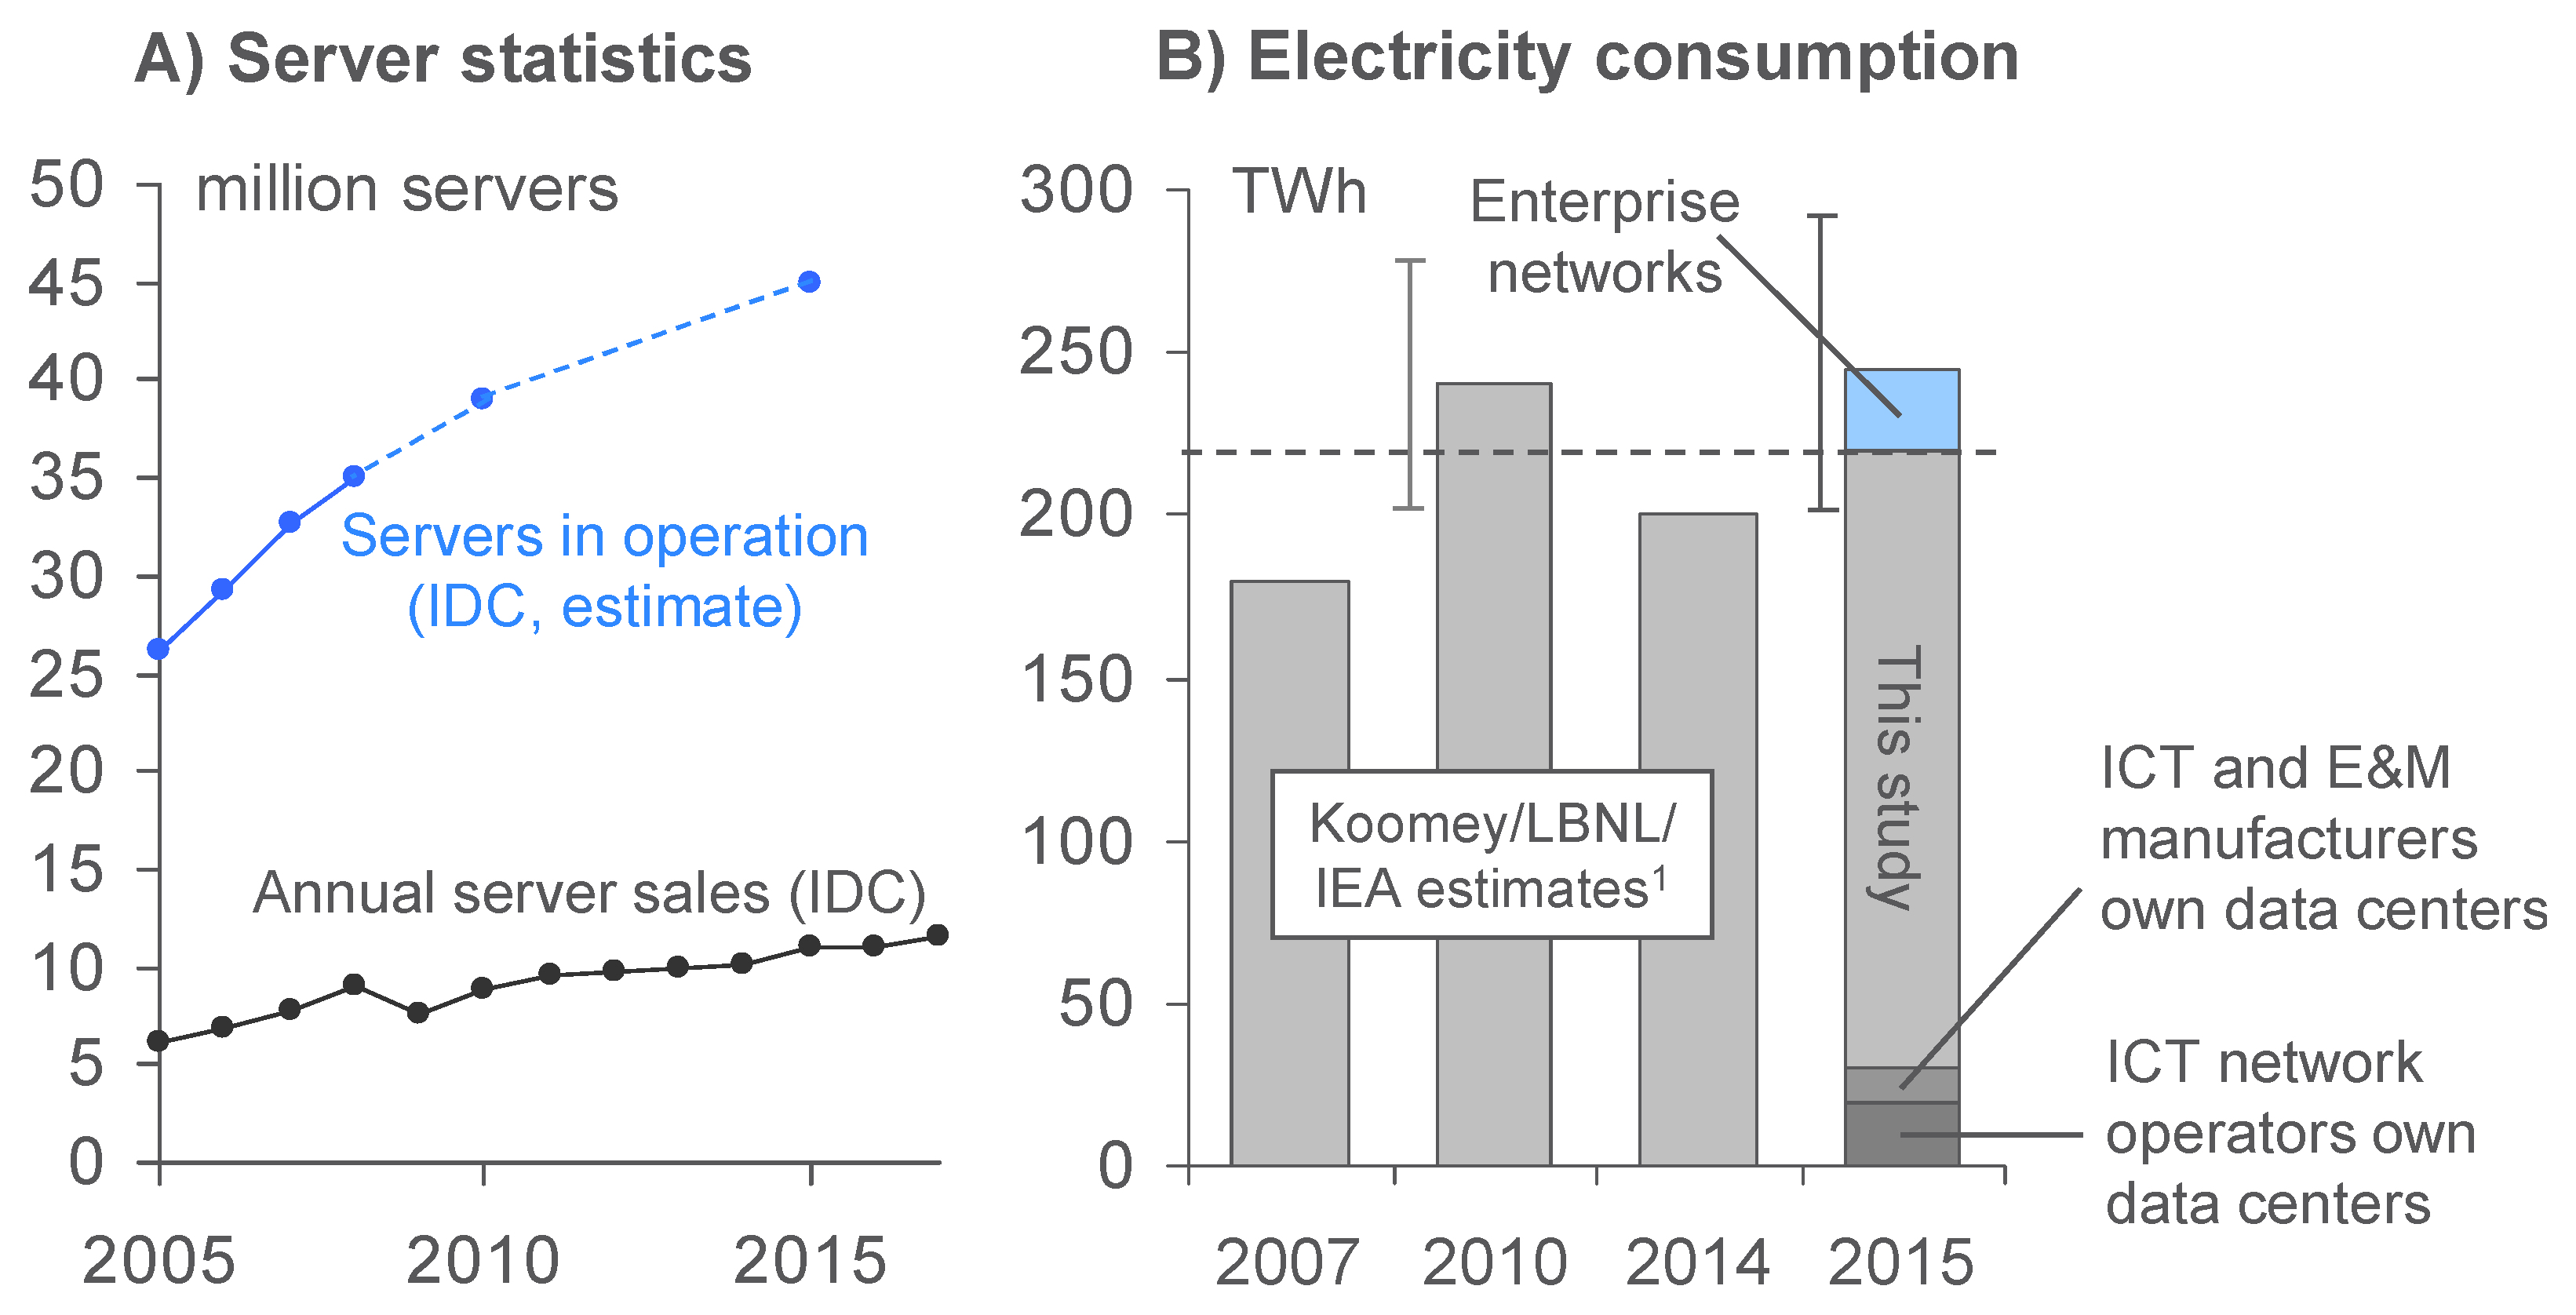
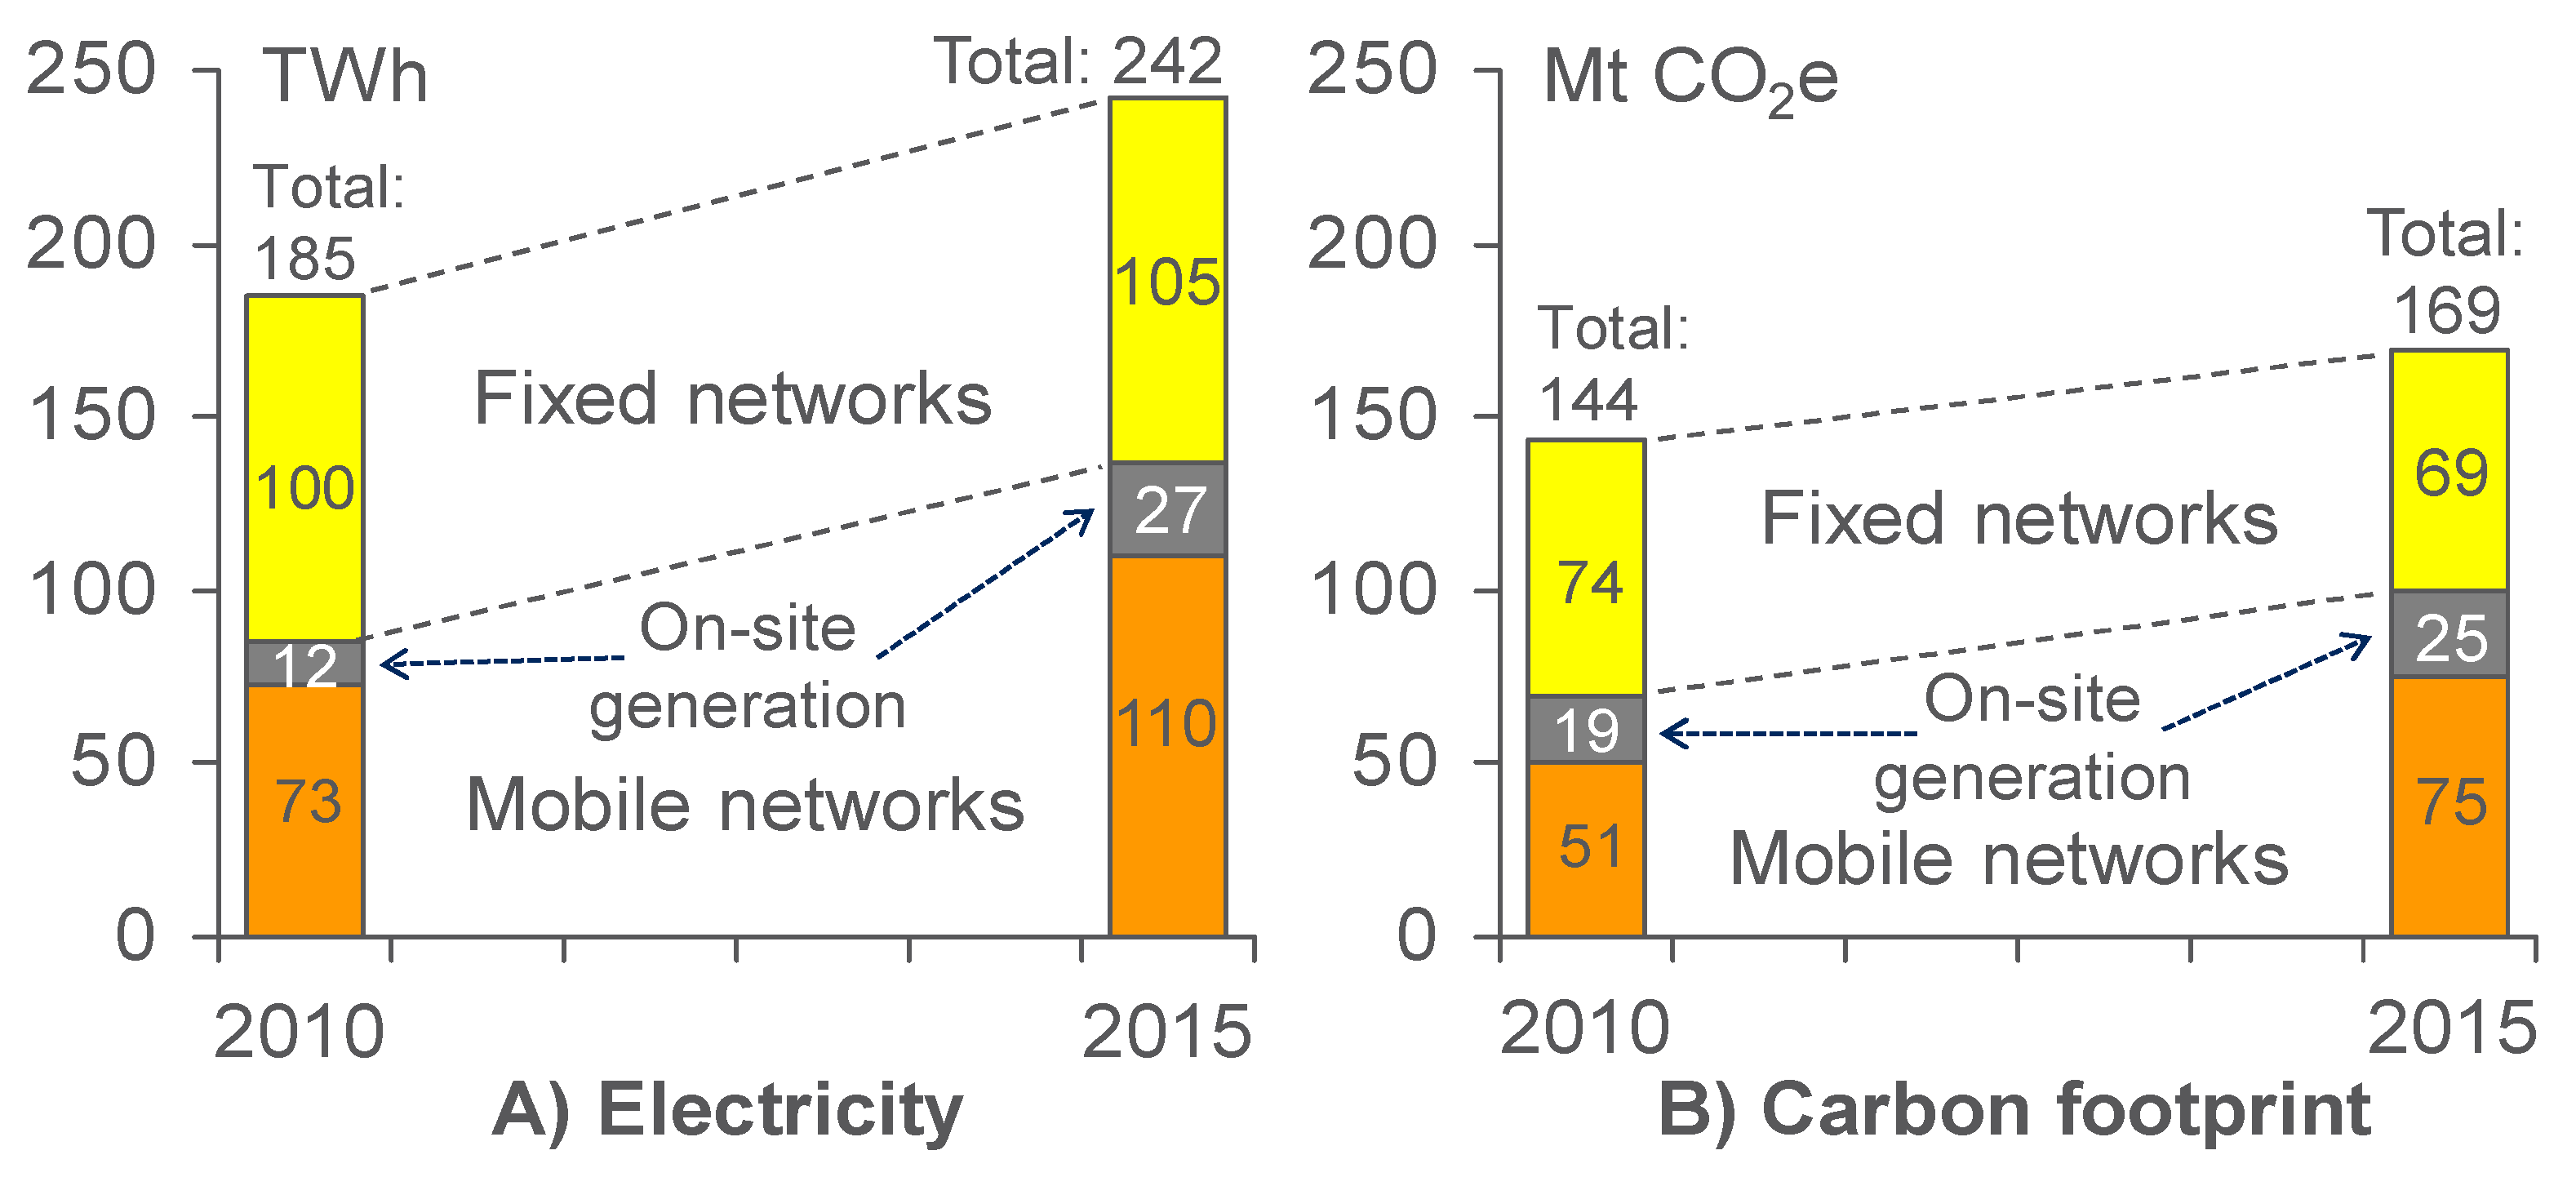
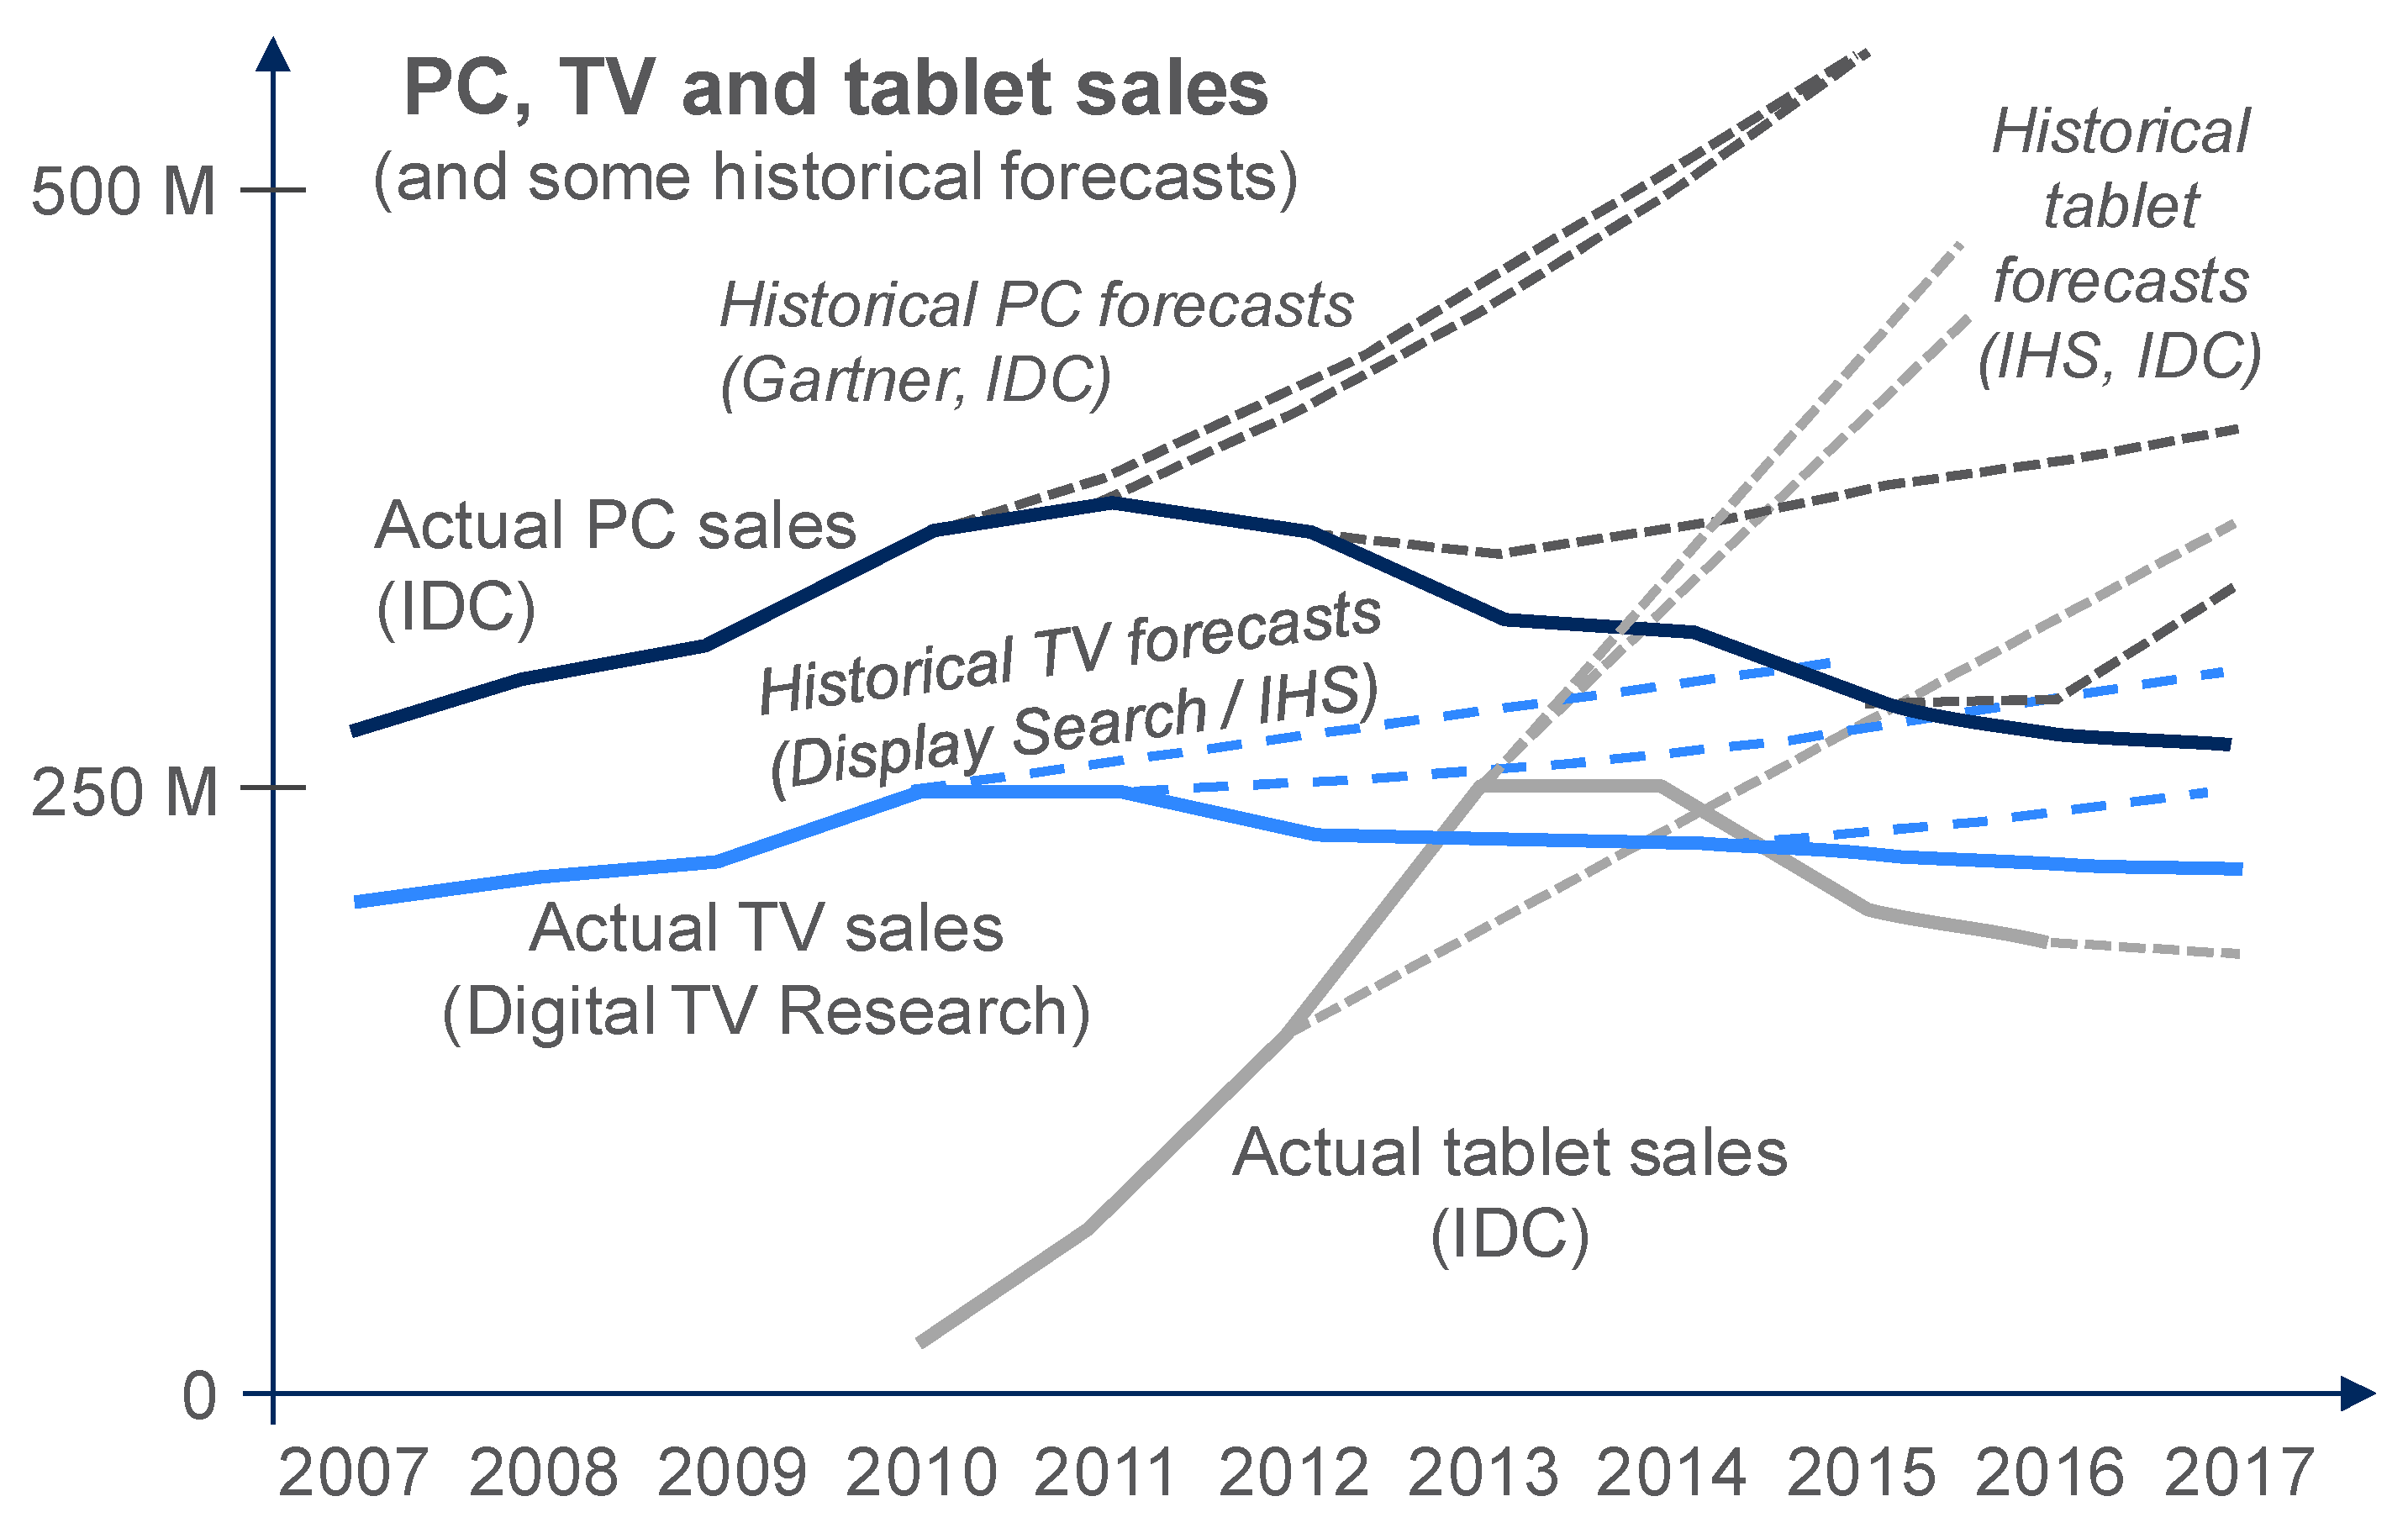
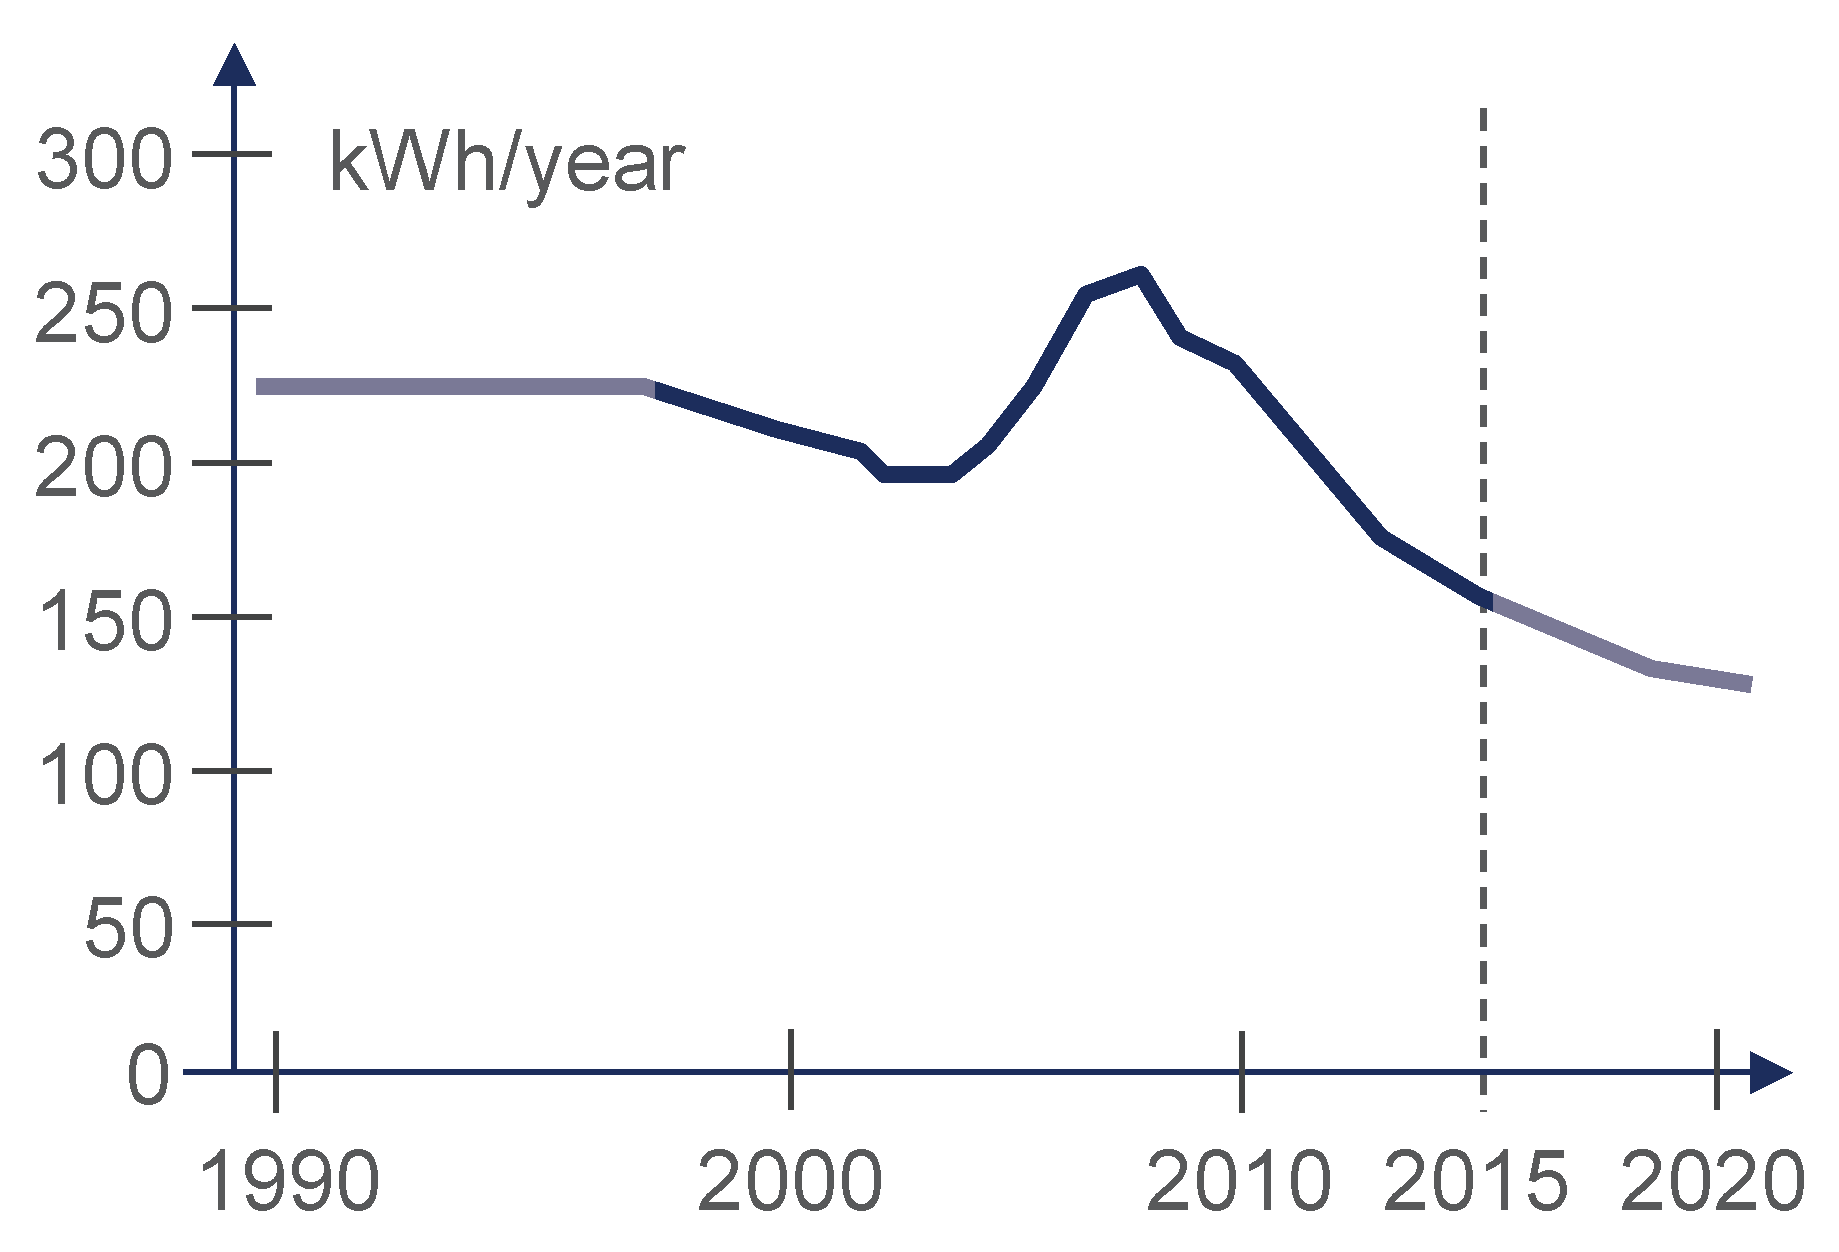
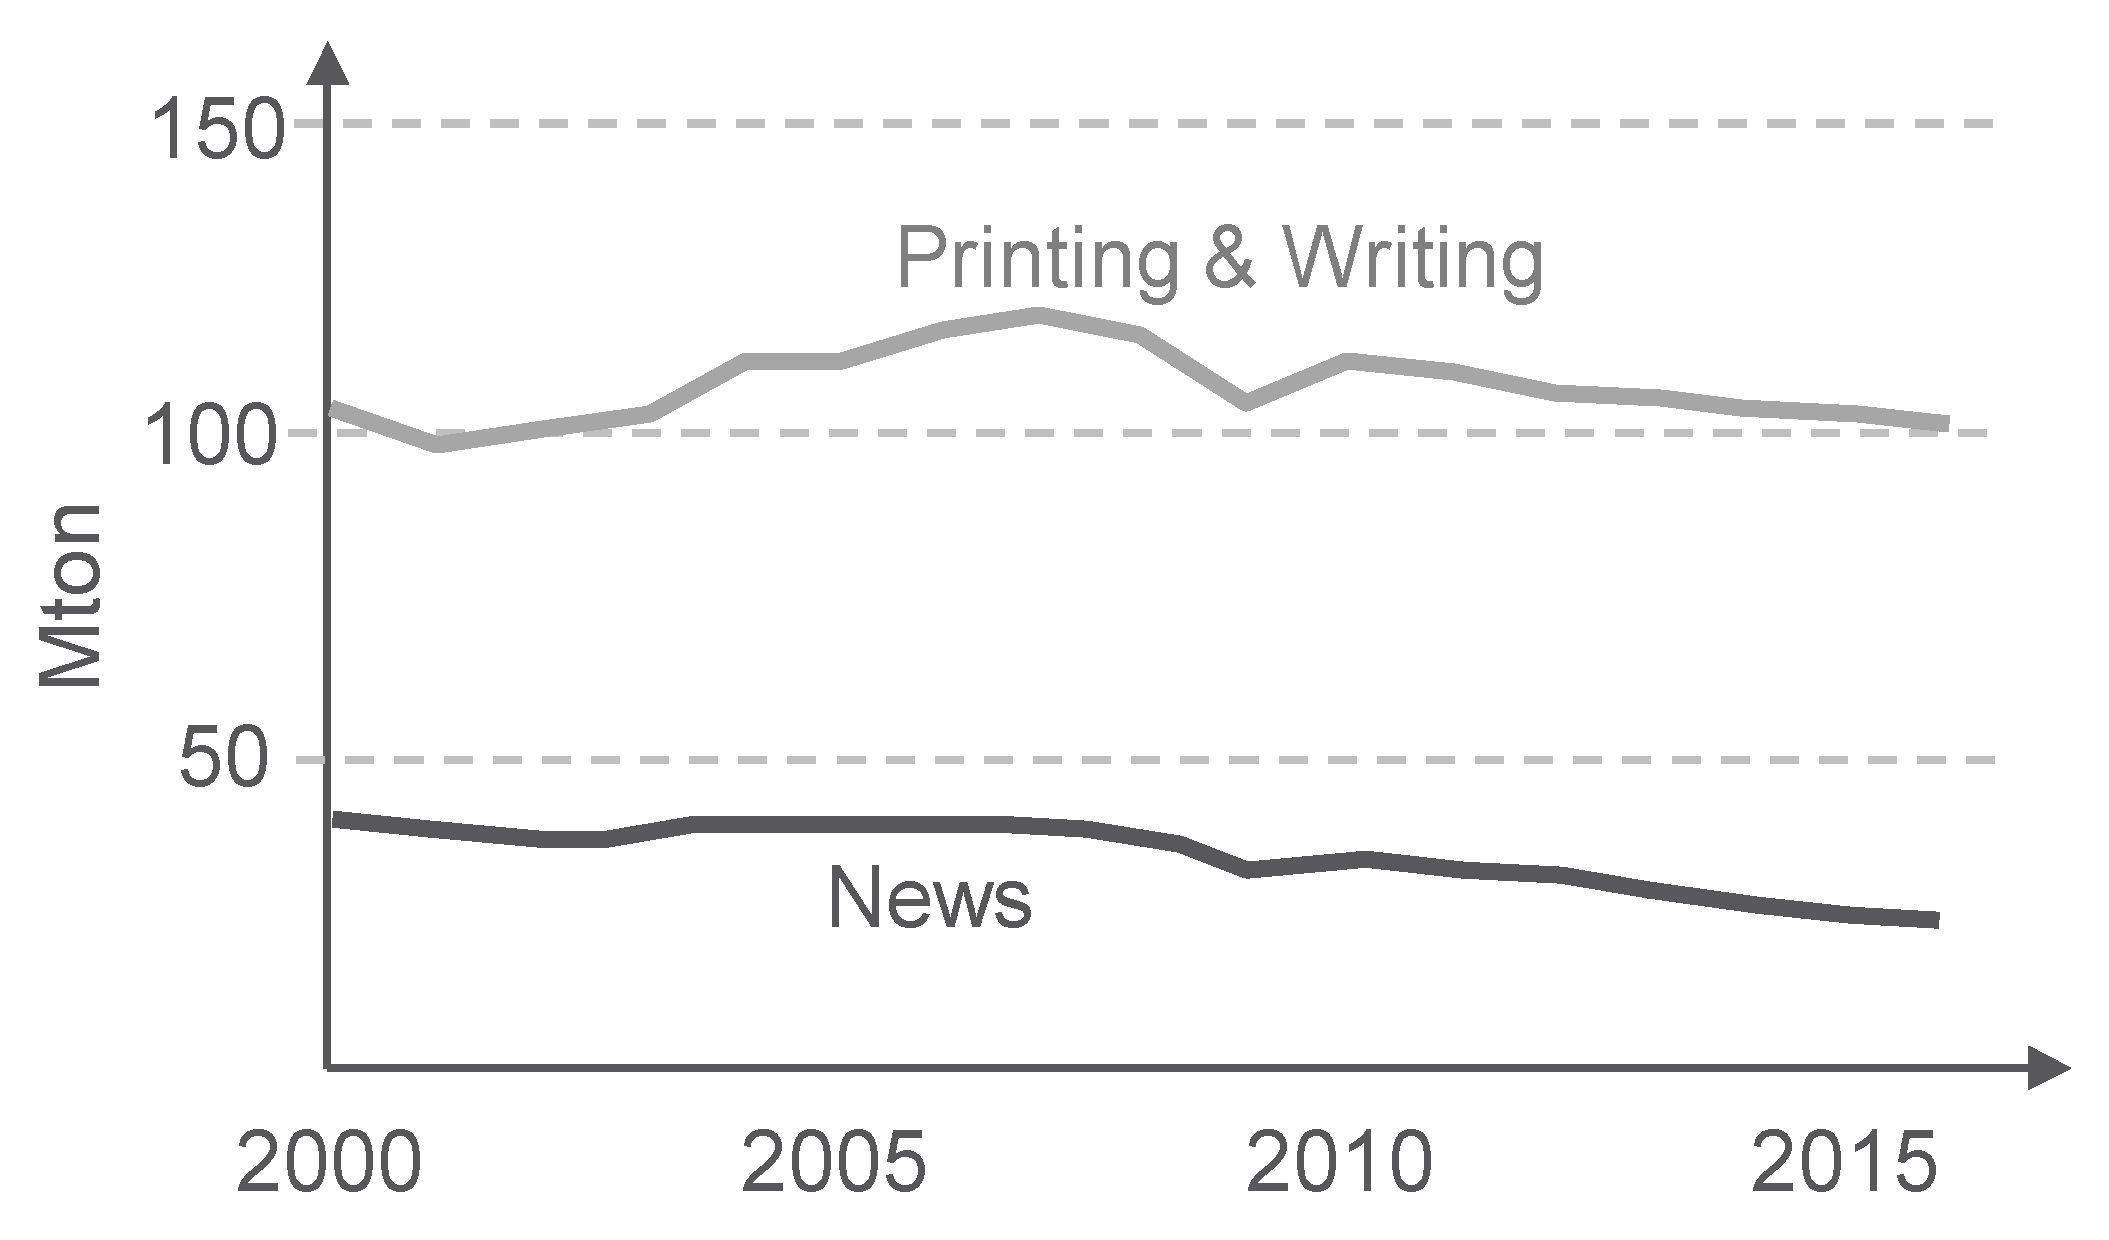
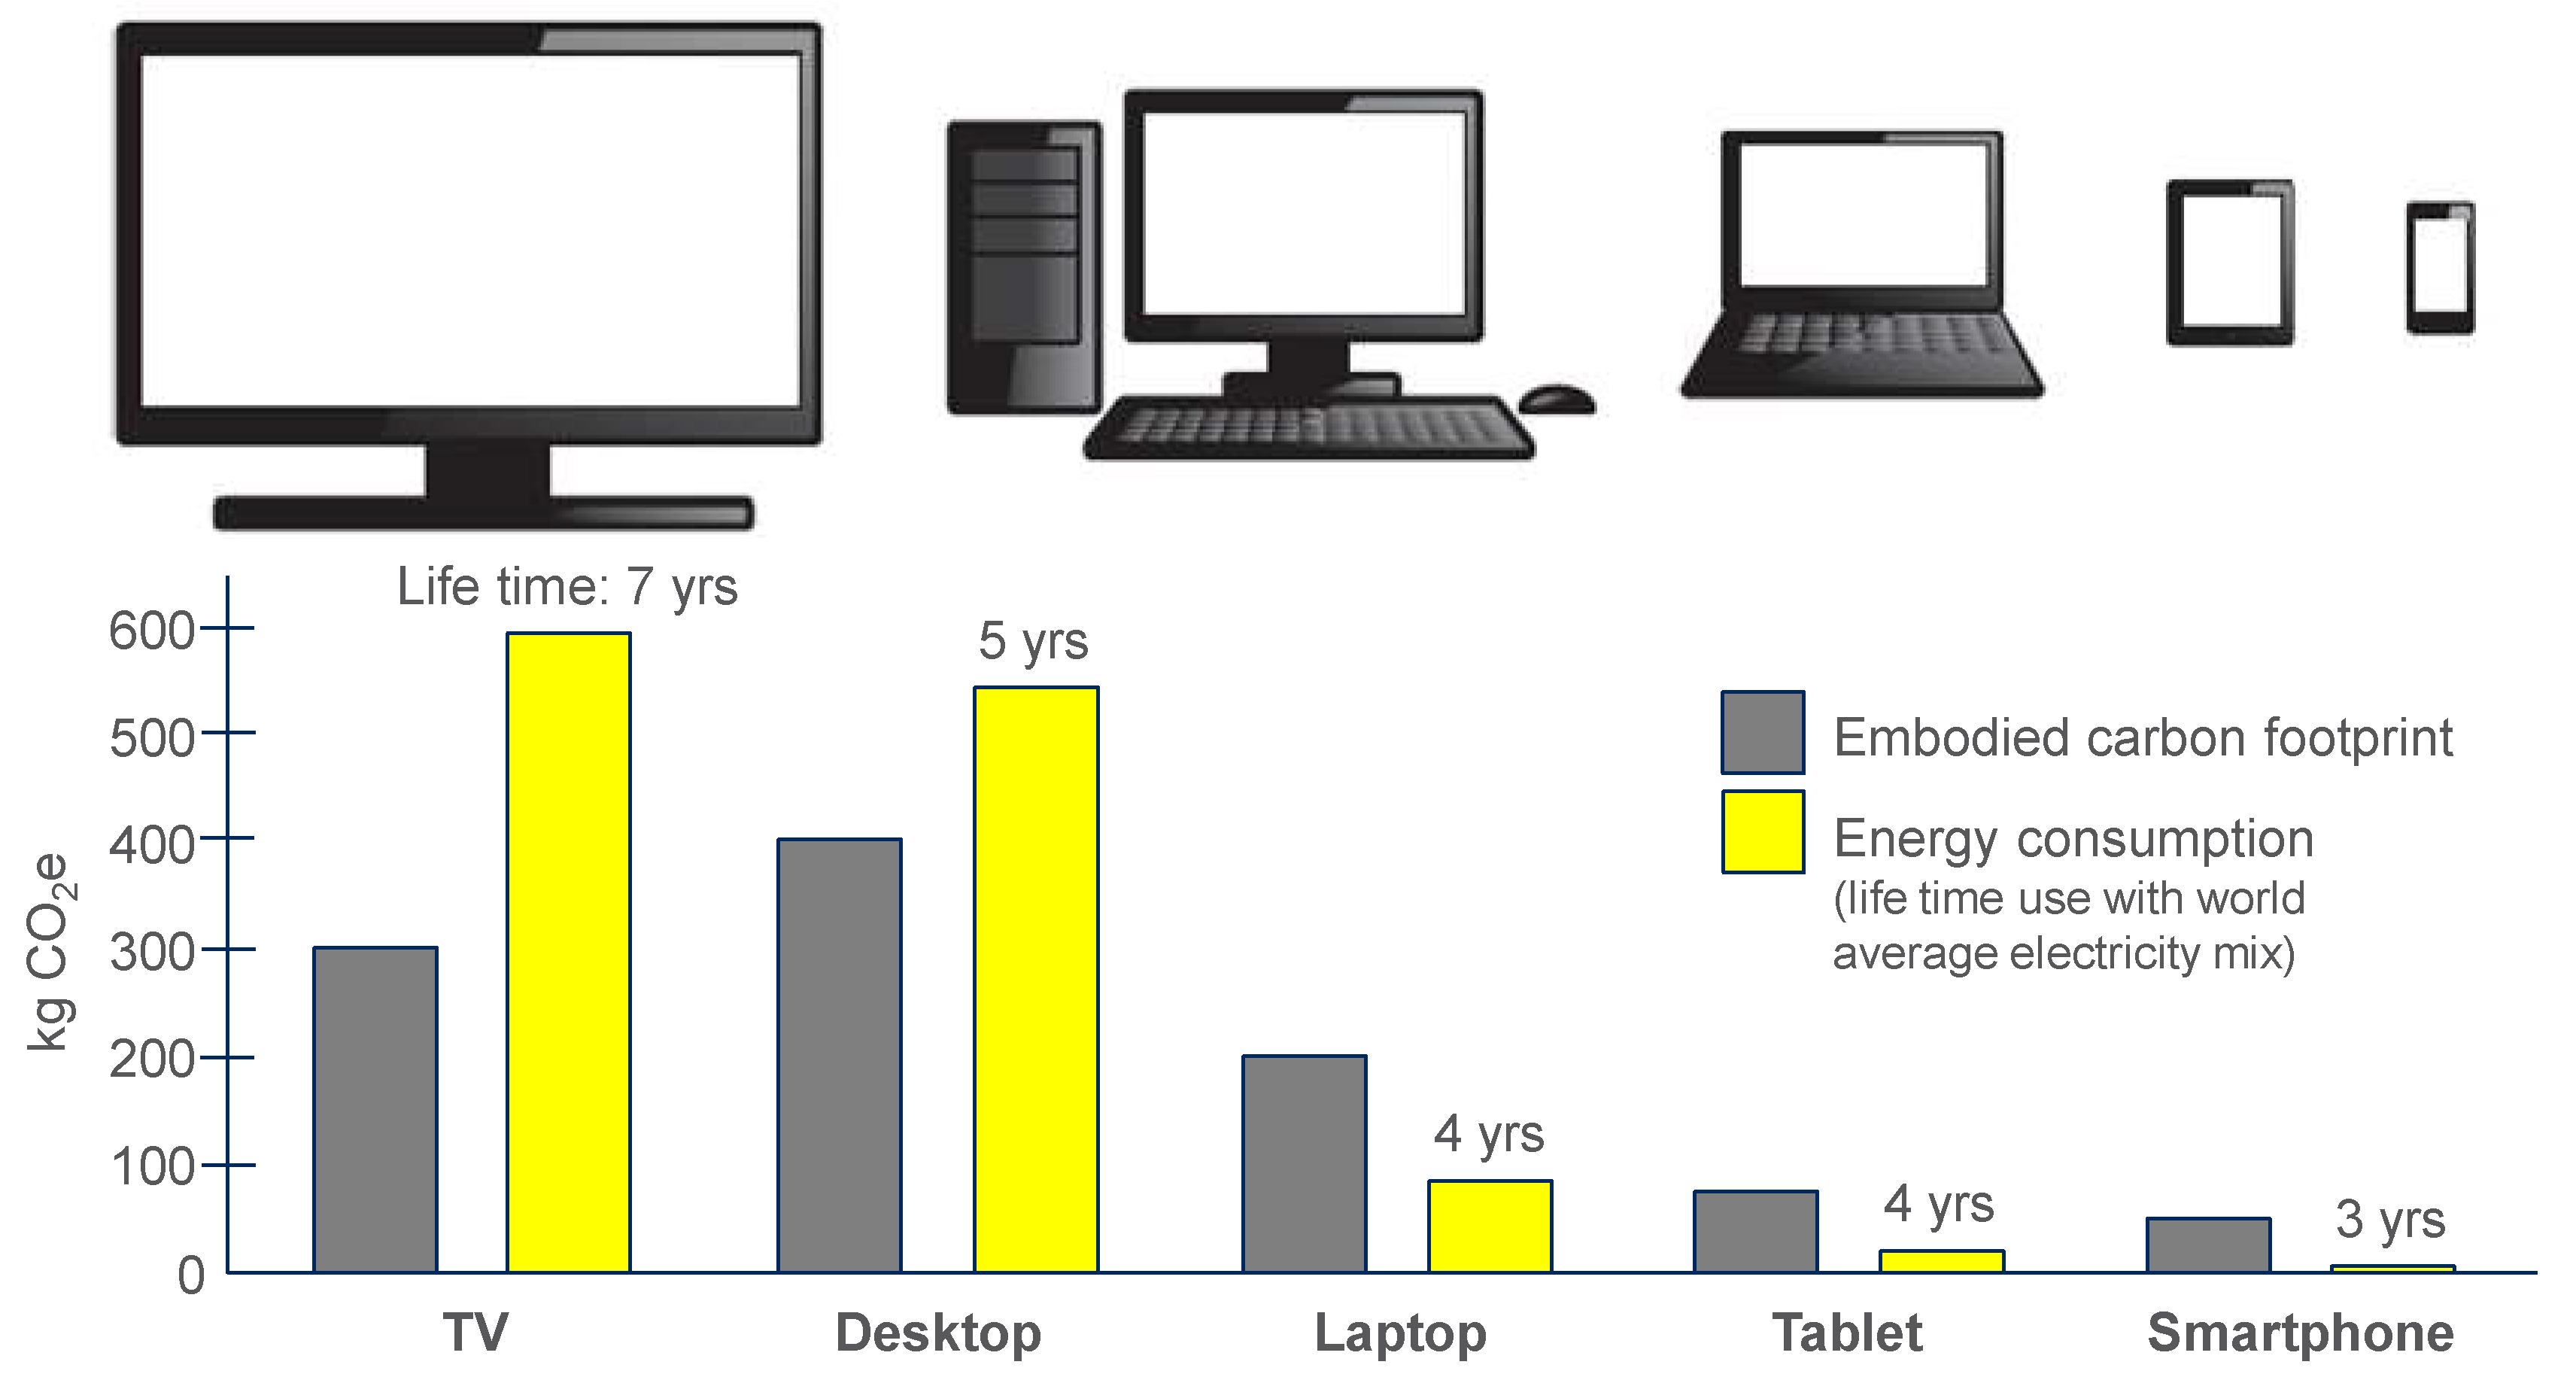
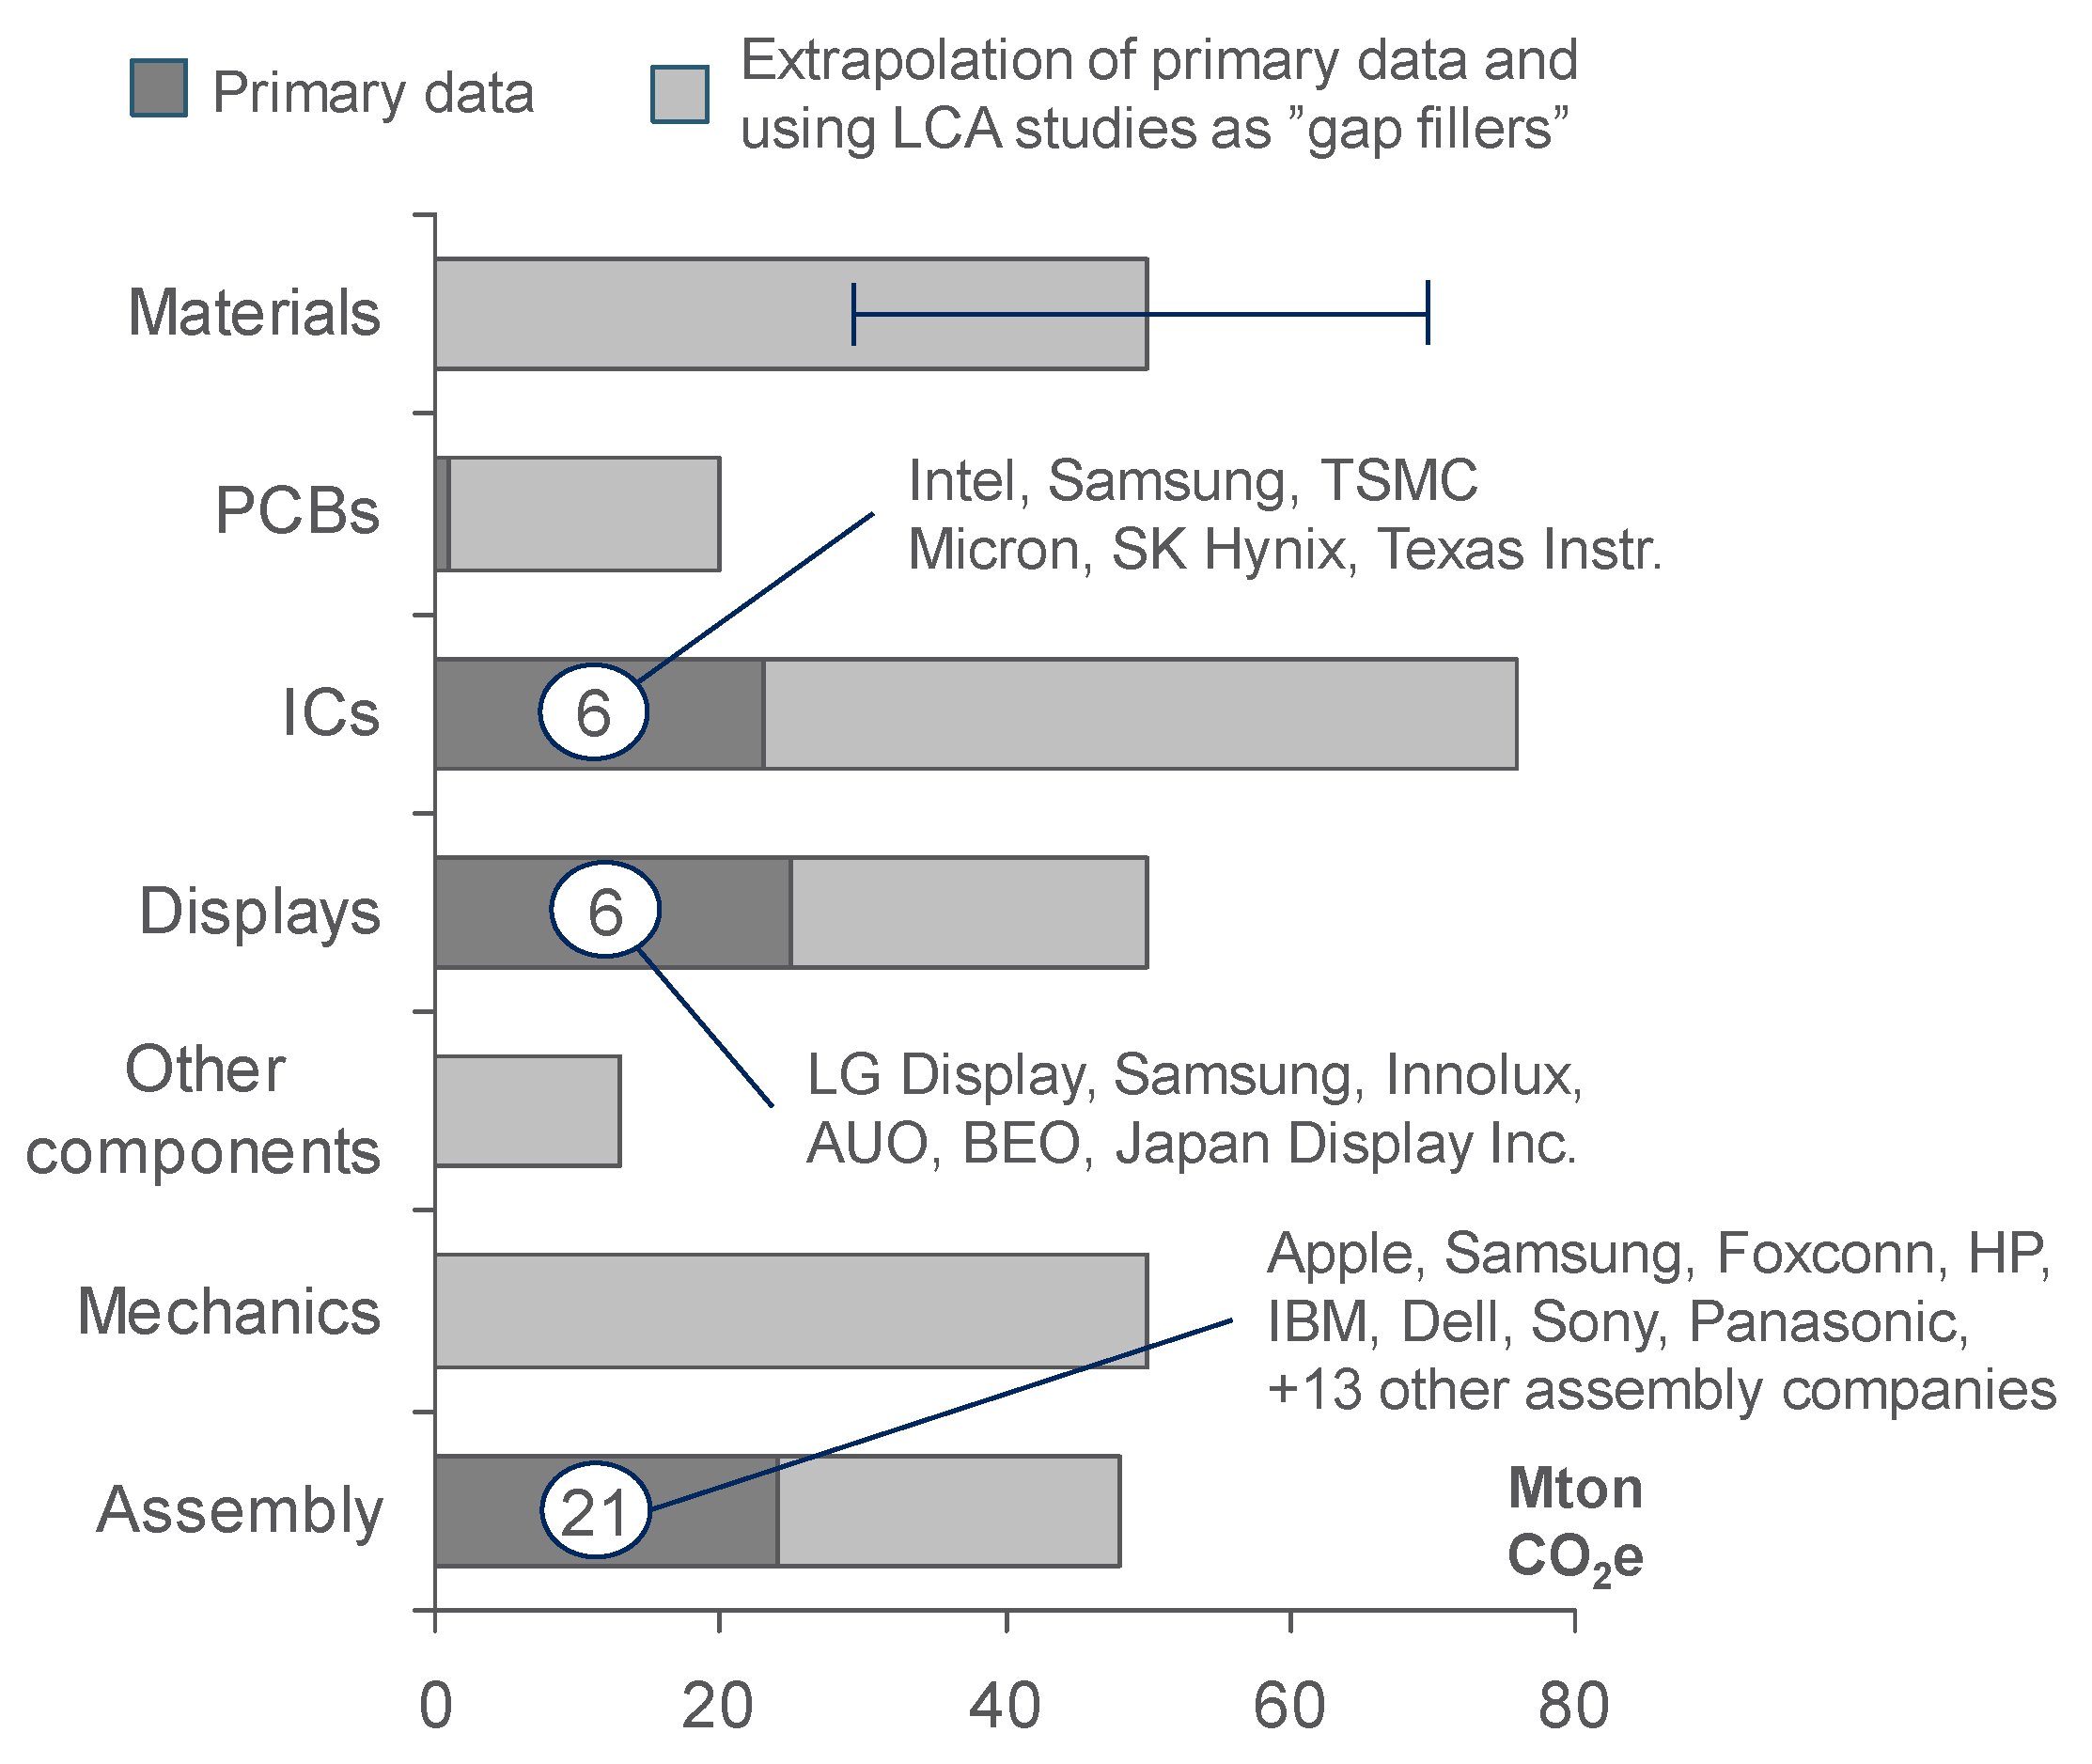
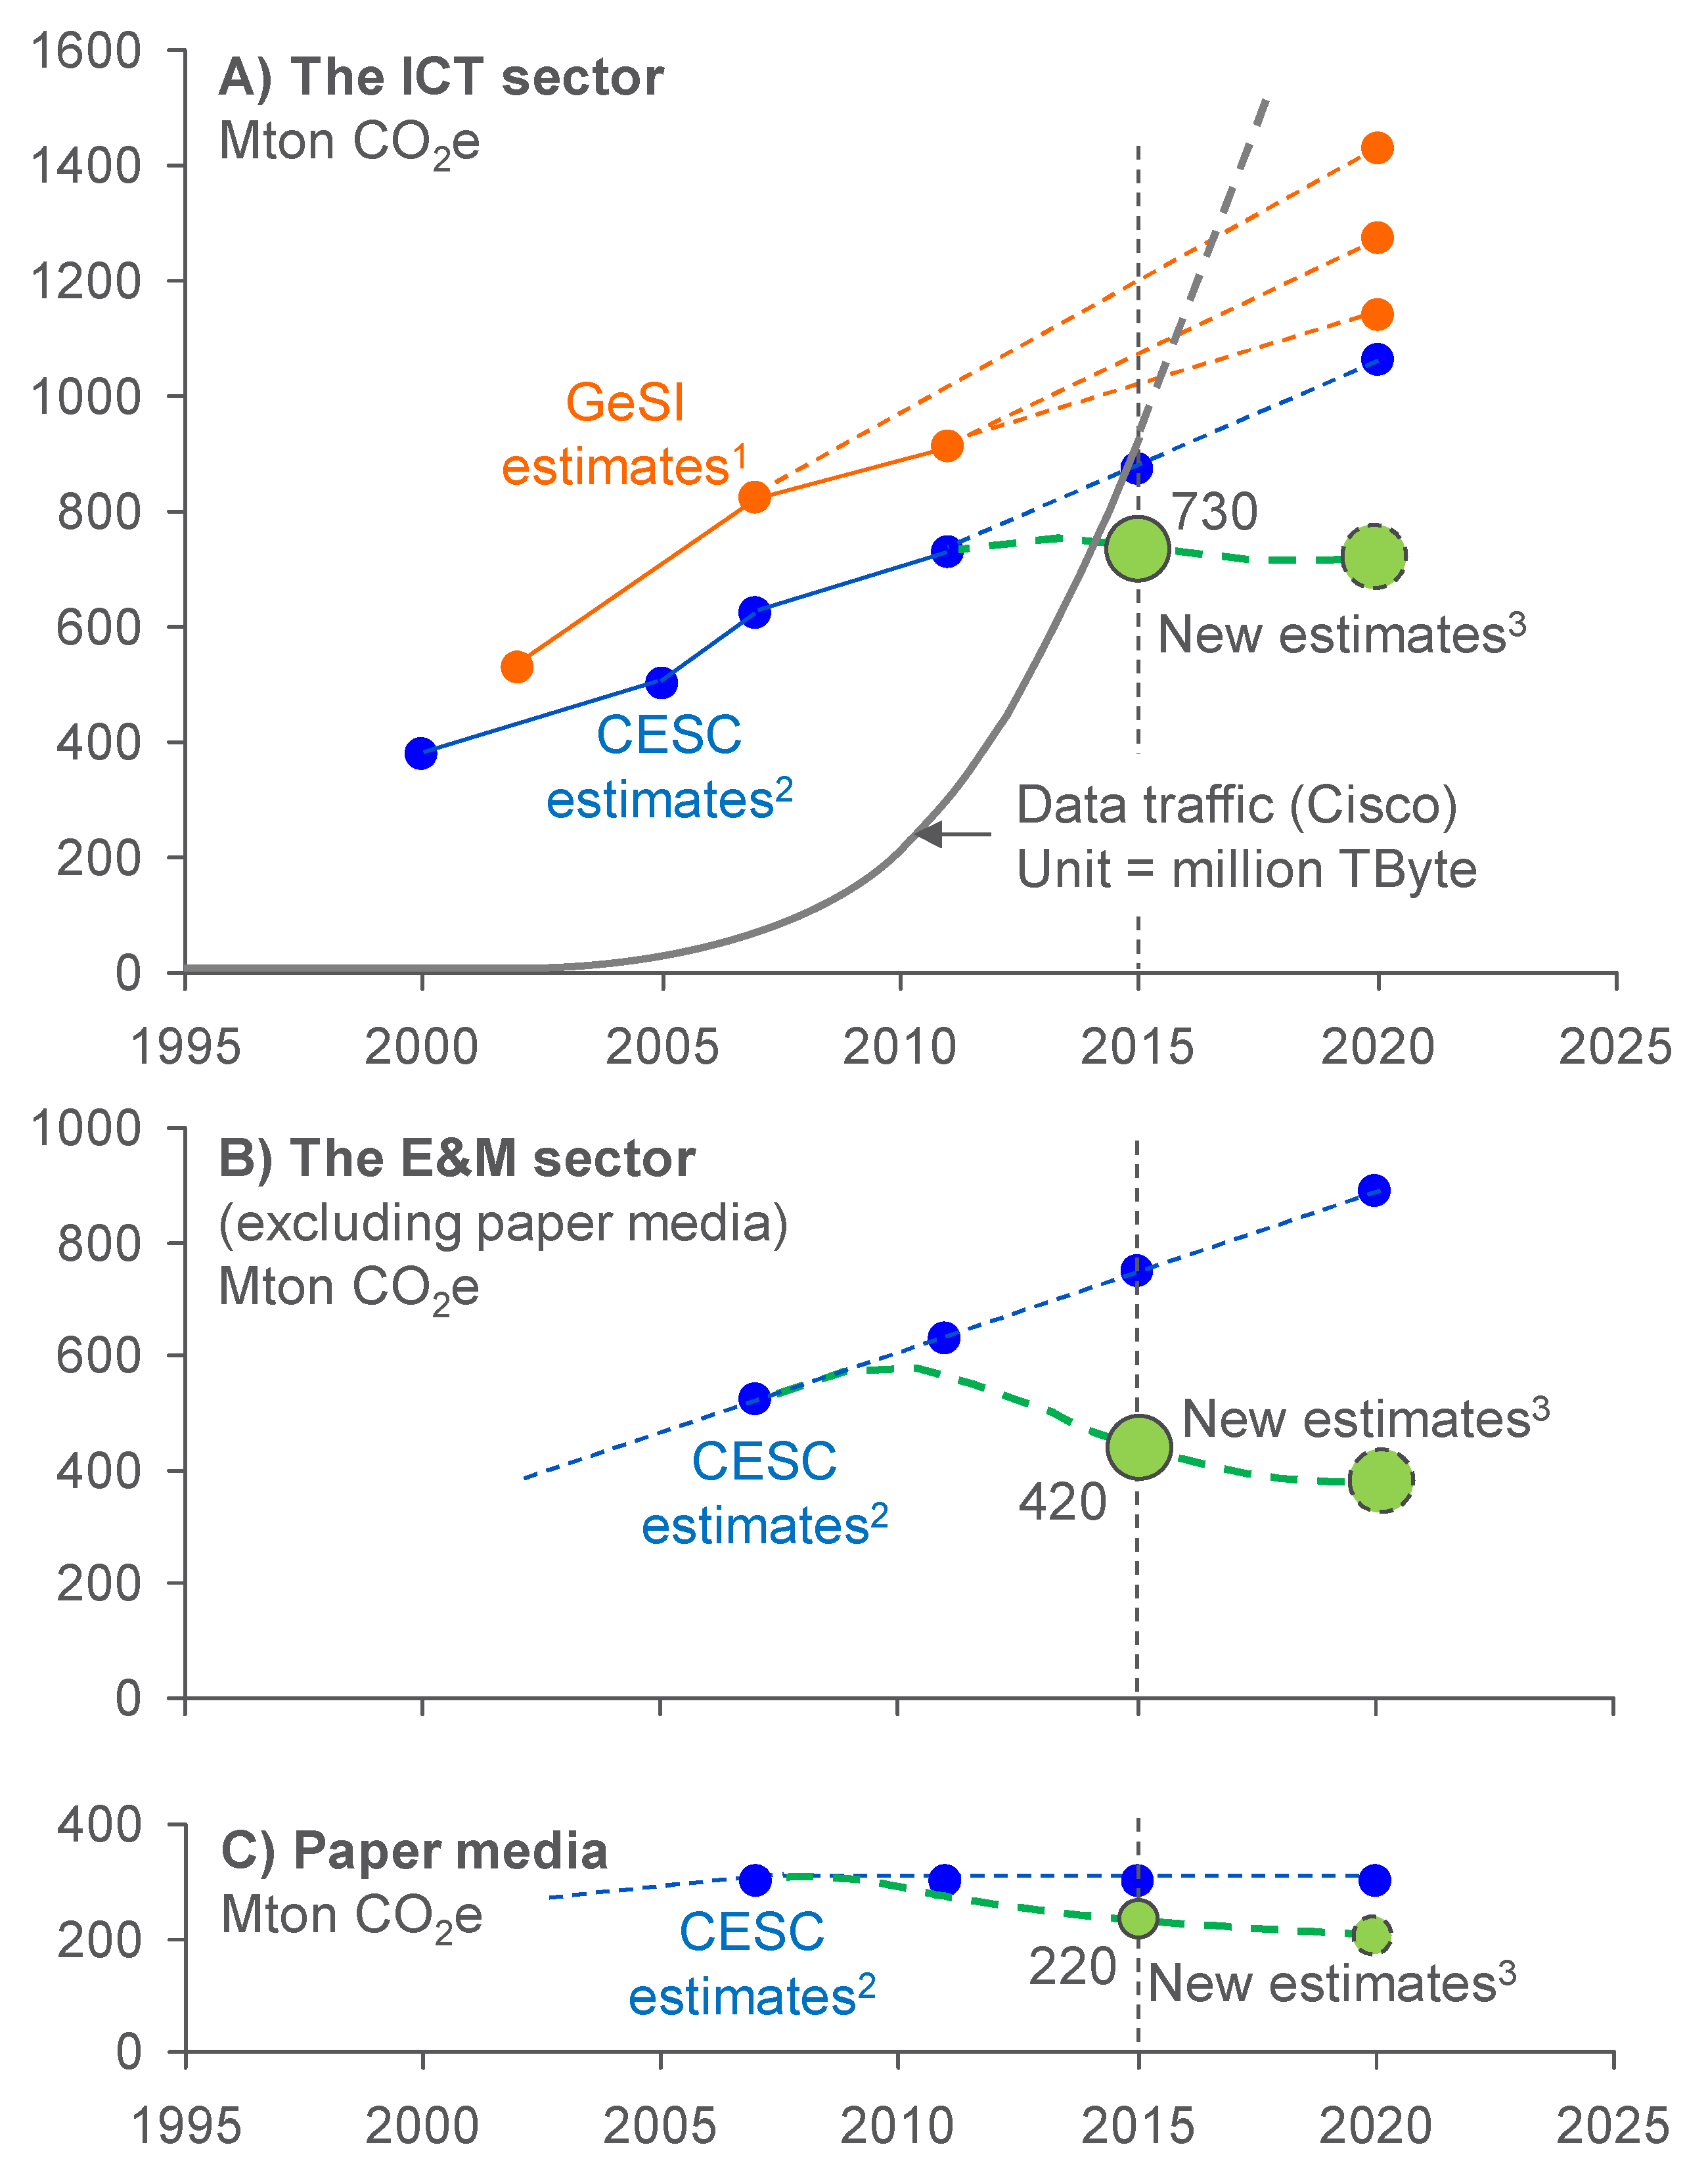
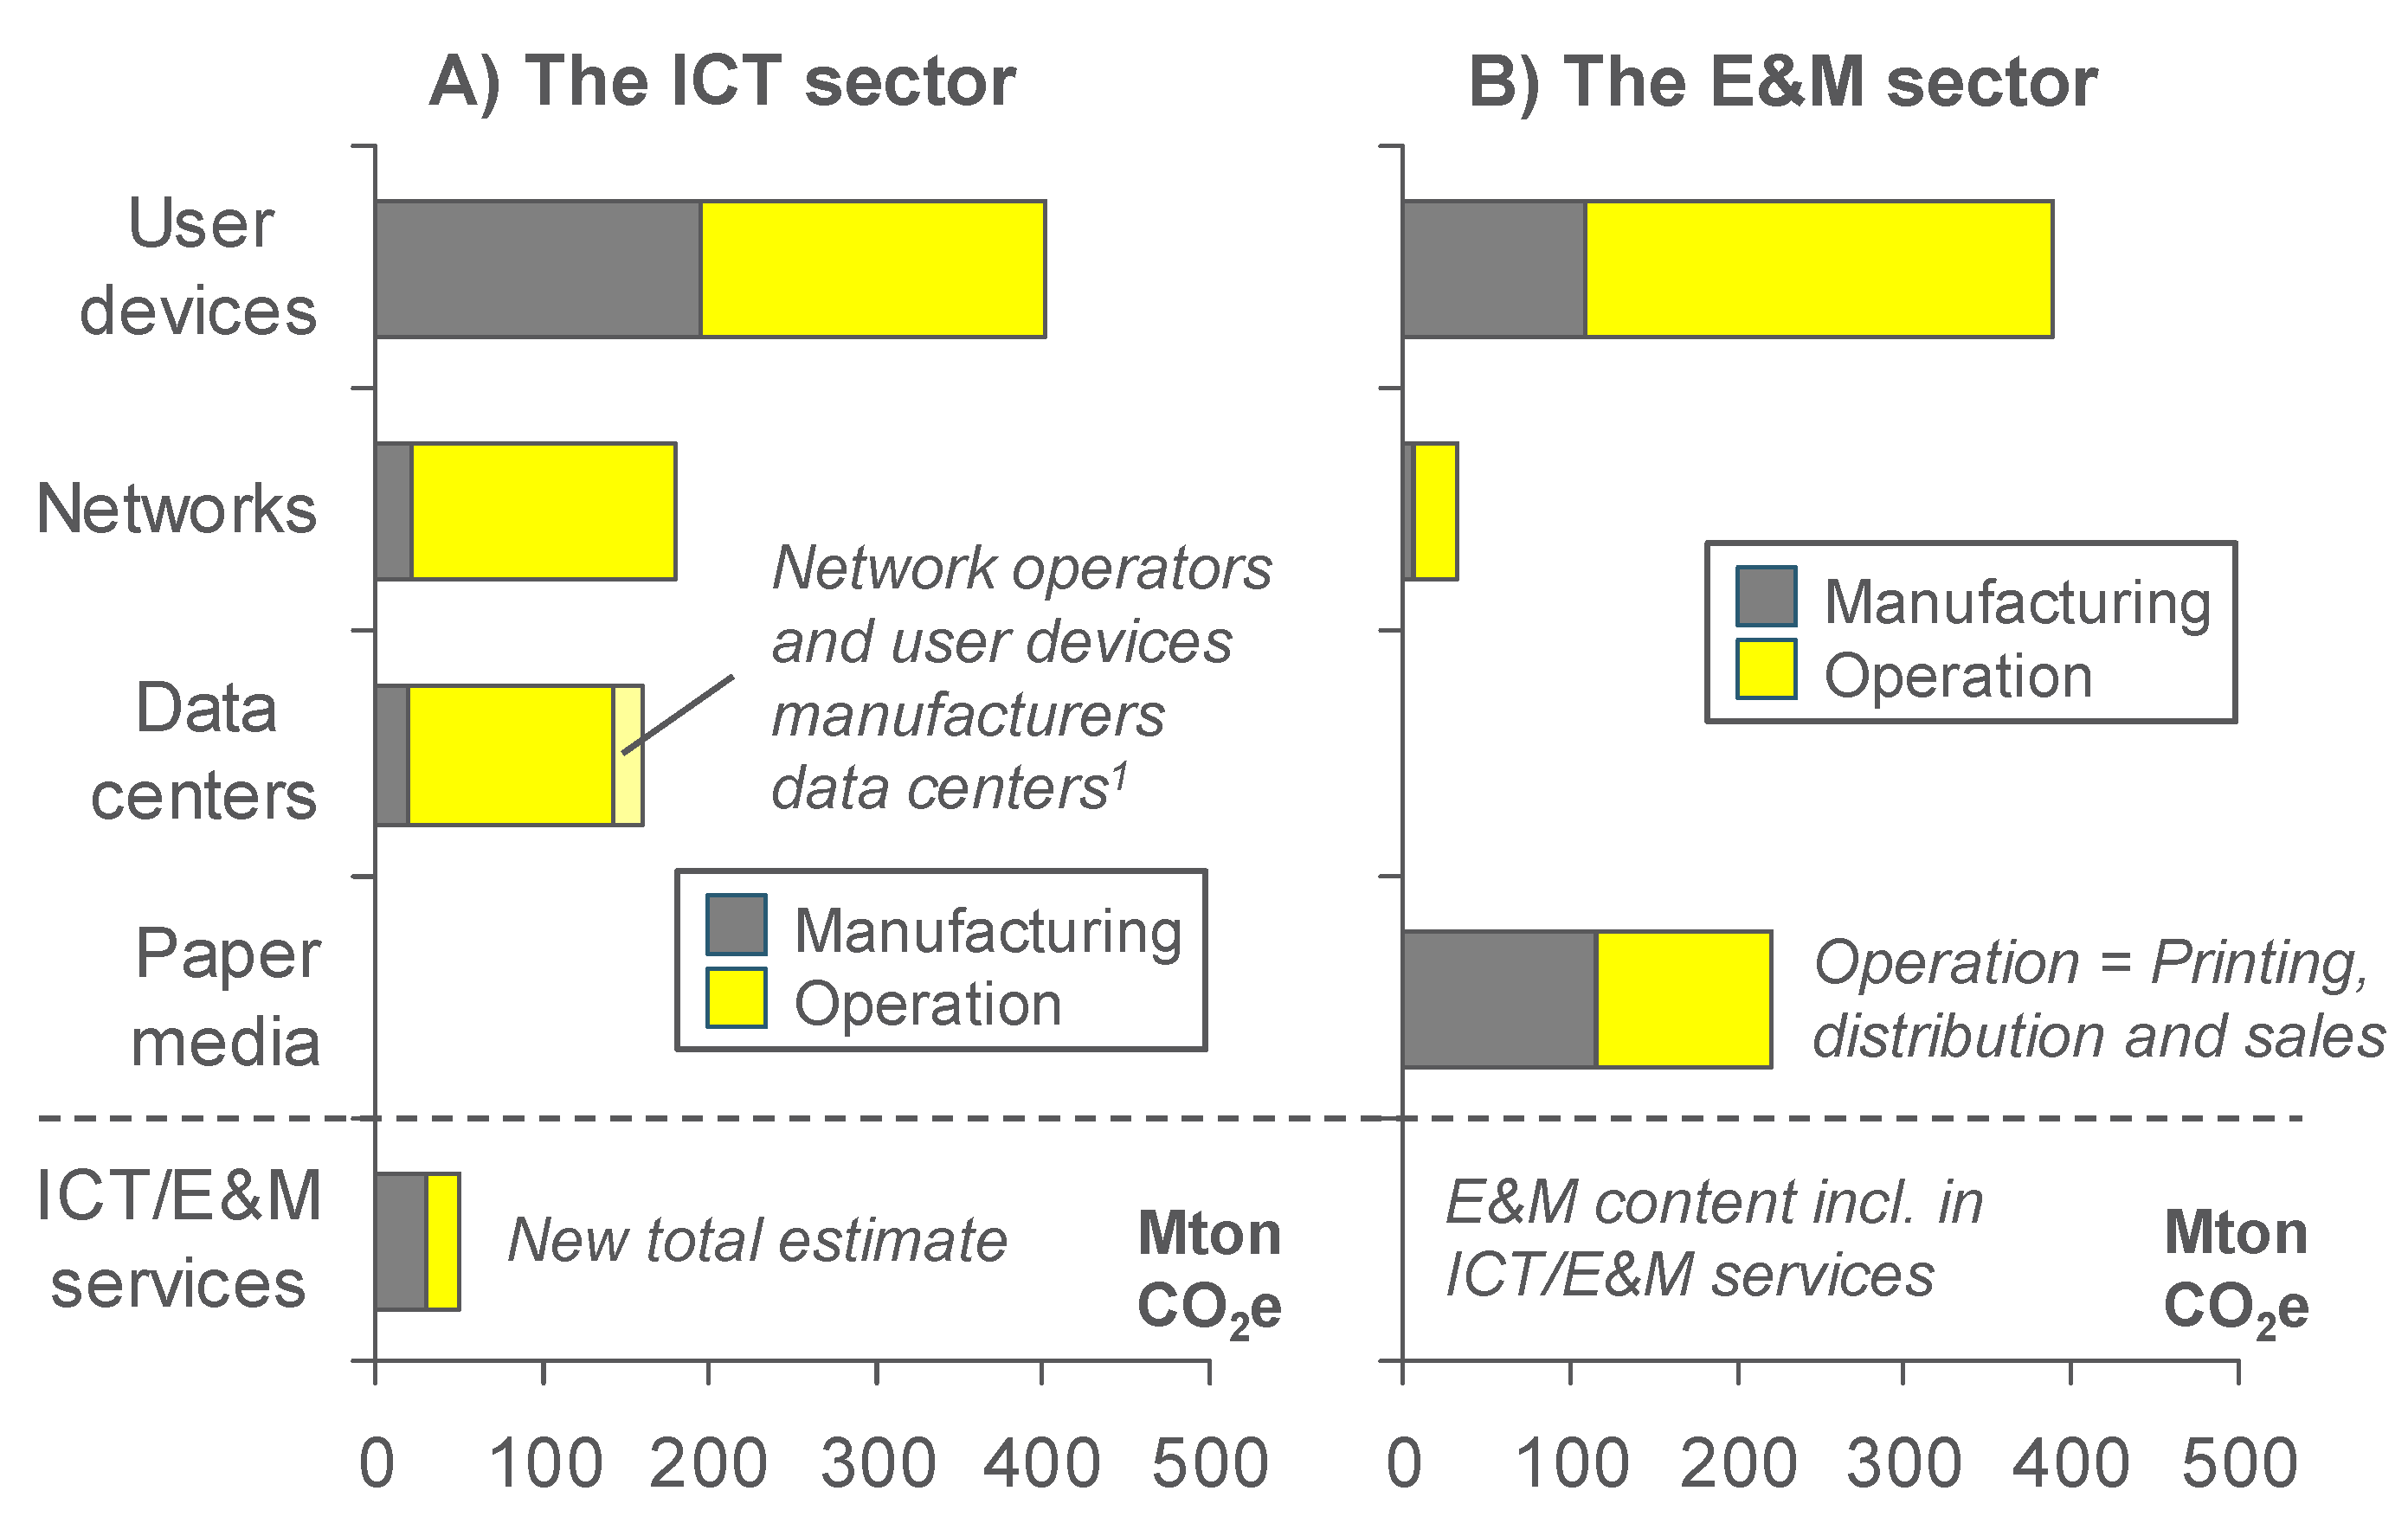
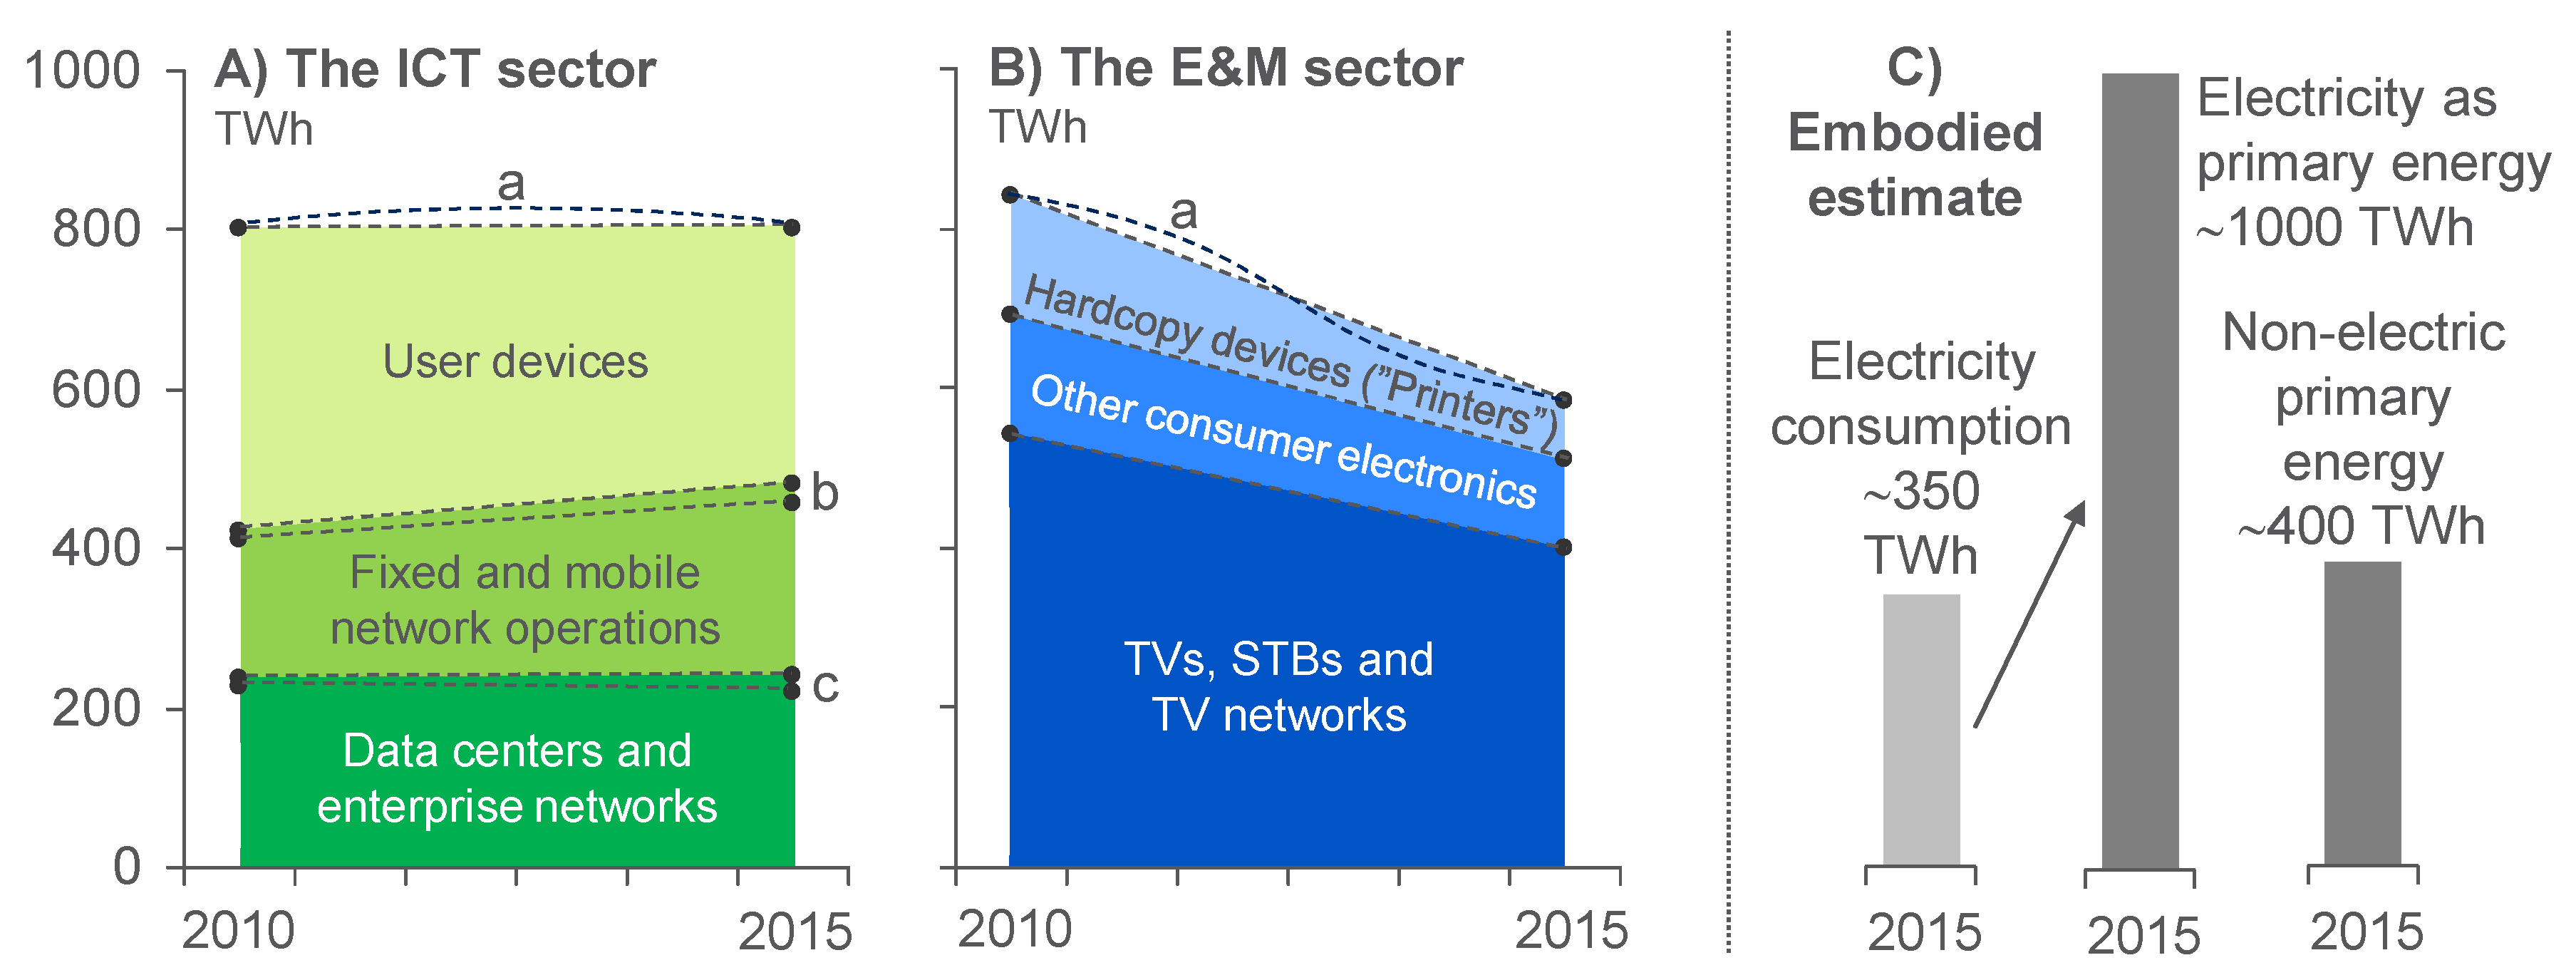
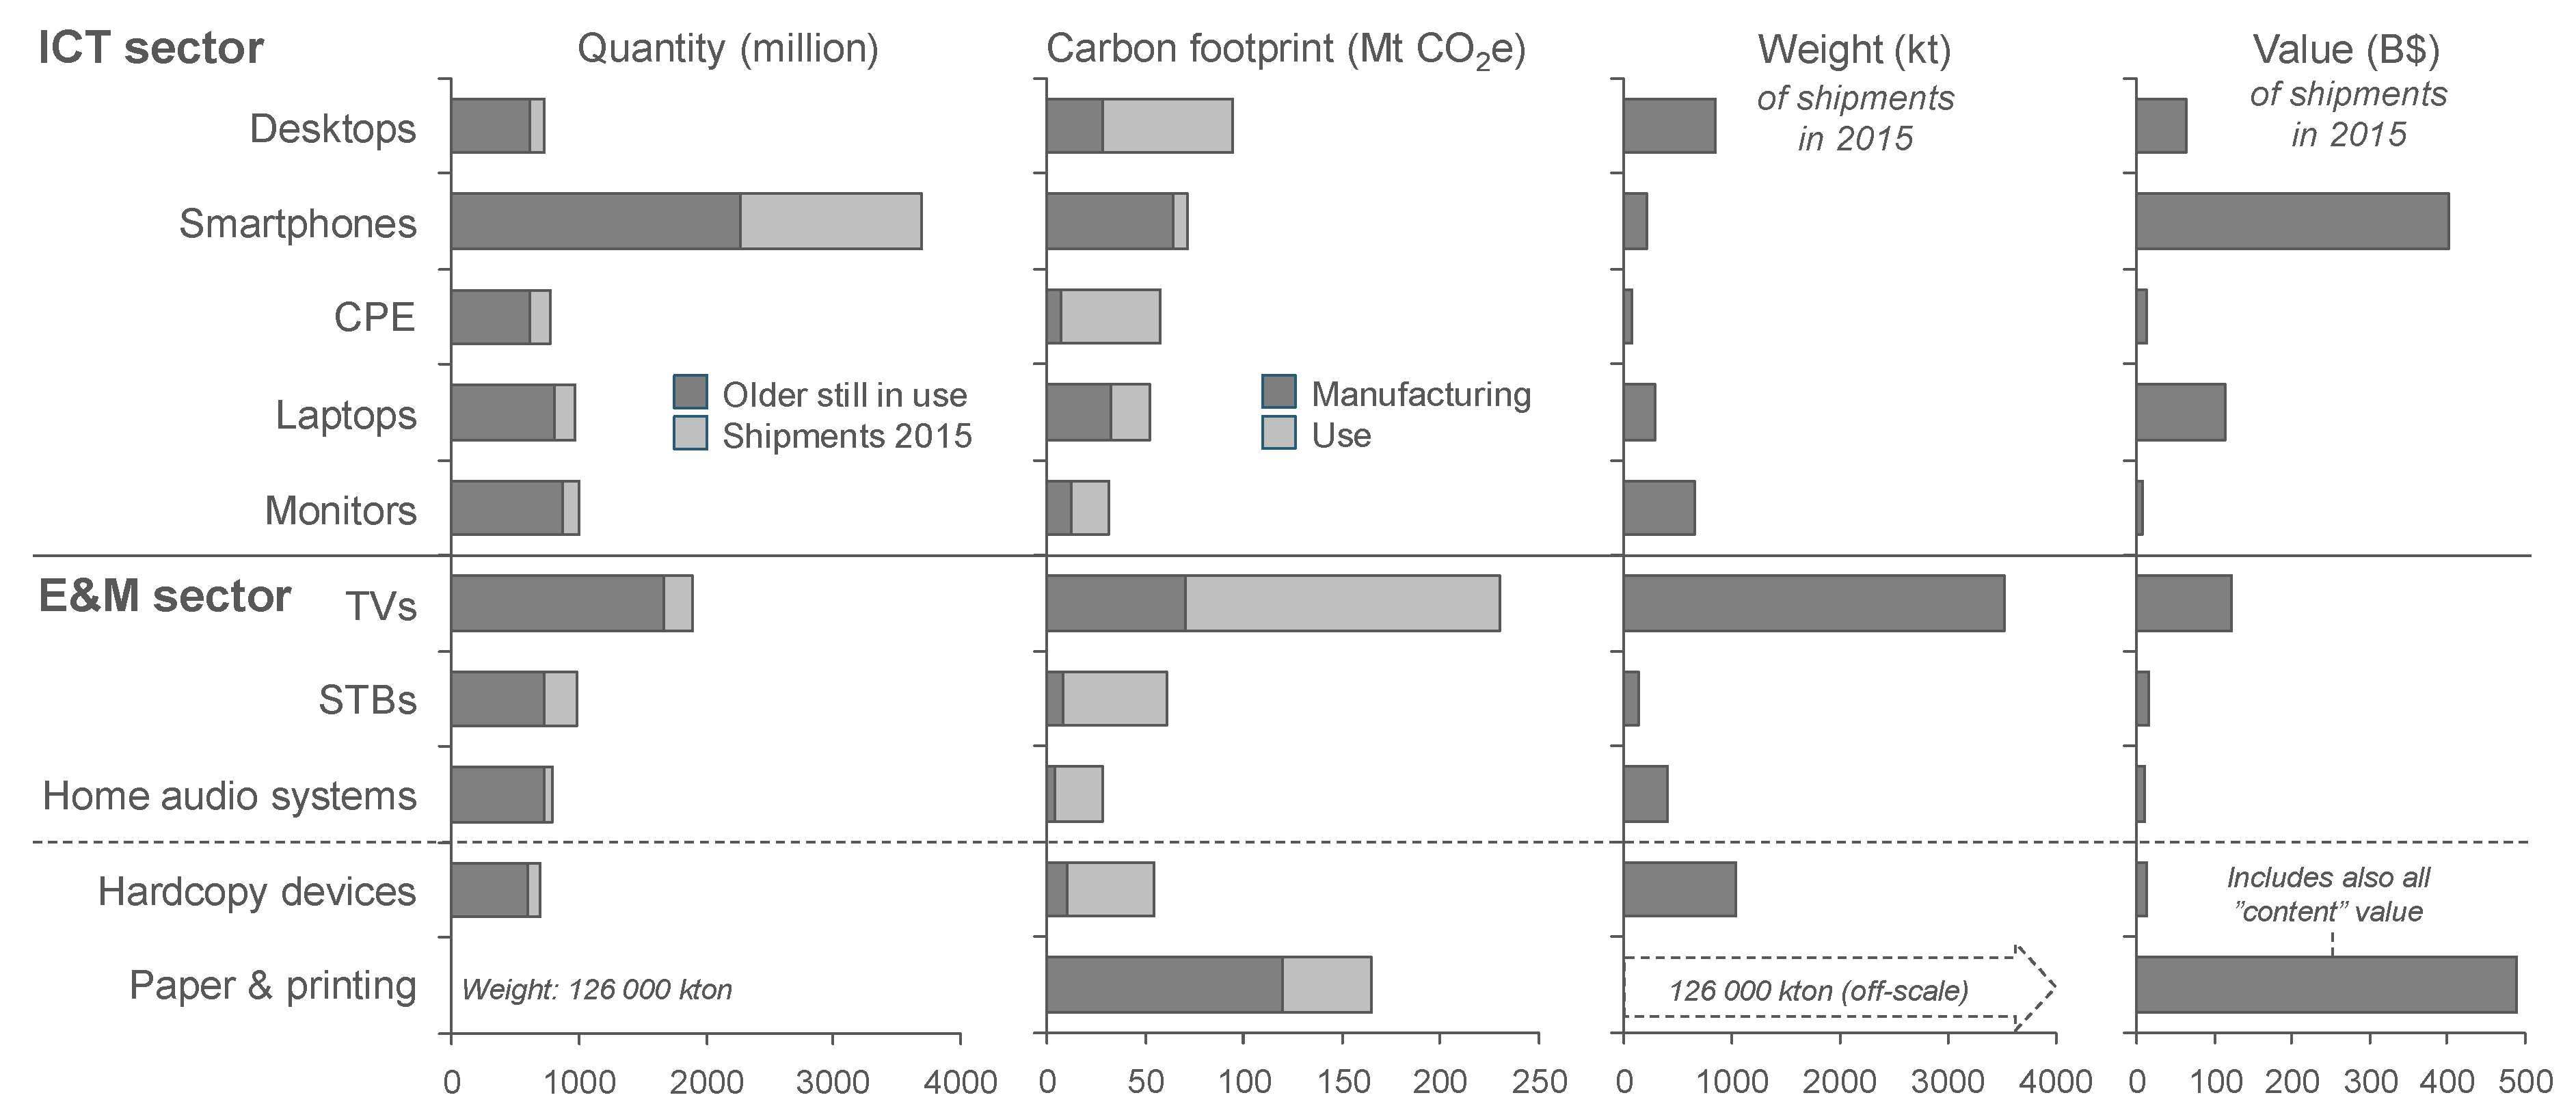
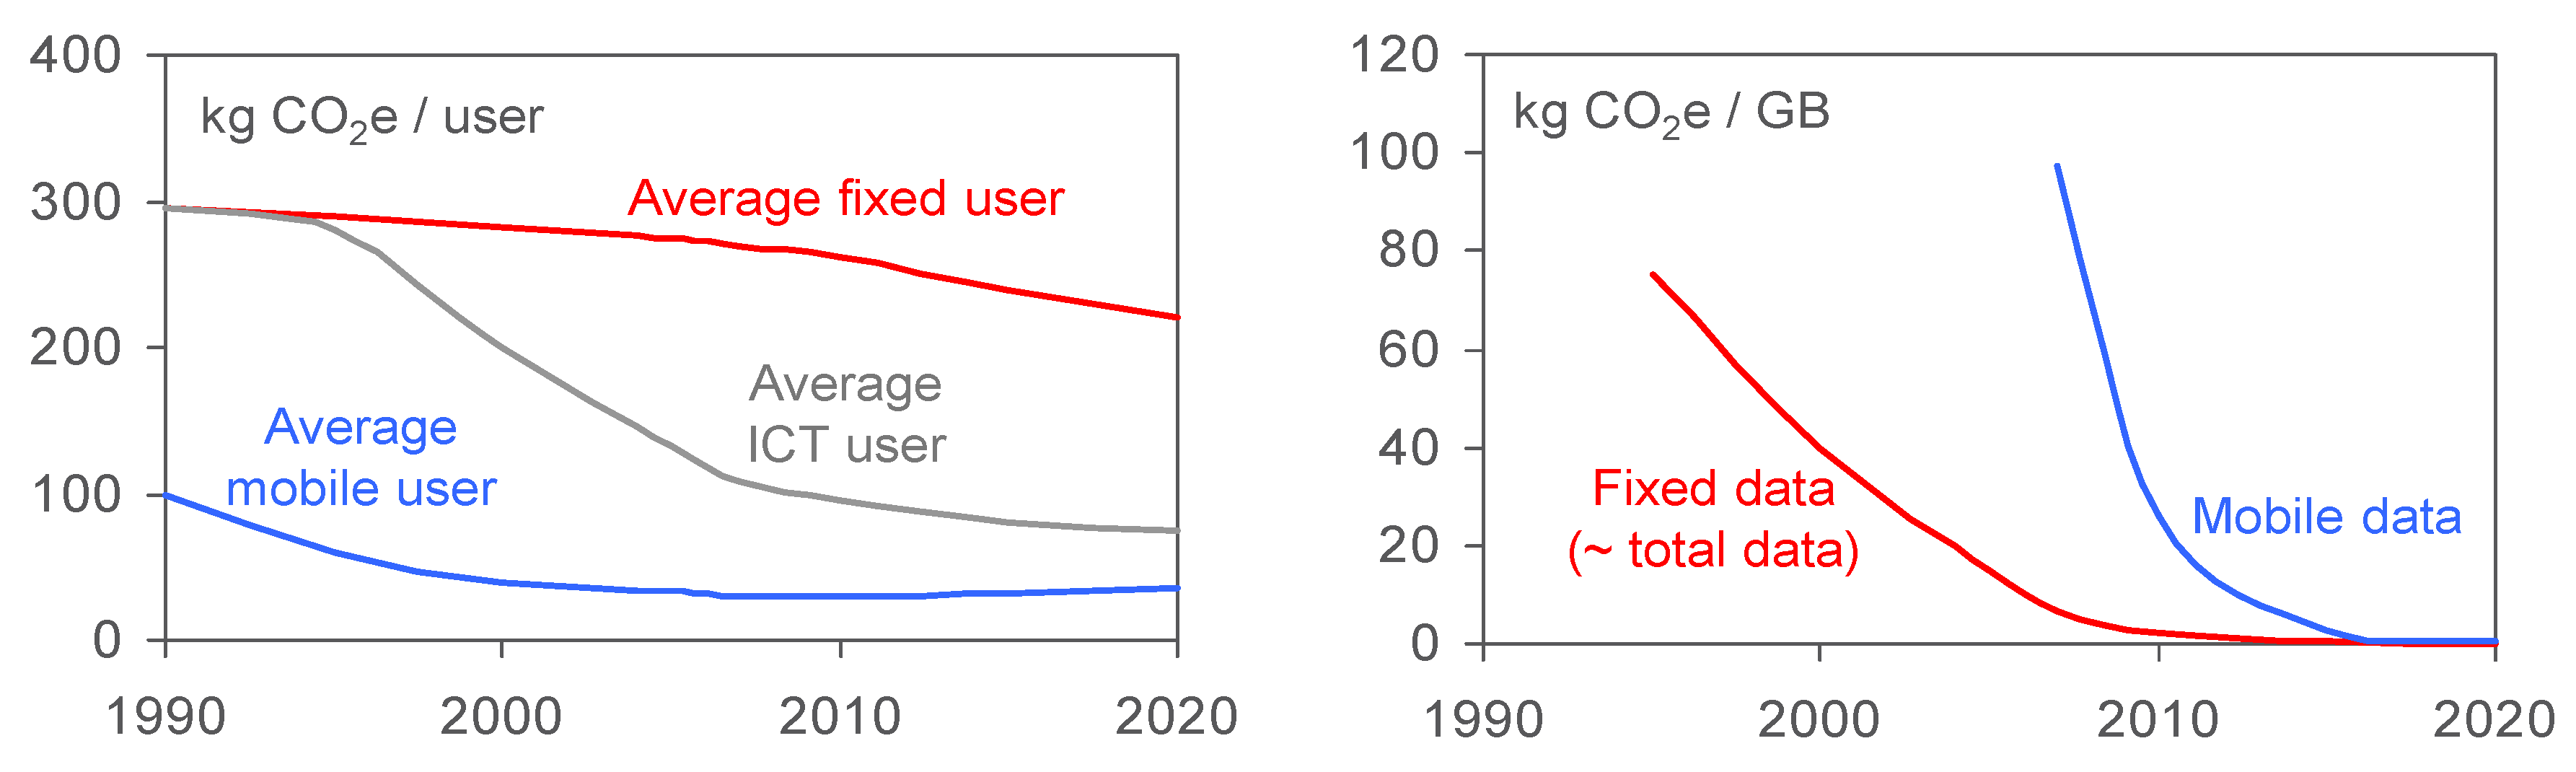
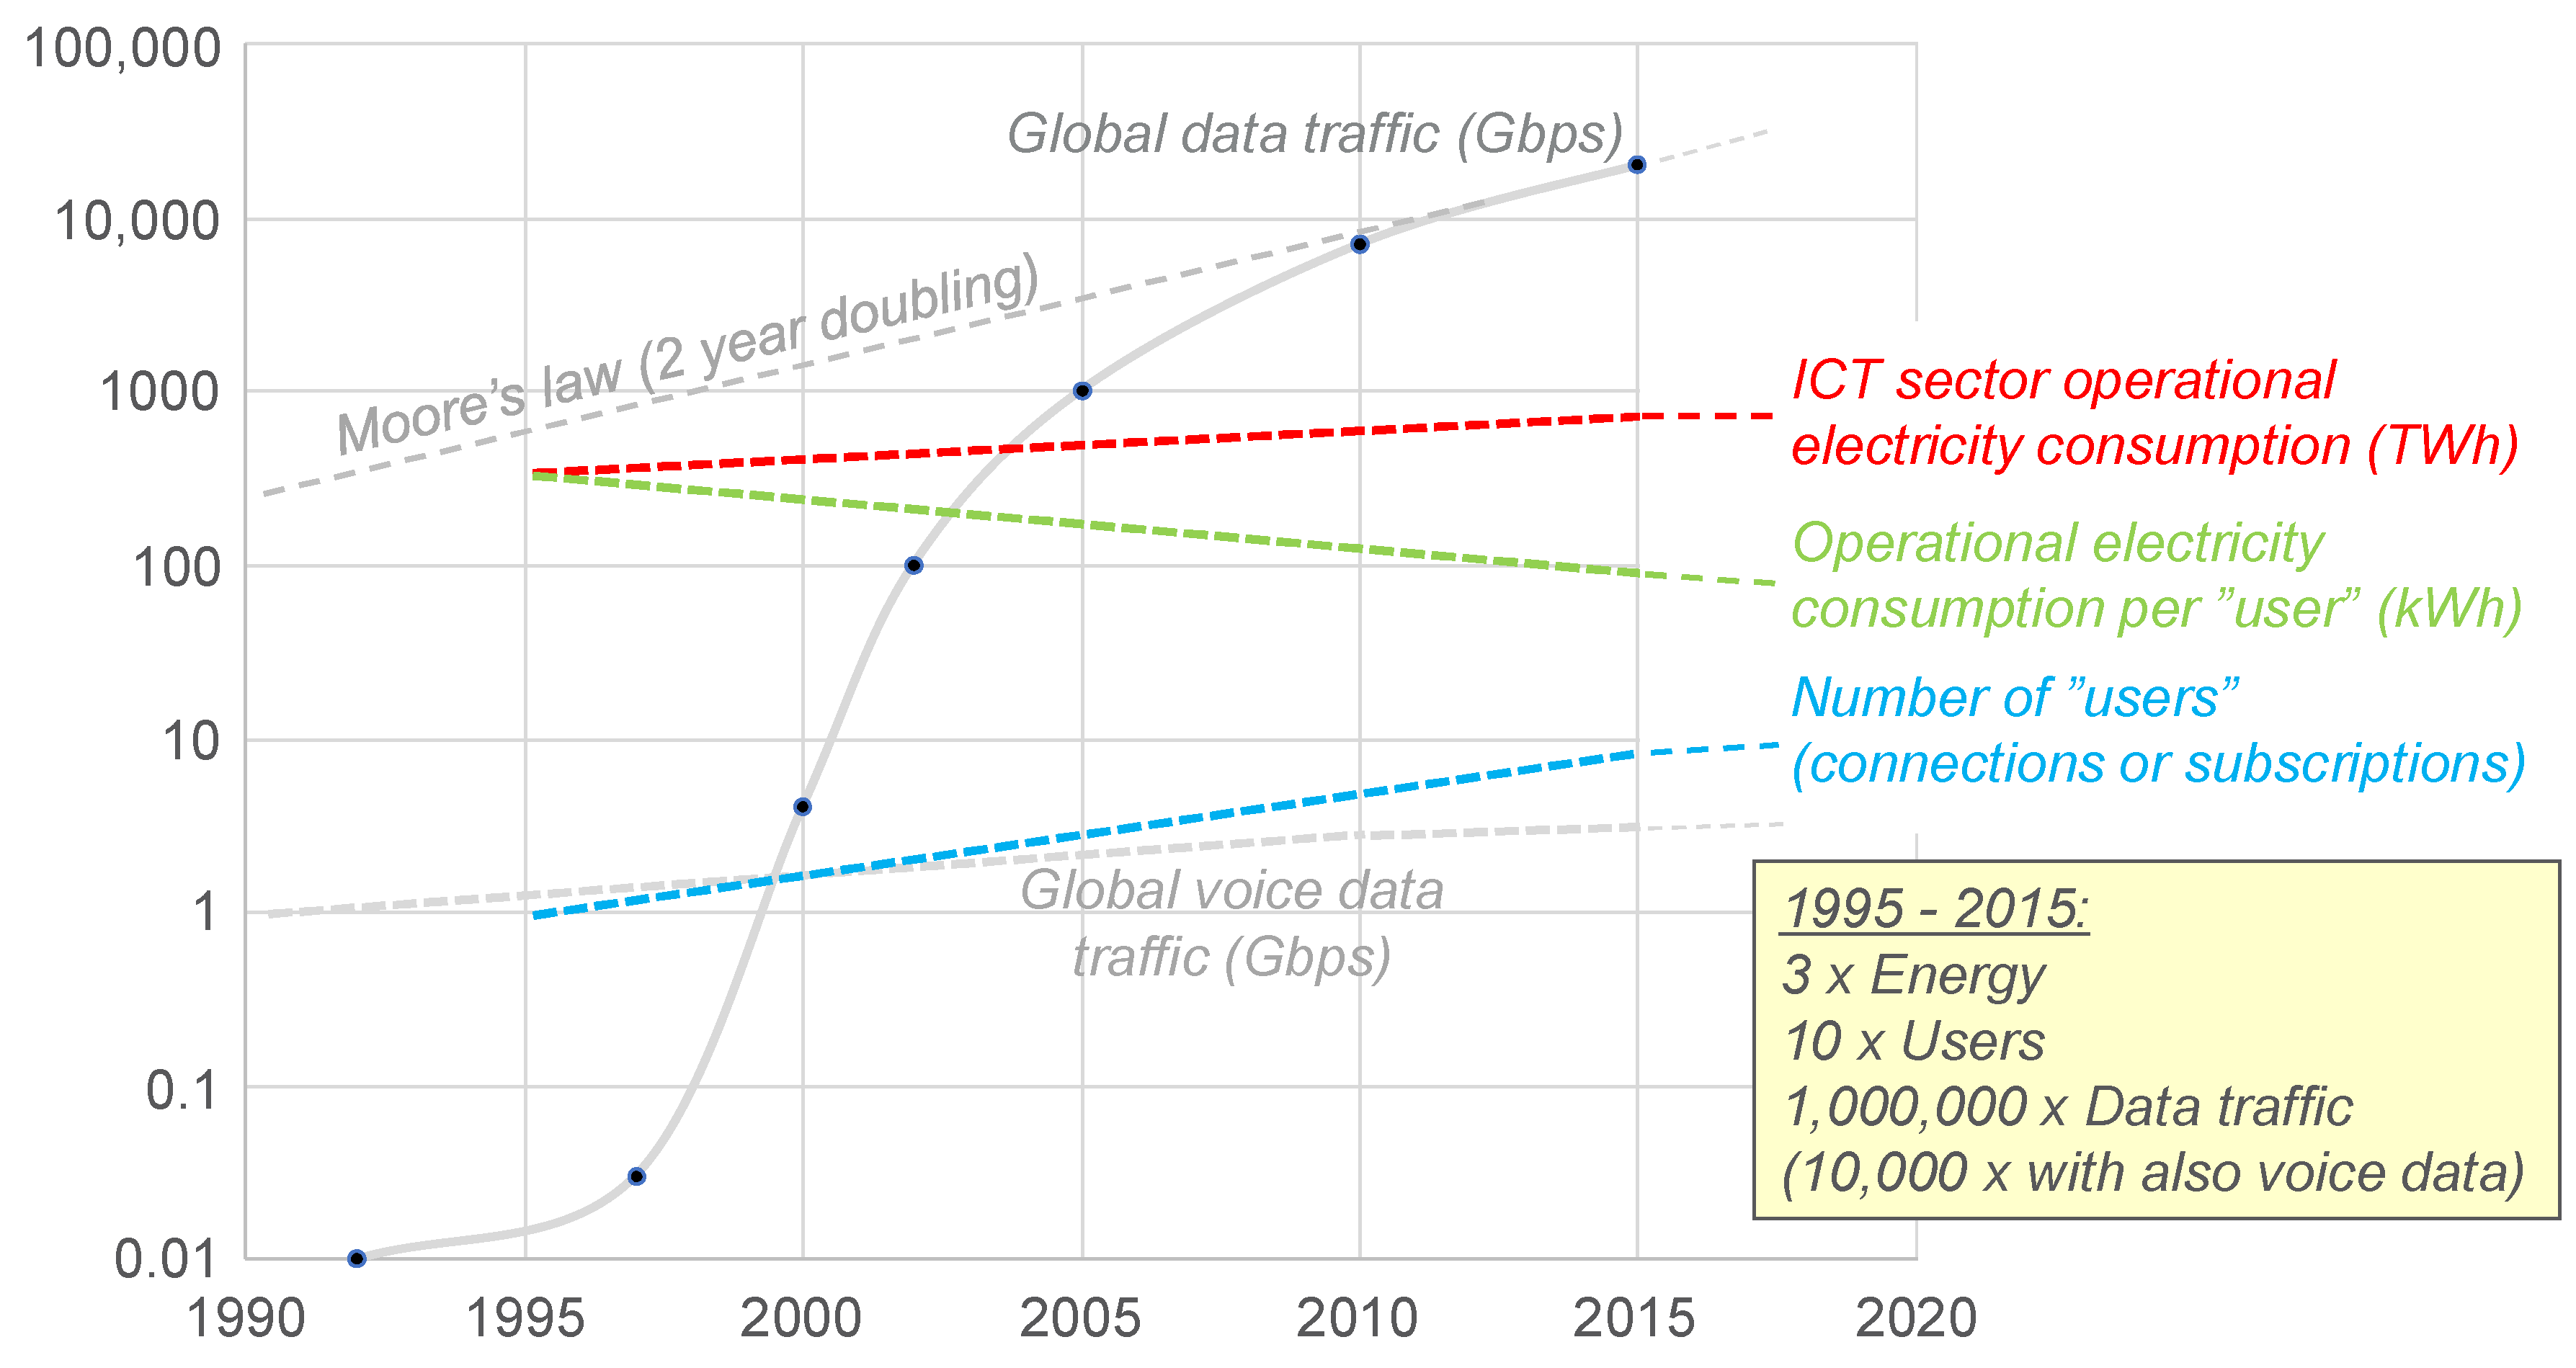
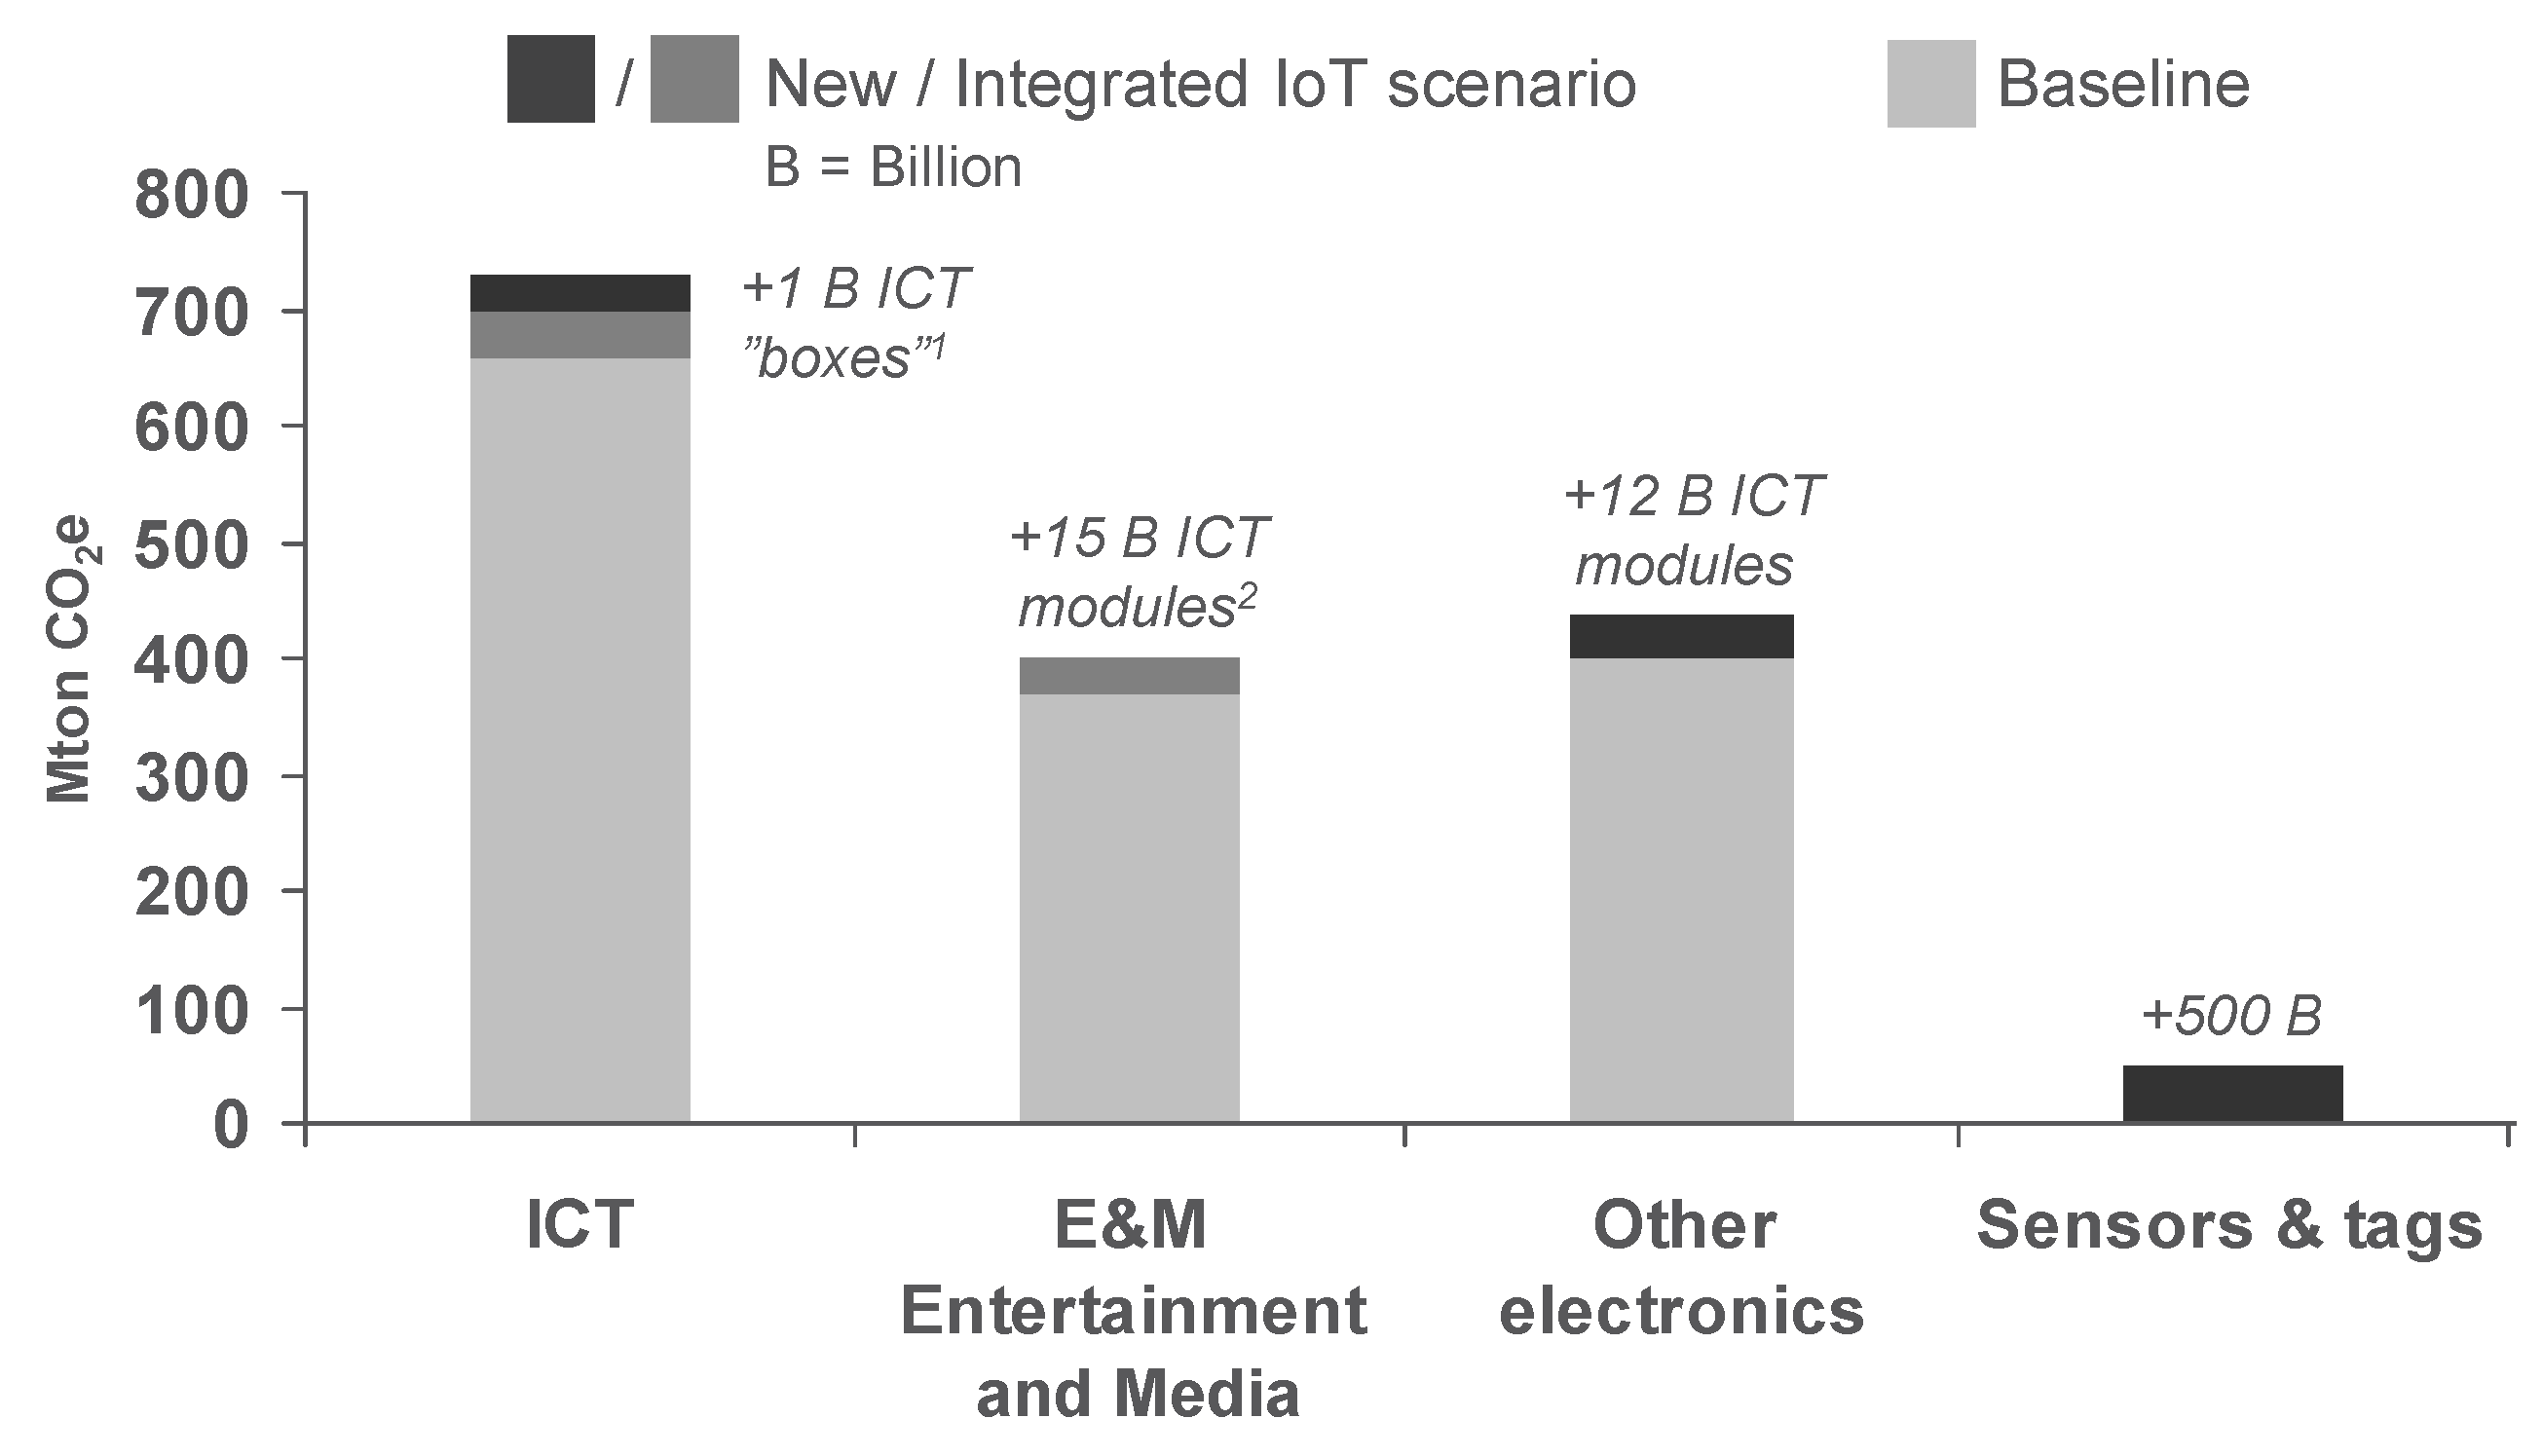
Table 1.
Scope and key data sources. Note that the number of data sources is very high in this study and only examples of the latest market reports have been referenced. In most cases, the market reports come out on a quarterly basis. See Supplementary Material (part I) for further details.
Table 1.
Scope and key data sources. Note that the number of data sources is very high in this study and only examples of the latest market reports have been referenced. In most cases, the market reports come out on a quarterly basis. See Supplementary Material (part I) for further details.
| ICT Sector Scope and Key Data Sources (For Additional Information See Description in Section 4) | |
|---|---|
| Data centers (DCs) All use of servers from “in closets” to “hyper scale” DCs | This study relies on studies by Koomey [21] and others in the US [17] plus the new IEA report Digitalization & Energy [22]. Reported data from ICT companies cover about 15% of final estimated electricity consumption. |
| ICT networks PSTN (telephony), Mobile networks, Fixed networks | Detailed data from a new report [23] that covers about 40% of mobile and about 15% of fixed subscriptions globally. High-level data for about 70% of all subscriptions have also been collected in this study. |
| Enterprise networks (reported with data centers) | Enterprise networks estimated based on average network ports [17] and the authors own experience of operating large “Intranets”. |
| ICT user devices | See user devices below and Table 3 for more details. |
| E&M sector scope and key data sources (further described in Section 4) | |
| Cable-TV and broadcasting (including radio) | These networks have been estimated based on a study in Sweden [24] together with new Swedish data and similar studies in Germany and the US. |
| Paper media and printing | Pulp and Paper Industry Intelligence (RISI) estimates of the global paper consumption and its carbon emissions [25]. |
| E&M user devices | See user devices below and Table 3 for more details. |
| Double accounting adjustments | |
| Data centers | To avoid double accounting, ICT network operators and ICT and E&M manufacturer’s data centers have been fully allocated to “Data centers”. |
| Enterprise networks and office devices | Network operators and equipment manufacturers own networks and devices included in their reported totals except for personal user devices. |
| Cable-TV networks | A share for fixed broadband over Cable-TV have been allocated to ICT network operations. |
| User devices (see details in Table 3) and server key data sources | |
| Gartner: Smartphones, Other mobile phones, Tablets, Laptop PCs, Desktop PCs | Gartner, Worldwide Quarterly Device Shipments, https://www.gartner.com/newsroom/id/3187134 |
| IDC: Smartphones, Other mobile phones, Tablets, Laptop PCs, Desktop PCs, Wearables, Servers, Hardcopy devices | Worldwide Quarterly Mobile Phone Tracker (prod id=37), https://www.idc.com/tracker/showproductinfo.jsp?prod_id=37 Worldwide Quarterly Personal Computing Device Tracker (1541), Worldwide Quarterly Wearable Device Tracker (962), Worldwide Quarterly Server Tracker (7), Worldwide Quarterly Hardcopy Peripherals Tracker (3) |
| IHS: Computer displays, Public displays, Surveillance cameras, Automotive (all display products) | Desktop Monitor Market Tracker, https://technology.ihs.com/572224/desktop-monitor-market-tracker-q1-2016P, Public Display Market Tracker, https://technology.ihs.com/572984/public-display-market-tracker-q1-2016, Security Market Tracker, https://technology.ihs.com/Research-by-Market/551540/security-technology, Small and Medium Display Market Tracker, https://technology.ihs.com/572824/small-medium-display-market-tracker-q1-2016 |
| Future Source: CPE (modems, gateways), Computer peripherals, STBs (Set-top boxes), DVD/BD players, Media players, Home audio systems, Portable media players, Headphones, Cameras | Future Source, https://www.futuresource-consulting.com/ One of the leading analysts for audio and camera products but also for CPEs (gateways, modems etc.), STBs and projectors, and also for optical and electronic media (discs, memory sticks/cards, printer consumables), See also: CES 2016, Global Tech Spending Update, Presentation at CES 6–9 January 2016 Las Vegas (media copy) |
| Jon Peddie Research (JPR): Camcorders, Game consoles, Portable game consoles, Arcade game machines | Jon Peddie Research, https://www.jonpeddie.com/press-releases/millions-of-android-gaming-consoles-on-the-horizon/ http://www.jonpeddie.com/publications/console-gaming-hardware-market-study/ |
Table 2.
ICT and TV subscriptions globally and other key data for 2010 and 2015.
| ICT subscriptions (subs) [Million Subscriptions] | 2010 1 | 2015 1 | Data Sources |
|---|---|---|---|
| Fixed telephony (voice) | 1240 | 1070 | ITU [26] |
| Additional VoIP subscriptions | ∼150 | ∼250 | ITU [26] |
| Mobile subscriptions | 4970 | 7110 | ITU [26] |
| of which is mobile broadband | 710 | 2950 | ITU [26] |
| Additional M2M (IoT) subscriptions | 70 | 350 | GSMA [27] |
| Fixed broadband (lines) | 500 | 775 | ITU [26] |
| Of which is FTTH/FTTB | 65 | 160 | ITU [26] |
| Of which is Cable-TV | 100 | 150 | DTVR [28] |
| ICT total subscriptions (not including M2M subs) | 6710 | 8955 | |
| E&M subscriptions (subs) [million subscriptions] | 2010 1 | 2015 1 | Data sources |
| Pay-TV subscriptions | 715 | 893 | DTVR [28] |
| Of which is Cable-TV | 525 | 561 | DTVR [28] |
| Of which is IPTV | 30 | 113 | DTVR [28] |
| Free TV (estimates) | 725 | 660 | DTVR [28] |
| TV total subscriptions | 1440 | 1553 | |
| ICT and E&M total subs | 8150 | 10,508 | |
| Other Global Key Data | 2010 | 2015 | |
| Data traffic [million TB] | 240 | 910 | Cisco [29] |
| Smartphone share of data traffic | <1% | ~10% | Cisco [29] |
| Electricity consumption [TWh] | 19,000 | 21,000 | Enerdata [30] |
| Energy related CO2 emissions [Mt CO2] | 30,300 | 32,300 | IEA [31] |
| Carbon footprint [Mt CO2e] | 50,000 | 53,400 | PBL [32] |
1 Subscription numbers are counted per mid-year, not end-of-year.
Table 3.
User devices: shipments, total number of units in operation, OEC, and resulting CF’s. See Supplementary Material (part I) for additional information.
Table 3.
User devices: shipments, total number of units in operation, OEC, and resulting CF’s. See Supplementary Material (part I) for additional information.
| ICT Sector | Shipments 2015 [million] | Est. Total Shipped Weight [kt] | Est. Total Embodied CF [Mt CO2e] | Est. Total Units in Operation 1 [million] | Est. Total OEC 2 [TWh] | Est. Total OEC2 CF3 [Mt CO2e] | Data Source(s) See Table 1 |
|---|---|---|---|---|---|---|---|
| Fixed phones (PSTN + VoIP) | 200 | 40 | 4 | 1650 | 28 | 16.8 | ITU |
| Smartphones | 1433 | 215 | 64.5 | 3700 | 11.1 | 6.7 | Gartner, IDC |
| Other mobile phones | 537 | 54 | 13.4 | 3400 | 5.1 | 3.1 | Gartner |
| CPE (modems, gateways) | 184 | 77 | 7.7 | 925 | 83.5 | 50.1 | Future Source/IHS |
| Tablets | 208 | 156 | 15.6 | 700 | 4.9 | 3 | IDC |
| Laptop PCs | 163 | 285 | 32.6 | 970 | 34 | 20.4 | IDC |
| Desktop PCs | 114 | 855 | 28.5 | 730 | 109.5 | 65.7 | IDC |
| Computer displays | 130 | 650 | 13 | 1000 | 30 | 18 | IHS |
| Computer peripherals | (114) | 114 | 5.7 | na. | na. | na. | Future Source |
| Projectors | 8 | 60 | 1.6 | 50 | 7.5 | 4.5 | IHS |
| Public displays | 3.5 | 175 | 1.8 | 25 | 7.5 | 4.5 | IHS |
| Surveillance cameras | 28 | 80 | 2.8 | 140 | 8.4 | 5 | IHS |
| Payment terminals | 35 | 35 | 1.8 | 150 | 4.5 | 2.7 | BI Intelligence |
| Wearables | 46 | 7 | 0.9 | 100 | 0.1 | 0.06 | IDC |
| Smart meter connectivity | 40 | 6 * | 0.8 * | 400 | 8 * | 4.8 * | Pike Research |
| ICT sector total: | 3213.5 | 2749 | 196 | 14,170 | 342 | 205 | |
| E&M Sector | Shipments 2015 [million] | Est. Total Shipped Weight [kt] | Est. Total Embodied CF [Mt CO2e] | Est. Total in Operation 1 [million] | Est. Total OEC 2 [TWh] | Est. Total OEC 2 CF 3 [Mt CO2e] | Data Source(s) See Table 1 |
| TVs | 235 | 3525 | 70.5 | 1900 | 266 | 160 | Digital TV Research |
| STBs (Set-top boxes) | 265 | 133 | 8 | 890 | 89 | 53.4 | Future Source/IHS |
| DVD/BD players | 57 | 114 | 2.9 | 400 | 20 | 12 | Future Source |
| Media players | 50 | 50 | 1.5 | 200 | 4 | 2.4 | Future Source |
| Home audio systems | 79 | 395 | 4 | 800 | 40 | 24 | Future Source |
| Portable media players | 35 | 5 | 0.7 | 130 | 0.13 | 0.08 | Future Source |
| Headphones | 320 | 160 | 3.2 | na. | na. | na. | Future Source |
| Cameras | 35 | 9 | 1.8 | 500 | 0.5 | 0.3 | Future Source |
| Camcorders | 23 | 6 | 1.2 | 200 | 0.2 | 0.12 | Jon Peddie Research (JPR) |
| Game consoles | 37 | 65 | 5.6 | 250 | 25 | 15 | Jon Peddie Research (JPR) |
| Portable game consoles | 18 | 9 | 1.4 | 100 | 1.5 | 0.9 | Jon Peddie Research (JPR) |
| Arcade game machines | 2.4 | 480 | 4.8 | 25 | 18.8 | 11.3 | Jon Peddie Research (JPR) |
| Automotive (displays) | 75 | 56 | 3.8 | 400 | na. | 2 | IHS |
| E&M sector total: | 1231 | 5006 | 109 | 5795 | 467 | 280 | |
| Paper media (E&M) | |||||||
| Hardcopy devices | 103 | 030 | 10.3 | 500 | 75 | 45 | IDC |
| GRAND TOTAL: | 4548 | 8785 | 295 | 20,465 | 884 | 430 |
1 Estimated total number of devices in operation are per mid-year, not end-of-year. 2 OEC = Operational Electricity Consumption. 3 CF = Carbon Footprint. * Only connectivity module included.
Table 4.
Embodied carbon footprint for network deployment and construction per fixed line or mobile subscription in Sweden and global estimates.
Table 4.
Embodied carbon footprint for network deployment and construction per fixed line or mobile subscription in Sweden and global estimates.
| Embodied Carbon Footprint for Network Deployment and Construction (per Year) | Sweden [24] | Global Estimate |
|---|---|---|
| Fixed telephony | 7.3 kg CO2e/line | 5 kg CO2e/sub |
| Fixed broadband (additional) | +1.1 kg CO2e/line | +1 kg CO2e/line |
| Mobile | 3.5 kg CO2e/sub | 2 kg CO2e/line |
Table 5.
Electricity consumption and embodied carbon footprints for the 35 manufacturing companies (PCB = Printed Circuit Board). The last column presents estimated additional carbon footprint based on a few companies extended scope 3 reporting and LCA reports in the same subsector. Total CF = extrapolated CF + additional CF. * Includes about 30 Mt CO2e from F-gases.
| Category (no. of Companies) | Revenue Share (%) | Electricity (GWh) | Carbon Footprint (CF) Mt CO2e | Extrapolated CF Mt CO2e | Est. Additional CF Mt CO2e |
|---|---|---|---|---|---|
| IC (6) | ~50% | 50,500 | 23.2 | 46 * | 30 * |
| Display (6) | ~85% | 54,400 | 25 | 29.4 * | 21 * |
| Assembly (21) | (~50%) | 47,500 | 23.6 | 47 | |
| PCBs (2) | ~5% | 2000 | 1 | 20 |
Table 6.
Total energy and carbon footprint results (percentage of global 1 footprints).
| Study Part | Energy 2 Footprint | Carbon Footprint (CO2-Equivalents) |
|---|---|---|
| ICT sector | 805 TWh (3.6%) | 730 Mt (1.4%) |
| - User devices | 340 TWh | 395 Mt |
| - ICT networks | 220 TWh | 180 Mt |
| - Data centers and enterprise networks | 245 TWh | 160 Mt |
| E&M sector | 585 TWh (2.8%) | 640 Mt (1.2%) |
| - TVs, TV networks, consumer electronics | 510 TWh | 420 Mt |
| - Paper media and hardcopy devices | 75 TWh (150 TWh3) | 220 Mt |
Table 7.
Total results of this study compared to Ref. [2,3] and intensity metrics for the ICT sector, 2007–2015.
| Total Results | 2007 [2] | 2010 [3] | 2015 |
|---|---|---|---|
| ICT sector total carbon footprint [Mt CO2e] | 620 | 720 | 730 |
| ICT sector total operational electricity consumption [TWh] | 710 | 800 | 805 |
| E&M sector total carbon footprint (excluding paper media and printers) [Mt CO2e] | 520 | 640 | 420 |
| E&M sector total operational electricity consumption (including printers) [TWh] | 730 | 840 | 585 |
| Paper media total carbon footprint (paper media and printers) [Mt CO2e] | 300 | ∼300 | 220 |
| Intensity metrics | 2007 | 2010 | 2015 |
| Total carbon footprint per ICT subscription 1 [kg CO2e/sub] | 134 | 107 | 81 |
| Total carbon footprint per GB data (in networks) [kg CO2e/GB] | 7 | 3 | 0.8 |
| Total operational electricity consumption per ICT subscription 1 [kWh/sub] | 153 | 119 | 89 |
| Total operational electricity consumption per GB data (in networks) [kWh/GB] | 7.6 | 3.3 | 0.88 |
1 Not including M2M subscriptions (only 0.35 B in 2015).
© 2018 by the author. Licensee MDPI, Basel, Switzerland. This article is an open access article distributed under the terms and conditions of the Creative Commons Attribution (CC BY) license (http://creativecommons.org/licenses/by/4.0/).
Share and Cite
MDPI and ACS Style
Malmodin, J.; Lundén, D. The Energy and Carbon Footprint of the Global ICT and E&M Sectors 2010–2015. Sustainability 2018, 10, 3027. https://doi.org/10.3390/su10093027
AMA Style
Malmodin J, Lundén D. The Energy and Carbon Footprint of the Global ICT and E&M Sectors 2010–2015. Sustainability. 2018; 10(9):3027. https://doi.org/10.3390/su10093027
Chicago/Turabian StyleMalmodin, Jens, and Dag Lundén. 2018. "The Energy and Carbon Footprint of the Global ICT and E&M Sectors 2010–2015" Sustainability 10, no. 9: 3027. https://doi.org/10.3390/su10093027
Note that from the first issue of 2016, this journal uses article numbers instead of page numbers. See further details here.