The Service Supply Effect of Cooperatives under Economic Transformation: A Demand-Supply Perspective

School of Management, Harbin Institute of Technology, Harbin 150001, China
*
Author to whom correspondence should be addressed.
Sustainability 2018, 10(9), 3075; https://doi.org/10.3390/su10093075
Submission received: 16 July 2018
/
Revised: 21 August 2018
/
Accepted: 23 August 2018
/
Published: 29 August 2018
(This article belongs to the Special Issue Management of Community Supported Agriculture)
Abstract
:As an important part of the sustainable development of agriculture in China, cooperatives have become a hot topic. However, previous literature has mixed results on the relationship between quantity growth and service supply effect of cooperatives. By conducting multiple correspondence analysis, descriptive statistics, and Pearson’s chi-square test on survey data of 785 farmers, this paper aims to describe the characteristics of cooperatives’ members and evaluate the current state of cooperatives’ service supply from a demand-supply perspective. The results of the survey show that male, middle-aged, and middle-class farmers or farmers who plant local optimal crops are more likely to become the members of cooperatives. There is a huge gap between service supply and demand of farmers; cooperatives have a positive effect on reducing the degree of service demand. This effect is only significant when concerning sale, pest control, and mechanization. On the whole, there is a weak correlative relationship between the current service supply of cooperatives and the service demand of farmers in China.
1. Introduction
Cooperation is an inevitable trend in the sustainable development of agricultural economy in the world [1]. Cooperatives are becoming a research field that receives an increasing number of interested academics in China after a law of the People’s Republic of China on Specialized Farmers Cooperatives was implemented in 2007 [2]. The legal definition of the cooperative is that cooperatives are mutual aid economic organizations joined voluntarily and managed in a democratic manner by the producers and operators of the same kind of farm products, or by the providers or users of services for the same kind of agricultural production and operation. The cooperative is a more formal way of organizing collective action by farmers [3]. They link farmers to stakeholders, such as governments, extension agencies, research institutions, and retailers to form a more efficient division of labor networks [4]. In China, cooperatives play an important and diverse role in the rural economic reform and the development of agricultural modernization [5]. By the end of September 2017, the number of cooperatives has reached 1.93 million with three cooperatives in each village on average. One-hundred million households have joined cooperatives, accounting for about 46.8% of the total number of households. According to the 1.56 million statistics released by the Ministry of Agriculture in 2016, the industry category of cooperatives is divided into crop farming (54%), animal husbandry (23.7%), services (7.9%), forestry (5.9%), fisheries (3.3%), and other industries (5.2%). There are 1.42 million cooperatives (91.2%) led by the rural elite; the operating income of all kinds of cooperatives is $86.71 billion (the exchange rate is based on the average exchange rate of 6.697 between 2016 and 2017, and the same exchange rate is used later), with an average of $55.55 thousand for each cooperative; the annual distribution of the surplus is $14.92 billion, with an average of $9.56 thousand for each cooperative, and an average of $232.79 for each member. According to the service content of the 1.56 million cooperatives, 830 thousand cooperatives (53.1%) provide integrated production and sales services; 448 thousand cooperatives (28.7%) are based on production services; the rest is involved in purchase (3.4%), warehousing (0.9%), transportation (2.4%), processing (2.0%), and other services (9.5%); the total value of the sales and purchase provided by cooperatives is $164.9 billion including sales of $123.58 billion and purchase of $41.33 billion. Besides the direct economic benefits, the cooperative’s large-scale operation provides greater possibilities for the intervention of capital, and shows great externality in product traceability, product quality, food safety, and industrial chain extension [6,7,8,9,10]. In short, cooperatives have become an important agricultural business entity and the backbone of modern agricultural construction in China.
Compared with other regions, such as the United States (US), Japan, and the European Union, the development of cooperatives in China is still at the initial stage [11,12]. The impetus for the rapid growth of cooperatives comes from the government [13,14,15]. The development of cooperatives is under the background of agricultural economic transformation, which aims to find new ways of agricultural development based on existing agricultural production [16,17,18]. At present, cooperatives have become the main organization form in current rural cooperative economic organizations with an average annual growth of 60%. Cooperatives have changed the discrete operation into a scale operation to a great extent. The promotional role of the government is not only to clarify the legal person status, establishment conditions, rules and regulations of the cooperative, but also to give the related policy inclination, especially in terms of tax reductions and direct financial subsidies [19]. For example, the total amount of financial support at all levels reached $720 million in 2016.
However, problems have begun to emerge, such as undemocratic internal management, uneven distribution of interests, low participation of farmers, and defrauding of national financial support, and even some cooperatives exist only in name [20,21]. Therefore, the research on the effect of cooperatives attracted the attention of scholars. Some scholars have begun to suspect that most of cooperatives in China violate the original essence evolved from the criterion of Rochdale Equitable Pioneers [22,23]. Then, the discussion about the authenticity of the cooperative shifts the focus on research to the choice of judgment standards [24]. Scholars are entangled in the discussion about essential attributes of cooperatives, but ignore the final purpose of developing cooperatives. As an organization with a public property, the purpose of cooperation is to integrate resources so as to achieve the effective docking with the service demand of farmers rather than make a profit. The rationality of cooperatives comes from the realistic service demand of farmers in agricultural production. But few studies discuss the service supply effect of cooperatives from the perspective of supply-demand. Currently, affected by farmers’ multiprofessional status, ageing and other factors, the gap of service demand in agricultural production is becoming larger in China. The development of cooperatives is still at infancy, and the relationship between supply and demand is unbalance. Thus, it is more significant to identify the matching degree between the service supply of the cooperative and the service demand of farmers. Different from the previous studies with analyses of performance and management structures and so on, this paper tends to examine the service supply effect of cooperatives from a demand-supply perspective.
The service supply of cooperatives under the legal framework includes purchasing the means of agricultural production, marketing, processing, transporting and storing farm products, and providing technologies and information related to agricultural production and operation. Balanced supply and demand relationship means the service supply of cooperatives can effectively meet the service demand of members. It also means the service supply of cooperatives is effective in improving the efficiency of agricultural production and increasing the income of members. This paper focuses on the development dilemma of cooperatives between the quantity growth and the insufficient service supply in the period of China’s economic transformation, and attempts to analyze this phenomenon theoretically and realistically. Starting from the experience of the rapid rise of China’s cooperatives, the questions to be answered in this paper include: (1) What is the relationship between cooperatives, service demand of famers, and service supply of cooperatives? (2) What is the mechanism of the insufficient service supply of cooperative? (3) What is the real service demand of farmers? (4) What is the practical service supply effect of cooperatives? According to above questions, the research contents of this paper are as follows: (1) Analyze the relationship between cooperatives, service demand and service supply, and construct a theoretical framework for the service supply effect of cooperative from the perspective of supply-demand; (2) Describe the current state in the service demand of farmers and the service supply of cooperatives, and identify the matching situation between service demand and service supply.
2. An Analytical Framework for the Service Supply Effect of Cooperatives
2.1. Service Demand and Service Supply
The steady growth of the agricultural economy comes from a balanced service supply-demand relationship. The underlying cause that leads to low productivity in agriculture is the mismatch between supply and demand in agricultural production service. Due to the lack of service supply, most farmers in China still complete the entire agricultural production process alone. Besides, the farmers’ natural endowments cause the increase in the demand for the service of agricultural production. The no-scale management model leads to the difficulty of service supply. In order to change the state of the farmers’ discrete operation and expand service supply, cooperatives have played the main role in alleviating the imbalance of supply-demand.
2.1.1. The Service Demand of Farmers
Agricultural production chain involves pre-natal, mid-production and post-natal, and the service demand of farmers corresponds to the agricultural production chain [25,26]. The main features of service demand are related to periodicity and regionalism. The periodicity indicates that service demands should be met in seasonal order and have a certain period of change. The regionalism is related to the type service demand. Similar to Japan and South Korea, the characteristics of the small land area per capita determine the serviceability of the smallholder production mode in China. However, the small-peasant economy in China is nonscale production. The statistics display that there are nearly 260 million households with a scale of less than 3.3 ha (abbreviation of hectares), accounting for about 97% of the total in 2016. This leads to the lack of technical means, shortage of labor force, shortage of funds, weak ability to resist risks, and high transaction costs [27,28]. Especially in the market economy system, the contradiction between the small-peasant production and the large market has been the most urgent problem, together with the higher target of farmers in producing better products, selling higher prices and gaining more profits. Combine the characteristics of agricultural production of China, the links involved in the service demand of farmers are as follows in Table 1.
In general, all aspects of agricultural production will lead to service demand. Depending on the character of demand, related service can be divided into demand for production and demand for others. The former is related to the specific links of agricultural production, such as sowing, fertilizing and harvesting. The latter involves other demand related to agricultural production, such as financial, subsidized distribution and demand in daily life. Previous studies have shown that the service demand of farmers is not only related to the characteristics of the industry, but also related to the characteristics of farmers, such as gender, age and education [29,30]. Except these aspects, operational conditions including the scale of land, the quantity of labor and the income per capita also have an impact on service demand [31,32]. The service demand of farmers is a prerequisite for the establishment of a cooperative. The investigation of farmers’ real service demand and in-depth analysis has great practical significance for providing targeted and efficient service supply in the stage of agricultural socialization service system construction.
2.1.2. The Service Supply of Cooperatives
Cooperation is one of the best means of farmers’ self-protection [33]. The cooperative can be an effective institutional arrangement of breaking the vicious cycle of poverty in the rural society [34,35]. The definition of cooperatives by the International Cooperative Alliance (ICA) is that a cooperative is an autonomous association of persons united voluntarily to meet their common economic, social, and cultural needs and aspirations through a jointly owned and democratically controlled enterprise [36]. Cooperatives are actually people who engage in business activities and work together to provide services and benefits to their common economies and society [37]. The importance of service supply of cooperatives for agricultural production is mainly to help farmers solve the difficulties encountered by members in the market, and to improve of members’ economic interests [38,39,40,41]. The service supply of cooperative can reduce the risk of production and operation of members, save the transaction costs of members and enhance the market position of members [42,43,44,45,46]. Cooperatives work mainly relies on bilateral relations. They can narrow the gap between the market, governments and daily agricultural practice. Corresponding to the service demand, the function of cooperatives is providing services for farmers. Due to the concentration of farmers, unified management in specialized activities including materials, sell and machining can be achieved by cooperatives. Apart from that, cooperatives can also provide other comprehensive services, such as services of technology, finance and information [47]. As an organization for the services supply, cooperatives have the advantages of business compared with small-peasant economy. Besides, farmers are the main participants and managers of the cooperative, and they possess the status advantage of finding service demand from reality as producers. At last, cooperatives are non-profit organizations, and their members are a close-knit community of interests, which is beneficial to improving and expanding service content [48].
Of course, the service supply effect of cooperatives is highly correlated with product characteristic, quality of members, operating conditions and the institutional environment [49]. In China, although the authorities have planed a favorable institutional environment for further development of cooperatives, cooperatives also face great challenges including limited access to land and capital, a massive loss of laborers, low market competitiveness, weak internal management, and low quality of farmers’ cooperation [50]. The surge in quantity fails to represent the overall prosperity of the cooperative economy. The quality of the service supply that matches the demand is the guarantee of development. In this case, the analysis on the effect of service supply is necessary to recognize the position of cooperatives in the supply-demand network in the early phases.
2.2. The Analysis Framework Construction
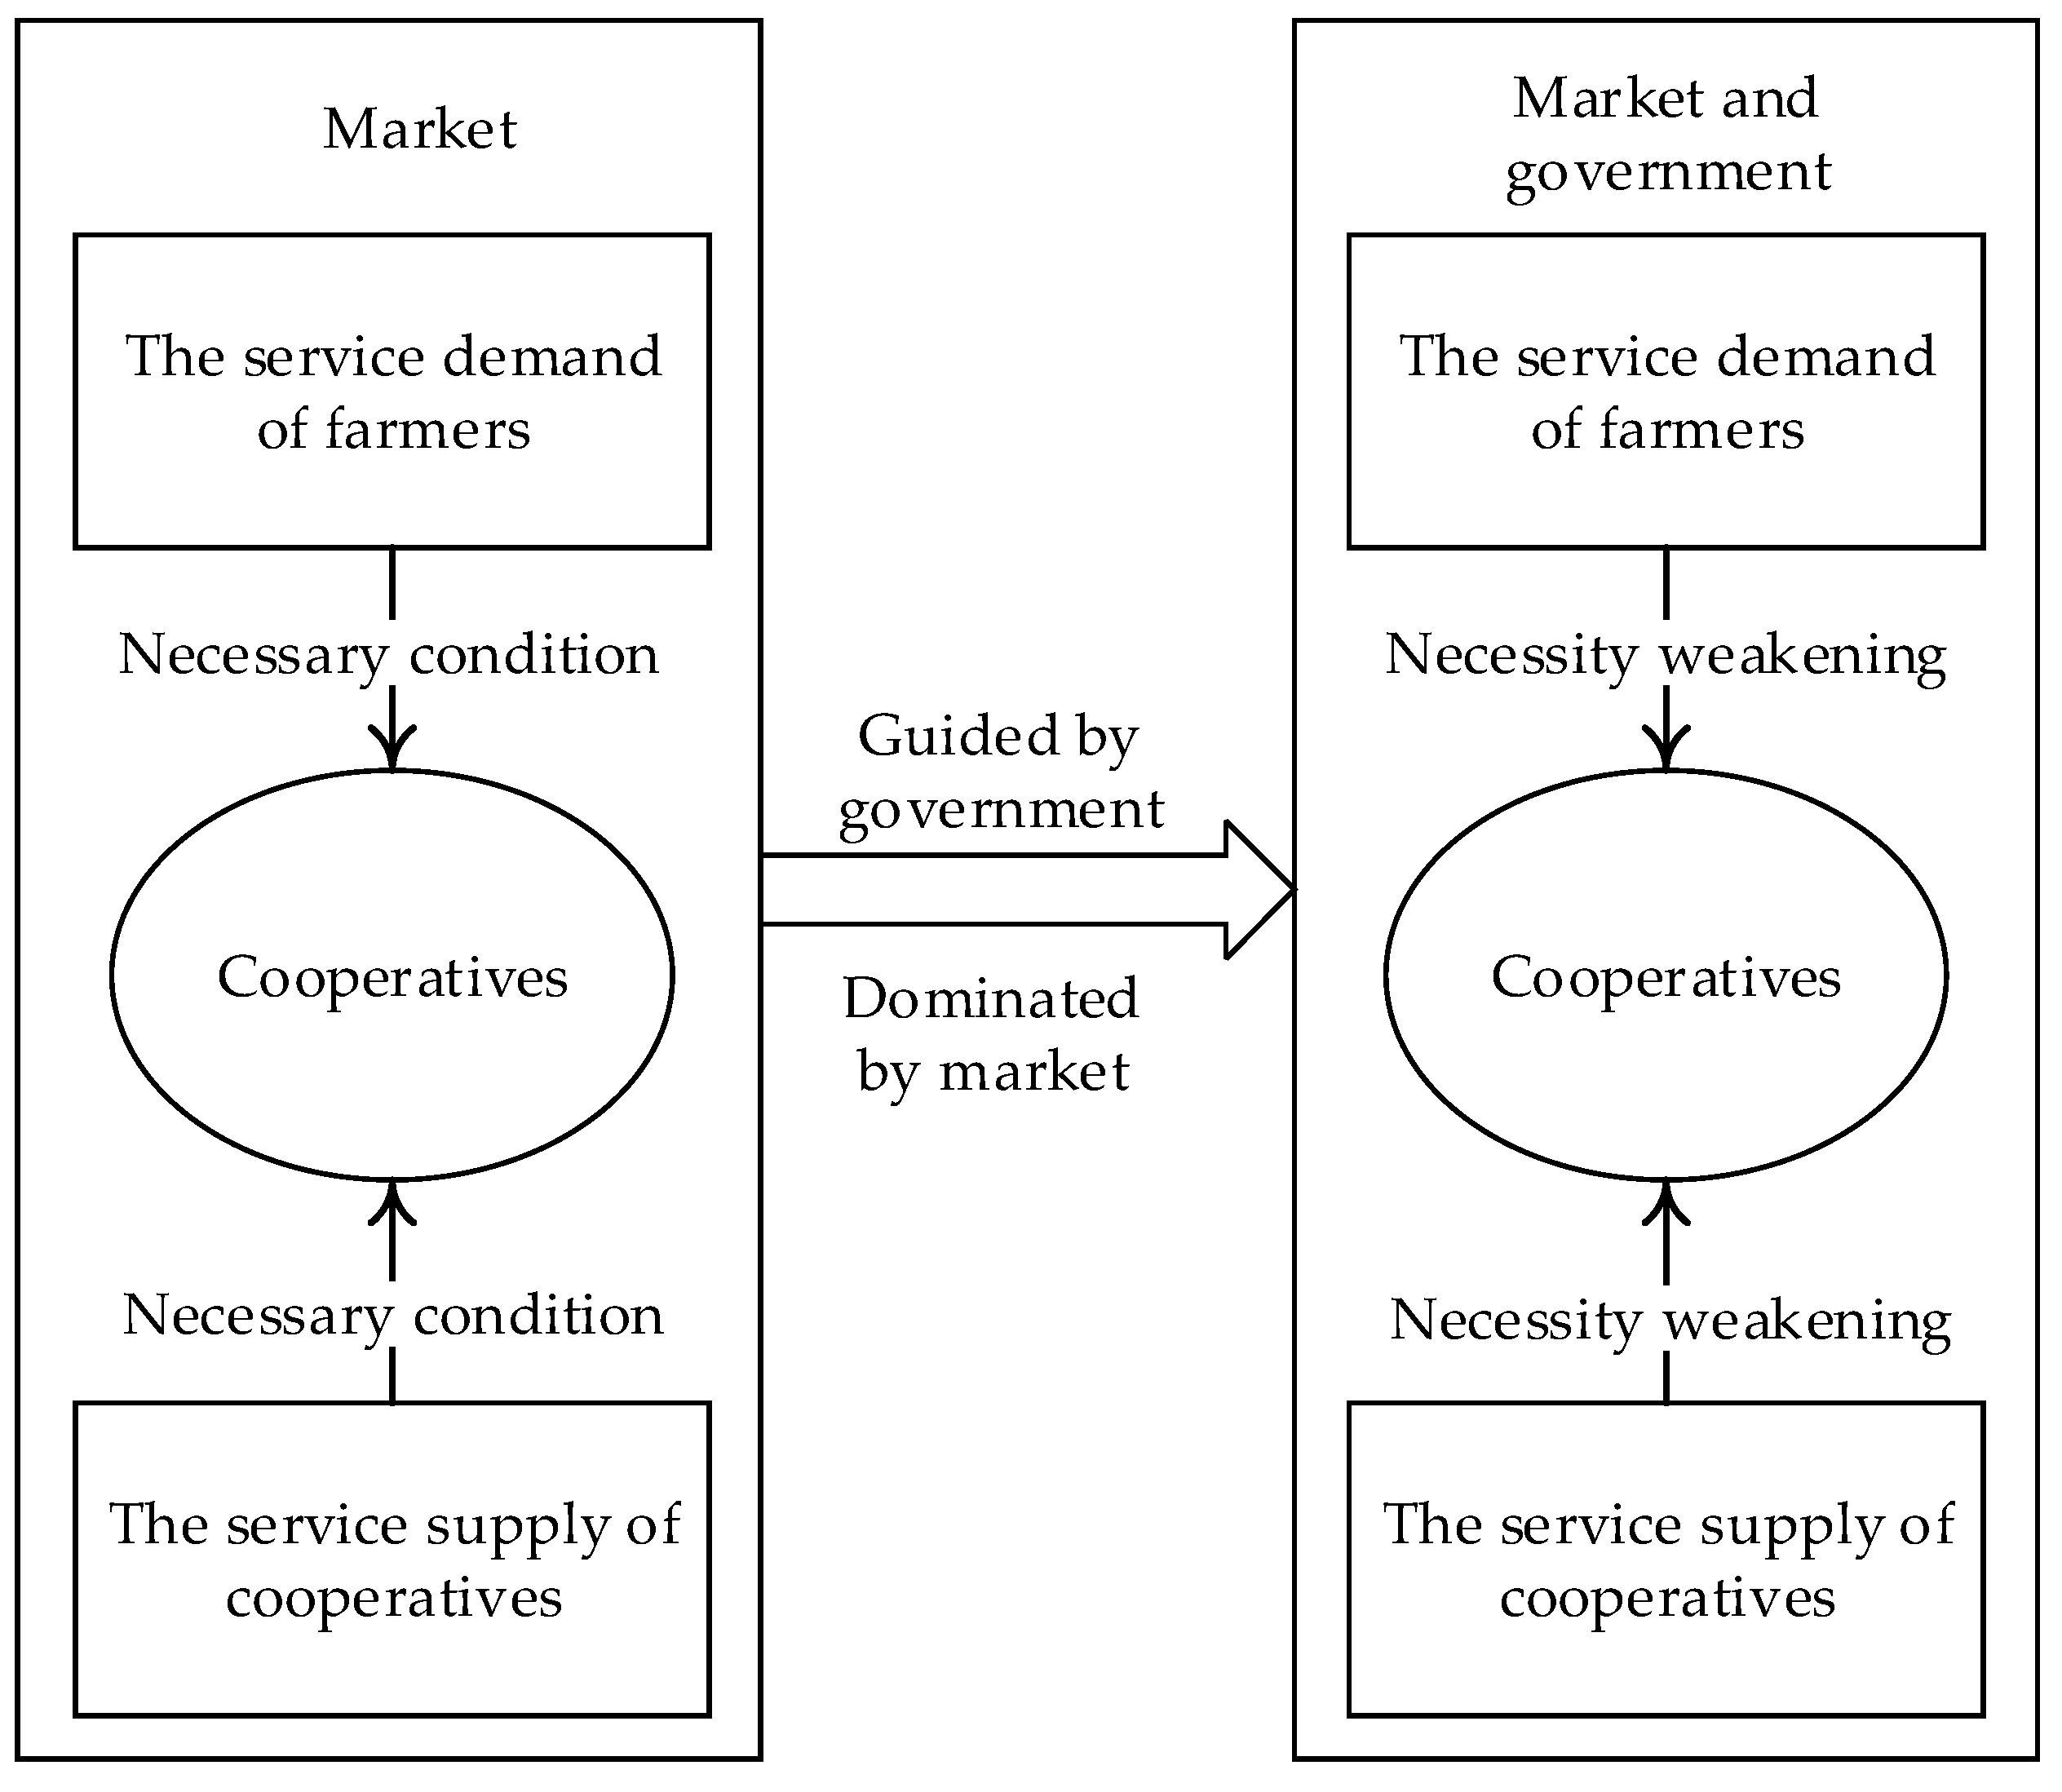
The economic paradigm of supply-demand indicates that the service demand of farmers inevitably leads to the supply of services. The cooperative as the economic organization of service supply has the inevitability of existence. From the point of view of supply-demand, the service demand of farmers will lead to the service supply of the cooperatives, and the service supply of the cooperatives will in turn affect the farmers’ service demand. This cycle promotes the overall prosperity of the agricultural economy. In the economic analysis framework involving service supply-demand relationship and cooperatives, service demand of farmers and service supply of cooperatives are two essential conditions for the establishment of cooperatives (Figure 1). The theory of supply-demand shows cooperatives are worthless when they are separated from the service demand of farmers and do not provide services. This provides a basic analytical paradigm of economics for the service supply effect of cooperatives.
Although some government policies (such as abolition of agricultural tax, licensing of land circulation in China) can reduce farmers’ production costs, they cannot directly supply agricultural production services. For example, it’s difficult for the government to provide targeted services to different regions or different crops. Therefore, the direct function of the government in reducing the service demand of farmers is very limited. On the other hand, the value of cooperatives in the agricultural economy is recognized worldwide, but the problems in agricultural production (such as low return on capital, insufficient division of labor) and organizational normative limit the development of cooperatives [51,52,53,54]. Reconsider the natural weakness of agriculture, it is difficult to form cooperatives by farmers spontaneously. To solve these problems, governments have actively created a good external environment for the development of cooperatives to realize the indirect service supply of farmers. The government’s involvement mainly includes the following two aspects: the first is to enact relevant laws to regulate the operation of cooperatives; the second is to implement fiscal subsidy policies to solve the financial dilemma. Market dominance and government guidance have an impact on the relationship between supply and demand of services. They change the original supply-demand relationship. The law provides conditions for the normative development of cooperatives, but preferential policies also provide the possibility of “opportunism” [55]. The result is a necessity weakening between cooperatives and service demand of farmers, as well as between cooperatives and service supply. The specific performance includes: the establishment of cooperatives does not start from the service demand of farmers, but hopes to obtain the maximum benefit from financial subsidies; cooperatives do not aim at service supply as an organizational goal, but rather to meet the conditions for obtaining financial subsidies.
Under the influence of the long-term market and government, cooperatives have formed a mature development system (law, policy, supervision) in developed countries [56,57,58]. China’s cooperatives are still at the initial stage, and their corresponding development system is far from perfect. Judging from the growth rate of cooperatives in the past decade, the function of the government is far greater than the market. In addition to laws, regulations, regulations, and accounting systems, the Chinese government has also made policy tilts [59]. For example, the government provides special funds to support cooperatives in certain fields; cooperatives sell agricultural products exempt from value-added tax; cooperatives enjoy land transfer subsidies, grain subsidies, agricultural machinery subsidies and so on [60]. It can be concluded from the above discussion that the contradiction between the support of the China’s government and the lack of a sound development system will lead to the weakening of the necessity in the original market. Therefore, this paper proposes the hypothesis that there is a weak matching relationship between the current service supply of cooperatives and the service demand of farmers in China.
3. Materials and Methods
3.1. The Survey
The materials used in this study is derived from the rural questionnaire at WuChang in 2017. WuChang is located in the southern part of Heilongjiang Province in China. It is a typical region for grain production in single cropping system with 270 thousand ha of arable land. Rice is the main crop in the production area influenced by unique geography, climate, and other factors. Rice planting area accounts for one-tenth of the province. In particular, “WuChang rice” ranks the second in the brand value evaluation of the geographical indications of primary agricultural products, with a brand value of $9.81 billion in 2017. In the development of cooperatives, 7000 have registered in in 24 townships and 260 administrative villages by the end of 2017. The number is close to the average of three cooperatives in each village. The reasons for choosing WuChang as material source are as follows: First of all, WuChang, as an important commodity grain base of the country, is representative of the sustainable development of the agricultural economy. Secondly, the proportion of crop production in agricultural production is relatively large, and the industrial structure of agriculture is relatively simple. Thirdly, relying on “WuChang rice”, the development of cooperatives is much better than other regions, which is conducive to the study. Finally, WuChang is the hometown of author, which facilitates the collection of materials. The survey is carried out in May. May is an intermittent period of agricultural production in this region, and the fundraising of agricultural production, the purchase of production materials are also basically completed before this time. As the spring work has just ended, it will not occupy the working hours of farmers. The farmers working at this time are the main participants in agricultural production, and they are more trustworthy in terms of service demand.
In order to obtain materials, the research team visited four townships including Chonghe, Longfengshan, Xiaoshangzi, and Minyi. The main crops of first three townships was rice and they were in the same irrigation system, while the main crops of Minyi was corn. The numbers of villages under the jurisdiction of four townships were 11, 18, 10, and 8 respectively. The numbers of cooperatives registered in four townships were 277, 388, 463, and 453 during the period of investigation. With the help of local village officials, the research team visited 10 villages (including three villages of Chonghe, three villages of Longfengshan, two villages of Xiaoshangzi, two villages of Minyi). We distributed 100 questionnaires in each village and total of 1000 questionnaires. To ensure the quality of the questionnaire, farmers will get paid when they fill out the questionnaire. The questionnaire design includes three parts: basic information (including gender, age, educational level, cultivated land, agricultural earnings, products, and so on), status of production and operation (focus on the related problems in production), and status of participation in cooperative (including the members of cooperatives or not, reasons for not joining the cooperative). After a month of visits and collation, 785 valid questionnaires were obtained.
3.2. Methods
In order to assess the questionnaire, three statistical analysis methods are adopted via the software SPSS 19. To compare the difference between members and nonmembers of cooperatives, multiple correspondence analysis is conducted. For the analysis of the current state of service supply, the descriptive statistics is employed. To evaluate the effect of service supply in cooperatives, analysis of the qualitative characteristics has been carried out.
3.2.1. Multiple Correspondence Analysis
Correspondence analysis (CA), also called R-Q factor analysis, is a multivariate statistical technique. It is conceptually similar to principal component analysis, but is applied to categorical data rather than continuous data. CA decomposes the chi-squared statistic associated with this table into orthogonal factors, and reveals the relationship among variables. Multiple correspondence analysis (MCA) can be viewed as an extension of simple CA, and it is applicable to a large set of categorical variables. MCA represents the proportion of each element for rows and columns of a contingency table in the form of points in low dimensional space. The analysis method can reveal the differences between various categories of the same variable, and the correspondence between various categories of different variables. Its analysis features are as follows: (1) Multiple classification variables can be processed at the same time, and the relationship between the variables can be expressed in a graph; (2) Variables in a variety of forms can be analyzed. Multiple correspondence analysis combines Q factor analysis with R factor analysis through a transition matrix Z. Through the covariance matrix A = Z of the index variable points and the covariance matrix B = ZZ′ of the sample point, the conclusion of sample factor analysis can be obtained by means of the index type factor analysis. If the first two factor loads are selected for each group of variables, then the two sets of variables can form a scatter plot of two factor loads. As the load represented by these two graphs can be matched, the two scatter points of these two loads can be drawn in a picture, so as to directly show the relationship between row and column variables.
3.2.2. Analysis of the Qualitative Characteristics
The correlation between qualitative characteristics can be verified by the means of Pearson’s chi-square test, which is suitable for data with distinct classification characteristics. The sample data is used to determine whether there is a significant difference between the overall distribution of the sample and the distribution of a certain hypothesis. The null hypothesis of the chi-square test is that there is no obvious difference between the overall distribution of the sample and the expected theoretical distribution. The formula of Pearson’s χ2 statistics is as follows:
where is Pearson’s cumulative test statistic, which asymptotically approaches a distribution; is the number of sample classifications; is the observed frequency; is the theoretical frequency. The smaller the value is, the closer the observed frequency and the theoretical frequency are. Pearson’s statistic gradually follows distribution of the freedom degree under the large sample condition.
According to the analysis methods, there are generated the statistical outputs including graphs of means, the joint plot of category points and test tables. The null hypothesis is that there is no obvious difference between members and nonmembers of cooperatives in service demand.
4. Results
4.1. The Sample Description and Member Characteristics of Cooperatives
All the respondents are farmers who engaged in planting. The personal characteristics are distinguished according to the gender and age. There are 389 males (49.6%) and 396 females (50.4%) in the sample, and farmers under 40 years of age accounted for 81% (Table 2). According to a recent census in 2010, the total rural population of Heilongjiang Province is 16.99 million. The percentages of males and females are 50.9% and 49.1%. The percentages of rural population aged 15–59 and over 60 are 74.12% and 12.08%. There are two reasons for the differences in gender and age structure compared with the basic situation in the province. First, some villagers go out to work during the survey, and most of them are men. Second, young people have more advantages in understanding the questionnaire and are more interested in cooperatives.
The operational characteristics of farmers by the descriptive statistics are shown in Table 3. They include cultivated land, earnings, and types of products. Among the 785 farmers, 369 farmers (47%) have cultivated land under 2 ha, accounting for the largest proportion; 2–4 ha accounts for 25.5%; 5–10 ha accounts for 15.8%; 11–15 ha accounts for 6.2% and more than 16 ha accounts for 5.5%. In agricultural earnings, farmers with less than 2986.41 dollars (20,000 yuan) account for 362 (46.1%); the second is 2986.41–7466.03 dollars (20,000–50,000 yuan) accounting for 27.9%; another 5.3% are over 23,891.29 dollars (160,000 yuan). It shows that the earnings gap among farmers is large. These characteristics indicate that small plots and low earnings are still the common phenomenon. Besides, there are 355 farmers (45.2%) who grow rice, 298 farmers (38%) who grow corn, 104 farmers (13.2%) who grow soya, and 28 farmers (3.6%) who grow other products in the sample. In 2015, the per capita disposable income of rural residents is 2132.45 dollars, and the production of rice and corn is 1.15 million tons and 1.16 million tons respectively in WuChang. The per capita disposable income in the survey is similar to the statistical data. Farmers who planted rice in the survey were mostly due to the rice as the main crop in the villages visited by the research team.
Among 785 responders, there are 264 farmers (33.6%) who are the members of cooperatives, while 521 farmers (66.4%) are the nonmembers of cooperatives. To discuss the difference between members and nonmembers, we construct crosstabs about participation and farmers’ characteristics. In personal characteristics, the male proportion (53.8%) in cooperatives’ members is higher than the proportion in nonmembers (47.4%). The farmers aged 31–40 years are the largest among members (36.0%) and nonmembers (29.6%). The biggest difference regarding the proportion (8.9%) is at the age of 18–25 (Table 4).
In operational characteristics, Table 5 (1–6 represent the six levels of farmers’ earnings; R, C, S and O refers to rice, corn, soya, and others respectively) shows that farmers with cultivated land under 4 ha (67.8%) account for the largest number in cooperatives; more than 66.7% of the members have earnings under $7466.03, which are lower than nonmembers (77.7%). The maximum proportion of products in cooperatives is rice (54.2%).
The above tables show the basic information of members and nonmembers. The next section will reveal the relationship between variables in MCA. The MCA result for the participation-personal characteristics shows that a one-dimensional solution accounts for 37.3% of the total variance explained, with an eigenvalue of 1.118. Furthermore, a two-dimensional solution can add an additional 36.2% of variance, and the total dimensions can explain 73.5% of the variances. For the participation-operational characteristics, the model summary shows that the total eigenvalue is 3.036, involving the eigenvalue of dimension 1 (1.678) and the eigenvalue of dimension 2 (1.358), and 75.9% variances are explained by two dimensions. To be specific, dimension 1 explains 42%, while dimension 2 explains 33.9% (Table 6).
Figure 2 is the perceptual map generated by MCA. For observing convenience, we make the X and Y reference lines. When the observation area is divided into four quadrants by inserting the reference lines, there is a stronger correlation between the two variables in the same quadrant. Explanations of the figure are as follows: the farther the plot from the original point is, the more distinct the point is, the more meaningful it is from a statistical point of view; two points are connected to the original point to do a ray respectively, the smaller the angle between the two rays is, the more relevant they are; the connection of the first point and the origin concerns the ray, do the second point and the vertical line to this line, and as the vertical point is closer to the first point, they are more relevant. According to the results of MCA, the conclusions about the participation-personal characteristics can be drawn. In gender, males and females are in two different quadrants. The correlation between males and members of cooperatives is significantly higher than females. It suggests that men are more likely to be members compared with women. In age, there is a significant difference between different ages. Farmers aged 18–25 years and 51–60 years are more inclined to being nonmembers. Farmers aged 26–40 years have greater possibilities to become members, especially farmers aged 31–40. Moreover, it is not obvious in the identity difference in farmers aged 41–50. The analysis results show that gender differences have a significant relationship with members of cooperatives. The significant relationship is also shown in age including 18–25, 51–60, 26–40. The specific performance is that the willingness of men is higher than that of women, and the possibility of the middle-aged farmers (26–40) is higher than others.
The results of MCA about the participation-operational characteristics are described in Figure 3. In cultivated land, the point with cultivated land of less than 2 ha is closer to the point of nonmembers. The points with 2–20 ha have more advantages in the distance from members, especially the points of 2–4 ha and 5–10 ha. It means that farmers with 2–20 ha cultivated land have more chance to become members of the cooperative. In agricultural earnings, the point of less than 2986.41 dollars is farther with members than nonmembers. The points with 2986.41–29,864.12 dollars are opposite. Thus, it is more relevant between the farmers with earnings of 2986.41–29,864.12 dollars and members. It proves that cooperatives are more likely to exert an impact on the middle-class farmers [61]. In crop variety, products of rice and soya show the stronger relevance with members, which is different from corn and other products. Besides, farmers with rice products have the strongest relevance with members. The second is farmers with soya products, while other farmers are more likely to be nonmembers.
On the whole, male, middle-aged, or middle-class farmers are the main group of cooperatives’ members among planting farmers in the sample. As rice is the dominant crop in the region, it shows that farmers with dominant crops are more willing to be members than others.
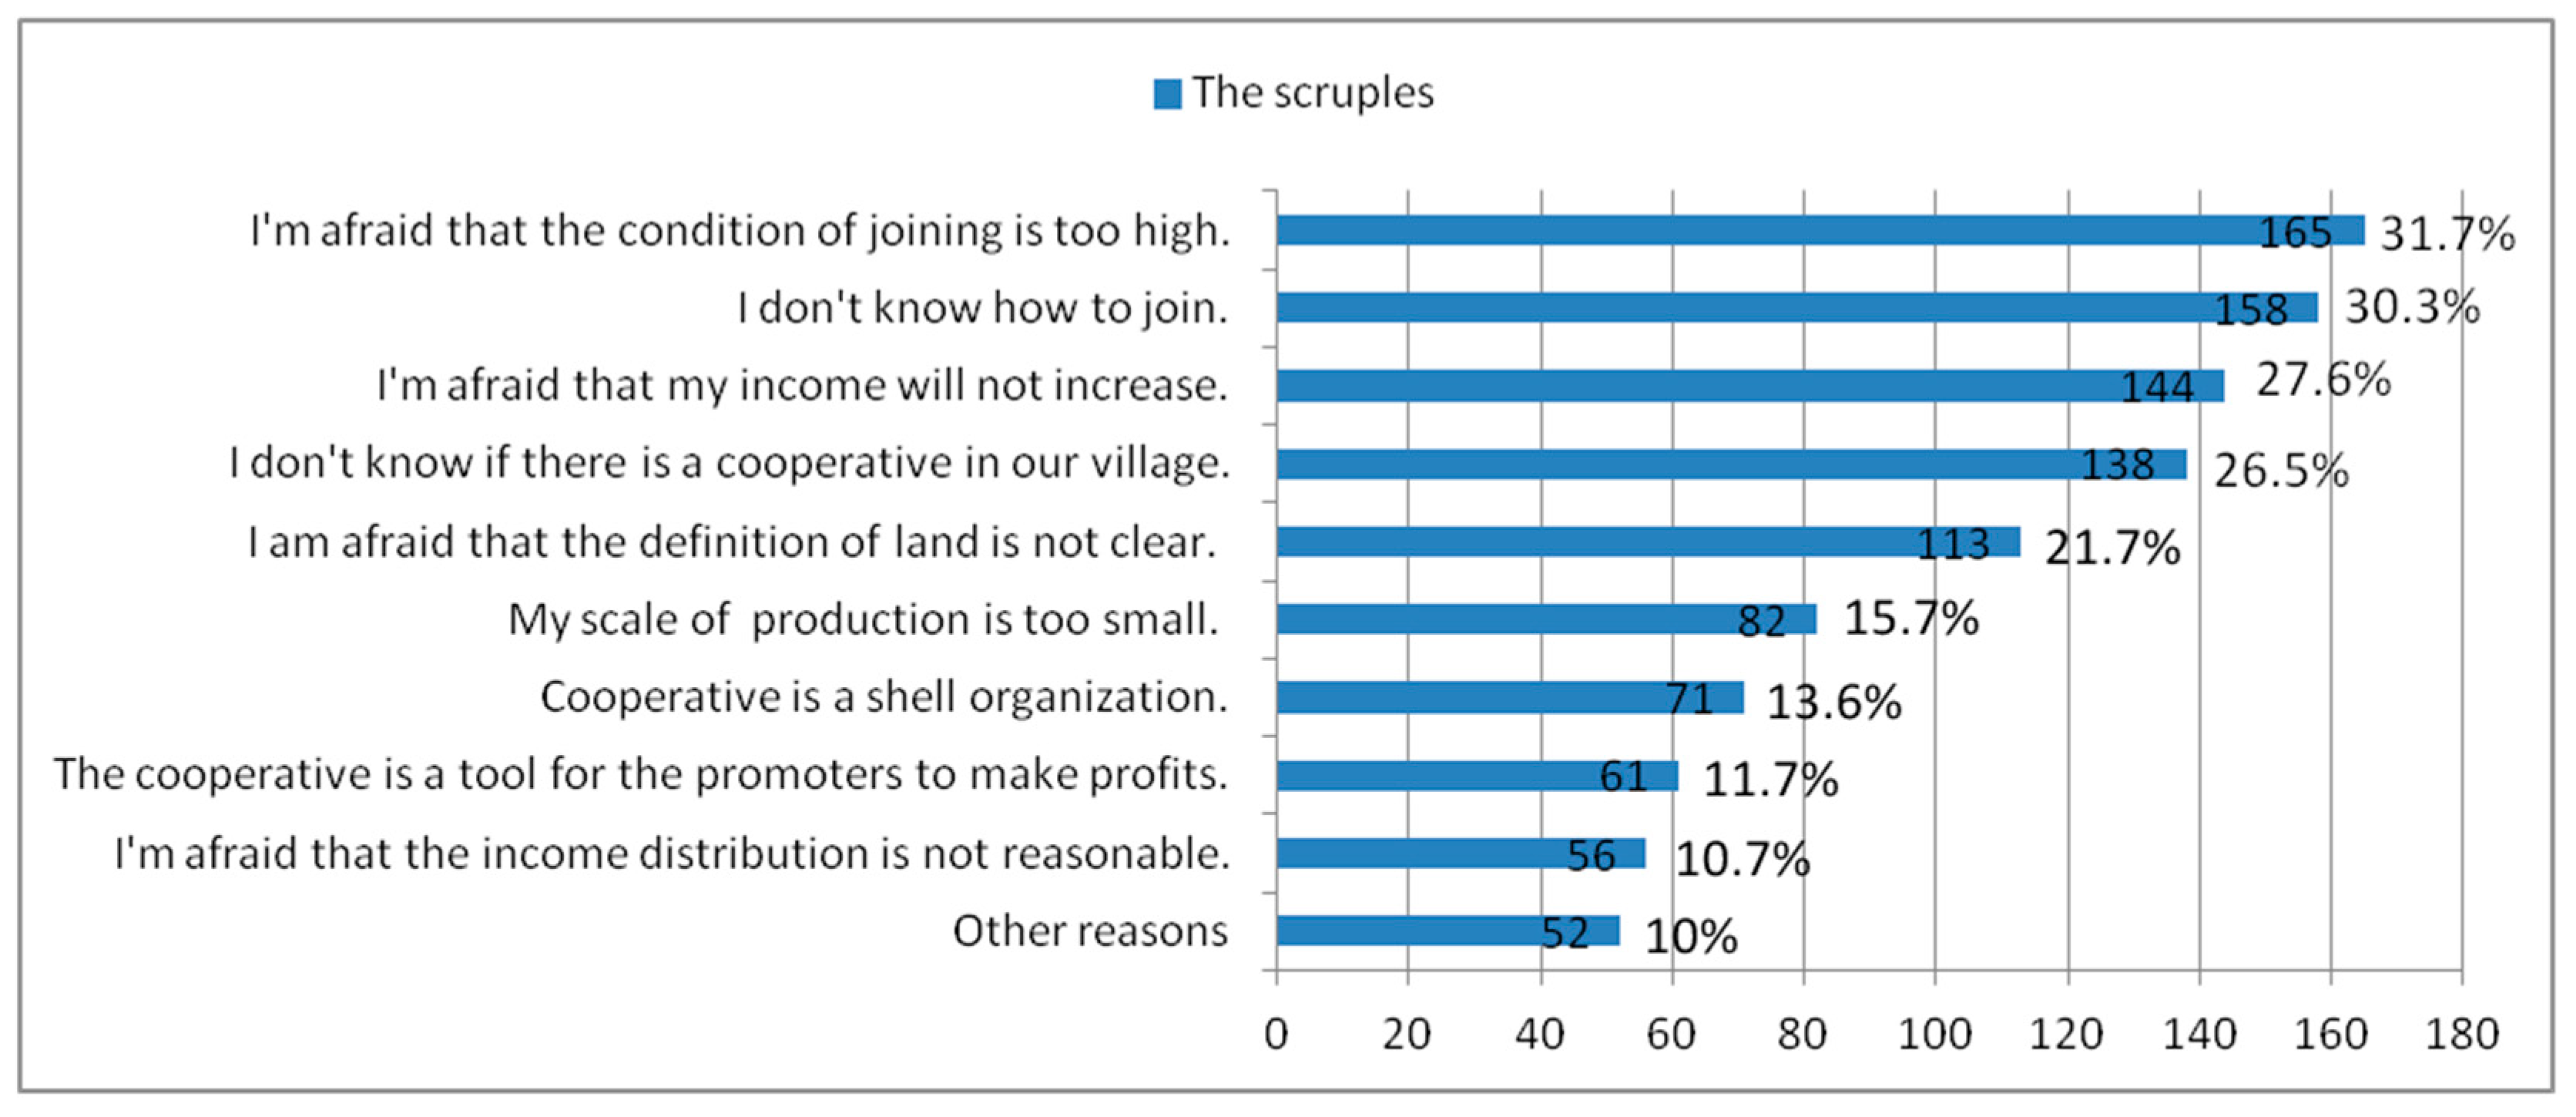
Since joining cooperatives help meet the needs of farmers, why do most farmers have not yet become members of cooperatives? To answer this question, we have carried out a further investigation for 521 nonmembers of cooperatives. The farmers who do not know how to join and fear the condition of joining were 31.7% and 30.3% respectively. Beyond that, other high proportion options such as limited increase in income (27.6%), the unclear position (26.5%) and the land definition (21.7%) are considered by farmers (Figure 4).
The results show that the lack of understanding about the management and operation mode of cooperatives is the main reason that leads to the low participation of the farmers, which is consistent with previous studies [62,63]. For one thing, farmers are not clear about the way and method of joining the cooperative. For another, farmers have a skeptical attitude towards the role of cooperatives. Some farmers (11.7%) even believe that the cooperatives are only a tool for the initiators to cheat the country’s policies and seek their own interests. It can be seen that farmers’ understanding of cooperatives is not comprehensive and some negative views have an impact on the enthusiasm of farmers concerning joining the cooperative.
4.2. The Current States of Service Demand
According to the statistics of China’s Ministry of Agriculture, the agricultural labor productivity in China is 2% of the average level of the developed countries. It is 1% of the agricultural labor productivity in the United States and possesses 64% of the world average efficiency. Non-scale operation will increase production costs and leads to more production problems. By visiting and interviewing, we put forward eight questions that farmers may face in agricultural production in Table 7.
Various difficulties represent the farmers’ service demand. The proportions of the difficulties in the sample and the number of members and nonmembers of the cooperatives are shown in Figure 5. The results show that the common difficulties among farmers include insufficient production funds (36.6%), lack of technical support (33.1%), labor shortage (28.9%), difficulties in land transaction (28.7%), sale difficulties (28.5%), lack of market information (22.4%), pest control, mechanical cultivation (14.6%), and means of production (8.4%). It can be clearly observed that funds, technology, labor, land transaction and sale are the main service demands of farmers. In order to get a better understanding of the situation, further investigation is carried out. In the samples of insufficient funds, the ratio of usualness underfunding is up to 47%. In addition to the purchase of household tractors and seeding machines, the popularity of large machinery is extremely low, and the crop variety and agricultural production technology also show a lag. In terms of labor shortage, 64.3% of farmers first consider their relatives and friends on their employees before the investigation, and only 23.8% of the samples had hired workers through cooperatives. In the field of land transfer, land transfer among relatives (33.8%), neighbors (20.4%), and villages (28%) accounts for 82.2% of the sample. Only 3.6% of the farmers are assisted by the cooperatives. Discussing sales with relatives and friends is the main means for the sale of farmers’ goods that account for 224 samples (31.3%); order agriculture accounts for 22.3%; company purchase accounts for 25.9%; cooperatives sales accounts for 15.6%. On the whole, there is a big gap between the demand and supply of agricultural production among farmers. It is in the condition that the demand is greater than the supply.
Figure 6 is the bar graph for comparing the selected proportion of members and nonmembers in the sample. It can intuitively reflect the differences in various difficulties. Members have lower service demand in insufficient funds, labor shortage, sale, market information, pest control and mechanization, and means of production. But the difference is not particularly obvious, such as only 2% in insufficient funds and only 2.5% in labor shortage. Moreover, the proportion of members in technology and land transaction is even higher than nonmembers. Therefore, it can only be judged that the demand for members in some services is less than nonmembers. The effect of the cooperative service supply can’t be confirmed.
It can be concluded that the gap of service demand is large, especially in the case of insufficient funds and technology. The descriptive statistics on the proportion of service demand can’t explain the effect of cooperatives’ service supply.
4.3. The Effect of Cooperatives’ Service Supply
To test the effect of cooperatives’ service supply, we divided the service demand of farmers into three degrees: high, medium and low. In the low service demand degree, the number of difficulties involved in agricultural production is less than or equal to 3. The medium degree includes 4–6 difficulties while the high degree has more than six difficulties. After the variable adjustment, there are 118 members (44.7%) in the low degree of service demand; 142 members (53.8%) are in the medium degree and 4 (1.5%) members are in the high degree in total 264 members of cooperatives. In the 521 nonmembers of cooperatives, there are 255 farmers (48.9%) in the low degree of service demand; 243 farmers (46.6%) are in the medium degree and 23 farmers (4.4%) are in the high degree (Table 8).
The cross-analysis on the degree of service demand and participation is conducted, and chi-square test results are obtained as follows:
The results with the chi-square test criteria and correlation characteristics are summarized in Table 9. The calculated level of significance p (0.034) is lower than α = 0.05 for the chi-square test. The null hypothesis is rejected. It is in favor of alternative hypothesis which speaks of a statistically significant dependency. It is observed that there is the significant dependency between the service demand level and the participation status with a 95% probability. Next, we carry out the chi-square test on 8 service demands to discuss the differences in each service demand. Furthermore, statistical calculations for the verification of all situations are presented in Table 10. The results show that there is the significant dependency between sale and participation (p = 0.084) with a 90% probability. There is the significant dependency between pest control and mechanization and participation (p = 0.023) with a 95% probability. Contrary, the relationships of other factors have not been confirmed as the p-value that is greater than 0.1. In other words, only 2 relationships can reject the null hypothesis.
The analysis on participation and the level of demand shows that joining a cooperative is helpful to reduce the service demand. The other analysis shows that the service supply of cooperatives is only related to sale, and pest control and mechanization. In general, the cooperatives can alleviate the imbalance between supply and demand of the farmers’ agricultural production services at the present stage. But the content of their service supply still needs to be improved. Moreover, we made a further investigation on the understanding of service supply by 264 members. Only 10 members (3.8%) are extremely clear for the specific services provided by cooperatives. Most of the members are common (39.8%). 109 members (41.3%) are in the unclear or extremely unclear state. It can also show that the limited effect in service supply of cooperatives is proved by the research mentioned above.
5. Discussion and Conclusions
The key argument of this paper is the matching level between service supply of cooperatives and service demand of farmers during the transition of agricultural economy. Especially in the case of rapid growth in the number of cooperatives triggered by government support. Cooperatives play an important role in the agricultural economic organization during the transition of agricultural economy in China. However, a variety of problems are emerging from the real process. An increasing number of negative views have concerned a severe test for the further development of cooperatives. As an intermediary for service supply, the function of cooperatives is in response to service demand of farmers. The demand-supply relation is prerequisite for testing the rationality of the cooperative. By combining the present situation of cooperatives, we analyzed the members’ characteristics, service demand of farmers and the service supply effect of cooperatives with the 785 respondents to illustrate the real conditions of cooperatives in China.
In this study, we explicitly focus on the members of cooperatives that have significant differences in personal and operational characteristics with MCA, including gender, age, earnings, cultivated land, and products. In planting production, middle-aged (26–40) males, especially those aged 31–40 years, or farmers (cultivated land of 2–20 ha or earnings of $2986.41–$29,864.12) have a stronger correlation with the members, and they are more likely to join the cooperative. Apart from that, farmers with local optimal crops are more willing to become members. In the case of service demand, the results of descriptive statistics show that there is a large service gap in agricultural production. The most obvious service demand is insufficient funds (33.6%) and technology problems (33.1%), followed by labor shortage (28.9%), land transaction (28.7%) and sale problems (28.5%). Further research about the effect of service supply in cooperatives implied that cooperatives have a positive effect on reducing the level of service demand for members. But this effect is only evident in sale (p = 0.084) and pest control and mechanization (p = 0.023). By combining the current state of service demand-supply, it can be concluded that the effectiveness of cooperatives in service supply is limited compared with massive service demand in China. In particular, it is found that farmers severely misunderstand cooperatives. The scruple caused by lack of knowledge of cooperatives leads to a weak sense of cooperation. The result is that nonmembers (66.4%) are more than members (33.6%) in the sample. The results of the study also confirm the hypothesis that there is a weak matching relationship between the current service supply of cooperatives and the service demand of farmers in China.
The conclusion reached in this paper is that cooperatives have a certain role in service supply. But the service supply effect of cooperatives is very limited compared with the service demand of farmers during the transition of China’s agricultural economy. It means that there is no positive relationship between the increase in the number of cooperatives supported by the government and the service supply effect of cooperative services. The cooperative can not effectively meet service demand of the farmers such as funds, technical, and labor. Although government support is an important means to promote the development of cooperatives, it will also weaken the necessary relationship between cooperatives and service demand of farmers, as well as the necessary relationship between cooperatives and service supply of cooperatives. The result of necessity weakening is that the service supply effect of cooperatives is insufficient, and the services most needed by farmers are not supplied by cooperatives. It leads to the contradiction between “quantity” and “quality”. Combined with the findings of this paper, the following suggestions on the development of cooperatives can be adopted by China. First of all, the government’s supervision of cooperatives that receive financial subsidies is essential. In the development of cooperatives, the government has the dual functions of support and supervision [64], which requires the government to build a supervision system to compatible with its support policies. Secondly, the direction of China’s government policy support should focus on issues such as finance and technology to solve the biggest gap in the service demand of farmers. Thirdly, the government should strengthen the cultivation of farmers’ cooperative consciousness.
The study also has its limitations. It is noted that this study is only for the planting and excludes breeding and other industries. Moreover, this paper fails to involve specific cooperative cases. In the investigation of service demand, we only provided two options—“yes” and “no”—and failed to investigate the degree of each service demand. The further research should focus on comparing the member characteristics in different industries, evaluating the factors that affect the effect of service supply in cooperatives, and introducing degree analysis on specific service demand.
Author Contributions
Conceptualization: X.W. and Y.D.; Methodology: X.W. and Y.D.; Data Analysis: X.W.; Original Draft Preparation: X.W.; Review & Editing: X.W. and Y.D.; Supervision: Y.D.
Funding
This research received no external funding.
Conflicts of Interest
The authors declare no conflicts of interest.
References
- Bretos, I.; Marcuello, C. Revisiting globalization challenges and opportunities in the development of cooperatives. Ann. Public Coop. Econ. 2017, 88, 47–73. [Google Scholar] [CrossRef]
- Song, Y.; Qi, G.; Zhang, Y.; Vernooy, R. Farmer cooperatives in China: Diverse pathways to sustainable rural development. Int. J. Agric. Sustain. 2014, 12, 95–108. [Google Scholar] [CrossRef]
- Hellin, J.; Lundy, M.; Meijer, M. Farmer organization, collective action and market access in Meso-America. Food Policy 2009, 34, 16–22. [Google Scholar] [CrossRef] [Green Version]
- Yang, H.; Klerkx, L.; Leeuwis, C. Functions and limitations of farmer cooperatives as innovation intermediaries: Findings from China. Agric. Syst. 2014, 127, 115–125. [Google Scholar] [CrossRef]
- Huang, Z.; Wu, B.; Xu, X.; Liang, Q. Situation features and governance structure of farmer cooperatives in China: Does initial situation matter? Soc. Sci. J. 2016, 53, 100–110. [Google Scholar] [CrossRef]
- Jia, X.; Huang, J.; Xu, Z. Marketing of farmer professional cooperatives in the wave of transformed agrofood market in China. China Econ. Rev. 2012, 23, 665–674. [Google Scholar] [CrossRef]
- Liang, Q.; Huang, Z.; Lu, H.; Wang, X. Social capital, member participation, and cooperative performance: Evidence from China’s Zhejiang. Int. Food Agribus. Manag. Rev. 2015, 18, 49–78. [Google Scholar]
- Giagnocavo, C.; Bienvenido, F.; Li, M.; Zhao, Y.; Sanchez-Molina, J.A.; Yang, X. Agricultural cooperatives and the role of organisational models in new intelligent traceability systems and big data analysis. Int. J. Agric. Biol. Eng. 2017, 10, 115–125. [Google Scholar] [CrossRef]
- Ji, C.; Jia, F.; Trienekens, J. Managing the pork supply chain through a cooperative: The case of Jinzhong Food Co. Ltd. Int. Food Agribus. Manag. Rev. 2017, 20, 415–426. [Google Scholar] [CrossRef]
- Zhang, M.; Jin, Y.; Qiao, H.; Zheng, F. Product quality asymmetry and food safety: Investigating the “one farm household, two production systems” of fruit and vegetable farmers in China. China Econ. Rev. 2017, 45, 232–243. [Google Scholar] [CrossRef]
- Ma, W.; Abdulai, A. The economic impacts of agricultural cooperatives on smallholder farmers in rural China. Agribusiness 2017, 33, 537–551. [Google Scholar] [CrossRef]
- Huang, Z.; Liang, Q. Agricultural organizations and the role of farmer cooperatives in China since 1978: Past and future. China Agric. Econ. Rev. 2018, 10, 48–64. [Google Scholar] [CrossRef]
- Deng, H.; Huang, J.; Xu, Z.; Rozelle, S. Policy support and emerging farmer professional cooperatives in rural China. China Econ. Rev. 2010, 21, 495–507. [Google Scholar] [CrossRef]
- Garnevska, E.; Liu, G.; Shadbolt, N.M. Factors for successful development of farmer cooperatives in Northwest China. Int. Food Agribus. Manag. Rev. 2011, 14, 69–84. [Google Scholar]
- Zhao, L.; Wang, C.; Gu, H.; Yue, C. Market incentive, government regulation and the behavior of pesticide application of vegetable farmers in China. Food Control 2018, 85, 308–317. [Google Scholar] [CrossRef]
- Yu, B.; Liu, F.; You, L. Dynamic agricultural supply response under economic transformation: A case study of Henan, China. Am. J. Agric. Econ. 2011, 94, 370–376. [Google Scholar] [CrossRef]
- Long, H.; Zou, J.; Pykett, J.; Li, Y. Analysis of rural transformation development in China since the turn of the new millennium. Appl. Geogr. 2011, 31, 1094–1105. [Google Scholar] [CrossRef]
- Qin, Y.; Zhang, X. The road to specialization in agricultural production: Evidence from rural China. World Dev. 2016, 77, 1–16. [Google Scholar] [CrossRef]
- Huang, J.; Ding, J. Institutional innovation and policy support to facilitate small-scale farming transformation in China. Agric. Econ. 2016, 47, 227–237. [Google Scholar] [CrossRef]
- Hu, Z.; Zhang, Q.F.; Donaldson, J.A. Farmers’ cooperatives in China: A typology of fraud and failure. China J. 2017, 78, 1–24. [Google Scholar] [CrossRef]
- Liang, Q.; Hendrikse, G.; Huang, Z.; Xu, X. Governance structure of Chinese farmer cooperatives: Evidence from Zhejiang Province. Agribusiness 2015, 31, 198–214. [Google Scholar] [CrossRef]
- Pan, J. Specialized farmers’ cooperatives in China: The interpretation of the data of their development. China Rural Surv. 2011, 6, 2–11. [Google Scholar]
- Zhao, L.; Develtere, P. New co-operatives in China: Why they break away from orthodox co-operatives? Soc. Enterp. J. 2010, 6, 35–48. [Google Scholar] [CrossRef]
- Zhang, Y.; Ren, D. Discuss on the standardization of farmer cooperatives: From the reality and falsity identification of farmer cooperatives. Issues Agric. Econ. 2010, 4, 41–45. [Google Scholar]
- Candelo, E.; Casalegno, C.; Civera, C.; Mosca, F. Turning farmers into business partners through value co-creation projects: Insights from the coffee supply chain. Sustainability 2018, 10, 1018. [Google Scholar] [CrossRef]
- Zhu, Q.; Wachenheim, C.J.; Ma, Z.; Zhu, C. Supply chain re-engineering: A case study of the Tonghui agricultural cooperative in inner Mongolia. Int. Food Agribus. Manag. Rev. 2018, 21, 133–160. [Google Scholar] [CrossRef]
- Li, Y.; Wang, J.; Liu, Y.; Long, H. Problem regions and regional problems of socioeconomic development in China: A perspective from the coordinated development of industrialization, informatization, urbanization and agricultural modernization. J. Geogr. Sci. 2014, 24, 1115–1130. [Google Scholar] [CrossRef]
- Deng, F.; Liu, C.; Liang, X. Measurement of regional agricultural sustainable development system based on dissipative structure theory: A case study in Sichuan province, China. Sustainability 2017, 9, 2047. [Google Scholar] [CrossRef]
- Kibwika, P.; Wals, A.E.J.; Nassuna-Musoke, M.G. Competence challenges of demand-led agricultural research and extension in Uganda. J. Agric. Educ. Ext. 2009, 15, 5–19. [Google Scholar] [CrossRef]
- Iliopoulos, C.; Valentinov, V. Member heterogeneity in agricultural cooperatives: A systems-theoretic perspective. Sustainability 2018, 10, 1271. [Google Scholar] [CrossRef]
- Asfaw, S.; Kassie, M.; Simtowe, F.; Lipper, L. Poverty reduction effects of agricultural technology adoption: A micro-evidence from rural Tanzania. J. Dev. Stud. 2012, 48, 1288–1305. [Google Scholar] [CrossRef]
- Kuehne, G. My decision to sell the family farm. Agric. Hum. Values 2013, 30, 203–213. [Google Scholar] [CrossRef]
- Abdulquadri, A.F.; Mohammed, B.T. The role of agricultural cooperatives in agricultural mechanization in Nigeria. J. Agric. Sci. 2012, 8, 537–539. [Google Scholar]
- Bharadwaj, B. Roles of cooperatives in poverty reduction: A case of Nepal. Adm. Manag. Rev. 2012, 24, 120–139. [Google Scholar]
- Zhong, Z.; Zhang, C.; Jia, F.; Bijman, J. Vertical coordination and cooperative member benefits: Case studies of four dairy farmers’ cooperatives in China. J. Clean. Prod. 2018, 172, 2266–2277. [Google Scholar] [CrossRef]
- Novkovic, S. Defining the co-operative difference. J. Socio-Econ. 2008, 37, 2168–2177. [Google Scholar] [CrossRef]
- Helmberger, P.; Hoos, S. Cooperative enterprise and organization theory. J. Farm Econ. 1962, 44, 275–290. [Google Scholar] [CrossRef]
- Bijman, J.; Hendrikse, G. Organisational efficiency in the fresh produce chain-the role of the marketing co-operative. In Paradoxes in Food Chains and Networks; Wageningen Academic Publishers: Wageningen, The Netherlands, 2002; pp. 568–576. [Google Scholar]
- Fulton, M. The future of Canadian agricultural cooperatives: A property rights approach. Am. J. Agric. Econ. 1995, 77, 1144–1152. [Google Scholar] [CrossRef]
- Bijman, W.J.; Hendrikse, G.; Veerman, C. A Marketing Co-Operative as a System of Attribute; Social Science Electronic Publishing: New York, NY, USA, 2000. [Google Scholar]
- Borgen, S.O. Rethinking incentive problems in cooperative organizations. J. Socio-Econ. 2004, 33, 383–393. [Google Scholar] [CrossRef]
- Bijman, J.; Hendrikse, G. Co-operatives in chains: Institutional restructuring in the Dutch fruit and vegetable industry. J. Chain Netw. Sci. 2003, 3, 95–107. [Google Scholar] [CrossRef]
- Ollila, P.; Nilsson, J. The position of agricultural cooperatives in the changing food industry of Europe. In Strategies and Structures in the Agro-Food Industries; Van Gorcum: Assen, The Netherlands, 1997; pp. 131–150. [Google Scholar]
- Tang, Z. Cooperatives function with socialist market economy. Econ. Res. J. 2007, 12, 11–23. [Google Scholar]
- Jayne, T.S.; Zulu, B.; Nijhoff, J.J. Stabilizing food markets in eastern and southern Africa. Food Policy 2006, 31, 328–341. [Google Scholar] [CrossRef]
- Li, Y.; Gao, J. Empirical research on the developmental status of farmer cooperatives’ function. Asian Agric. Res. 2011, 3, 105–108. [Google Scholar]
- Royer, J. Financing agricultural cooperatives with retained earnings. Agric. Financ. Rev. 2017, 77, 393–411. [Google Scholar] [CrossRef]
- Valentinov, V.; Iliopoulos, C. Economic theories of nonprofits and agricultural cooperatives compared: New perspectives for nonprofit scholars. Nonprofit Volunt. Sect. Q. 2013, 42, 109–126. [Google Scholar] [CrossRef]
- Chen, A.; Scott, S. Rural development strategies and government roles in the development of farmers’ cooperatives in China. J. Agric. Food Syst. Community Dev. 2014, 4, 35–55. [Google Scholar] [CrossRef]
- Hoken, H.; Sato, H. Economic analysis on farmers’ professional cooperatives in China: Evidence from CHIP 2002 rural household survey. Econ. Rev. 2016, 67, 1–16. [Google Scholar]
- Smith, A. An Inquiry into the nature and the causes of the wealth of nations. In Readings in Economic Sociology; John Wiley & Sons: Hoboken, NJ, USA, 1976; pp. 6–17. [Google Scholar]
- Shi, H.; Yang, X. A new theory of industrialization. J. Comp. Econ. 2014, 20, 171–189. [Google Scholar] [CrossRef]
- Hansmann, H. Cooperative firms in theory and practice. LTA 1999, 48, 387–403. [Google Scholar]
- Zhou, J.; Yan, Z.; Li, K. Understanding farmer cooperatives’ self-inspection behavior to guarantee agri-product safety in China. Food Control 2016, 59, 320–327. [Google Scholar] [CrossRef]
- Iliopoulos, C.N.; Valentinov, V.L. Opportunism in Agricultural Cooperatives in Greece. Outlook Agric. 2013, 41, 15–19. [Google Scholar] [CrossRef]
- Mulgan, A.G. Loosening the ties that bind: Japan’s agricultural policy triangle and reform of cooperatives. J. Jpn. Stud. 2016, 42, 221–246. [Google Scholar] [CrossRef]
- Cui, Y.H.; Yin, F.; Yang, Y.L.; Zhang, W.D.; et al. Development review and experience references of agricultural cooperative organizations in the United States and Holland. Modern Agric. Sci. Technol. 2016, 22, 263–265. [Google Scholar]
- Bates, R.H. Markets and States in Tropical Africa: The Political Basis of Agricultural Policies; University of California Press: Berkeley, CA, USA, 2014. [Google Scholar]
- Cai, R.; Ma, W.; Su, Y. Effects of member size and selective incentives of agricultural cooperatives on product quality. Br. Food J. 2016, 118, 858–870. [Google Scholar] [CrossRef]
- Butcher, B.; Xu, Y. Chinese tax policy and the promotion of agricultural cooperatives and environmental protection. Aust. Tax Forum 2016, 31, 649. [Google Scholar]
- Bernard, T.; Spielman, D.J. Reaching the rural poor through rural producer organizations? A study of agricultural marketing cooperatives in Ethiopia. Food Policy 2009, 34, 60–69. [Google Scholar] [CrossRef]
- Ito, J.; Bao, Z.; Su, Q. Distributional effects of agricultural cooperatives in China: Exclusion of smallholders and potential gains on participation. Food Policy 2012, 36, 700–709. [Google Scholar] [CrossRef]
- Zheng, S.; Wang, Z.; Awokuse, T.O. Determinants of producers’ participation in agricultural cooperatives: Evidence from northern China. Appl. Econ. Perspect. Policy 2012, 34, 167–186. [Google Scholar] [CrossRef]
- Douvitsa, I. Supervision and audit of the Greek agricultural cooperatives: A Critical approach on legislation. Eur. Bus. Law Rev. 2018, 29, 77–101. [Google Scholar]
Figure 1.
The analytical framework for service demand and service supply.

Figure 2.
The MCA map of participation-personal characteristics.

Figure 3.
The MCA map of participation-operational characteristics.

Figure 4.
The reasons for not joining cooperatives.

Figure 5.
Types of difficulties for service demand among farmers.

Figure 6.
The proportion of members and nonmembers in service demand.


Table 1.
The service demand category of farmers.
| Demand Category | Category Subdivision | Concrete Content |
|---|---|---|
| Demand for production | Supply demand | Variety planning |
| Production materials | ||
| Production demand | Technical guidance | |
| Production management | ||
| Processing demand | Primary processing | |
| Deep processing | ||
| Sales demand | Storage and transportation | |
| Channel marketing | ||
| Demand for others | Financial demand | Capital loan |
| Investment and financing | ||
| Other demand | Subsidized distribution | |
| Daily life |
Table 2.
Personal characteristics of the investigated sample from respondents.
| Characteristic | Category | Frequency | Relative Frequency |
|---|---|---|---|
| Gender | Male | 389 | 49.6 |
| Female | 396 | 50.4 | |
| Age | 18–25 | 180 | 22.9 |
| 26–30 | 207 | 26.4 | |
| 31–40 | 249 | 31.7 | |
| 41–50 | 116 | 14.8 | |
| 51–60 | 30 | 3.8 | |
| >61 | 3 | 0.4 |
Source: Own Calculations.
Table 3.
Operational characteristics of the investigated sample from respondents.
| Characteristic | Category | Frequency | Relative Frequency |
|---|---|---|---|
| Cultivated land | <2 ha | 369 | 47.0 |
| 2–4 ha | 200 | 25.5 | |
| 5–10 ha | 124 | 15.8 | |
| 11–15 ha | 49 | 6.2 | |
| 16–20 ha | 30 | 3.8 | |
| >21 ha | 13 | 1.7 | |
| Agricultural earnings | <2986.41 | 362 | 46.1 |
| 2986.41–7466.03 | 219 | 27.9 | |
| 8959.24–14,932.06 | 117 | 14.9 | |
| 16,425.27–22,398.09 | 45 | 5.7 | |
| 23,891.29–29,864.12 | 20 | 2.5 | |
| >31,357.32 | 22 | 2.8 | |
| Products | Rice | 355 | 45.2 |
| Corn | 298 | 38.0 | |
| Soya | 104 | 13.2 | |
| Other | 28 | 3.6 |
Source: Own Calculations.
Table 4.
The crosstab of participation * personal characteristics.
| Gender | Age | |||||||
|---|---|---|---|---|---|---|---|---|
| Male | Female | 18–25 | 26–30 | 31–40 | 41–50 | 51–60 | >60 | |
| Members | 142 | 122 | 45 | 74 | 95 | 41 | 8 | 1 |
| % of members | 53.8 | 46.2 | 17.0 | 28.0 | 36.0 | 15.5 | 3.0 | 0.4 |
| Non-member | 247 | 274 | 135 | 133 | 154 | 75 | 22 | 2 |
| % of nonmembers | 47.4 | 52.6 | 25.9 | 25.5 | 29.6 | 14.4 | 4.2 | 0.4 |
Table 5.
The crosstab of participation * operational characteristics.
| Cultivated Land (ha) | Earnings | Crop Variety | ||||||||||||||
|---|---|---|---|---|---|---|---|---|---|---|---|---|---|---|---|---|
| <2 | 2–4 | 5–10 | 11–15 | 16–20 | >21 | 1 | 2 | 3 | 4 | 5 | 6 | R | C | S | O | |
| M | 97 | 82 | 54 | 19 | 11 | 1 | 91 | 85 | 52 | 19 | 11 | 6 | 143 | 83 | 37 | 1 |
| % | 36.7 | 31.1 | 20.5 | 7.2 | 4.2 | 0.4 | 34.5 | 32.2 | 19.7 | 7.2 | 4.2 | 2.3 | 54.2 | 31.4 | 14.0 | 0.4 |
| N-m | 272 | 118 | 70 | 30 | 19 | 12 | 271 | 134 | 65 | 26 | 9 | 16 | 212 | 215 | 67 | 27 |
| % | 52.2 | 22.6 | 13.4 | 5.8 | 3.6 | 2.3 | 52.0 | 25.7 | 12.5 | 5.0 | 1.7 | 3.1 | 40.7 | 41.3 | 12.9 | 5.2 |
Table 6.
Model summary.
| Dimension | Eigenvalue | Proportion Explained | Cumulative Proportion | |
|---|---|---|---|---|
| Personal characteristics | 1 | 1.118 | 37.3% | 37.3% |
| 2 | 1.086 | 36.2% | 73.5% | |
| Operational characteristics | 1 | 1.678 | 42.0% | 42% |
| 2 | 1.358 | 33.9% | 75.9% |
Table 7.
The related questions of service demand.
| Category | Content | Answer |
|---|---|---|
| Specialized Service Demand | Do you have difficulties in pest control and mechanization? | Yes assigns 1 No assigns 0 |
| Do you have difficulties in means of production? | ||
| Do you have difficulties in land transaction? | ||
| Do you have difficulties in labor? | ||
| Do you have difficulties in sale? | ||
| Comprehensive Service Demand | Do you have difficulties in funds? | |
| Do you have difficulties in market information? | ||
| Do you have difficulties in technology? |
Table 8.
The crosstab of participation * service demand degrees.
| High Degree | Medium Degree | Low Degree | Total | |
|---|---|---|---|---|
| Members | 4 | 142 | 118 | 264 |
| % of members | 1.5 | 53.8 | 44.7 | 100 |
| Nonmembers | 23 | 243 | 255 | 521 |
| % of nonmembers | 4.4 | 46.6 | 48.9 | 100 |
Table 9.
The table of the statistics for the evaluation of dependency-chi-square tests.
| Value | Degrees of Freedom | Asymp. Sig. (2-Sided) | |
|---|---|---|---|
| Pearson Chi-Square | 6.773 a | 2 | 0.034 |
| Likelihood Ratio | 7.393 | 2 | 0.025 |
| Linear-by-Linear | 0.101 | 1 | 0.751 |
| N of Valid Cases | 785 |
a 0 cells (0%) have the expected count of less than 5. The minimum expected count is 9.08.
Table 10.
The chi-square test on 8 service demands.
| Factors | p-Value |
|---|---|
| Insufficient funds | 0.581 |
| Technical problems | 0.568 |
| Labor shortage | 0.469 |
| Land transaction | 0.164 |
| Sale difficulties | 0.084 |
| Market information | 0.692 |
| Pest control and mechanization | 0.023 |
| Means of production | 0.550 |
© 2018 by the authors. Licensee MDPI, Basel, Switzerland. This article is an open access article distributed under the terms and conditions of the Creative Commons Attribution (CC BY) license (http://creativecommons.org/licenses/by/4.0/).
Share and Cite
MDPI and ACS Style
Wu, X.; Ding, Y. The Service Supply Effect of Cooperatives under Economic Transformation: A Demand-Supply Perspective. Sustainability 2018, 10, 3075. https://doi.org/10.3390/su10093075
AMA Style
Wu X, Ding Y. The Service Supply Effect of Cooperatives under Economic Transformation: A Demand-Supply Perspective. Sustainability. 2018; 10(9):3075. https://doi.org/10.3390/su10093075
Chicago/Turabian StyleWu, Xiangyu, and Yunlong Ding. 2018. "The Service Supply Effect of Cooperatives under Economic Transformation: A Demand-Supply Perspective" Sustainability 10, no. 9: 3075. https://doi.org/10.3390/su10093075
Note that from the first issue of 2016, this journal uses article numbers instead of page numbers. See further details here.