Article

A Risk Analysis of Precision Agriculture Technology to Manage Tomato Late Blight

1
Department of Agricultural and Applied Economics, University of Georgia, Tifton, GA 31793, USA
2
Department of Agricultural Economics, Purdue University, West Lafayette, IN 47907, USA
3
North Florida Research and Education Center, University of Florida, Quincy, FL 32351, USA
4
Department of Plant Pathology and Plant-Microbe Biology, Cornell University, Ithaca, NY 14853, USA
5
Department of Entomology and Plant Pathology, North Carolina State University, Raleigh, NC 27695, USA
6
Department of Agricultural and Consumer Economics, University of Illinois at Urbana-Champaign, Urbana, IL 61801, USA
*
Author to whom correspondence should be addressed.
Sustainability 2018, 10(9), 3108; https://doi.org/10.3390/su10093108
Submission received: 24 July 2018 / Revised: 28 August 2018 / Accepted: 29 August 2018 / Published: 31 August 2018

Abstract

:
Precision agriculture technology can transform farming related data into useful information, which may lead to more efficient usage of agricultural resources and increase sustainability. This paper compares precision agriculture technology with traditional practices in scheduling fungicide application so as to manage late blight disease in tomato production. The following three fungicide scheduling strategies were evaluated: a calendar-based strategy, the BlightPro Decision Support System based strategy (DSS-based strategy), and a strategy that does not involve fungicide application. The data from field trials and computer simulation experiments were used to construct distributions of the net return per acre for the calendar-based and the DSS-based strategies. These distributions were then compared using three standard approaches to ranking risky alternatives, namely: stochastic dominance, stochastic dominance with respect to a function, and stochastic efficiency with respect to a function. Assuming no yield differences between the calendar-based and the DSS-based strategies, the calendar-based strategy was preferred for highly late blight susceptible cultivars, and the DSS-based strategy was preferred for moderately susceptible and moderately resistant cultivars. Assuming no yield differences, the value of the BlightPro Decision Support System ranged from −$28 to $48 per acre. With the yield improvement for the DSS-based strategy included, the DSS-based strategy was preferred for the cultivars in all of the disease-resistance categories with the value ranging from $496 to $1714 per acre.

1. Introduction

To solve global food challenges, both agricultural efficiency and productivity need to be improved. The development of precision agriculture technology is one of the most promising ways to raise farming efficiency and achieve environmental, social, and economic sustainability [1]. The major focus of precision agriculture in the United States has been on corn, soybeans, and other major cereal crops. High value vegetable crops have historically received less attention in this area [2]. Unlike cereal crops, even a minor disease outbreak can negatively impact the yield and profitability for high value vegetable crops. Thus, producers must vigilantly monitor pests and diseases to mitigate production and financial risks. This research evaluates the economic benefits of a weather-related precision agriculture technology designed for managing late blight disease in tomato and potato production. Economic studies of precision agriculture technology can reveal the advantages and potential barriers for adoption [3].
Late blight disease, caused by Phytophthora infestans (Mont.) de Bary, is a highly economically damaging pathogen for tomatoes and potatoes. The pathogen is easily dispersed and the disease can spread rapidly [4]. The development of the disease is heavily influenced by the weather, with humid and cool (16–21 °C) climates stimulating disease development [5,6,7]. However, growers have difficulty recognizing the subtle relationships between the weather and the threat of disease outbreak. Without access to relevant and timely information regarding the danger of an outbreak, growers cannot make informed late blight management decisions. As a result, tomato production is subject to significant potential production losses, as a result of late blight disease. Meanwhile, the United States produced 13 million tons of tomatoes in 2016, making it the world’s third largest producer of tomatoes after China and India [8]. Tomato production contributes more than $2 billion in farm income in the United States [9]. Tomato growers typically manage late blight disease using preventative fungicide applications on a regular calendar basis (e.g., weekly) throughout the growing season. These preventative applications cover the crop with fungicide, providing protection from the disease. However, this application method applies fungicide independent of weather and late blight infection risks. As a result, this application method might cause an inefficient use of fungicide, which is neither environmentally nor economically sustainable.
To improve late blight management, various decision support systems and late blight forecast systems have been developed [5,10,11,12]. The BlightPro Decision Support System (hereafter referred to as simply BlightPro), developed by researchers at Cornell University, transforms local weather data into useful information for guiding decision-making in fungicide applications [11]. BlightPro recommends timely fungicide applications for potato and tomato, taking into account local weather conditions, the characteristics of the late blight pathogen, the host plants’ susceptibility to late blight, and the fungicide efficacy [11]. Small et al. [13] examined the usage of BlightPro for potato production, concluding that the DSS-based strategy maintained or improved disease suppression and fungicide use efficiency, relative to a calendar-based strategy. Liu et al. [14] further examined the impacts of BlightPro on potato yield, fungicide cost, revenue, and risk-adjusted net return. They found that, in addition to improving the input usage efficiency, BlightPro can also boost productivity, increase profitability, and reduce the variability of income and profit for potato production [14]. By reducing the overall number and improving the timing of fungicide applications, BlightPro results in more sustainable potato production. However, the economic effects of BlightPro on tomato production still remain an open question.
This research examines the impacts of the adoption of BlightPro, relative to a calendar-based strategy, on the net return and risk for tomato growers. The risks considered are the impact on profitability associated with weather conditions, yields, and input and output prices for tomato. These analyses use two datasets, including tomato field trial data and computer simulation experiments data. The tomato field trial data is conducted in North Carolina, and computer simulation experiments have been simulated for 14 years in 25 locations in New York and North Carolina. We constructed the distributions of the net return per acre, which is the gross revenue minus the costs of fungicide and its application, for the calendar-based and DSS-based strategies at each location. The other costs of growing tomatoes are assumed not to vary with the weather in late blight incidence and among the different management strategies. These distributions are compared using three risk management methods, namely: stochastic dominance, stochastic dominance with respect to a function, and stochastic efficiency with respect to a function. The objective of this research is to identify the risk-efficient strategies between BlightPro recommended late blight disease management strategy, and the traditional, calendar-based disease management strategy for tomato production. More specifically, this research evaluates the economic benefits of BlightPro for tomato growers.

2. Materials and Methods

2.1. BlightPro Decision Support System and Field Trial Evaluation

BlightPro is an internet-based application available on the USAblight website (http://usablight.org). It was developed provide crop protection strategies in order to manage late blight disease for tomato and potato crops throughout the growing season [11,13]. BlightPro recommends precise, timely fungicide applications in response to weather conditions, late blight pathogen type, host resistance, and fungicide characteristics and efficacy. It accesses weather data from the nearest weather station for a given field, and uses the current and forecasted weather information as an input to a late blight disease simulator and disease forecasting tools. BlightPro uses a specific disease severity index to trigger a fungicide application recommendation. The same index and trigger value is used for tomato and potato crops. An alert system notifies the user of impending critical thresholds for fungicide intervention via text or e-mail, when weather conditions are conducive for the development of late blight.
Tomato field trials were conducted in 2015 at the Mountain Horticultural Crops Research and Extension Center in Mills River, North Carolina. The trials were designed to evaluate the performance of BlightPro in managing tomato late blight disease. The data collected included the disease severity, the timing of applications, number of fungicide applications, and tomato yields for two tomato cultivars, with one susceptible cultivar (Mountain Fresh Plus) and one moderately resistant cultivar (Legend) to late blight. The trials used four replications in a randomized complete block design with split plots to accommodate the two cultivars used (see Figure 1). Three treatments were used, namely: the calendar-based strategy (seven-day spray schedule), DSS-based strategy (BlightPro Decision Support System based strategy), and unsprayed control (no fungicide application). Each plot was 20′ long and 25′ wide, and was composed of two experimental rows bordered on both sides by one untreated ‘guard’ row to prevent fungicide drift. An additional guard row was included between the two cultivars of each plot. Ten feet separated the two experimental rows within a plot, and fifteen feet separated the experimental rows between each plot. Each experimental row contained 14 plants, at 18″ spacing in raised beds, covered with 1.5 millimeter polyethylene black plastic.
Four-week-old tomato seedlings were transplanted into fumigated soil on 9 June and a protectant fungicide with an active ingredient, chlorothalonil, was sprayed at starting on 12 June. Because of a miscommunication, both Mountain Fresh Plus and Legend were sprayed according to the BlightPro recommendations for Mountain Fresh Plus until late in the season. For this reason, the results for the Legend are not discussed in this paper, and all of the results are for Mountain Fresh Plus.
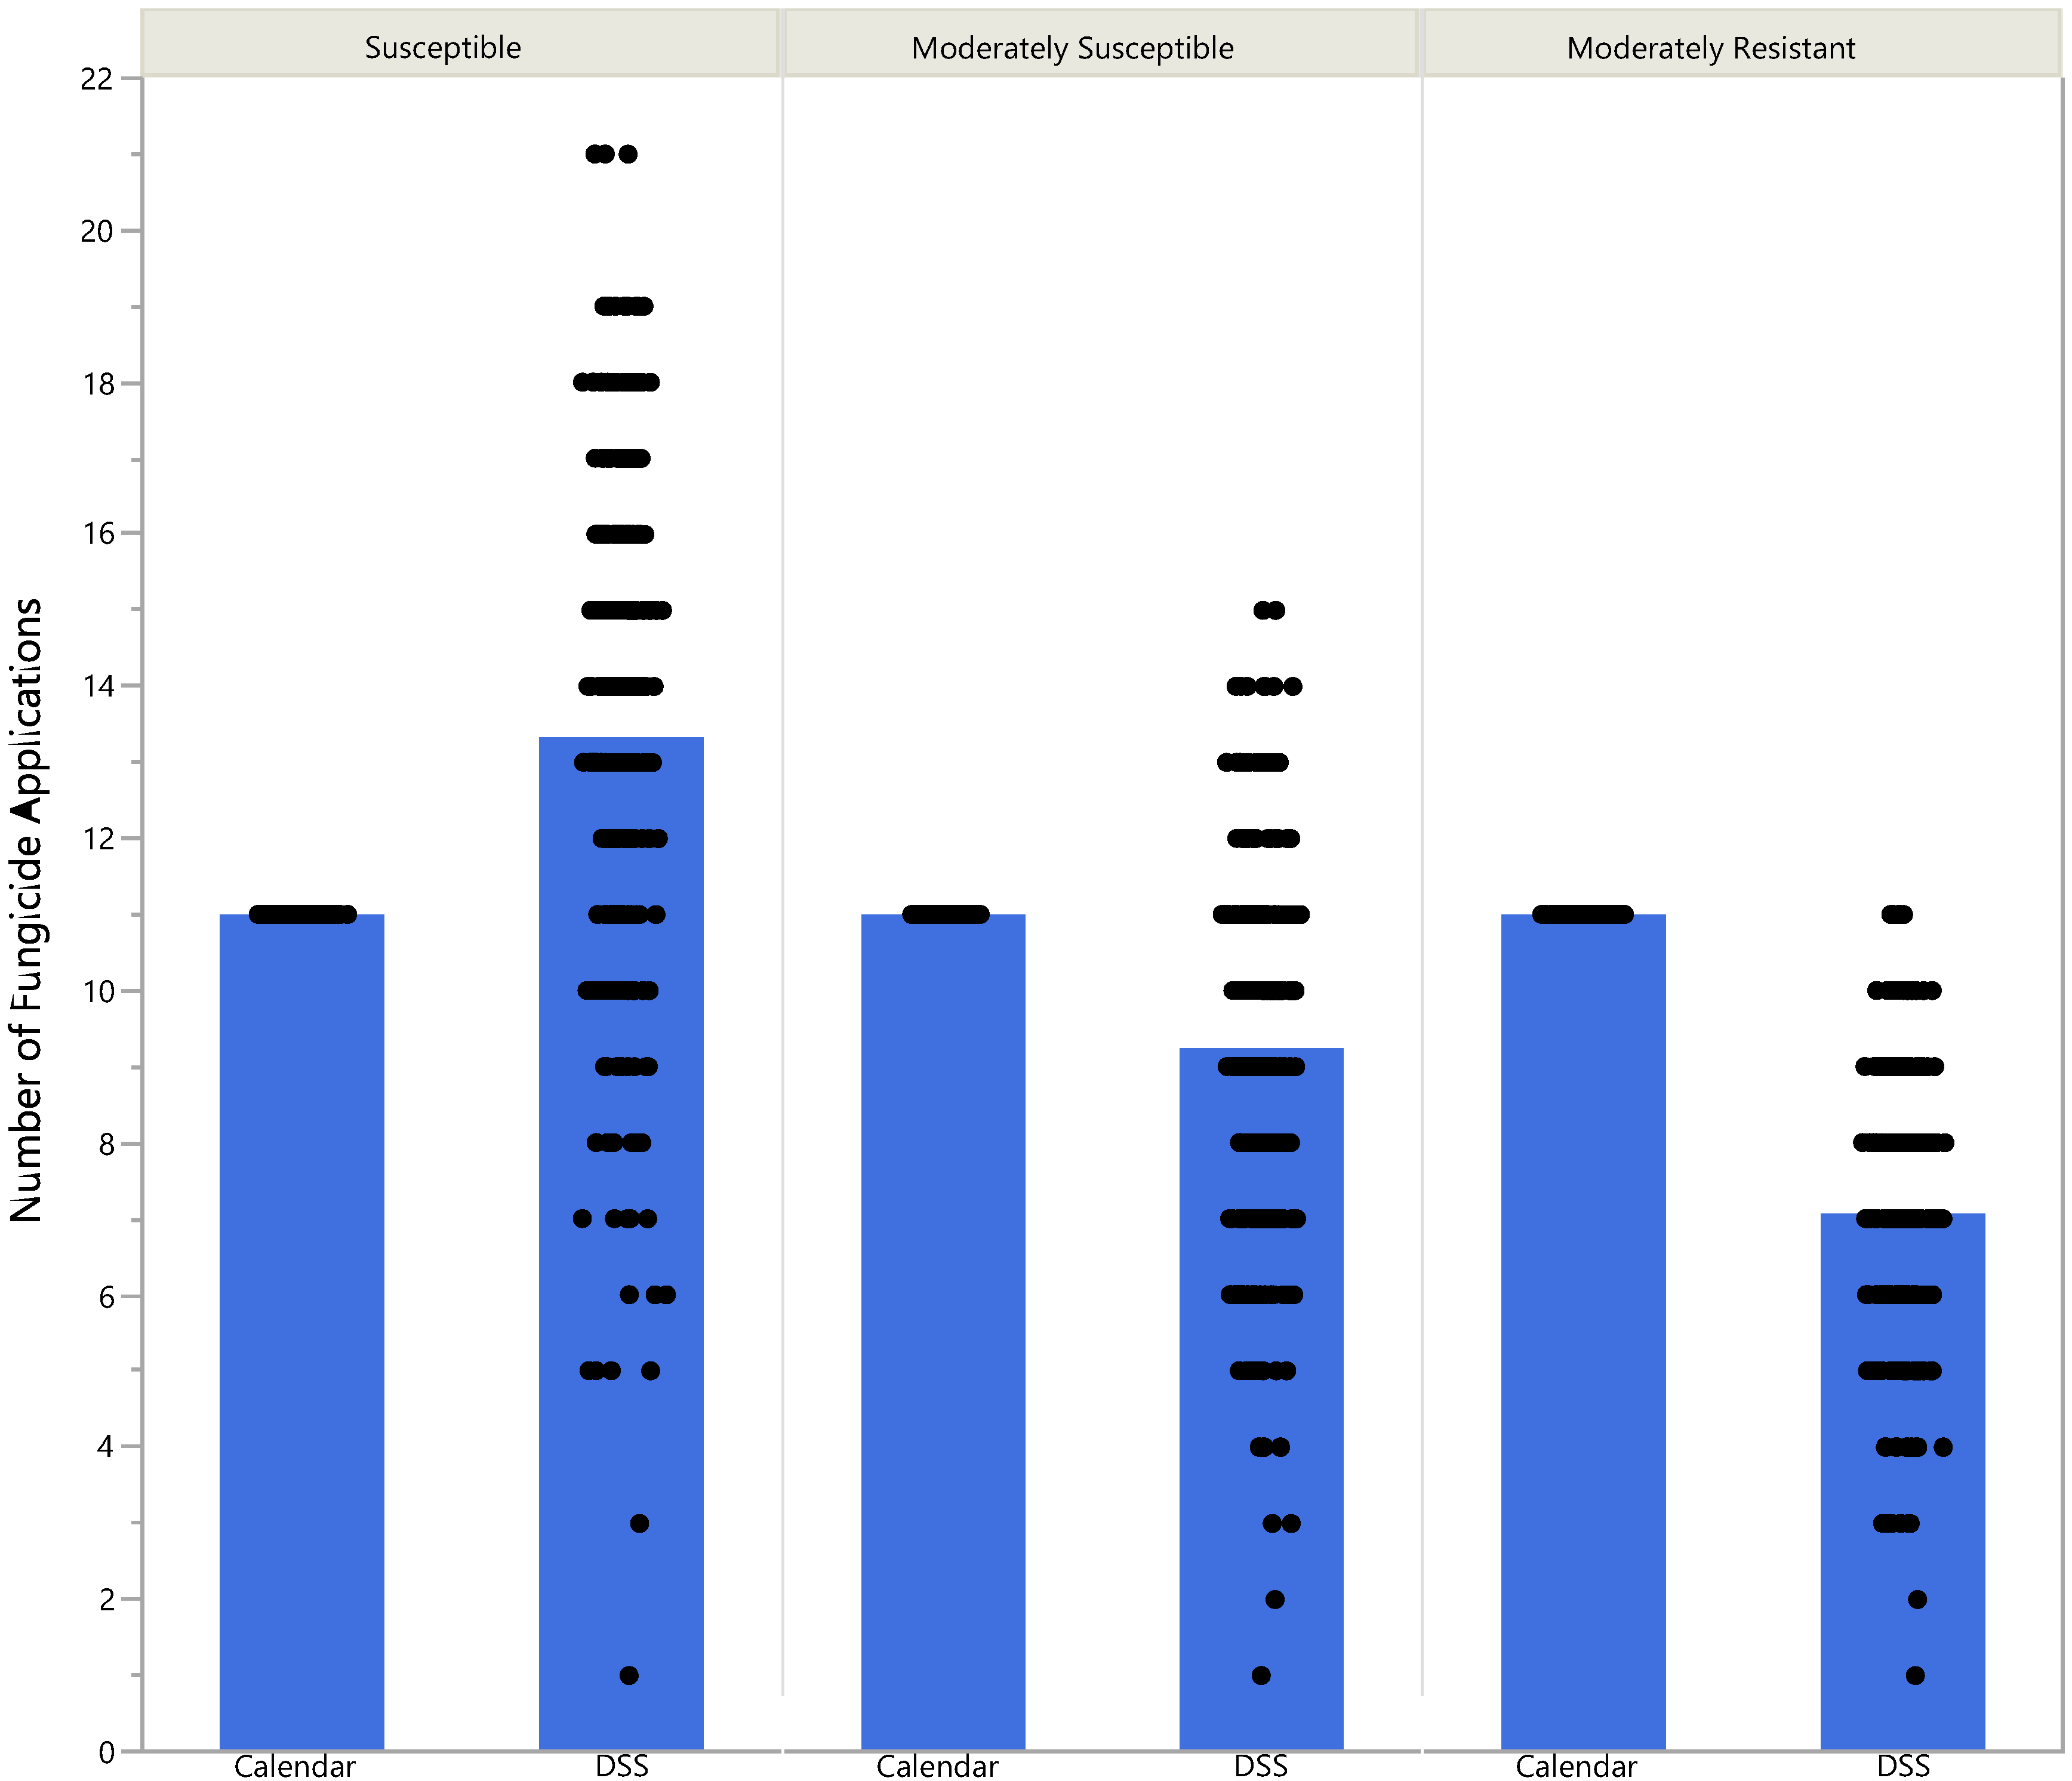
Thirteen foliar applications were made to the calendar-based strategy. Eleven foliar applications were made under the DSS-based strategy. The plots were harvested three times during the season and the total culled tomatoes and marketable tomatoes were measured by weight. One treatment (replicate II) for the calendar-based strategy was incorrectly planted with the wrong cultivar, and the associated data was disregarded for the trial and this analysis. In addition, multiple plants were removed because of bacterial wilt, and the harvest calculations (i.e., weight of culled and marketable tomatoes per acre) were adjusted accordingly.
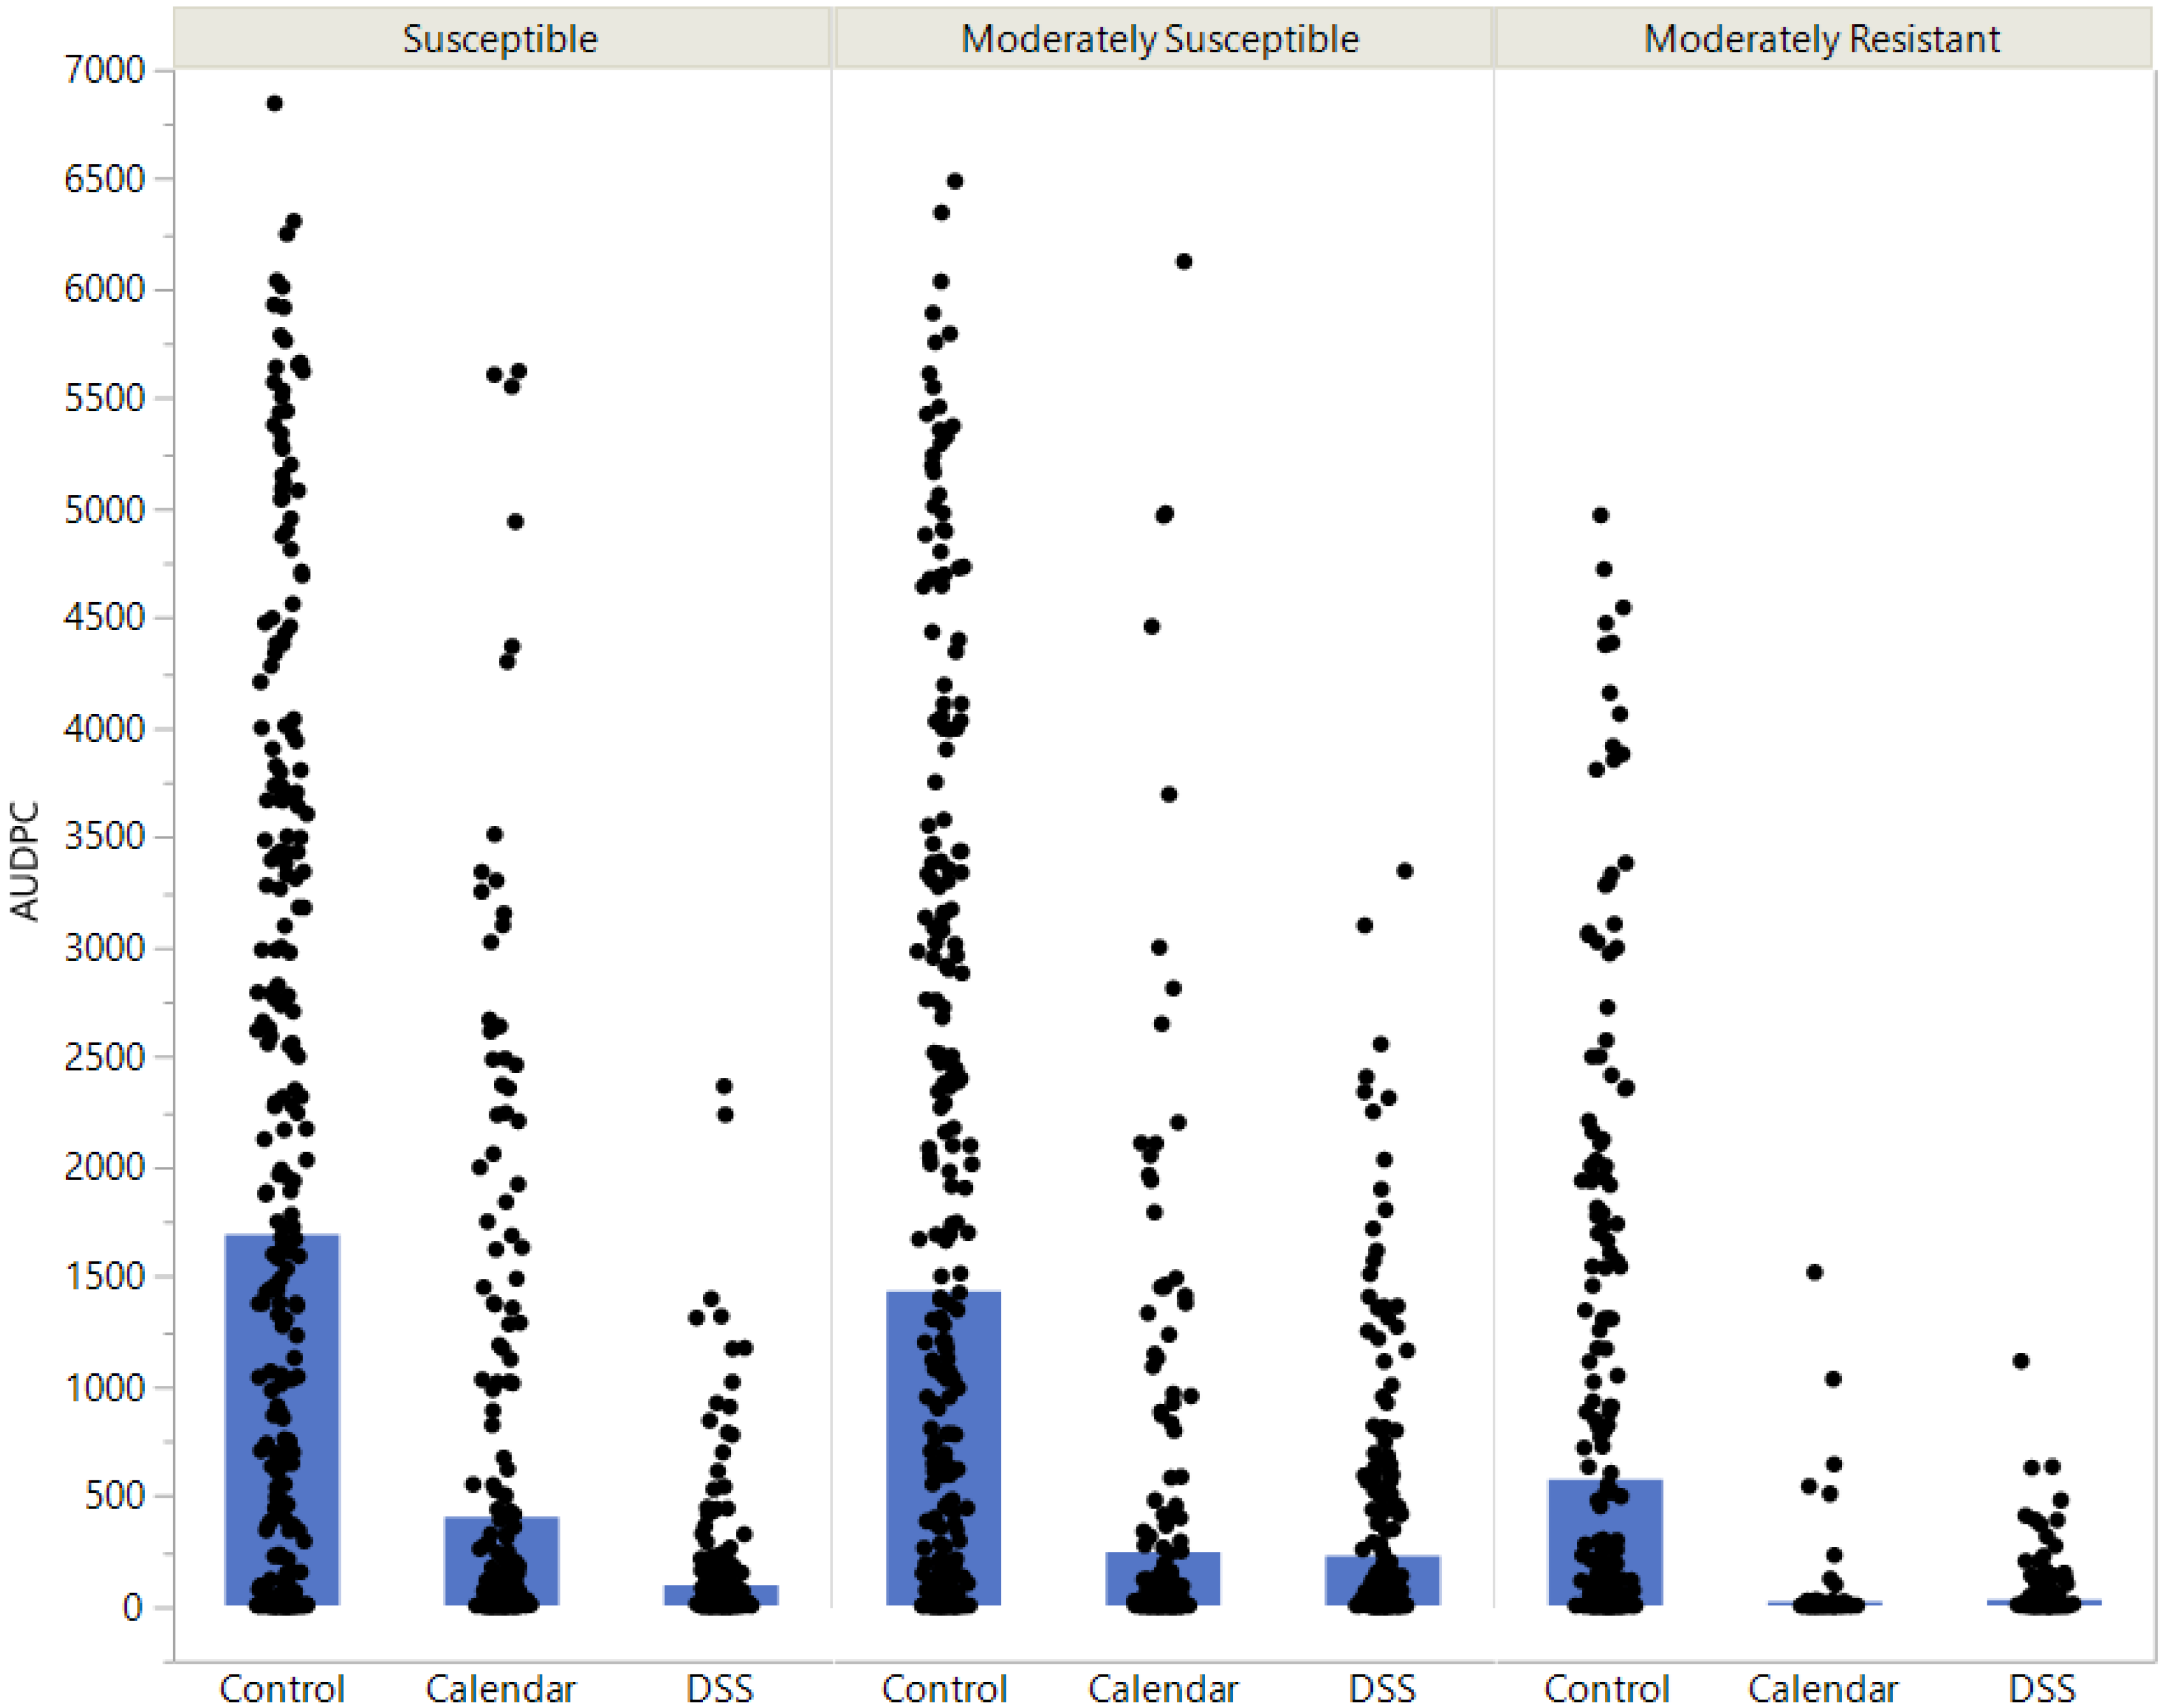
Table 1 summarizes the area under the disease progress curve (AUDPC, a quantitative summary of disease severity of late blight over time), marketable weight, cull weight, and the total weight for the susceptible cultivar (Mountain Fresh Plus). The results show that using the DSS-based strategy improved the marketable tomato weight by 14.8% in 2015 for the susceptible cultivar (Mountain Fresh Plus), relative to the calendar-based strategy. These marketable weight data were used as a guide to motivate the sensitivity analysis with respect to tomato yields when conducting economic analyses. Ideally, a model that links the disease severity, weather conditions, and yield should be used to predict the tomato yield or tomato yield reductions. However, no such model exists in the literature. The interaction among several factors influencing the tomato yield increases the complexity in developing such a model. These factors include the influence of weather, the impact of disease severity, and the input usage on the tomato yield. To compensate for the fact that no such model exists, we conducted a sensitivity analysis for the tomato yield so as to examine the economic benefits of BlightPro for tomato growers. The sensitivity analysis assumed that the DSS-based strategy would improve the tomato yield by 0%, 5%, 10%, or 15%, relative to the calendar-based strategy.

2.2. Computer Smiluation Experiments and Economic Data

To estimate the economic benefits of the DSS-based strategy for tomato production, the distributions of the net return per acre need to be generated, which is the gross revenue minus the costs of fungicide and its application. These distributions are generated by first conducting computer simulation experiments, which use 14 years of meteorological data (2000–2013), recorded from 25 locations (13 locations in New York and 12 locations in North Carolina). The set of computer simulations used for the economic analysis is a subset of the data generated by Small et al. [13]. The original computer simulated data set included 59 locations in the United States. This was reduced to 25 locations for inclusion in this study, because of a lack of availability of the tomato price and the yield information for the other locations.
Each year’s weather conditions at each location created a unique tomato growing environment. In total, 316 tomato growing environments were included after removing those years with more than 2% missing weather data during the growing season. The results were generated for three disease-resistance categories with a different susceptibility to late blight, as follows: susceptible, moderately susceptible, and moderately resistant. Each disease-resistance category includes several different tomato varieties. Three methods of fungicide scheduling throughout the production season were compared, including a calendar-based strategy (seven-day spray schedule), a DSS-based strategy (BlightPro Decision Support System based strategy), and a no spray strategy (no fungicide application). The initiation date of the late blight disease was assumed to initiate randomly during the growing season with a 0.001% disease severity (one lesion per 10 plants). This reflects the random nature of the late blight initiation over the course of a production season for a field that starts the season being disease-free, with tomato crops becoming infected by inoculum from external sources (e.g., infected farm/vegetable gardens) in the surrounding environment. In total, 2844 simulations (316 environments × three disease-resistance categories × three methods of fungicide scheduling) were used to compare the DSS-based strategy with the calendar-based strategy for tomato production. For a comprehensive discussion and illustration of the difference between the DSS-based strategy and the calendar-based strategy, see Small et al. [13] and Liu et al. [14].
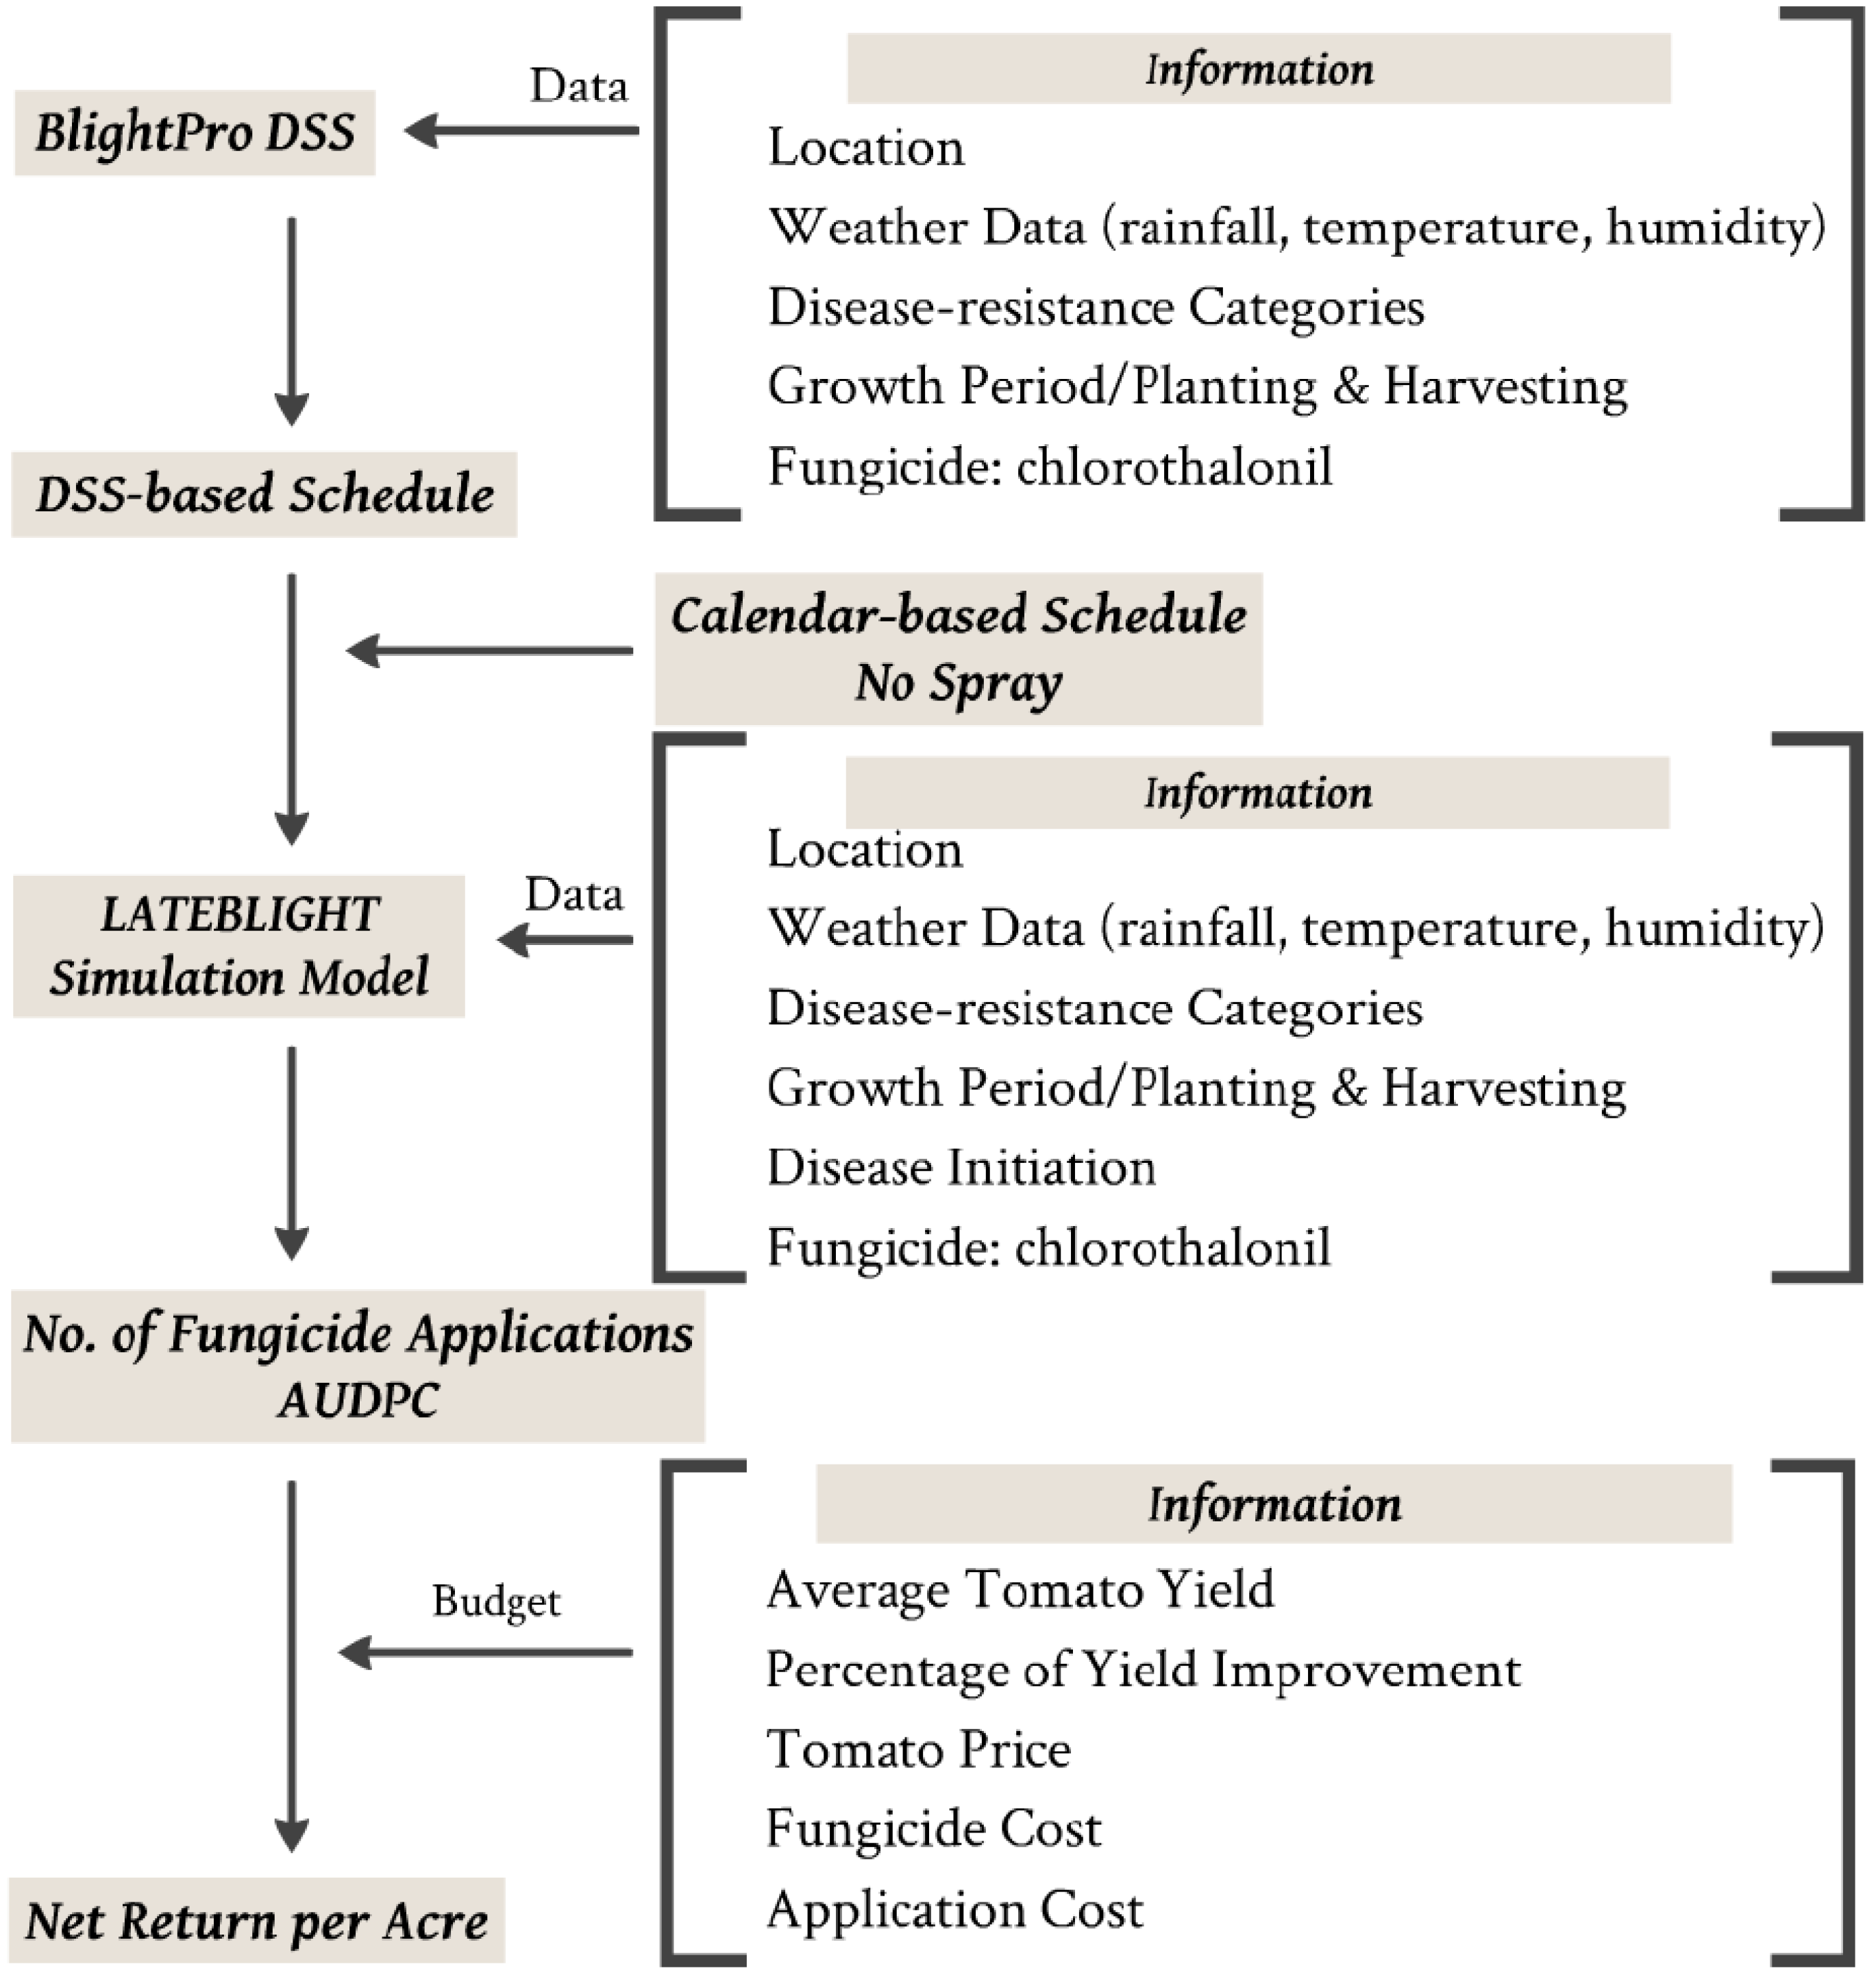
Figure 2 illustrates that the process of the computer simulation experiments and the data generating process for the economic analysis. For a comprehensive discussion of the computer simulation experiments, see Small et al. [13]. The following common parameters were used. The length of the season was 110 days (Table 2). All diseases other than late blight, and the effects of other pests, weeds, nutrients, and heat or frost shock, were assumed to have an equal effect on the tomato production process among the calendar-based strategy and the DSS-based strategy. The growers were also assumed to be able to make fungicide applications according to both the DSS-based and calendar-based strategy. In reality, fungicide applications may be delayed as weather conditions, such as precipitation, may not allow for growers to get into the field to apply fungicides.
To estimate the economic benefits of the DSS-based strategy, the net return per acre, which is the gross revenue minus the costs of the fungicide and its application, was compared for each of the 25 locations within a 14-year period. The tomato yield is simulated to estimate gross return per acre. The tomato yields per acre from 2000 to 2013 were estimated using historical state-level average fresh market tomato yield data obtained from the USDA NASS database [9]. The tomato yield per acre for the calendar-based strategy was assumed to be equal to the historical state-level average fresh market tomato yield from 2000 to 2013. The tomato yield per acre for the DSS-based strategy was calculated for each year, y , and each state, s , as follows:
  T o m a t o   y i e l d s , y , D S S   = a v e r a g e   t o m a t o   y i e l d s , y × ( 1 + P e r c e n t a g e   o f   y i e l d   i m p r o v e m e n t )
From the 2015 tomato field trials, the tomato marketable weight improved by 14.8% on average for the DSS-based strategy when compared with the calendar-based strategy. The sensitivity analyses were conducted with the assumption that the DSS-based strategy could improve the tomato yield by 0%, 5%, 10%, or 15%, compared with the calendar-based strategy. For each year at a given location, the net return per acre for each disease-resistance category was equal to the gross revenue (price × yield) less the cost of the fungicide applications, including materials and other application costs. The net return per acre was computed as follows:
  N e t   r e t u r n   p e r   a c r e l , y , i = T o m a t o   p r i c e s , y × T o m a t o   y i e l d s , y , i   ( F u n g i c i d e   c o s t y + a p p l i c a t i o n   c o s t y   ) × n u m b e r   o f   a p p l i c a t i o n l , y , i
where l stands for each of the 25 sites; y stands for a specific year; i refers to the calendar-based or the DSS-based strategy; and s stands for the state (New York or North Carolina) in which the site, l, is located. The fresh market tomato prices from 2000 to 2013 were obtained from USDA NASS [9]. The average yield and price were assumed to be the same across the different cultivar resistance levels. A protectant fungicide with an active ingredient, chlorothalonil, was applied at 1.34 kg a.i./ha (equivalent to 1.5 pints per acre) for each application. The fungicide price was obtained from a local agricultural chemical distributor on Long Island, by Dr. M.T. McGrath in April 2013 [15]. The fungicide cost per acre for each application in 2013 is $8.63. The application cost ($6.58/acre/application) comes from Lazarus [16], which is the total cost per acre of a self-propelled boom sprayer, including fuel, lubricants, repairs and maintenance, labor, electricity, depreciation (depreciation is both time-related and use related), and overhead costs (interest, insurance, and housing). The USDA Prices Paid Indices (agricultural chemical and machinery indices) were used to adjust the fungicide price and application cost in 2013 to the nominal prices in previous years.

2.3. Stochastic Dominance and Stochastic Efficiency

The weather conditions in different years influence the risk for late blight infection, which results in uncertainties and volatility in the net returns for decision makers. Recognizing this, we incorporated the uncertainty and producers’ risk attitudes into the decision-making framework. Individual risk attitudes can be used to rank alternative decisions [17]. Producers with different degrees of risk-aversion are likely to have different preferences among alternative strategies [18]. In this research, we compared mutually exclusive decisions faced by tomato growers for alternative fungicide spray strategies (i.e., the calendar-based strategy or the DSS-based strategy). Stochastic dominance, stochastic dominance with respect to a function, and stochastic efficiency with respect to a function (SERF), were used to rank alternative fungicide application strategies, using net return per acre for each location. These methods can help farmers to better understand their risk preferences and choices under price, yield, or weather uncertainty.
Stochastic dominance methods [19,20,21,22] were used to identify the most risk efficient strategy among the DSS-based and calendar-based strategies. These methods compare the entire cumulative distribution function of the net return per acre for the DSS-based and calendar-based strategies under the different ranges of the risk aversion coefficient of a decision maker. First-degree stochastic dominance (FSD) compares the risky alternatives faced by decision makers who have positive marginal utility [19], which implies that decision makers prefer more wealth (or net return in this case) to less. There is no restriction on the decision makers’ risk aversion coefficient [19], which means that the risk aversion coefficient ranges from negative infinity to positive infinity. Second-degree stochastic dominance (SSD) assumes that decision makers are risk averse [19]. Risk averse decision makers prefer a higher average income, lower variance, and less downside risk. The risk aversion coefficient for SSD ranges from zero to positive infinity. Stochastic dominance with respect to a function (SDRF) ranks risky alternatives based on assumed lower and upper bounds of decision makers’ absolute risk aversion levels [23,24]. It does not impose any restrictions on the width of the relevant absolute risk aversion interval [24], which allows the lower and upper bounds on the absolute risk aversion interval to vary among studies [24]. First- and second-degree stochastic dominance can be considered as special cases of SDRF [24].
Information pertaining to the absolute risk aversion coefficients is required for SDRF analysis. According to Raskin and Cochran [25], this information can be obtained by dividing the relative risk aversion coefficients by the location-specific average net return per acre. The relative risk aversion levels used for stochastic dominance with respect to a function, include slightly risk-averse (0–1.0), moderately risk-averse (1.0–3.0), and strongly risk-averse (3.0–4.0). The equation for the transformation of relative risk aversion and absolute risk aversion is as follows:
  r a , l   = r r / w l
where r a , l stands for the absolute risk aversion for a specific location, r r stands for the relative risk aversion, and w l stands for the average net return per acre for each location of both DSS-based and calendar-based strategies.
The stochastic efficiency with respect to a function [26] was used to evaluate the economic benefits of adopting BlightPro under different risk aversion levels. Stochastic efficiency with respect to a function was first used to compute the certainty equivalents (CEs) of the net return per acre for each fungicide application strategy. The CE is the risk adjusted value of the net return per acre for each fungicide application strategy. It is also the guaranteed amount of money that a decision maker would be willing to accept instead of taking the risky alternative [27]. Thus, risky alternatives with higher CEs are preferred to alternatives with lower CEs [26,28,
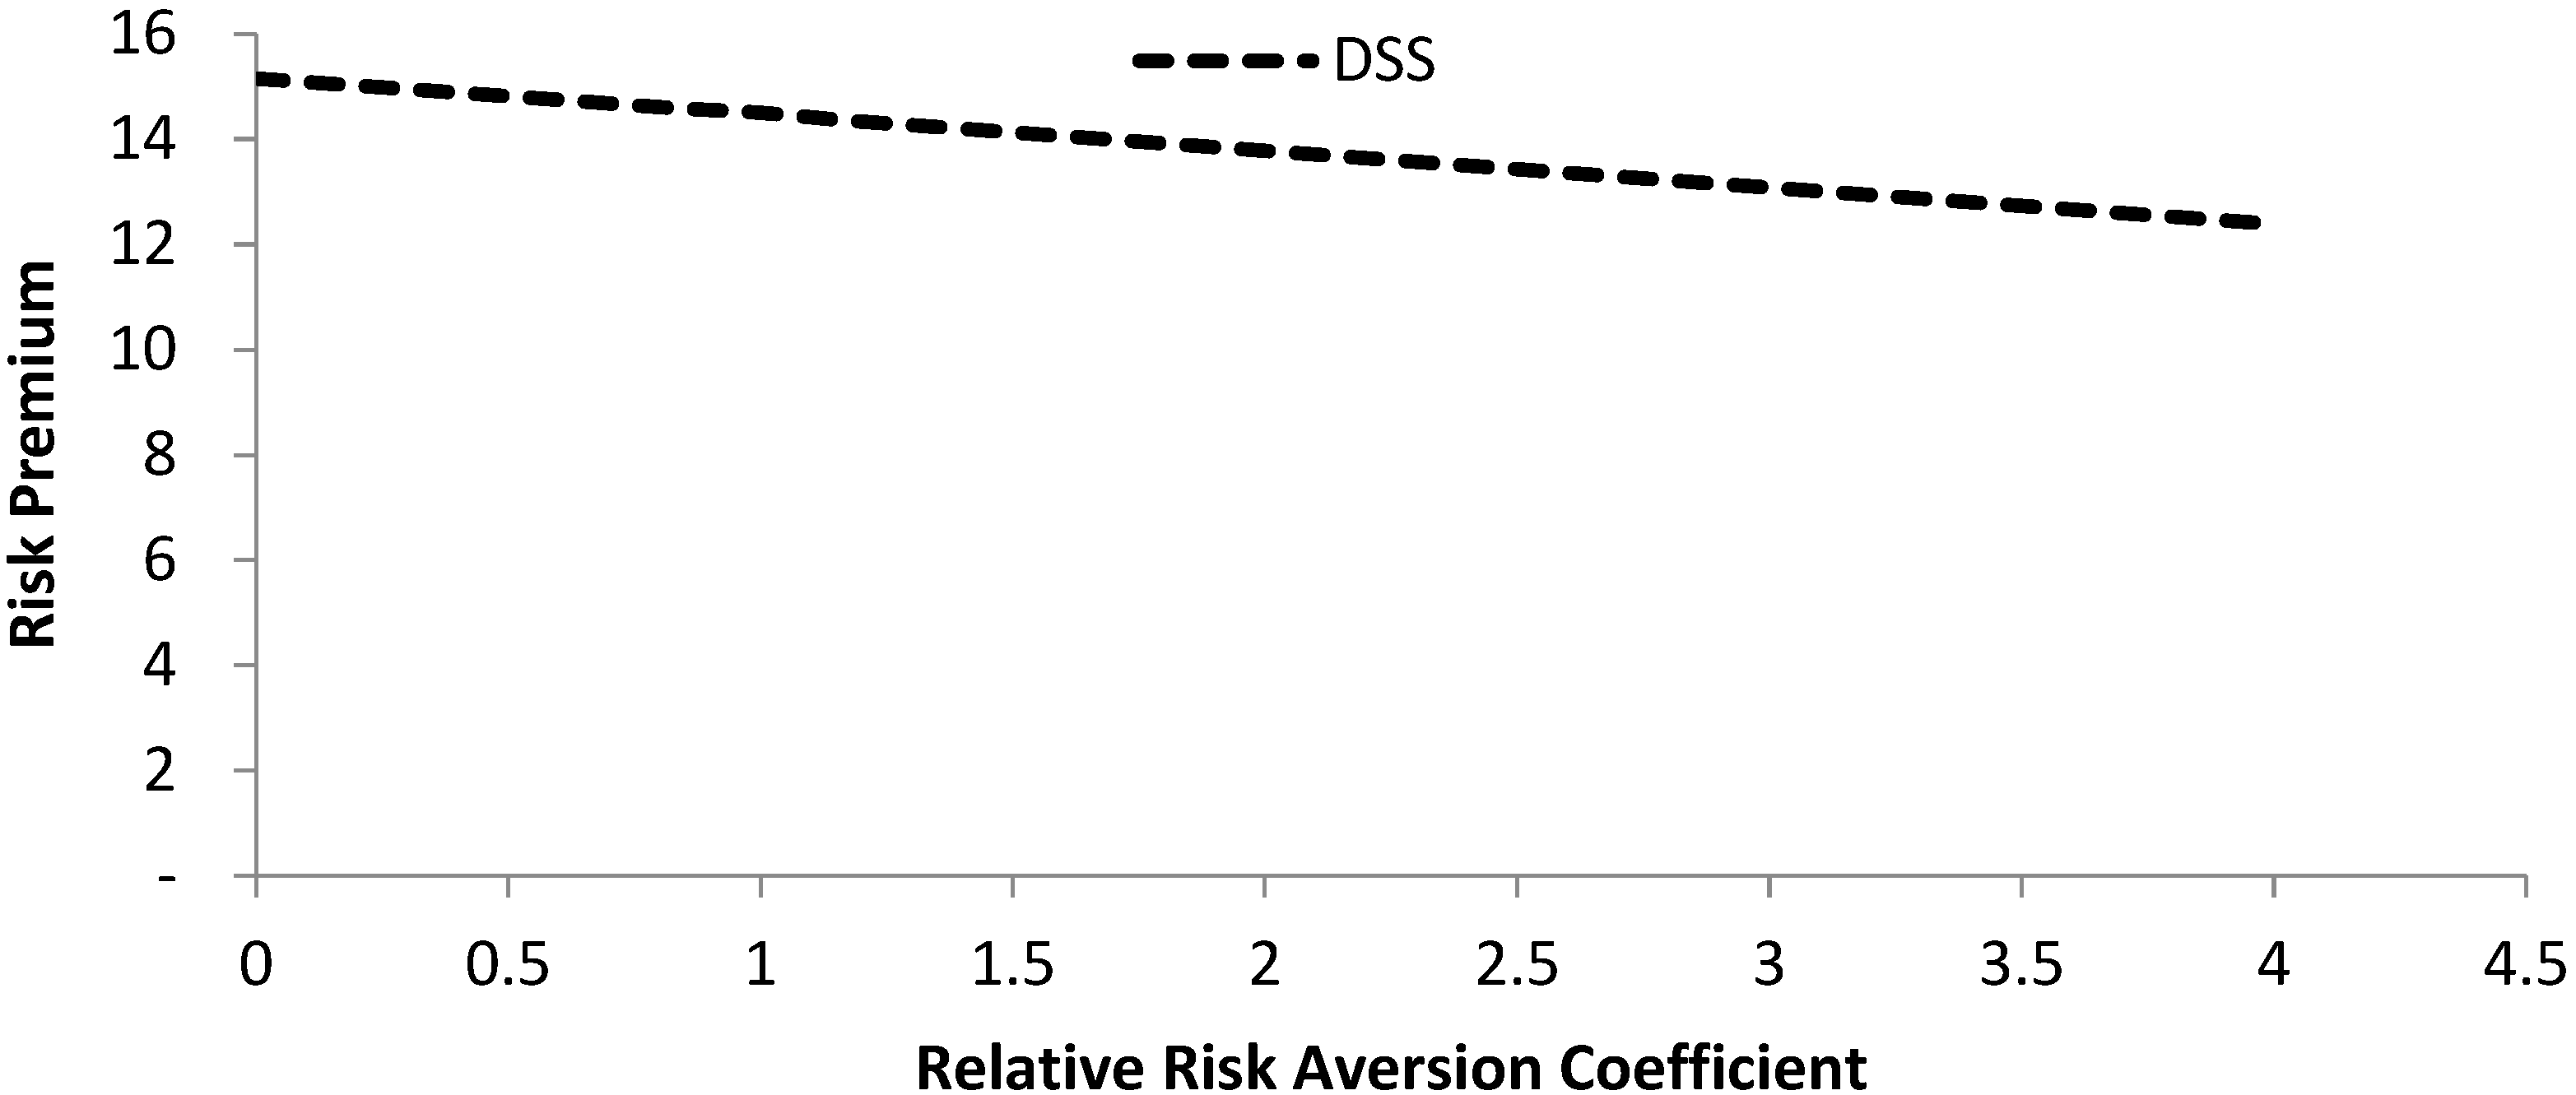
29]. Stochastic efficiency with respect to a function was also used to identify the utility weighted risk premium (RP), which can also be interpreted as the value of information provided by BlightPro. Given the risk aversion level, the utility weighted risk premium (RP) can be calculated using the following equation:
  R P D S S , C a l e n d a r , r r   = C E D S S , r r C E C a l e n d a r , r r
A positive RP means that a tomato grower should prefer to use BlightPro rather than the calendar-based strategy. The RP could also be viewed as the value of information provided by BlightPro for the tomato growers.
For the SERF analysis, a utility function needs to be specified. Schumann et al. [30] found that the efficient set identified by different utility functions can be similar. In this study, the power utility function was used to calculate the CEs for the alternative fungicide application strategies. The functional form of the power utility is as follows: U ( x ) = x 1 r 1 r   f o r   r 1 ; U ( x ) = l n ( x ) f o r   r = 1 . The power utility function is often referred to as the constant relative risk aversion utility function, which has been widely used for modeling the risk aversion of decision makers [31]. In addition to the constant relative risk aversion, this utility function exhibits a decreasing absolute risk aversion as an individual’s wealth increases. Namely, as an individual’s wealth increases, that individual is willing to take more risks. It is a commonly assumed characteristic of people’s risk aversion. The relative risk aversion levels, r r , used for stochastic efficiency with respect to a function, ranged from 0 (risk neutral) to 4 (strongly risk averse) [32].
The stochastic dominance and stochastic efficiency methods can be adapted to a wide range of individual decision making processes [19,33]. These approaches have been applied to evaluate various alternative decisions, such as beef farm insurance policies [27], contract options [34], tillage options [35], irrigation strategies [23], growing-finishing swine diets [36], cotton planting acreage [37], crop rotation and weed control methods [38], farming machinery selection [39], postharvest marketing strategies [40], policy impacts [41], and integrated pest and disease management strategies [3,14,42,43,44,45].
The Simulation and Econometrics to Analyze Risk (SIMETAR) software was used to conduct the stochastic dominance and stochastic efficiency with respect to a function analysis. These analyses were conducted separately for each location, in an Excel file. Each Excel file summarized the location-specific distributions of the net return per acre for the DSS-based and calendar-based strategies. The net return per acre distributions between the DSS-based strategy and the calendar-based strategy were compared so as to identify the preferred strategy. The same analyses were repeated and conducted 300 times using 300 Excel files (25 locations × 3 disease-resistance categories × 4 yield improvement assumptions).

3. Results

3.1. Fungicide Applications and Disease Rating

The effectiveness in managing the disease by adopting BlightPro is consistent with the discussion demonstrated by Small et al. [13] and Liu et al. [14]. For the susceptible cultivars, BlightPro recommends a higher number of fungicide applications throughout the season than the calendar-based strategy, but also exhibits higher levels of disease suppression. For the moderately susceptible cultivars, BlightPro recommends fewer fungicide applications, but is still able to achieve a higher level of disease suppression. This suggests that BlightPro improves the efficiency of fungicide usage, allows for more effective disease suppression, reduces the overall cost of fungicide application, and improves sustainability. As expected for the moderately resistant cultivars, the calendar-based strategy achieves high levels of disease suppression with lower fungicide use efficiency, relative to the DSS-based strategy [13]. BlightPro recommends fewer fungicide applications and lowers the cost of fungicide applications for moderately resistant cultivars.
Figure 3 illustrates the average number of fungicide applications for the DSS-based strategy and the calendar-based strategy. The average number of fungicide applications for the DSS-based strategy decreases, when the disease-resistance level increases. The average number of fungicide applications for the DSS-based strategy was 13.3, 9.2, and 7.1, for the susceptible, moderately susceptible, and moderately resistant cultivars, respectively, which represent a 21% increase, a 16% decrease, and a 35% decrease in average number of fungicide applications, relative to the calendar-based strategy (11 sprays). The prevalence of favorable weather for late blight also influences the number of recommended sprays by BlightPro [13]. Higher application rates are associated with the years when the weather is more favorable for disease development [13]. In addition, the average number of fungicide applications varies by state, with New York requiring a higher number of fungicide applications throughout the season than North Carolina. For the susceptible cultivars, the annual average number of recommended fungicide applications is 12.6 in North Carolina and 14.1 in New York. The average number of fungicide applications is 8.8 in North Carolina and 9.7 in New York for moderately susceptible cultivars. For moderately resistant cultivars, the average number of fungicide applications is 6.8 in North Carolina and 7.4 in New York.
Figure 4 illustrates the AUDPC for the DSS-based strategy, the calendar-based strategy, and the unsprayed control. The use of fungicide dramatically reduced the late blight disease severity when compared with the unsprayed control. The average AUDPC for the unsprayed control was 1688 for the susceptible cultivars, 1429 for the moderately susceptible cultivars, and 570 for the moderately resistant cultivars. The average AUDPC for the DSS-based strategy was 91 for the susceptible cultivars, 225 for the moderately susceptible cultivars, and 26 for moderately resistant cultivars. The average AUDPC for the calendar-based strategy was 402 for the susceptible cultivars, 243 for the moderately susceptible cultivars, and 16 for the moderately resistant cultivars. The DSS-based method decreased the average level of disease as well as the variance in disease severity for the susceptible cultivars and the moderately susceptible cultivars, compared with the calendar-based strategy. The DSS-based strategy uses more judicious fungicide applications, which improves the sustainability from an environmental perspective.

3.2. Yield and Net Return Per Acre

Table 3 presents the summary statistics for the average tomato yield and net return per acre for the calendar-based strategy and DSS-based strategy, with four different levels of yield improvement assumptions. The average tomato yield without yield improvement for the DSS-based strategy was 245 cwt/acre for both strategies. The average tomato yield for the DSS-based strategy increases to 257.3 cwt/acre, 269.5 cwt/acre, and 281.8 cwt/acre with 5%, 10%, and 15% yield improvements, respectively. Without yield differences between the DSS-based and calendar-based strategy, the average net return per acre for the DSS-based strategy is $28 smaller than that of the calendar-based strategy for the susceptible cultivars. This is due to the increased number of fungicide applications resulting in the higher cost of fungicide applications for the DSS-based strategy compared with the calendar-based strategy throughout the season. For the moderately susceptible and moderately resistant cultivars, the DSS-based strategy recommended fewer fungicide applications. As a result, the average net return per acre for the DSS-based strategy is $22 and $48 higher than that of the calendar-based strategy for moderately susceptible and moderately resistant cultivars, respectively.
With a 5% yield improvement or higher for the DSS-based strategy, the average net return per acre was higher for the DSS-based strategy than the calendar-based strategy. With high value crops like tomato, a small percentage increase in the yield will quickly improve the economic profitability of the farm. The results from the field trial at the Mountain Horticultural Crops Research and Extension Center demonstrate that the marketable weight for tomato could improve by 14.8% using the DSS-based strategy. With a 5% yield improvement for the DSS-based strategy, the average net return per acre is $526, $575, and $601 higher than calendar-based strategy for the susceptible cultivars, moderately susceptible cultivars, and moderately resistant cultivars, respectively. With a 10% yield improvement for the DSS-based strategy, the average net return per acre is $1078, $1128, and $1154 higher than calendar-based strategy for the susceptible cultivars, moderately susceptible cultivars, and moderately resistant cultivars, respectively. With a 15% yield improvement for the DSS-based strategy, the average net return per acre is $1631, $1681, and $1707 higher than the calendar-based strategy for the susceptible cultivars, moderately susceptible cultivars, and moderately resistant cultivars, respectively.

3.3. Stochastic Dominance Results

The stochastic dominance approaches use the cumulative distribution functions of the net returns per acre for each of the 25 locations in order to identify the dominant strategy for each location between the DSS-based strategy and the calendar-based strategy. The identified dominant strategy in the risk efficient set was used to evaluate the decision makers’ preferences between the DSS-based and the calendar-based strategies. The dominant strategy in the risk efficient set is the preferred strategy by decision makers. Stochastic dominance approaches compare the distributions of the net returns per acre of the DSS-based strategy and the calendar-based strategy, to identify the dominant strategy. Three possible efficient sets include the calendar-based strategy, the DSS-based strategy, or both. To illustrate this, for a certain location, if the DSS-based strategy dominates the calendar-based strategy, DSS is in the risk efficient set for this location, and vice versa for the calendar-based strategy. If neither strategy dominates the other, then both strategies are in the risk efficient set for that location. First degree stochastic dominance (FSD), second degree stochastic dominance (SSD), and stochastic dominance with respect to a function (SDRF), are used to identify the risk efficient sets. In summary, except for the case of the susceptible cultivars with no yield difference between the two strategies, the DSS-based strategy is the preferred fungicide application strategy by decision makers. The results showed that under the assumption of no yield improvement for the DSS-based strategy, the growers who grew more late blight resistant tomato cultivars would be more willing to adopt BlightPro. When there were 5%, 10%, and 15% yield improvements for the DSS-based strategy, all of the growers would be willing to adopt the DSS-based strategy across the slightly, moderately, and strongly risk aversion levels, respectively.
Table 4 summarizes the results of the stochastic dominance analysis with a 0% yield improvement for the DSS-based strategy. This table presents the percentage of locations among the 25 locations that appear in each of the three possible efficient sets. Under the assumption of no yield difference between the two alternative strategies, the results were driven by the number of fungicide applications throughout the season. The strategy that requires the lowest number of fungicide applications is preferred. The calendar-based strategy is preferred for the susceptible cultivars for all of the stochastic dominance approaches. For the susceptible cultivar, 8% of the 25 locations prefer the DSS-based strategy over the calendar-based strategy for the slightly risk-averse growers, moderately risk-averse growers, and strongly risk-averse growers, using the SDRF method. The DSS-based strategy is strongly preferred for the moderately susceptible and moderate resistant cultivars for all of the stochastic dominance approaches. For the moderately susceptible cultivars, 84% of the 25 locations prefer the DSS-based strategy for the three risk aversion levels (slightly risk-averse, moderately risk-averse, and strongly risk-averse). For the moderately resistant cultivars, all of the 25 locations prefer the DSS-based strategy for the three risk aversion levels (slightly risk-averse, moderately risk-averse, and strongly risk-averse). Under the assumption of a 5%, 10%, and 15% yield improvement for the DSS-based strategy, the stochastic dominance analyses (FSD, SSD, and SDRF) shows that all of the growers in the 25 locations would prefer the DSS-based strategy over the calendar-based strategy for all of the risk aversion levels and disease-resistance categories.

3.4. Stochastic Efficiency Results

In order to identify the value of BlightPro, we compared the average certainty equivalents (CEs) and risk premiums (RPs) of the DSS-based and calendar-based strategies using SERF. The power utility function was used for conducting the SERF analysis. We also conducted robustness checks by using the negative exponential function for the SERF analysis. The results are consistent across the two different utility functions. The stochastic efficiency with respect to the function results are location specific. Figure 5 and Figure 6 illustrate examples of the SERF analysis by comparing the CEs and RPs between the calendar-based and the DSS-based strategies for one location. In this example, the DSS-based strategy results in higher CEs than the calendar-based strategy. Thus, the DSS-based strategy is the preferred strategy for the range of a relative risk aversion coefficient between 0 and 4. Figure 6 demonstrated the utility weighted risk premium (Equation (4)), which is the difference in CEs between the two strategies. This example also demonstrated that the RPs decreased as the relative risk aversion coefficient increases, which means that BlightPro is viewed as more valuable by the less risk aversion individuals.
The value of information created by BlightPro varies by location, the disease-resistance category of the tomato cultivar, producer risk aversion level, and the percentage of yield improvement for the DSS-based strategy. Table 5 summarizes the average CEs and RPs using relative risk aversion levels of 0, 1, 3, and 4 for each disease-resistance category at the 25 locations, assuming that the yields are the same for the DSS-based and calendar-based strategies. Compared with the calendar-based strategy, the DSS-based strategy exhibits lower CEs for the susceptible cultivars and higher CEs for the moderately susceptible cultivars and the moderately resistant cultivars, when assuming that the yields were the same between the two strategies. The average risk premium is −$28 per acre for the susceptible cultivars, $21 to $22 per acre for the moderately susceptible cultivars, and $48 per acre for the moderately resistant cultivars. These values represent the value created by BlightPro. The results show that under the assumption of no yield improvement for the DSS-based strategy, the growers who grow late blight resistant tomato cultivars would benefit from adopting BlightPro.
Table 6 shows the RPs for the DSS-based strategy with a 5%, 10%, and 15% yield improvement for the DSS-based strategy. The benefit of the DSS-based strategy for less risk-averse growers is larger than that for the more risk-averse growers. Also, for the growers planting less resistant cultivars, the benefit is generally less than it is for growers with more disease-resistant cultivars. With a 5% yield improvement, the benefits for the growers in adopting BlightPro range from $496 to $527 for the susceptible cultivars, $545 to $576 for the moderately susceptible cultivars, and $571 to $603 for the moderately resistant cultivars. With a 10% yield improvement, the benefits range from $1020 to $1082 for the susceptible cultivars, $1069 to $1132 for the moderately susceptible cultivars, and $1095 to $1158 for the moderately resistant cultivars. With a 15% yield improvement, the benefits range from $1543 to $1638 for the susceptible cultivars, $1593 to $1687 for the moderately susceptible cultivars, and $1619 to $1714 for the moderately resistant cultivars.

4. Discussion

This paper investigates the economic benefit of adopting precision agriculture technology in order to manage late blight disease. We compare a precision agriculture strategy with the traditional, calendar-based practices for scheduling fungicide applications, in terms of productivity, profitability, and risk associated with income fluctuation. The data from the computer simulation experiments and tomato field trials are used to examine the economic benefits of adopting precision agriculture technology for tomato production. Our study builds on the work conducted by Small et al. [13]. By overlaying the economic and risk analyses onto their results, we estimate the economic incentives for individual decision makers to adopt precision agriculture for tomato production.
The improvement in the usage of fungicide has environmental, social, and economic benefits pertaining to sustainability. Consistent with the findings of Small et al. [13] and Liu et al. [14] for potato production, BlightPro increases the effectiveness in managing late blight for tomato production. It recommends increased fungicide applications for susceptible cultivars, and fewer fungicide applications for moderately susceptible cultivars and moderately resistant cultivars for tomato production. Compared with the calendar-based strategy (11 sprays), BlightPro recommends a 21% increase, a 16% decrease, and a 35% decrease in the average number of fungicide applications for the susceptible, moderately susceptible, and moderately resistant cultivars, respectively. It is also more effective in managing tomato late blight disease for the susceptible cultivars and the moderately susceptible cultivars. BlightPro also recommends fungicide applications in response to prevailing weather conditions that are favorable for the development of late blight [13]. A higher number of applications are associated the in years when the weather is more favorable for disease development [13]. One of the benefits of a more judicious application approval is that it delays the development of late blight resistance to fungicide, thus increasing the sustainability of the treatment. The reduced number of fungicide application for more disease resistance cultivars also reduced the working hours for labor, which improves social sustainability. BlightPro improves the efficiency of fungicide usage, allowing for more effective disease suppression, reducing fungicide application, and improving sustainability from an environmental perspective.
Using stochastic dominance with respect to a function, we identify the risk-efficient and preferred fungicide scheduling strategies between the calendar-based and the DSS-based strategy. In addition, we evaluate the economic benefits associated with scheduling fungicide applications by adopting precision agriculture technology using stochastic efficiency with respect to a function. A tomato field trial, conducted at Mills River, North Carolina, demonstrated that the marketable weight of tomatoes could improve by 14.8% when using BlightPro. Sensitivity analyses are conducted with various levels of yield improvement (0%, 5%, 10%, and 15%) assumptions corresponding to the adoption of BlightPro. Except for the case of susceptible cultivars with no yield difference between the two strategies, the DSS-based strategy is the preferred fungicide application strategy by decision makers. Also, for the growers planting less resistant cultivars, the benefit is generally less than it is for the growers with more disease-resistant cultivars.
Under the assumption of no yield difference between the DSS-based and the calendar-based strategy, the calendar-based strategy is preferred for susceptible cultivars, and the DSS-based strategy is preferred for the moderately susceptible cultivars and moderately resistant cultivars. The value of BlightPro ranges from −$28 to $48 per acre. With a 5%, 10%, and 15% yield improvement for the DSS-based strategy, the DSS-based strategy is strongly preferred for all 25 locations. This means that all growers would be willing to adopt the DSS-based strategy across the slightly, moderately, and strongly risk averse levels. Depending on the percentage of the yield improvement associated with the DSS-based strategy, the value of BlightPro ranges from $496 to $1714 per acre. These improvements in profitability increase the economic sustainability of tomato farms.
This research provides a method to evaluate and reveal the economic benefits of adopting BlightPro for tomato growers. Knowing the value of the information provided by BlightPro can help improve the adoption rate of this precision agriculture technology. This would help improve the late blight management actions taken by the tomato growers to manage the spread of the disease and limit the potential losses. The economic evaluation of BlightPro presented here was hindered by the difficulty in determining the relationship between the late blight and tomato yield. The yield improvement assumptions in this paper shift the distribution of the tomato marketable yield toward the higher end for all weather conditions. Further research is needed to identify the relationship between late blight disease and tomato yield or yield loss, which would improve the analysis in evaluating the economic impact of BlightPro for tomato production.

Author Contributions

Y.L. and M.R.L. conceived and designed the research plan. The study was also conducted by Y.L. and M.R.L. Y.L. was mainly responsible for writing the manuscript, carrying out the analysis, and gathering the dataset used for analysis. M.R.L. was responsible for commenting on and writing the manuscript. I.M.S., L.J., W.E.F., J.B.R., and A.S. were responsible for providing the datasets used for conducting the economic analysis. I.M.S., L.J., W.E.F., J.B.R., and A.S. also participated in writing and commenting on the manuscript. B.M.G. and P.V.P. participated in writing and commenting on the manuscript.

Funding

This study was financially supported by the USDA-NIFA Grant No. 2011-68004-30154, Eastern Kentucky University, and by the College of Agriculture at Purdue University.

Conflicts of Interest

The authors declare no conflict of interest. The funding sponsors had no role in the design of the study; in the collection, analyses, or interpretation of data; in the writing of the manuscript; and in the decision to publish the results.

References

  1. Lindblom, J.; Lundström, C.; Ljung, M.; Jonsson, A. Promoting sustainable intensification in precision agriculture: Review of decision support systems development and strategies. Precis. Agric. 2017, 18, 309–331. [Google Scholar] [CrossRef]
  2. Griffin, T.W.; Lowenberg-DeBoer, J. Worldwide adoption and profitability of precision agriculture: Implications for Brazil. Rev. De Politica Agricola 2005, 14, 20–37. [Google Scholar]
  3. Vorotnikova, E.; Borisova, T.; VanSickle, J.J. Evaluation of the profitability of a new precision fungicide application system for strawberry production. Agric. Syst. 2014, 130, 77–88. [Google Scholar] [CrossRef]
  4. Wale, S.; Platt, B.; Cattlin, N.D. Diseases, Pests and Disorders of Potatoes: A Color Handbook; Academic Press: Burlington, MA, USA, 2008; pp. 48–52. [Google Scholar]
  5. Krause, R.A.; Massie, L.B.; Hyre, R.A. Blitecast: A computerized forecast of potato late blight. Plant Dis. Rep. 1975, 59, 95–98. [Google Scholar]
  6. Wallin, J. Summary of recent progress in predicting late blight epidemics in United States and Canada. Am. J. Potato Res. 1962, 39, 306–312. [Google Scholar] [CrossRef]
  7. Olanya, O.M.; Starr, G.C.; Honeycutt, C.W.; Griffin, T.S.; Lambert, D.H. Microclimate and potential for late blight development in irrigated potato. Crop. Prot. 2007, 26, 1412–1421. [Google Scholar] [CrossRef]
  8. Food and Agriculture Organization of the United Nations. FAOSTAT Database Collections; FAO: Rome, Italy, 2018. [Google Scholar]
  9. United States Department of Agriculture-National Agricultural Statistics Service (USDA-NASS). Quick Stats; USDA-NASS: Washington, DC, USA, 2018.
  10. Andrade-Piedra, J.L.; Hijmans, R.J.; Forbes, G.A.; Fry, W.E.; Nelson, R.J. Simulation of potato late blight in the Andes. I: Modification and parameterization of the LATEBLIGHT model. Phytopathology 2005, 95, 1191–1199. [Google Scholar] [CrossRef] [PubMed]
  11. Small, I.M.; Joseph, L.; Fry, W.E. Development and implementation of the BlightPro decision support system for potato and tomato late blight management. Comput. Electron. Agric. 2015, 115, 57–65. [Google Scholar] [CrossRef]
  12. Fry, W.E. Phytophthora infestans: New tools (and old ones) lead to new understanding and precision management. Annu. Rev. Phytopathol. 2016, 54, 529–547. [Google Scholar] [CrossRef] [PubMed]
  13. Small, I.M.; Joseph, L.; Fry, W.E. Evaluation of the BlightPro Decision Support System for management of potato late blight using computer simulation and field validation. Phytopathology 2015. [Google Scholar] [CrossRef] [PubMed]
  14. Liu, Y.; Langemeier, M.R.; Small, I.M.; Joseph, L.; Fry, W.E. Risk Management Strategies using Precision Agriculture Technology to Manage Potato Late Blight. Agron. J. 2017, 109, 562–575. [Google Scholar] [CrossRef]
  15. McGrath, M.T.; Plant Pathology and Plant-Microbe Biology, Cornell University, Ithaca, NY, USA. Personal communication, April 2013.
  16. Lazarus, W.F. Machinery Cost Estimates; University of Minnesota: St. Paul, MN, USA, 2013. [Google Scholar]
  17. Schumann, K.D. Semi-nonparametric test of second degree stochastic dominance with respect to a function. J. Econ. 2011, 162, 71–78. [Google Scholar] [CrossRef]
  18. Monjardino, M.; McBeath, T.; Ouzman, J.; Llewellyn, R.; Jones, B. Farmer risk-aversion limits closure of yield and profit gaps: A study of nitrogen management in the southern Australian wheatbelt. Agric. Syst. 2015, 137, 108–118. [Google Scholar] [CrossRef]
  19. Hadar, J.; Russell, W.R. Rules for ordering uncertain prospect. Am. Econ. Rev. 1969, 59, 25–34. [Google Scholar]
  20. Hanoch, G.; Levy, H. Efficiency analysis of choices involving risk. Rev. Econ. Stud. 1969, 36, 335–346. [Google Scholar] [CrossRef]
  21. Meyer, J. Choice among distributions. J. Econ. Theory 1977, 14, 326–336. [Google Scholar] [CrossRef]
  22. Rothschild, M.; Stiglitz, J.E. Increasing risk. 1. definition. J. Econ. Theory 1970, 2, 225–243. [Google Scholar] [CrossRef]
  23. Harris, T.R.; Mapp, H.P. A stochastic dominance comparison of water-conserving irrigation strategies. Am. J. Agric. Econ. 1986, 68, 298–305. [Google Scholar] [CrossRef]
  24. King, R.P.; Robison, L.J. Implementation of the interval approach to the measurement of decision maker preference. Mich. Agric. Exp. Stn. Res. Rep. 1981, 60, 2–19. [Google Scholar]
  25. Raskin, R.; Cochran, M.J. Interpretations and transformations of scale for the Pratt-Arrow absolute risk aversion coefficient: Implications for generalized stochastic dominance. Am. J. Agric. Econ. 1986, 68, 1375. [Google Scholar]
  26. Hardaker, J.B.; Richardson, J.W.; Lien, G.; Schumann, K.D. Stochastic efficiency analysis with risk aversion bounds: A simplified approach. Aust. J. Agric. Resour. Econ. 2004, 48, 253–270. [Google Scholar] [CrossRef]
  27. Williams, J.R.; Saffert, A.T.; Barnaby, G.; Llewelyn, R.V.; Langemeier, M.R. A risk analysis of adjusted gross revenue-lite on beef farms. J. Agric. Appl. Econ. 2014, 46, 227–244. [Google Scholar] [CrossRef]
  28. Meyer, J.; Richardson, J.W.; Schumann, K.D. Stochastic efficiency analysis with risk aversion bounds: A correction. Aust. J. Agric. Resour. Econ. 2009, 53, 521–525. [Google Scholar] [CrossRef]
  29. Hardaker, J.B.; Lien, G. Stochastic efficiency analysis with risk aversion bounds: A comment. Aust. J. Agric. Resour. Econ. 2010, 54, 379–383. [Google Scholar] [CrossRef]
  30. Schumann, K.D.; Richardson, J.W.; Lien, G.; Hardaker, J.B. Stochastic efficiency analysis using multiple utility functions. In Proceedings of the American Agricultural Economics Association Meeting, Denver, CO, USA, 1–4 August 2004. [Google Scholar]
  31. Wakker, P.P. Explaining the characteristics of the power (CRRA) utility family. Health Econ. 2008, 17, 1329–1344. [Google Scholar] [CrossRef] [PubMed] [Green Version]
  32. Hardaker, J.B.; Huirne, R.B.M.; Anderson, J.R.; Lien, G. Coping with Risk in Agriculture, 3rd ed.; CABI Publishing: Cambridge, MA, USA, 2004. [Google Scholar]
  33. Quirk, J.P.; Saposnik, R. Admissibility and measurable utility functions. Rev. Econ. Stud. 1962, 29, 140–146. [Google Scholar] [CrossRef]
  34. Parcell, J.L.; Langemeier, M.R. Feeder-pig producers and finishers: Who should contract? Can. J. Agric. Econ. Rev. Can. D Agroecon. 1997, 45, 317–327. [Google Scholar] [CrossRef]
  35. Varner, B.T.; Epplin, F.M.; Strickland, G.L. Economics of no-till versus tilled dryland cotton, grain sorghum, and wheat. Agron. J. 2011, 103, 1329–1338. [Google Scholar] [CrossRef]
  36. Llata, M.D.L.; Langemeier, M.R.; Dritz, S.S.; Tokach, M.D.; Goodband, R.D.; Nelssen, J.L. Economics of Adding Fat and Increasing Lysine: Calorie Ratio in Diets for Growing-Finishing Gilts; Kansas State University Swine Day 1999; Report of Progress 841; Kansas State University Agricultural Experiment Station and Cooperative Extension Servie: Manhattan, KS, USA; pp. 113–116.
  37. Ritchie, J.W.; Abawi, G.Y.; Dutta, S.C.; Harris, T.R.; Bange, M. Risk management strategies using seasonal climate forecasting in irrigated cotton production: A tale of stochastic dominance. Aust. J. Agric. Resour. Econ. 2004, 48, 65–93. [Google Scholar] [CrossRef]
  38. Zacharias, T.P.; Grube, A.H. An economic evaluation of weed control methods used in combination with crop rotation: A stochastic dominance approach. North Cent. J. Agric. Econ. 1984, 6, 113–120. [Google Scholar] [CrossRef]
  39. Danok, A.B.; McCarl, B.A.; White, T.K. Machinery selection modeling: Incorporation of weather variability. Am. J. Agric. Econ. 1980, 62, 700–708. [Google Scholar] [CrossRef]
  40. King, R.P.; Lybecker, D.W. Flexible, Risk-Oriented Marketing Strategies for Pinto Bean Producers. West. J. Agric. Econ. 1983, 124–133. [Google Scholar]
  41. King, R.P.; Oamek, G.E. Risk management by Colorado dryland wheat farmers and the elimination of the disaster assistance program. Am. J. Agric. Econ. 1983, 65, 247–255. [Google Scholar] [CrossRef]
  42. Musser, W.N.; Tew, B.V.; Epperson, J.E. An economic examination of an integrated pest management production system with a contrast between E-V and stochastic dominance analysis. South. J. Agric. Econ. 1981, 13, 119–124. [Google Scholar] [CrossRef]
  43. Moffitt, L.J.; Tanigoshi, L.K.; Baritelle, J.L. Incorporating risk in comparisons of alternative pest control methods. Environ. Èntomol. 1983, 12, 1003–1011. [Google Scholar] [CrossRef]
  44. Greene, C.R.; Kramer, R.A.; Norton, G.W.; Rajotte, E.G.; McPherson, R.M. An economic analysis of soybean integrated pest management. Am. J. Agric. Econ. 1985, 67, 567–572. [Google Scholar] [CrossRef]
  45. Cochran, M.J.; Robison, L.J.; Lodwick, W. Improving the efficiency of stochastic dominance techniques using convex set stochastic dominance. Am. J. Agric. Econ. 1985, 67, 289–295. [Google Scholar] [CrossRef]
Figure 1. Schematic representation of four replications used in the tomato field trials, as follows: 1—represents the unsprayed control; 2—represents the calendar-based strategy; 3—represents the BlightPro Decision Support System based strategy (DSS-based strategy).
Sustainability 10 03108 g001
Figure 2. Schematic of the data generating process for 25 locations from 2000 to 2013. AUDPC—area under the disease progress curve.
Sustainability 10 03108 g002
Figure 3. The number of fungicide applications for 25 locations over 14 years (2000 to 2013). The bar represents the mean number of fungicide applications. Each point represents the number of fungicide applications for a given year and location.
Sustainability 10 03108 g003
Figure 4. Area under the disease progress curve (AUDPC) for 25 locations over 14 years (2000 to 2013). The bar represents the mean value of the AUDPC. Each point represents the final AUDPC for a given year and location.
Sustainability 10 03108 g004
Figure 5. Certainty equivalent as a function of risk aversion for alternative strategies at one location in New York for susceptible cultivars.
Sustainability 10 03108 g005
Figure 6. Risk premium as a function of risk aversion for alternative strategies at one location in New York for susceptible cultivars.
Sustainability 10 03108 g006
Table 1. 2015 field trial results for Mountain Fresh Plus indicating disease severity and weight (Tons/A). DSS—BlightPro Decision Support System based strategy; Calendar—calendar-based strategy; Control—no fungicide application; AUDPC—area under the disease progress curve.
RepTreatmentAUDPCWt. MarketableWt. CullWt. Total
IControl4037.392.495.367.85
ICalendar43.3814.302.7217.02
IDSS6.7415.463.3318.79
IIControl3866.270.715.416.12
IICalendarXXXX
IIDSS112.3116.182.3618.54
IIIControl3378.662.265.117.37
IIICalendar6.7413.162.4813.16
IIIDSS6.9219.054.0720.21
IVControl4100.211.394.275.66
IVCalendar33.8811.144.6315.78
IVDSS6.749.814.0113.82
Table 2. Tomato growth period.
StatePlant DateHarvest Date
North Carolina26 March27 July
New York15 May15 September
Table 3. Summary statistics for tomato yield and tomato revenue (316 observations). S.D—standard deviation.
CalendarDSS Yield Improvement Percentage
0%5%10%15%
ItemMeanS.DMinMaxMeanS.DMinMaxMeanS.D.MinMaxMeanS.DMinMaxMeanS.DMinMax
Susceptible Cultivars
Tomato Yield (cwt/acre)245.085.4140.0440.0245.085.4140.0440.0257.389.7147.0462.0269.593.9154.0484.0281.898.2161.0506.0
Net Return per Acre ($/acre)10,9262572645016,68510,8982566639516,77411,4512696672517,61612,0042825705518,45912,5572954738519,301
Moderately Susceptible Cultivars
Tomato Yield (cwt/acre)245.085.4140.0440.0245.085.4140.0440.0257.389.7147.0462.0269.593.9154.0484.0281.898.2161.0506.0
Net Return per Acre ($/acre)10,9262572645016,68510,9482571646416,78911,5012700679417,63112,0542829712418,47412,6072958745419,316
Moderately Resistant Cultivars
Tomato Yield (cwt/acre)245.085.4140.0440.0245.085.4140.0440.0257.389.7147.0462.0269.593.9154.0484.0281.898.2161.0506.0
Net Return per Acre ($/acre)109262572645016,68510,9742574649116,80411,5272703682117,64612,0802832715118,48812,6332961748119,331
Table 4. Percentage of locations in the risk efficient set with 0% yield improvement for the DSS-based strategy *.
ItemCalendarDSSBoth
Susceptible Cultivars
FSD28.0%0.0%72.0%
SSD64.0%16.0%20.0%
SDRF
  Slightly Risk-Averse92.0%8.0%0.0%
  Moderately Risk-Averse92.0%8.0%0.0%
  Strongly Risk-Averse84.0%8.0%8.0%
Moderately Susceptible Cultivars
FSD4.0%32.0%64.0%
SSD8.0%84.0%8.0%
SDRF
  Slightly Risk-Averse16.0%84.0%0.0%
  Moderately Risk-Averse16.0%84.0%0.0%
  Strongly Risk-Averse16.0%84.0%0.0%
Moderately Resistant Cultivars
FSD0.0%100.0%0.0%
SSD0.0%100.0%0.0%
SDRF
  Slightly Risk-Averse0.0%100.0%0.0%
  Moderately Risk-Averse0.0%100.0%0.0%
  Strongly Risk-Averse0.0%100.0%0.0%
* DSS is BlightPro Decision Support System. FSD stands for first-degree stochastic dominance. SSD stands for second-degree stochastic dominance. SDRF stands for stochastic dominance with respect to a function.
Table 5. Average certainty equivalent of net return acre with 0% yield improvement for DSS-based strategy.
ItemSpray ScheduleRisk Premium
CalendarDSSDSS over Calendar
Susceptible Cultivars
r = 0$10,974$10,946$(28)
r = 1$10,855$10,827$(28)
r = 3$10,636$10,608$(28)
r = 4$10,536$10,508$(28)
Moderately Susceptible Cultivars
r = 0$10,974$10,995$21
r = 1$10,855$10,876$21
r = 3$10,637$10,658$21
r = 4$10,536$10,558$22
Moderately Resistant Cultivars
r = 0$10,974$11,022$48
r = 1$10,855$10,903$48
r = 3$10,637$10,684$48
r = 4$10,537$10,584$48
Note: r is the relative risk aversion coefficient. A power utility function is assumed. Numbers in parentheses means negative value.
Table 6. Risk premiums of the DSS-based strategy with 5%, 10%, and 15% yield improvement for the DSS-based Strategy.
ItemRisk Premium: DSS over 7-Day
5%10%15%
Susceptible Cultivars
r = 0$527$1082$1638
r = 1$518$1065$1611
r = 3$503$1034$1564
r = 4$496$1020$1543
Moderately Susceptible Cultivars
r = 0$576$1132$1687
r = 1$568$1114$1661
r = 3$552$1083$1614
r = 4$545$1069$1593
Moderately Resistant Cultivars
r = 0$603$1158$1714
r = 1$594$1141$1687
r = 3$578$1109$1640
r = 4$571$1095$1619

