Article

Development of an Ex-Ante Sustainability Assessment Methodology for Municipal Solid Waste Management Innovations

1
Institute of Infrastructure and Resource Management, University of Leipzig, 04109 Leipzig, Germany
2
Department of Life Cycle Engineering, University of Stuttgart, 70563 Stuttgart, Germany
3
Department of Life Cycle Engineering, Fraunhofer Institute for Building Physics, 70563 Stuttgart, Germany
4
Institute of Systems Sciences, Innovation and Sustainability Research, University of Graz, 8010 Graz, Austria
*
Author to whom correspondence should be addressed.
Sustainability 2018, 10(9), 3208; https://doi.org/10.3390/su10093208
Submission received: 13 August 2018 / Revised: 2 September 2018 / Accepted: 5 September 2018 / Published: 7 September 2018
(This article belongs to the Special Issue Environmental, Social and Economic Sustainability of Waste Management)

Abstract

:
Various municipal solid waste management (MSWM) innovations have emerged in developing countries in face of the challenges posed by increasing waste generation and poor MSWM practice. We present a methodology to assess the potential sustainability impact of MSWM innovations in a holistic manner. The Life Cycle Sustainability Analysis (LCSA) framework and the United Nations (UN) sustainable development goals (SDGs) facilitated the methodology development. The result of applying the methodology to the case of waste bank (WB) in Bandung City shows that WB potentially generates the greatest sustainability impact in the resource recovery phase and the smallest impact in the collection and final disposal phase. All negative impacts could arise in the economic dimension. Surprisingly, WB as a national strategy to achieve 3Rs would not effectively solve Bandung City’s landfill problem. Almost all SDGs would benefit from the WB program under the assumed conditions. This methodology will facilitate the decision-making in MSWM by (1) comparing available innovations to find the optimal solution, (2) identifying the hot spots and taking measures to combat the negative impacts, (3) providing the basis for monitoring the implementation process and the ex-post performance assessment.

1. Introduction

1.1. Motivation

Municipal solid waste (MSW) generally refers to household waste, while it also includes commercial & industrial waste and construction & demolition waste generated from small businesses and institutions [1]. The municipal solid waste management (MSWM) issue has risen as a big challenge for city governors in developing countries or low-income countries [2,3]. Cities in these countries are expecting an increasing magnitude of solid waste generation and challenges along with urbanization, economic development, and population growth [1]. Nevertheless, cities in developing countries often fail to provide sufficient formal waste services to their citizens [1]. The poor SWM practice has led to significant negative impact on public health, environment, and economy [1,4,5]. Facing these challenges, many grassroots or community-based waste management innovations, which aim at solving the local waste problems and are actively participated by private actors or the local community [6], have emerged in developing countries. To name some, the “Plastic Bank” targets at keeping the ocean clear of plastics pollution which operates in Latin America; the “Aobag” aiming at increasing household waste classification and recycling rate with the help of smartphones and intelligent management system in China; the “Waste Bank (WB)” initiative seeking to contribute to the country’s “reduction, recycling, and reuse (3Rs)” target in Indonesia [6].
Nevertheless, it is still questionable whether these MSWM innovations could fulfill the claimed objectives (as argued in a past paper [7]). Moreover, thinking from a system perspective, what other sustainability impacts would be triggered to the whole life cycle of MSWM system is uncertain. Therefore, the potential system-wide sustainability impacts shall be evaluated in a holistic manner. This ex-ante sustainability assessment of MSWM innovations is imperative for the decision-makers who are seeking solutions to sustainable MSWM. Sound decisions should be made in selecting the appropriate innovations and identifying the hot spots for optimization. To this end, this paper is to support the decision-making of MSWM in developing countries on the adoption of MSWM innovations, by assessing the prospective sustainability impact of the proposed innovations at a city scale.

1.2. Life Cycle Sustainability Analysis Framework and Sustainable Development Goals

Certain Weaknesses of the methodological approach for this aim are identified from existing studies on the evaluation of waste management systems. Firstly, most of the studies evaluate the performance of an existing waste management system [8,9,10]. These studies conduct ex-post assessments which are not designed for decision-makers to forecast the potential impact. Secondly, the indicators or indices developed for waste management system assessment (e.g., ‘wasteaware’ benchmark indicators [11] and zero waste index [12]) focus mainly on the output of the waste management system itself, failing to map the dynamic change in sustainability impacts introduced by innovations. Thirdly, almost all sustainability assessments in the field of waste management are at the product-level. Often, the sustainability impact of several technologies (e.g., energy recovery, material recycling, landfill gas utilization, and so on) are assessed and compared [13,14,15,16]. A city-scale assessment which considers the corresponding change induced by the technology is rarely conducted. Last but not least, a holistic sustainability assessment is not a common practice. Like in other fields, the environmental impact assessment predominates in waste management, leaving the social [17] and economic dimensions less studied [18].
Recognizing the methodological need, this paper applies the Life Cycle Sustainability Analysis (LCSA) framework recently proposed by Guinée et al. [19] to the field of waste management. The LCSA framework is a transdisciplinary framework rather than a model in itself [19,20]. Given a specific sustainability question, the LCSA framework identifies and selects the proper tools from the pool of models and tools available, depending on the application area, assessed impacts, and the scope [19]. While built upon the mature Life Cycle Assessment (LCA) approach, LCSA goes beyond LCA by adding expansion in three dimensions [20,21,22]:
  • Broadening the impacts: including economic, social, and environmental impacts.
  • Broadening the scope of analysis: dealing with sustainability questions from product-level, meso-level (city-level and sector-level) to macro-level (economy-wide, national-, or global-level).
  • Deepening the mechanism: including dynamics and causal and trade-off relationships.
However, the three dimensions of expansion have received different levels of advancement. The first dimension of expansion is achieved by the majority of LCSA, by focusing on more than one pillar of sustainability [20,23]. Regarding the second dimension of expansion, the present applications are mainly at product-level [20], implying a need for practice at meso- and macro-level. Furthermore, only a limited number of studies have applied uncertainty analyses, multidecisionmaking or stakeholder involvement. Thus deepening the mechanisms is generally not sufficiently performed [20]. The LCSA remains a conceptual framework which needs further research to make it operational [19,24]. Hence, there is a call for practical examples to put the LCSA framework into practice.
Despite the fact that there are rare applications of the LCSA framework in waste management [23], it is an appropriate framework for the assessment aim of this paper. MSWM is a complex issue embedded in the interconnected environmental, social, and economic system. Applying LCSA to MSWM at a city level is a practical example of broadening the scope to meso-level, which is rare in the existing studies. Thus, this work not only has a practical significance of supporting decision-making, but also contributes to the development of the LCSA framework.
Waste management has a cross-cutting nature with strong linkages with some of the global challenges that the sustainable development goals (SDGs) aim to tackle, such as health, favorable living environment, and sustainable cities. The waste topic is covered by more than half of the 17 SDGs and is well-embedded within them [25]. This paper also brings in the SDGs in the methodology development in order to keep a holistic view of sustainability.
The SDGs were proposed by the Open Working Group of the General Assembly in 2014 following the decision made by the United Nations (UN) member states during the UN Conference on Sustainable Development (Rio+20) in 2012. The 17 SDGs and the accompanying 169 targets integrate a diversity of perspectives, experience, and expertise from civil society, the scientific community, and the UN system [26]. The SDGs aim to guide and contribute to the global transformation to sustainable development within the post-2015 development agenda. Moreover, the SDGs are universal and applicable to all countries regardless of the level of development. This enables the global community to contribute together to create a sustainable future [26]. A broad range of issues are covered by SDGs, implicating a good integration of and balance between the three dimensions of sustainable development and the governance aspect [27]. Therefore, using the SDGs as a guide to select indicators would allow a holistic consideration of all sustainability impact.
However, a great challenge remains regarding how to integrate the SDGs in sustainability assessment. The SDGs represent the global consensual targets and provide a normative basis and reference to map the transition to sustainable development [28]. Though they are further specified by 169 targets and 232 indicators, the SDG framework only reflects the interest and responsibilities at the national level [27]. Many indicators from the global SDG indicator system could not be directly used for measuring the sustainability on a local or regional scale. Despite the difficulty, the academic community of life cycle sustainability assessment has paid efforts in the integration of SDGs. Wulf et al. [29] adopted a bottom-up approach by attributing the indicators of existing LCSA tools at product-level to the SDGs, only to find that not all the SDGs could not be reflected. A top-down approach is deployed by Maier et al. [30] in an ex-post sustainability assessment of development projects. Considering the interlinkages between the 17 SDGs, Maier et al. clustered them into nine impact categories and selected indicators from different sources for each impact category [30]. As this paper is a city-scale LCSA and intends to keep a holistic view of sustainability, the top-down approach by Maier et al. [30] is adopted and adapted to the MSWM system.

1.3. Structure of the Paper
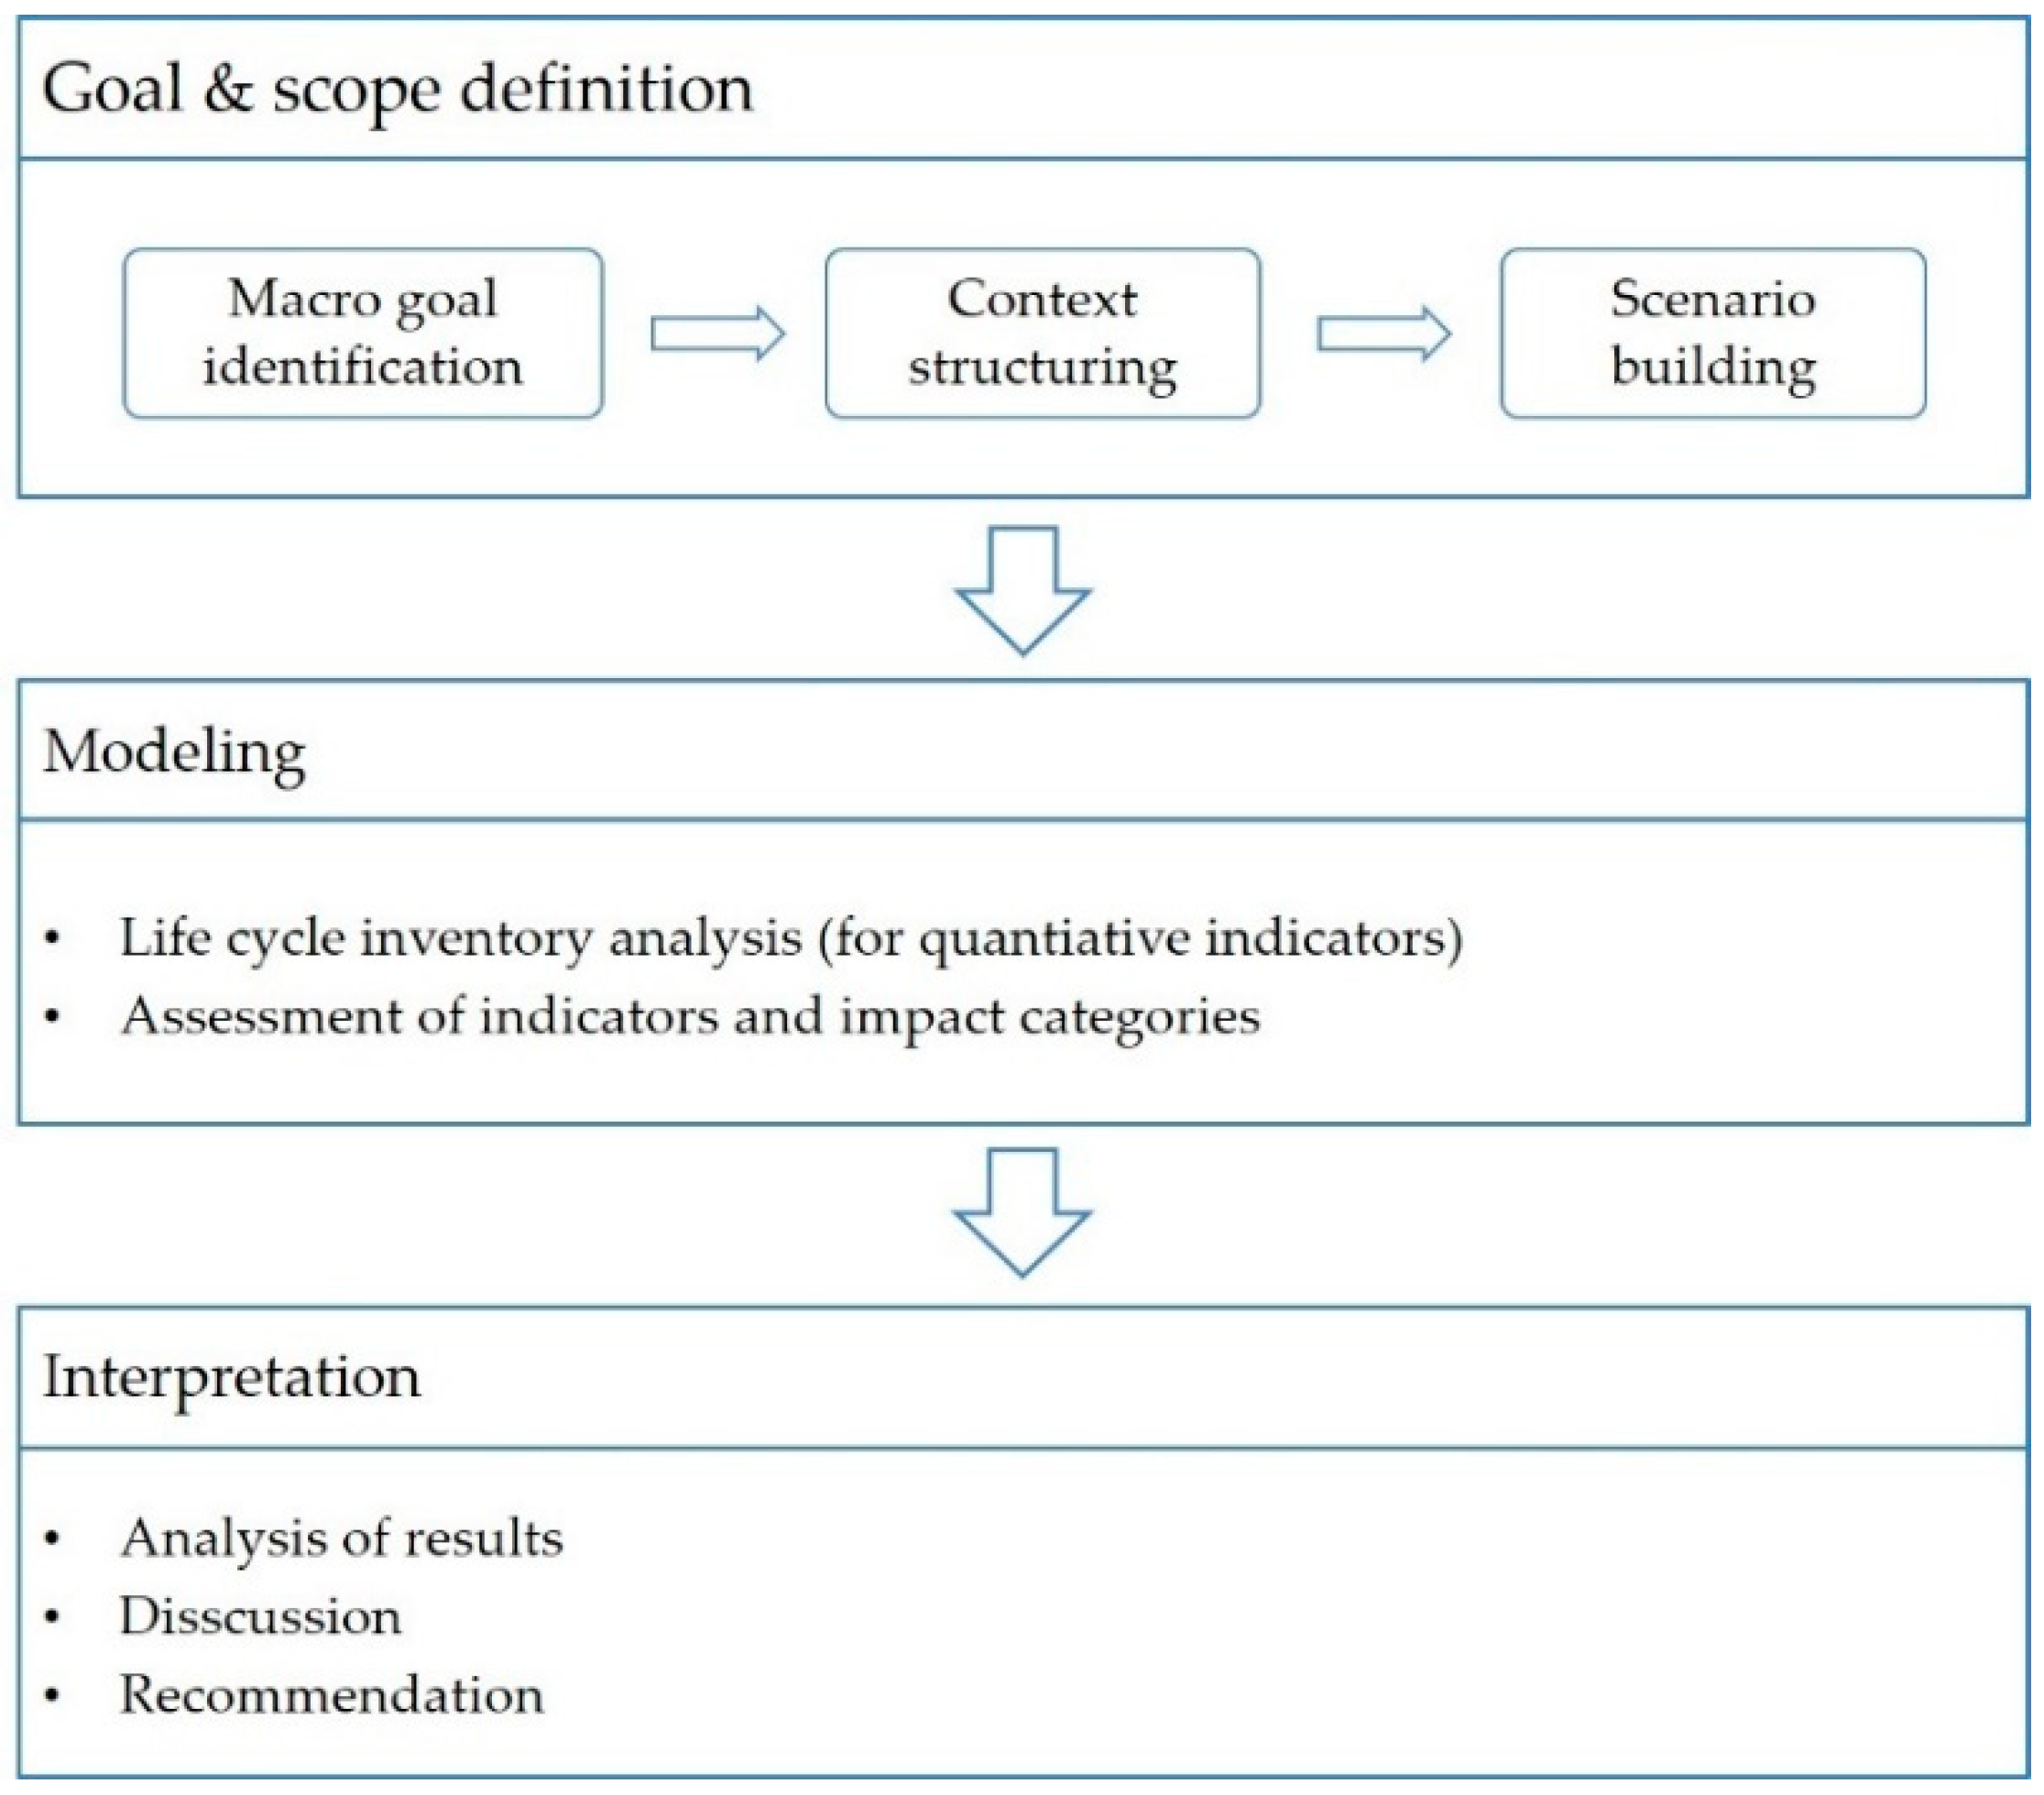
This paper develops an ex-ante assessment methodology based on the LCSA framework for assessing the potential sustainability impacts caused by innovations in MSWM system on a city scale (Section 2). The SDGs are incorporated in the methodology as a guide for selecting the indicators. The developed methodology is then applied to the case of WB in Bandung City, Indonesia (Section 3). A thorough discussion to the significance and weaknesses of methodology is conducted in Section 4. The last section concludes the whole paper.

2. Methodology

Carrying out the LCSA framework comprises three phases: goal & scope definition, modeling, and interpretation [19]. As the LCSA framework remains conceptual, this paper adopts the three-phase procedure and further makes them operable in the MSWM field. Figure 1 presents an overview of the methodology. Firstly, in the goal & scope definition phase, a three-step approach is followed. In the modeling phase, indicators classified by impact categories derived from the SDGs are adopted. Life cycle inventory analysis is carried out in case of quantitative indicators before the impact assessment. The third phase—interpretation analyzes, evaluates and communicates the assessment result.

2.1. Goal & Scope Definition

The goal & scope phase is crucial to a LCSA. The emphasis of the first phase is to define the sustainability questions after a thorough system description. Due to the increased complexity of the nature of the problem, this phase has to be analyzed in a structured way [31]. To reach this aim, a three-step approach is developed based on existing attempts [31,32,33]. The three steps are identifying the macro goal of the city, structuring the context, and building scenarios (as shown in Figure 2).

2.1.1. Macro Goal Identification

Firstly, the macro goal of the city regarding its MSWM shall be identified. The extent to which the innovations contribute to the achievement of the macro goal is one of the main criteria of making decisions. Identifying the macro goal clarifies the demands of the city. Further, it facilitates the selection of the innovations. However, it is necessary to note that the city’s macro goal on waste management is not the goal of the LCSA assessment. It is common that a city has its general goals on MSWM or a masterplan covering MSWM issues. The goal may be phrased like, for example, reducing the landfill pressure, or more broadly, achieving integrated waste management. It would be favorable if the city has a more specific measurement of the goal, for example, reducing the waste volume to landfill by 30% by 2020. In more ideal cases, the city waste sector has already connected its goals to the SDGs, thus enabling a comparison with the assessment results.

2.1.2. Context Structuring

The context here is the broad techno-socio-economic-environmental system where the potential innovations are to be implemented [31]. Firstly, the basic national and regional facts including demographic, geographic, climate, and economic characteristics should be identified, as all these factors affect the choice and formation of the regional MSWM practice. As waste management is a public service provided by the government, it is imperative to examine the legal framework of MSWM in the studied context. For a LCSA of the MSWM system, the special features of waste stream in the local context shall also be identified. All this context analysis narrows down the scope of identifying appropriate innovations and facilitate scenarios building in the following step. Furthermore, this process enables the identification of actors in the system, as well as additional stakeholders that could be approached, either for the collection of opinions or for the sake of data collection.

2.1.3. Scenario Building

After the above two steps, the practitioners are able to identify one or more innovations or technologies that contribute to achieving the macro goal and fit the local context. The next step is to decide on the innovations to investigate and define scenarios.
First, the life cycle of the MSWM system should be made clear. This paper puts forward a simplified life cycle of a MSWM system, despite the fact that waste management practices vary in different regions around the globe. As depicted in Figure 3, five phases are included in the MSWM life cycle: waste generation, collection, transportation, final disposal, and resource recovery. Dealing with the product end-of-life stage, the unconventional life cycle of MSWM includes grave-to-cradle (waste to material recovery) and grave-to-grave (waste to final disposal) processes.
Waste generation is the initial phase. The generated MSW at source (households or commercial areas) may be collected for further treatment or subject to different at-source treatment and disposal. A collection service provided to all citizens is essential to minimize open burning and dumping. The collection service could be provided by formal sector, private, and public sectors. The transportation phase involves the delivery of waste from source to transfer station, from source to segregation facility, from transfer station to landfill, and so on. Waste collection and transportation vehicles are present in different forms. Rail cart, tricycle cart, and cycle cart are some of the common vehicles used in low- and middle-income countries for primary collection, whereas compactor trucks are widely used in Europe. Wastes can end up in several different final disposal methods: landfill, open dumpsite, or thermal treatment. Landfilling and thermal treatment are commonly adopted in high-income countries, while the majority of the MSW in low-income countries are disposed through open dumping [34]. The resource recovery phase comprises material recovery and energy recovery. Sorting center, composter, and mechanical biological treatment facilities are some of the common material recovery facilities [1]. Incineration, gasification, and landfill gas utilization are typical practice of energy recovery [1]. Recourse recovery could happen in or between any of the other four processes. For example, segregating waste at source before the collection process; recycling and reuse in collection process; hand or automated sorting system in transfer station; and incineration for energy recovery at final disposal.
When applying this methodology to a real case, the model could be expanded depending on the context as identified in the previous two steps. The physical features of the waste, mainly moisture, density, and calorific value, which are affected by the waste composition, inter alia, are the important considerations when the city waste sectors choose their waste collection, transportation, and treatment methods [1]. Other factors affecting the selection of innovations include the financial constraints, social-cultural norms, and legal requirements. The expansion of the model based on the current practice formulates the baseline scenario. Furthermore, the model would be shifted after the integration of one or more innovations into the baseline scenario. One should thoroughly examine the technical features of, expert opinions on, and present experience with the implementation of the innovations, and consider how the baseline scenario would be affected (considering not only the material flow, but also the social, economic, and political mechanism). Thus, the comparison scenario could be built. It is important to build scenarios with life cycle thinking, and deliberately design the upstream and downstream processes of the innovations. However, this is an iterative process. If further unidentified change emerges in the modeling phase, the model could continually be modified.
It is at this point that the boundary of the MSWM system in focus and its future development after the integration of the innovations are depicted clearly. Thus, the sustainability questions could be defined, answering which is the goal of the assessment.

2.2. Modeling

The three dimensions of expansion of LCSA should be taken into consideration in the modeling phase [32]. The three dimensions of expansion are: broadening the scope of impacts, broadening the scope of analysis, and deepening the mechanism. The methodology developed here adopts an indicator-based approach. Thus, the modeling phase involves applying the appropriate tools to qualitatively or quantitatively assess the indicators.
In this paper, the SDG framework is used as a guide to identify the indicators due to its holistic perspective of sustainability and strong direct or indirect linkages with waste management issues. After screening the nine impact categories in Maier et al. [30], it is observed that abiotic resource depletion is not considered. (Abiotic) Resource depletion is one of the three end-point indicators in the ReCiPe method [35] and is directly related to SDG 7, 8, and 9. Human society and industries extract resources from nature (SDG 9). Fossil fuels remain the main source of energy supply (SDG 7) which is a key indicator of a prosperous economy (SDG 8). Therefore, abiotic resource depletion as an impact category is included under the environmental dimension, increasing the number of impact categories to ten. It is also worth mentioning that by categorizing the SDGs into impact categories, only the direct linkages are considered to reduce the complexity. In addition, SDG 17 partnerships for the goal is not included as it is not considered as an end in itself. Instead, it is a mean for achieving other SDGs. The indicators from a past paper [11,30] are selected and adapted to the case of MSWM system. In total, 23 indicators are included in this methodology. Table 1 shows an overview of the three dimensions of sustainability, the ten impact categories, the indicators, as well as the assessment methods. If not otherwise mentioned, all the indicators are adapted from Maier et al. [30]. The following part elaborates on the impact categories regarding their general relevance to waste management, as well as indicators selected for the assessment.

2.2.1. Environmental Dimension

Methodologies assessing the impacts in the environmental dimension are among the three dimensions that are mostly developed. The well standardized LCA approach by ISO 14040 [36] could be adopted. Consequently, the indicators from LCA are directly applied.
Climate (SDG 13): The waste sector is one of the four main sources of GHG emissions, mainly CH4, CO2, and NOx [37]. Within the sector, the CH4 emission from the final disposal site is the largest GHG emission source; a large amount of CO2 is emitted during waste incineration and open burning. The NOx production varies in different types of waste treatment [37]. Other than the waste treatment processes, emissions from the waste collection and transportation processes also contribute to the GHG emissions. The indicator for this impact category is global warming potential (GWP) [30].
Terrestrial ecosystem (SDG 2, 15): The waste sector poses threats to the terrestrial ecosystem. Landfilling as the main waste final disposal method occupies a large area of land. Pollutants discharged into the soil during waste treatments lead to terrestrial acidification and ecotoxicity. The indicators for this impact category are: terrestrial acidification potential (TAP) and terrestrial ecotoxicity potential (TETP) [30].
Aquatic ecosystem (SDG 6, 14): Lack of sufficient waste collection and waste treatment as well as dumping waste into the waterbody are common in developing countries. In some open dumping sites and unsanitary landfills, leachate generated from waste degradation is released into the soil, groundwater, and surface water. The most visible issue is the plastics pollution of the ocean. Plastic waste is forming an island in the South Pacific Ocean, threatening the marine ecosystem [38]. However, this is not included in any available LCA impact category, yet. The indicators for this impact category include eutrophication potential (EP), freshwater aquatic ecotoxicity potential (FAETP), and marine aquatic ecotoxicity potential (MAETP) [30].
Abiotic resource depletion (SDG 7, 8, and 9): Waste management as the end-of-life phase could potentially reduce the consumption of virgin materials through proper material recovery. Energy recovery technologies could also generate energy substituting the fossil fuel use. However, the waste management processes at the same time consumes energy. The indicators for abiotic resource depletion are: abiotic depletion (ADP) elements and ADP fossil [30].

2.2.2. Economic Dimension

Poverty (SDG 1): The income of actors participating in MSWM could be affected by the integration of the innovations. To assess poverty, it is worthwhile to examine if the innovations would benefit or harm the population living below the international poverty line. The indicator for this impact category is income of actors below international poverty line [30].
Energy supply & efficiency (SDG 7, 8, and 9): The reason of attributing energy to the economic dimension is that energy is the prerequisite for all economic activities and an indicator for the prosperity of economy [30]. Greater energy consumption and higher energy efficiency are viewed as positive economic impacts, while the corresponding increased resource depletion and emissions are considered as negative impacts in the environmental dimension [30]. In some MSWM systems, energy recovery techniques are applied. In those cases, double counting should be avoided. The indicators selected for this impact category are energy consumption and energy intensity [30].
Growth & employment (SDG 8, 9, 11, and 12): The waste industry provides job opportunities to the society. Waste collection crews, waste transport personnel, and the city waste administration personnel are the typical components of the formal waste sector. The informal sector also provides means of generating income through valuable waste scavenging, cleaning, and trading, despite that the actors in the informal sector often lack social recognition [39]. The number and type of jobs are mainly examined in this category. The indicators under this impact category are job creation, quality of job created, and reduction in vulnerable employment [30].

2.2.3. Social Dimension

Health (SDG 2, 3, and 6): The working conditions of employment generated by the waste sector in developing counties are often poor, posing health threats to the workers. Meanwhile, the emission of pollutant substances into the environment from improper waste disposal often causes long-term health threats to the public. Epidemics, flooding, death, and poison due to waste problems have been reported around the globe, for example the plague-like epidemic after flooding in Surat, India in 1994 was caused by uncollected waste blocked the drains [1]. Another example is the landslide of the Leuwigajyh Landfill in Bandung, Indonesia in 2005, which caused the death of 141 waste scavengers and nearby citizens. The indicators for the impact category of health are: risk of health incidences (including occupational health incidences and accidents) and human toxicity potential [30].
Education & skill development (SDG 4): Knowledge and awareness are important factors for the public participation in more sustainable waste management [40,41,42]. Public education on waste management is considered as one of the most effective ways to reduce household waste [43]. Innovations in the MSWM system could be examined by whether they help to increase the public’s knowledge, awareness, and capacity in participating MSWM. The indicators for this category are provision of training or campaigns, participation of trainings and campaigns, and application of knowledge [30].
Egalitarian society (SDG 5, 10, 11, and 16): Socially disadvantaged groups (women, children, elderly people, disabled people, and so on [30]) should also have a share in the benefits of sustainable development. In the MSWM system, especially relevant groups are the poor and women. The poor stand out in two aspects: low-income households with less access to waste collection services and waste scavengers with poor economic status. Women are concerned specifically in MSWM because housewives are usually the main participants of waste segregation at source and there are many female waste scavengers. Therefore, the indicators for this impact category are inclusion of low-income households in waste service [11], rate of female workers, income of housewives, and inclusion of the informal sector [30].

2.2.4. Operationalization

Among the three dimensions of sustainability, only the environmental assessment which adopts the LCA methodology is readily quantitative. Therefore, the quantitative indicators in the modeling phase firstly undergo an inventory analysis before the impact assessment. Due to the immature status of assessing economic and social impacts at the meso-level and the nature of the ex-ante assessment, the economic and social assessment is designed semiquantitative. The indicators under economic and social impact categories could be qualitatively assessed. This allows soft judgment based on other studies or similar cases when scoring them, if no hard measurement is possible. But these indicators are open for quantification when they are applied in a specific case, given sufficient data.
All indicators are compared between the baseline scenario and the comparison scenario. Regardless of the qualitative or quantitative nature of the indicator, if a positive change, no change, or a negative change is perceived in the comparison scenario against the baseline scenario, the indicators are scored with +1, 0, or −1 respectively. When quantitative, if the change in the comparison scenario is less than 10% of the baseline scenario, it is viewed as no change (score: 0). In the case of an irrelevant indicator or a lack of data, a score of 0 is assigned. The scoring rules are summarized in Table 2.
The indicators under the same impact category share the same weight. Therefore, the score of an impact category is the sum of the scores of the indicators in this impact category divided by the number of the indicators being added up. This is represented by the following equation:
s ( i m p a c t   c a t e g o r y   x ) = s ( i n d i c a t o r   x 1 ) + s ( i n d i c a t o r   x 2 ) + + s ( x i ) i
where, “s” means score and “i” is the number of indicators in the impact category x.
All the 10 impact categories are weighted equally. However, the impact categories and the three dimensions of sustainability are not to be aggregated, in order to maintain insight of the assessment.

2.3. Interpretation

The final phase is the interpretation. The results from the modeling phase are visualized (e.g., by bar charts), evaluated, and communicated with decision makers, the public, or other stakeholders. Recommendations for improvement (especially targeted at the hot spots) of the system are derived. In addition, all choices and assumptions made during the analysis should also be evaluated [32]. An overall conclusion to the LCSA study shall be drawn. However, the conclusions drawn from the research always involves trade-offs between the different dimensions of sustainability.

2.4. Data Requirement

Data availability is a major obstacle for an ex-ante assessment. To tackle this problem, insights generated from other ex-post studies, either in a different context or on a different scale, are of great importance to an ex-ante assessment. As the environmental impact assessment adopts the LCA approach, the energy, material, and emission flows of all processes are needed for the inventory analysis. Data for the processes in the foreground system should be gathered as specific as possible, while average or generic data could be used for the background system [44]. Unlike the indicators in the environmental dimension which consider the complex environmental mechanisms; indicators in the social and economic dimension are mostly straightforward. Data needed are mainly information on the actors (including income, working environment, welfare, training, percentage of female workers, and health risk). Possible data sources are on-site study, local MSWM sector statistics, local academic research, international statistics on waste such as statistics from World Bank and Waste Atlas, expert consultation, stakeholder interview, and so on.
It is important to keep the consistency of data throughout the system, especially when data is collected from different sources. Therefore, cross-checking between different data sources is necessary. Well-documented and verified data should be preferred [44].

3. Case Study

The methodology developed in the previous section is applied to the WB program in Bandung City, Indonesia. Indonesia is a developing country facing challenges in MSWM. MSW in Indonesia mainly refers to household waste and household-like waste (domestic waste generated from small commercial areas and public facilities) [6], which is in line with the general definition of MSW from UNEP [1]. The WB is an MSWM innovation which emerged from the community to tackle waste problems when the public waste service was not effective and efficient. The Indonesian government started to promote the WB program in all cities as a national strategy to achieve the 3Rs. Many WB units have been established in many Indonesian cities. However, the comprehensive system-wide sustainability impacts of the WB are less studied. Therefore, the WB case is an appropriate case for applying the methodology. Bandung City was chosen as the spatial object of the case study for two reasons: data availability and the status of implementing the WB. Bandung City has better data accessibility than other Indonesian cities, which is evidenced by the result of the literature search and consulting students from Indonesia. Furthermore, the WB has been implemented in the city but only covers a small portion of the neighborhood. The present practice could be taken as a pilot project, thus providing data for the ex-ante LCSA of its comprehensive implementation in the whole city.

3.1. Data Source

The data for the LCSA in the case study is primarily collected from four sources: literature review, online database of Bandung City, the website of the WB steering committee in Bandung City, and expert consultation. Literature regarding waste management around the globe, in Indonesia and especially in Bandung City, and WB in Indonesia, were searched for and accessed from Google Scholar. This helps to build the context and scenarios, also part of the inventory analysis. The online database Opendata [45] is the platform used by the city government of Bandung City to publish official statistics. The latest data regarding the waste generation, transportation, and city waste facilities are accessible from Opendata. The steering committee of the current 134 WB units in Bandung City is the Non-governmental Organization (NGO) Hijau Lestari (HL, meaning green sustainability in Bahasa). The HL website [46] provides a detailed introduction to the current practice of WB in Bandung city. Experts conducting research in MSWM in Indonesia were also consulted and provide input for the assessment.
When there is more case specific data available, it is always preferred. Otherwise more general data is used. The data triangulation principle is realized through comparing data acquired from different sources to improve credibility.

3.2. Goal & Scope Definition

3.2.1. Macro Goal Identification

The national law of the Republic of Indonesia No. 18/2008 on Waste Management has set the national waste management guideline: shifting the paradigm of collect-haul-dispose into a treatment relying on waste minimization and handling through the 3Rs strategy [6]. The 3Rs is a trending MSWM strategy in East and Southeast Asia aiming to reduce the waste generation and depletion of natural resources. 3Rs measures are believed to be able to reduce more life cycle environmental impacts of waste than the end-of-pipe treatment methods like landfilling and incineration [47]. The Bandung City Masterplan 2011–2031 [48] sets the development plan for the urban waste management infrastructure. It highlights the urgency of releasing the pressure on the current landfill Sarimukti by optimizing it and constructing new ones. The plan focuses mainly on infrastructure, which is consistent with the national 3Rs strategy. Apart from that, a quantitative macro goal of MSWM in Bandung City is not in place. The connection to the SDGs is not yet made.

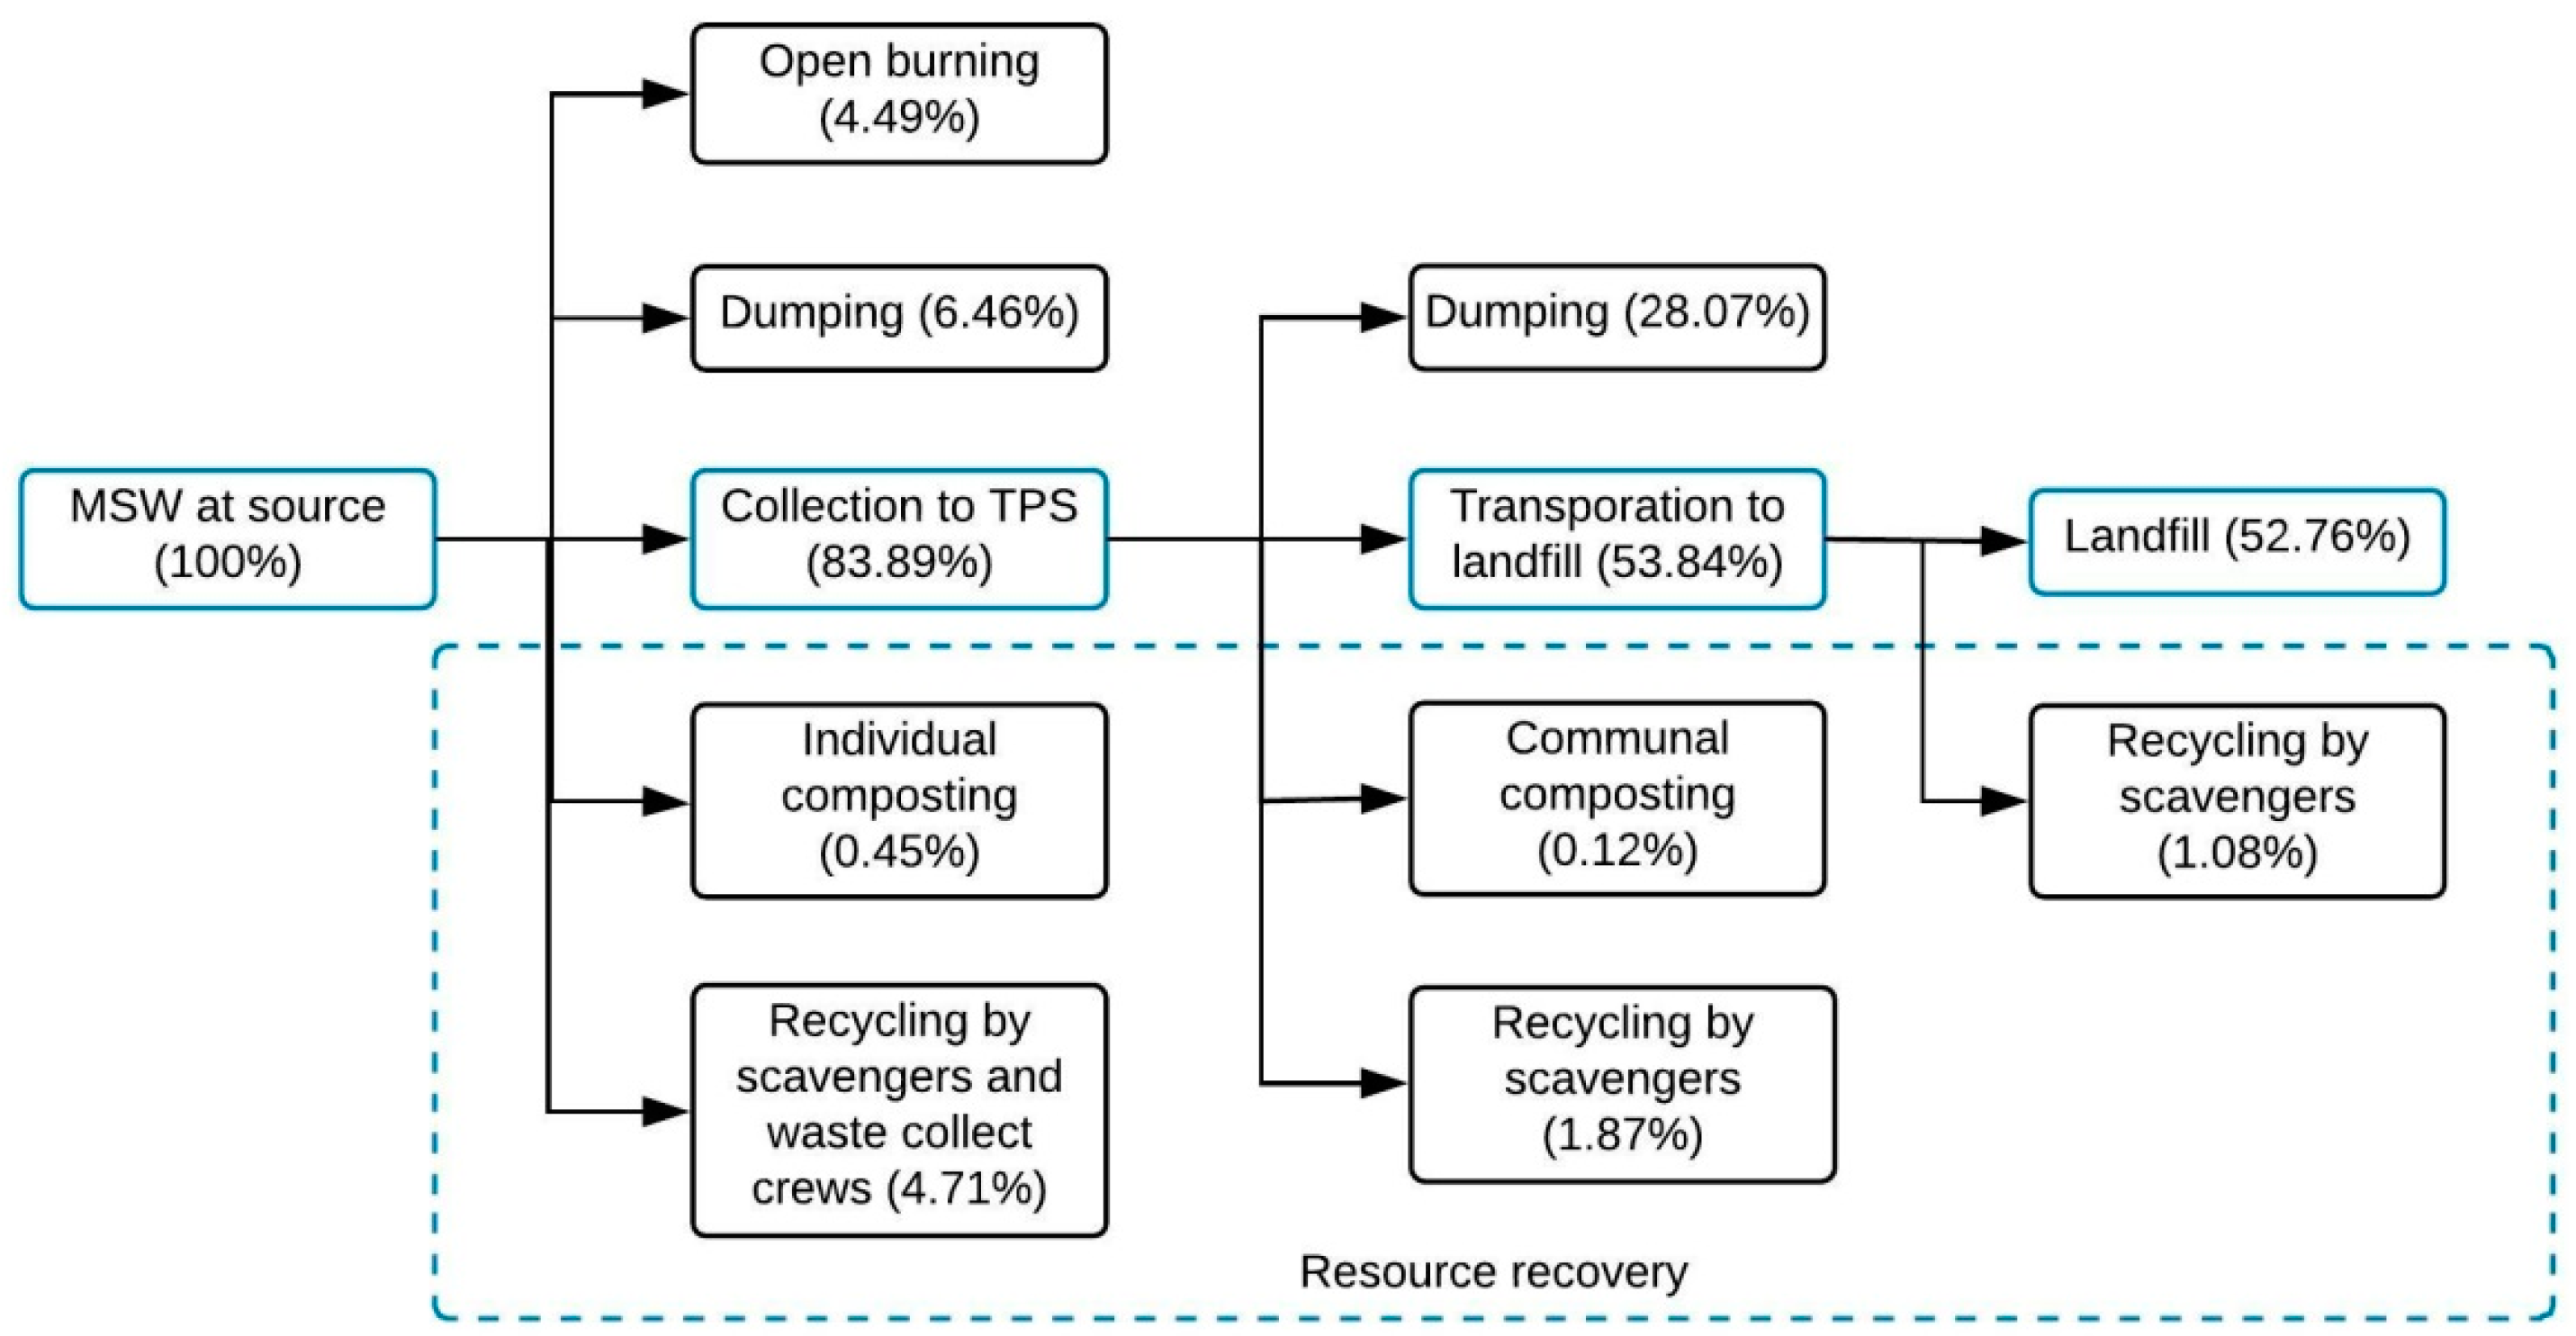
3.2.2. Context Structuring

Indonesia is the world’s largest archipelagic country comprising of more than 10,000 islands with a total area of 1.9 million km2 [49]. Most of the territory has a tropical climate: hot and humid. Indonesia has the world’s fourth largest population (260 million, 2017 estimated), 87.2% of which is Muslim [49]. Though Indonesia was the world’s eighth biggest economy in 2017 [49], 10.9% of the population is living below poverty line [50]. Bandung City is one of the political, economic, and social centers and the third most populated city (2.5 million) in Indonesia [49,51]. Electronic, furniture, and textiles industries are the major contributors to Bandung’s GDP, and absorb a large amount of local labor. The city also has a vision to make itself an example of a sustainable smart city.
The MSWM in Indonesia has a decentralized nature [52]. The national law No. 18/2008 is the guiding legislation on waste management [53]. The government regulation No. 81/2012 regulates the management of MSW. The WB is promoted as a national strategic program for the 3Rs and follows the guidelines set by the regulation of MoE (Ministry of Environment) No. 13/2012. The two major local regulations on MSWM in Bandung City are No. 11/2005 on order, cleanliness, and beauty, and No. 09/2011 on waste management [54]. The government-owned sanitation company—Perusahaan Daerah Kebersihan (PDK)—was established under the regulation No. 02/PD/1985 (further amended into No. 14/2011) and is regulated by the mayor’s regulation No. 101/2006 [54].
The MoE is responsible for the control and monitoring of MSWM at the national level, while the Ministry of Public Works takes charge of the infrastructure planning and construction [55]. In Bandung City, the responsibility of MSWM is mandated to the department of Environment and Sanitation. The local sanitation company PDK only takes charge of collecting and transporting the waste from transfer station (TPS, abbreviated from Bahasa) to final disposal site. The waste collection services from household are often organized by community or residential managers.

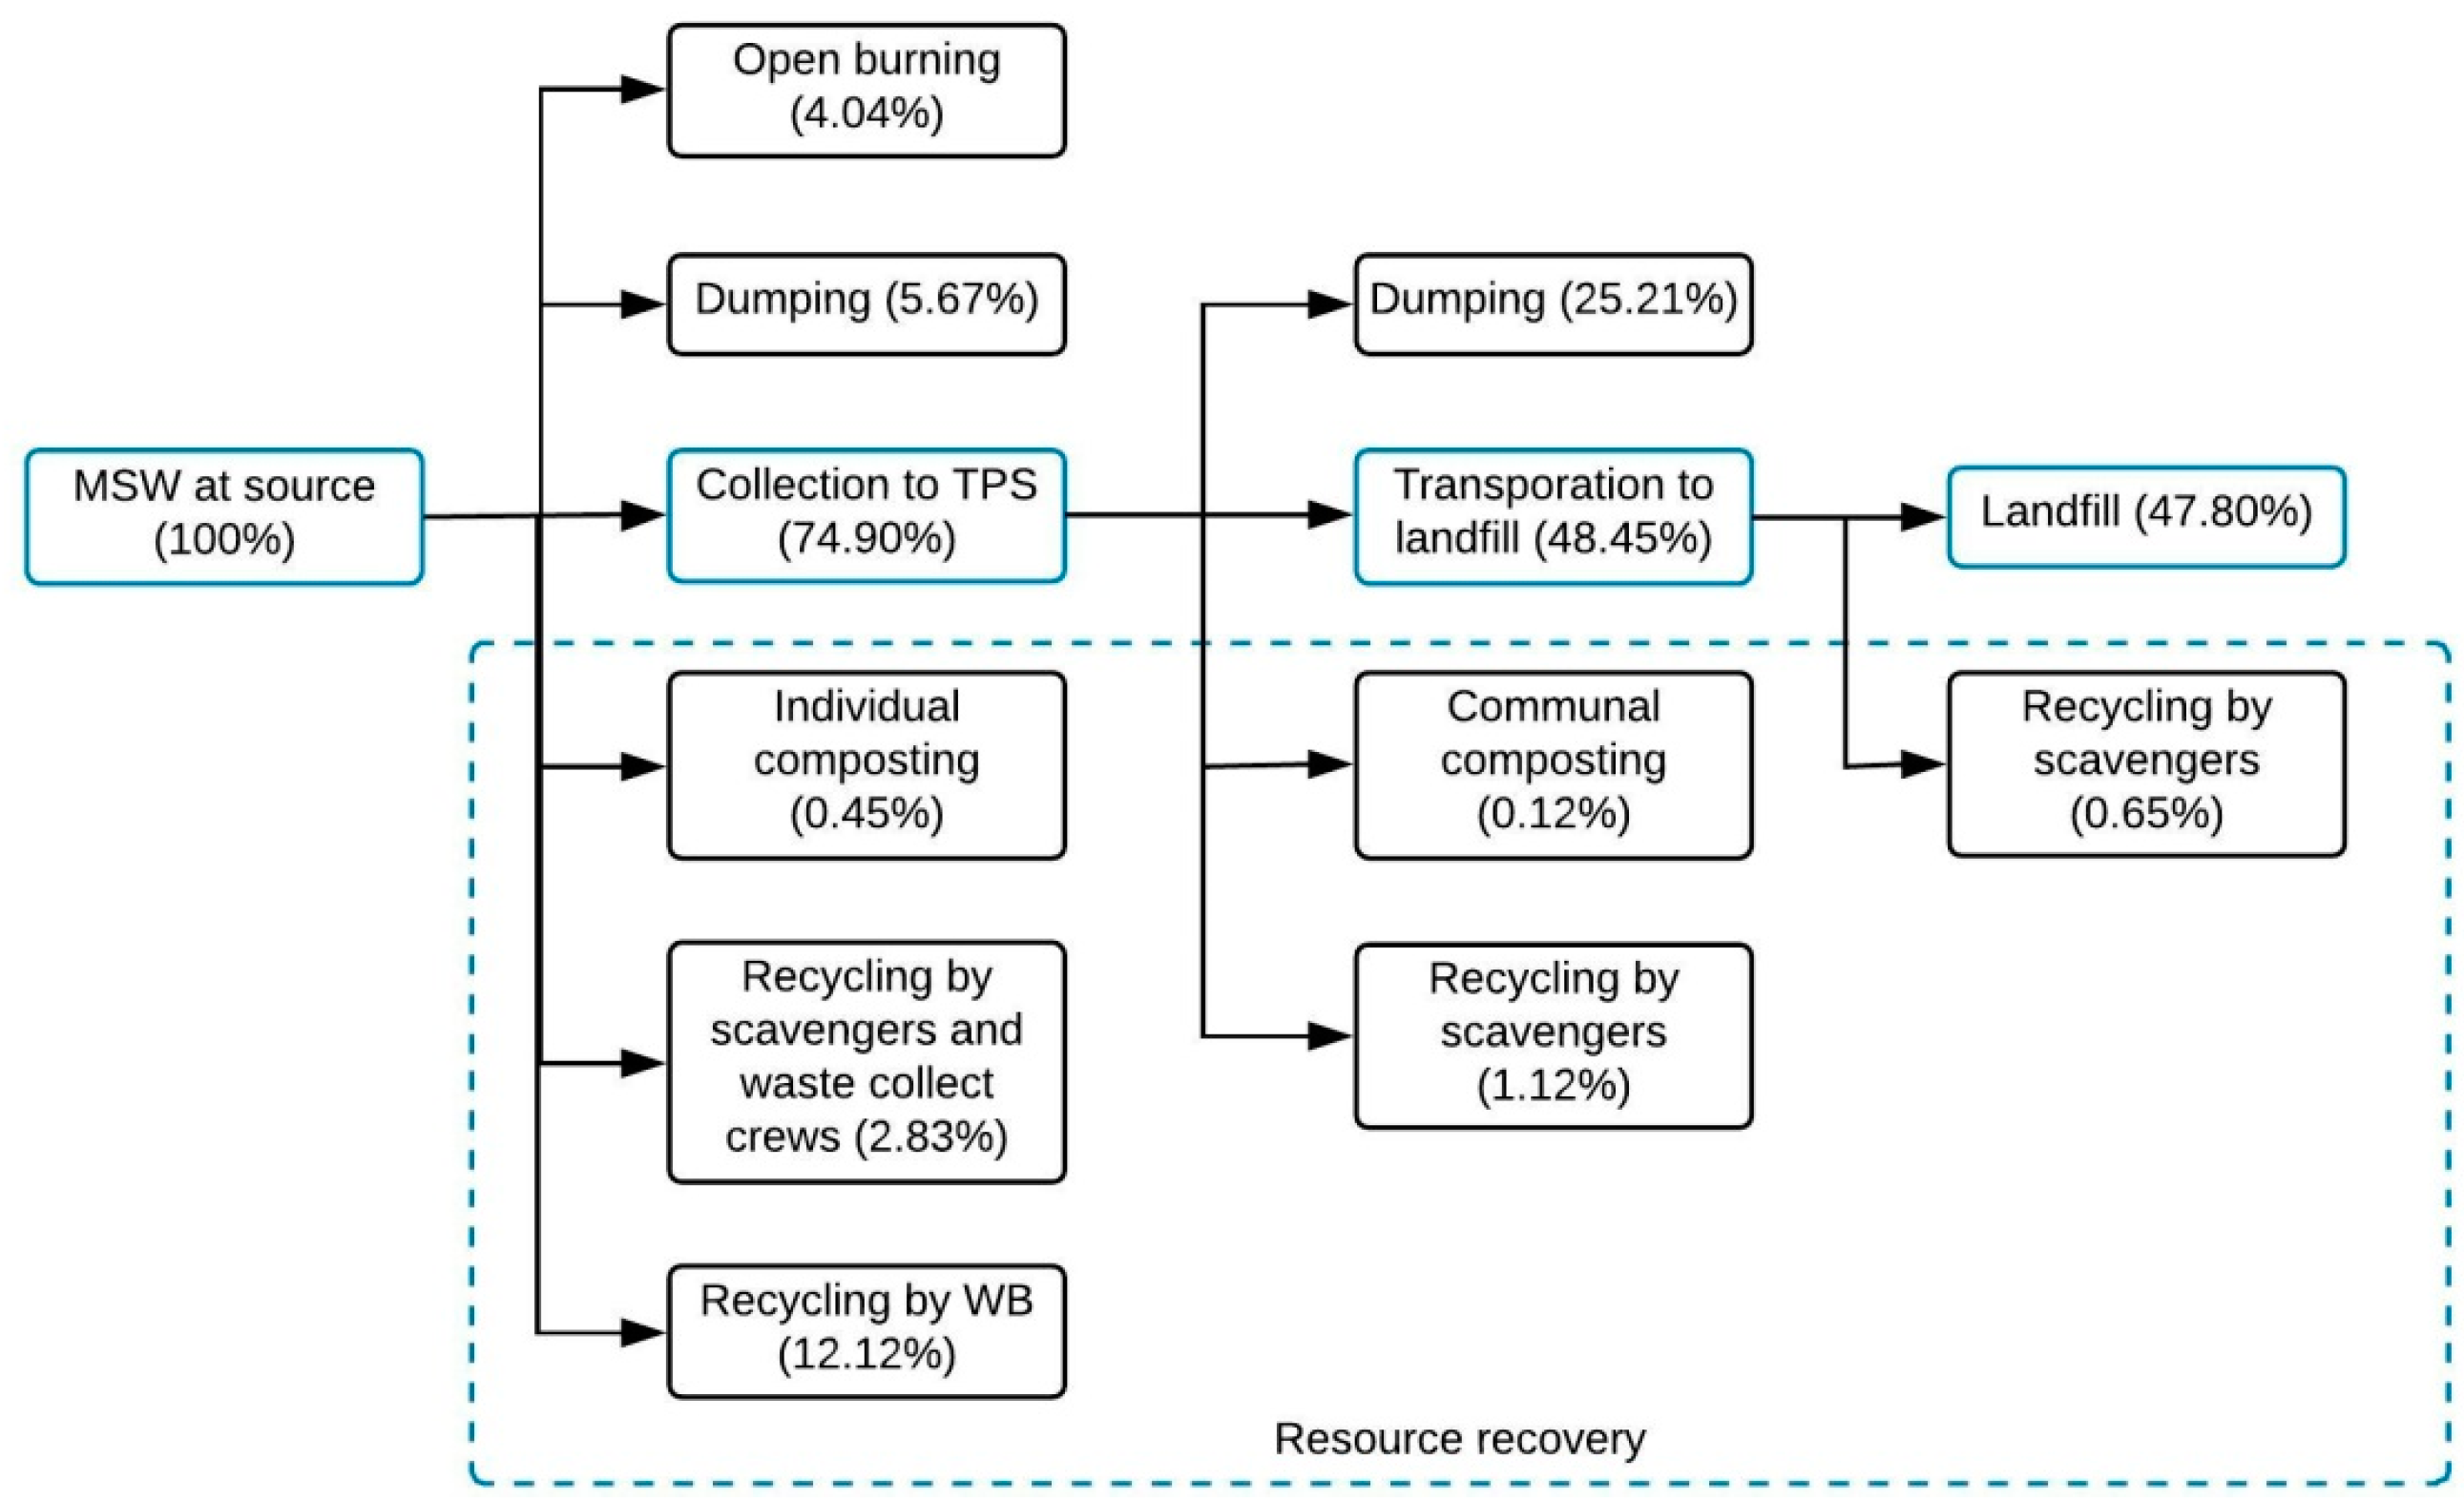
3.2.3. Scenario Building

After identifying the macro goal and the context, two scenarios were formed in this step: a baseline scenario and a comparison scenario that integrates WB. The baseline scenario is first formed on the basis of current practice in the MSWM life cycle in Bandung City. Then a thorough investigation of the WB program was carried out. The comparison scenario was formed taking into account the possible change after the integration of the WB into the baseline scenario. Since this study only aims to test the methodology on a specific case, the preselection of innovations based on the goal identification and context structuring was not carried out.
The five life cycle phases in the baseline scenario:
Waste generation: Bandung City generates 1600 ton MSWM per day, which corresponds to an average waste volume of 0.64 kg/cap/day [56]. This is comparable to the national statistics of 0.699 kg/cap/day [57]. Organic waste accounts for 52% of the total MSW generated. The share of inorganic waste (paper, plastic, metal, glass textiles, and rubber) is 35.7% [58]. It is found that the recycling of textiles and rubbers is not common in developing countries [39,59]. Therefore, the recyclables in this paper only consists of paper, plastic, glass, and metal waste. Only 60–70% of all MSW generated end up in landfill which is operated by the public waste management sector in Indonesia [55]. The remaining uncollected MSW is handled at source by households mainly through open burning and dumping practices. In Bandung City, 16.11% of the total MSW generated is not collected by PDK. Waste segregation at the source is not common in Indonesia [60]. Households with low income are more willing to segregate their household waste and sell the recyclables to the informal sector [58]. The material recovered by the informal sector at source in Bandung City is 4.71% of the total amount and individual composting accounts for only 0.45% [55].
Waste collection: In Bandung City, the MSW collected from households or other sources is firstly sent to 154 TPS and stored there before being transported to the final disposal site [61]. Door-to-door household waste collection is often self-organized by the community or the residential manager. Without segregation at source, the households temporarily place their waste in containers of various forms (e.g., concrete, plastic or metal waste bins, plastic bags, or used cartoon boxes). The waste collection crews hired by the community collect this waste and load it into handcarts or small trucks [62]. The regulation of the Ministry of Public Work No. 03/PRT/M/2013 requires that the waste collection frequency must be every 1–3 days [63]. The shares of different types of waste at the TPS are different from the ones at source (see Table A1).
Waste transportation: as identified in the context, PDK is responsible for the transport of the waste stored in TPS to the final disposal site; 29 trucks are used for this task [64]. On average, these trucks drive to the landfill 192 times a day [64]. There are 382 truck drivers and transport personnel employed [60]. A large part of the waste is reduced during the collection and transportation process. 1.87% of the total MSW generated is recovered by the informal sector and another 28.19% is disposed improperly before it reaches the final disposal site [58].
Waste disposal: The final disposal of the MSW collected in Bandung City is landfilling. The only currently active landfill—Sarimukti Landfill—is 45 km away from Bandung City. With a total capacity of 25.20 hectares, it is jointly used by Bandung City, Cimahi City and West Bandung Regency. Sarimukti landfill is a controlled landfill with stabilization ponds for the biologically treatment of leachate [65]. Incineration or landfill gas utilization does not take place. Starting its service since 2006, Sarimukti Landfill is reaching its capacity and is expected to be closed in a few years [40]. Due to this fact and the difficulties in setting up new ones in the short term, it is perceived that waste reduction initiatives must be implemented [63]. Other final disposal means are open burning and dumping.
Resource recovery: There are mainly two types of material recovery activities in Bandung City: the recycling of inorganic waste and the composting of organic waste. Two forms of waste recycling are identified in Indonesia: recycling at source and after MSW collection [39]. Both flows involve the participation of the formal and informal sector, while the informal sector plays a more significant role. Waste scavengers and waste collection crews are those that directly separate the recyclables from other MSW. Scavengers are active at many locations, for example, in community, TPS, and landfills. The waste collection crews receive the MSW from the households. The analysis of the waste flows shows that the recycling of inorganic waste in Bandung City reaches a rate of 7.66% taking into account the recycling activities in all processes. Composting takes place on an individual and communal level. Some households or communities compost their organic waste and use the fertilizer produced in the garden. This individual composting at source disposes 0.45% of total MSW generated [58]. There are 5 TPS with communal composting, which process a total of 1726.15 m3 of organic waste (data from 2015) [66]. A total of 1.89 tons of organic waste (0.12% of total MSW generated) is composted every day.
The baseline scenario is based on the analyzed current MSWM practice above in all life cycle phases in Bandung City. The activities and waste flows in the baseline scenario are depicted in Figure 4. Detailed waste flow numbers (see Table A1) and assumptions can be found in Appendix A.
Waste Bank: The WB is a community-based initiative popular in south-east Asian countries. It works like a normal bank where the account holders can deposit and withdraw cash whenever they want. The only difference is that the WB receives valuable waste instead of money. Community members can open their accounts and bring their recyclable waste to the WB. The waste is weighed, converted into a monetary value according to the value of the different types of waste and added to the collectors’ account. The collected waste is then transported to waste collectors and enters the value chain of the recycle goods. Waste collectors are often more willing to buy the collected waste from the WB units. The reason is that WB units receive recyclables directly from households which are relatively clean, sort them into categories, and sell large quantities of waste regularly [46]. 134 WB units have been established in 18 out of 30 districts in Bandung City [62]. More than 2000 accounts have been set up in the WB and this number continues to grow [46]. Depending on the size, each WB unit has 5–70 customers [46]. Considering that the city has 2.5 million inhabitants, there is still great potential for WB to grow and exert the impact on the MSWM system.
To build the comparison scenario, the potential change in waste streams in the baseline scenario after the introduction of the WB must be analyzed. The WB receives recyclable waste from the households at source, consequently leading to changes in the waste flows throughout its entire life cycle. With an assumed public acceptance of the WB at 40%, the activities and waste flows in the comparison scenario are presented in Figure 5. For detailed waste flow numbers (shown in Table A2) and assumptions see Appendix A.
The goal of the case study is to assess the potential sustainability impacts on the whole MSWM system in all life cycle phases caused by the implementation of more WB. The foreground system of the LCSA in this case is as shown in Figure 4 and Figure 5. In addition to the changes in waste flows, Figure 5 has an extra process—recycling by WB. All processes in Figure 4 and Figure 5 can be allocated to the five phases in the life cycle of MSWM (Figure 3). All composting processes (individual or communal) and recycling (by scavengers or WB) are part of the resource recovery phase. Open burning at source, dumping at source, dumping at TPS, and landfilling are in the final disposal phase. The background system includes the recycling chain of recyclable waste, comprising of the downstream processes of recycling, including transportation of recyclables to the secondary material production factories and the production of secondary materials and so on.

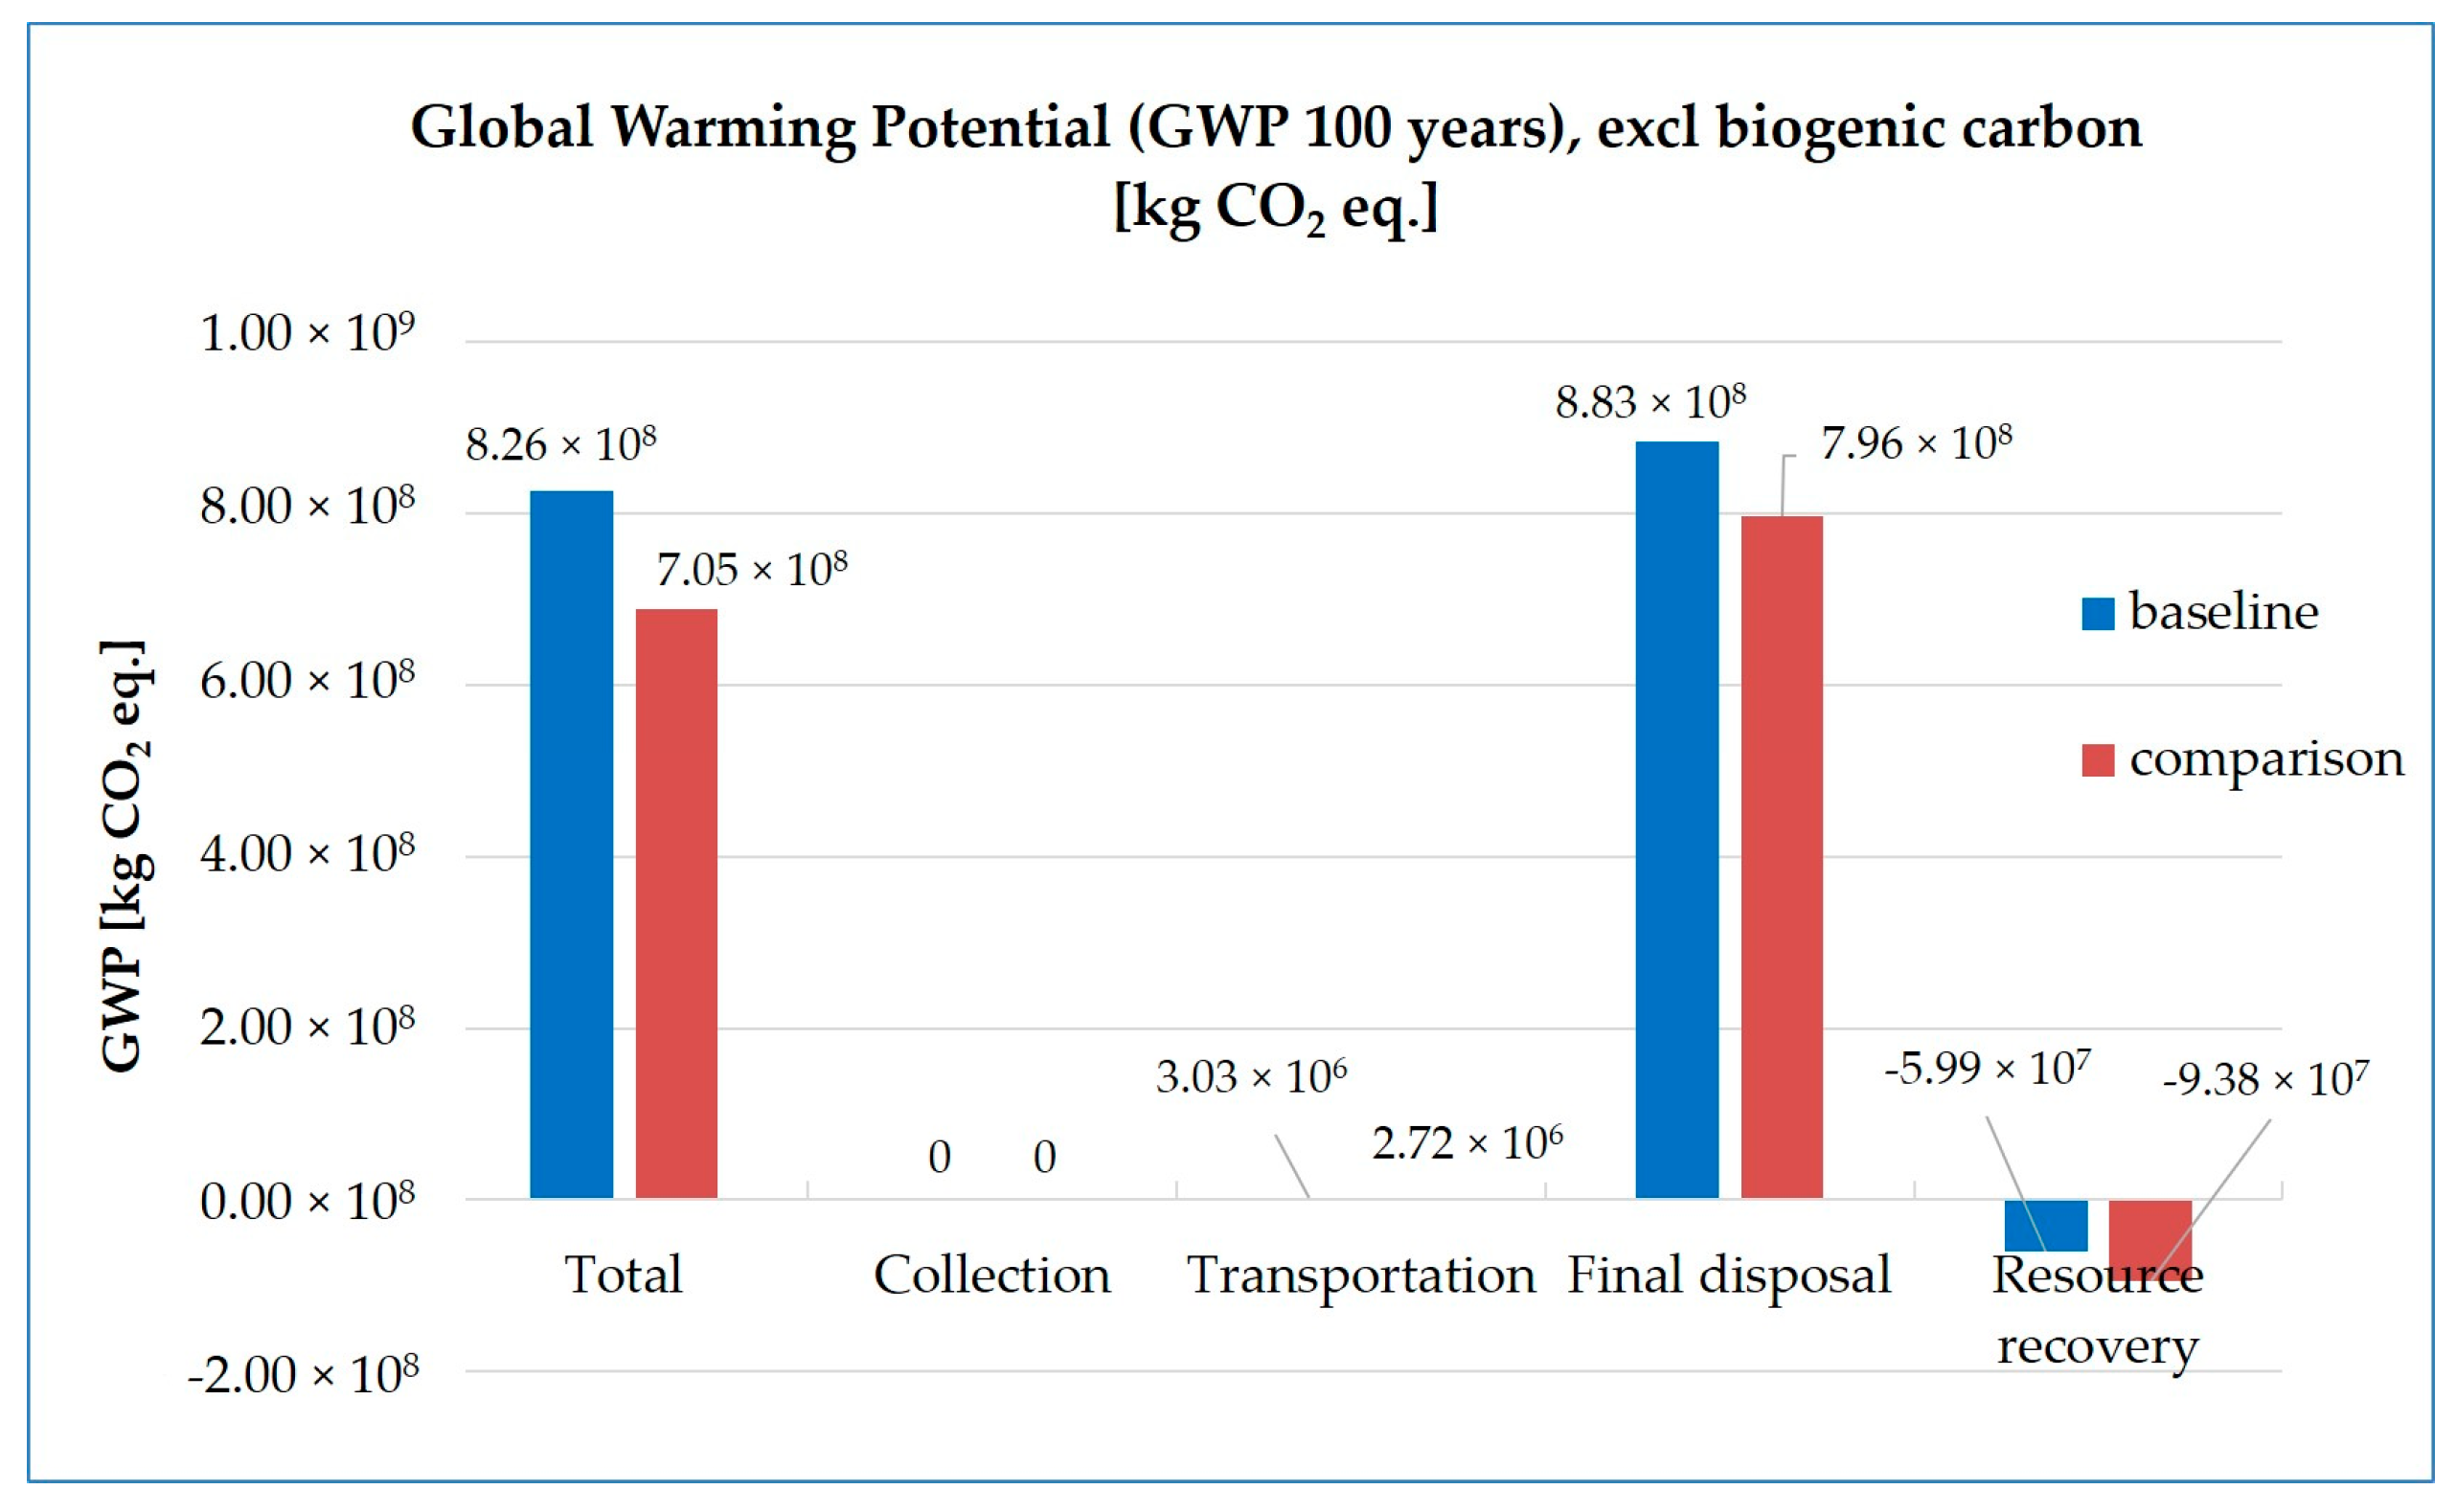
3.3. Modeling Results

Following the instructions set in the methodology, the environmental impacts are assessed by modeling the baseline and comparison scenario in the LCA software—GaBi [67]. The functional unit is defined as the amount of MSWM generated in Bandung City per year. Site-specific data is used as much as possible to model the scenarios. The recycling chain as the background system is also included in the model by incorporating the generic models of recycling value chain from the GaBi database. The modeling does not include the environmental impacts of capital goods (e.g., production of transporting vehicles and construction of landfill). Due to that only manual labor is involved in the collection phase, no environmental impact is estimated in the collection phase. The settings and data sources of the MSWM system models in GaBi can be found in Appendix B. The characterization factors applied are mostly from the CML 2001 nonbaseline method [68]. The only exception is TAP from ReCiPe 2016 [35], because the CML does not distinguish terrestrial acidification from aquatic acidification. The impact category climate is taken as an example of the environmental dimension to present the result (Figure 6). The greatest contribution to the GWP is the final disposal phase. All the phases other than collection generate less GWP in the comparison scenario than in the baseline scenario. The overall GWP throughout the life cycle decreases by 14.65%. In the transportation, final disposal and resource recovery phase, the GWP decreases by 10.10%, 9.83%, and 56.71%, respectively. The transportation phase and resource recovery phase are scored with “+1”. Less than 10% of the GWP is reduced in the final disposal phase, so it is scored with “0”. The overall scores of this impact category are presented in Table 3. The scores suggest that positive changes in the GWP would occur in the transportation and resource recovery phase, while no change is perceived in final disposal phase.
The assessment of the economic and social dimension is mainly based on the evidence found in the relevant literature and are exemplarily shown through the impact category poverty. The only group of actors that is identified living in poverty is the waste scavengers who mainly involve in resource recovery phase. Waste scavengers stand in the bottom of the recycling chain and are the most vulnerable actors. 87% of the waste scavengers gain an income between $1.58 and $3.6 a day [53]. More than half of the waste scavengers at landfill take scavenging as their main source of income [53]. There are also city inhabitants who have formal jobs joining the waste scavenging to earn extra income [39]. Thus, it could be inferred that those living on waste scavenging live below or near the international poverty line ($1.90). After the WB is introduced into the system, they are predicted to face the risk of losing income due to the reduced amount of recyclable for scavenging if no measures are taken. Therefore, in the resource recovery phase, it is scored with −1. Other phases involve no people living under the international poverty line and are not relevant for this indicator. Thus, they are scored with “0”. Table 4 presents the scoring of poverty. Negative impacts on poverty are expected in the resource recovery phase, while no observable change would happen in the collection, transportation, and the final disposal phase. Table 5 summarizes the aggregated scores of all impact categories. The range of the scores is between −1 to +1. Negative scores suggest negative impacts, whereas positive scores indicate positive impacts. The scores of all indicators are listed in Table A3 in Appendix C.

3.4. Interpretation

The assessment results are visualized through a set of bar charts (see Figure 7). The 10 impact categories and their corresponding scores are shown for each life cycle phase. With these bar charts, the positive and negative impacts are clearly distinguished.
The impact categories in the collection phase (Figure 7a) and final disposal phase (Figure 7c) received the same aggregated scores. Only slight positive impacts on the health, education & skill development impact category in the social dimension would occur in these two phases. The improvement in health is attributed to the reduced work load of waste collection crews in the collection phase and a lower probability of negative health outcomes in the final disposal phase. The improvement in education & skill development would be expected when households start to apply the knowledge of waste management they learned through the education campaigns held by the WB. All other impact categories are hardly affected by the implementation of the WB. The reason of no impact in the environmental dimension in the collection phase is that it only involves manual labor and no primary energy is consumed. The final disposal phase includes the disposal of waste through open burning, dumping, and landfilling. Despite the fact that less waste flows to the final disposal phase, the reduced environmental impact and primary energy consumption are not significant enough to be counted as a positive change. In terms of the SDGs, the WB could contribute to the achievement of SDG 2, 3, 4, and 6 in the waste collection and final disposal phase.
The transportation phase (Figure 7b) has positive impacts in the environmental dimension and social dimension, and a negative impact on the economic dimension. All the environmental categories would see a positive change because less waste would be transported. The impact category health in the social dimension foresees an improvement. The economic impacts are negative due to the reduced energy consumption which is an indicator of economic prosperity. The impact of WB in the transportation phase can contribute to SDG 2, 3, 6, 13, 14, and 15, while it has a contradiction in SDG 7, 8, and 9 (both contributing and impairing).
Not surprisingly, most of the impact of the WB happens in the resource recovery phase (shown in Figure 7d). Positive impacts could be expected in all impact categories in the environmental and social dimensions. The recycling of waste and the avoided virgin material production would generate great environmental benefits. The WB would also help improve public knowledge in waste management, health, and the egalitarian society. However, the economic impact is mixed. The impact categories poverty and energy supply & efficiency are negatively affected. The implementation of WB has a possibility to deteriorate the economic status of waste scavengers. Because the use of secondary material substitutes the production of virgin materials, less energy is consumed, indicating a negative economic impact. The implementation of WB can contribute to SDG 2, 3, 4, 5, 6, 10, 11, 12, 13, 14, 15, and 16 in the resource recovery phase. Meantime a contradiction in SDG 7, 8, and 9 and a weakening in SDG 1 are predicted.
Throughout the life cycle of the MSWM system, the environmental and social dimensions expect no negative impact, while the negative impacts relate to the economic dimension. The WB program could contribute to almost all SDGs except for SDG 1, 7, 8, and 9 under the assumed condition in the case study. The contradicted impact to SDG 7, 8, and 9 reflects one of the instinct trade-offs among the SDGs: resource consumption and economic development.
Before putting forward recommendations, it is worthwhile to revisit the macro goal of Bandung City: reducing landfill pressure, constructing new landfills, and improving the implementation of the 3Rs. The WB is expected to reduce the volume of waste at source and release the landfill stress [69,70]. The results of the case study suggest that the WB can contribute to the macro goal to a certain degree. The recycling activities could be encouraged from 7.66% to 16.72% of the total waste generated, considering the total fraction of recyclable waste is 30.3%. However, it is hard to judge whether the WB is an effective solution to the current landfill problem in Bandung City. It is predicted that less than 5% of the total waste generated could be reduced from landfilling after the implementation of WB under assumed condition, as shown in Figure 4 and Figure 5.
Based on the assessment result, the city governors in Bandung City could expect an overall improvement in the sustainability of the MSWM system after the implementation of the WB on a city scale. However, extra attention must be paid to the hot spots. Some recommendations that would improve the hot spots are put forth:
  • The informal sector actors, especially the waste scavengers, should be included. The current WB program does not consider this vulnerable group. Indeed, community-based initiatives and NGOs are recognized as an important approach to formalize the informal sector [71]. More measures must be taken to empower the informal sector actors and absorbing them in the WB program could be one of them.
  • To improve the environmental impact at the final disposal phase, the government should investigate measures to prevent uncontrolled waste disposal at source (open burning and dumping), as well as enhance the management of TPS and transportation process as more than 20% of total MSW is disposed improperly from this process.
  • Negative economic impact must be taken into consideration. Trade-offs have to be made between the negative economic impact and other benefits in the social and environmental dimensions.
  • Along with the WB program, the city governors shall also seek for other innovations dealing with organic waste in order to reduce the city’s reliance on landfilling more effectively.

4. Discussion

This paper develops a methodology under the LCSA framework for prospectively assessing the sustainability impact of innovations in a MSWM system at the city level. It has both theoretical and practical significance. Theoretically, it expands the range of the application of the LCSA framework to the waste management field and provides an example of operationalizing the LCSA framework at meso-level. In addition, it applies the SDGs to sustainability assessment, enabling the possibility of measuring the contribution of a local innovation to the SDGs. The practical significance of this methodology is to facilitate sound decision-making in MSWM by (1) selecting the optimal innovations for a sustainable MSWM, (2) improving the quality of the innovations by identifying the hot spots and taking measures to combat the negative impacts, (3) providing the basis for monitoring the progress and ex-post assessment of the innovations.
There are identified weaknesses of the methodology that need to be further improved.
The indicator system adopted in this methodology has the potential to be further developed. The impact categories are derived from the SDGs, intending to cover as many aspects of sustainability as possible. The indicators are selected based on previous research and adapted to the MSWM system. However, there may be some other aspects not being covered. As Wurf et al. [29] observed, it is problematic to assign the social-LCA and Life Cycle Costing (LCC) indicators at product-level to the SDGs which focus on a country-level. For example, the financial sustainability of the WB and government MSWM cost in the case study cannot fit in the indicator system and thus are not assessed. Besides, the indicator system is not meant to be exhaustive. Experts and practitioners are encouraged to further supplement the indicator system. Another problem is that some indicators may be positively interpreted in one sustainability dimension while negatively in another. One example is the indicator energy consumption. More energy consumption indicates a more prosperous economy, meanwhile generates negative environmental impact.
The different maturity of tools assessing environmental, economic, and social impacts causes inconsistency. The environmental assessment is quantitative using the mature LCA tool, whereas the economic and social assessment is mostly qualitative. Soft judgment which is often subjective is used instead of hard measurement. This inconsistency calls for more methodological research in the social and economic life cycle assessment beyond product-level.
The implicit equal-weighting of life cycle phases leads to the problem of overinterpretation or underinterpretation of the impact. One example is the GWP in the transportation phase and final disposal phase in the case study. Despite that more GWP is reduced in the final disposal phase, a positive impact is interpreted in the transportation phase, and no impact is interpreted in the final disposal phase. If one only reads the results, it is easy to conclude that more environmental benefit is generated in the transportation phase than in the final disposal phase. This problem again is rooted in the inconsistency between the assessment methods of the three dimensions.
Regarding the three dimensions of expansion of LCSA compared with LCA, this methodology accomplishes the first two expansions: impact and scope expansion. The third expansion—deepening the mechanism—is not explicitly stressed in the methodology. As in the case study, a major weakness of the scenario building is that no behavioral change of actors is taken into consideration. This presents mainly in two aspects: firstly, the recycling activities by the waste scavengers would not be proportionally affected by WB (as assumed in the case study). One possibility is that with more recyclables being recycled at the source, the recycling potential at transfer stations and landfill would greatly decrease. This would force the waste scavengers either to move their scavenging activities upwards along the MSWM life cycle or quit the business. Secondly, the case study builds a comparison scenario only with an assumed 40% public acceptance. However, the social acceptance of a project interplays with the perceived effectiveness by the public [7] and the effects of trainings and education. If the program is properly implemented and perceived by the public as effective, along with the increased environmental awareness and knowledge, the public participation in WB would increase. This would also increase the waste segregation rate at source and reduce the phenomenon of improper waste disposal such as open burning and dumping. On the contrary, the amount of waste being delivered to landfill would increase [72]. Nevertheless, while applying the methodology in specific cases, one should incorporate the third expansion as much as possible. Deepening the mechanism requires that the practitioners take into consideration not only the physical changes, but also the economic, behavioral, cultural, social, and political mechanisms [32]. In addition, in ex-ante assessments, it is favorable to consider future trends in the economic, social context.
Collecting reliable data is a great challenge to the application of the methodology. The first reason is that different definitions of MSW are adopted in different countries. Even when general data is available, one should interpret it with caution. Secondly, the insufficient waste service in developing countries makes data collection more difficult [5,55,73]. In the case study, the data is collected from sources that vary in years and some are less recent (2009–2016). Though the data sources are considered reliable and the data triangulation principle is applied as far as possible, concerns regarding whether the data reflects the up-to-data situation still remain. Hence, it is recommended to conduct a material flow analysis in the city under investigation beforehand, given sufficient time and resource.

5. Conclusions

The MSWM challenges in developing countries have given rise to various innovations. However, what sustainability impacts these innovations would cause to the MSWM system at a city scale remains to be systematically investigated. In this paper, the LCSA framework and the SDGs are incorporated in the development of an ex-ante sustainability assessment methodology for innovations in a MSWM system. The LCSA framework provides a life-cycle thinking of the sustainability assessment at the city-level, while the SDGs enable a holistic view of the sustainability impact.
The application of the methodology in the case study of the WB shows that the WB program would generate the greatest sustainability impact in the resource recovery phase. Improvement in the environmental and social dimension can be expected, while the economic impact is mixed. Despite this, more employment could be generated; however, the issues of poverty and energy consumption are impaired. The environmental improvement in the transportation phase can also be expected. The least impact happens in the collection and final disposal phase. Surprisingly, the WB as a national strategy to achieve the 3Rs could not effectively solve Bandung City’s landfill problem, since no environmental improvement is estimated in the final disposal phase. It is also predicted that all negative impacts are in the economic dimension. Therefore, trade-offs have to be made between the economic negative impacts on one hand, and the social and environmental benefits on the other. Reflecting on the SDGs, almost all SDGs other than SDG 1, 7, 8, and 9 could benefit from the WB program (mainly due to resource recovery).
The methodology is marked with several valuable features: ex-ante assessment tailored for supporting decision-making; life-cycle thinking; partly quantitative; holistic view of sustainability by integrating the SDGs; and LCSA at a city-level. Nevertheless, future research in life cycle social and economic assessment at the meso- or macro-level could be done to help diminish the inconsistency of the methodology and quantify the contribution to the SDGs.

Author Contributions

Conceptualization, S.M., R.H. (Rafael Horn), and J.W.; Methodology, J.W., S.M., and R.H. (Rafael Horn); Investigation, J.W.; Writing-Original Draft Preparation, J.W.; Writing-Review & Editing, S.M., R.H. (Rafael Horn), R.A., and R.H. (Robert Holländer); Supervision, R.A. and R.H. (Robert Holländer).

Funding

This research was funded by the Life Cycle Engineering Department at University of Stuttgart and the APC was funded by Universität Leipzig.

Acknowledgments

We would like to thank our colleagues who have provided expert knowledge on waste management in Indonesia which helped to shape the research. We also appreciate the valuable comments from our anonymous reviewers.

Conflicts of Interest

The authors declare no conflicts of interest.

Appendix A

Table A1. Waste flows and composition in the baseline scenario.
Type of WasteGeneration (100 kg)Collected to TPSBurning (B) + Dumping (D)Transported to LandfillCompostingRecycling by Informal Sector at SourceRecycling Informal Sector at TPSRecycling Informal Sector at LandfillLandfill
C (%)Mass (kg)C (%)R_Mass (kg)D_S_Mass (kg)B_Mass (kg)D_TPS Mass (kg)Mass (kg)C (%)R_Mass (kg)S_Mass (kg)TPS_Mass (kg)Mass (kg)C (%)Mass (kg)C (%)Mass (kg)C (%)Mass (kg)
Organic5243.53951.98.461--15.7627.6651.3715.880.450.120-0-0-27.7
Plastics11.610.15112.11.4490.5770.4011.4868.45315.701.698--0.47210.020.21211.340.5651.877.89
Glass3.63.023.60.580.39102.3130.3770.702.643--0.1894.010.3317.650.0252.310.35
Paper10.88.2219.82.5791.0260.7132.7945.0299.343.193--0.84017.830.39921.320.33330.864.7
Metals4.31.0911.33.2090000.1620.300.929--3.21068.140.92949.680.16214.960
Sum (Recyclable)- 122.48326.8-1.9941.114-0-8.463--4.711001.871001.08100-
Textiles3.52.9363.50.5639--0.8362.13.900.836--------2.1
Rubber1.90.5030.61.397--0.180.3230.600.18--------0.32
Others12.314.42917.2---4.6849.74518.104.684--------9.75
Total10083.89-16.116.464.4928.0753.85--0.450.124.71-1.87-1.08-52.8
1 Missing number is unimportant for the calculation.
Assumptions in building baseline scenario
Assumption A1. The recycling rate of metal is assumed to be 100%. In terms of value, ferrous metal and nonferrous metals (mainly aluminum and cooper) rank first and second place, respectively, in the global recycling markets (UNEP, 2015). It is thus assumed that all metal loss from source to TPS and from TPS to landfill flows to the recycling chain through informal sector.
Assumption A2. The share of plastics, paper, and glass in the recycling activities of informal sector at source and at TPS are proportional to their mass loss in the corresponding transportation processes. For example, assuming 100 kg MSW is generated at source, the waste reduction from source to TPS could be calculated from the available statistical data on the waste composition and mass. The metal loss (3.2 kg) is 100% attributed to the recycling at source by informal sector. In total, 4.7 kg recyclables are recycled at source. Therefore, the other 1.5 kg recyclables are made up of plastics, paper, and glass. Their shares in this 1.5 kg are decided by their relative proportion in the mass loss. In the same manner, the mass and share of plastics, paper, and glass recycled at TPS could be calculated.
Assumption A3. Only organic waste (without impurities) flows into composting processes.
Assumption A4. No glass waste is disposed of through open burning. Considering of the high melting point of glass (1400–1723 °C) (Hypertextbook.com, 2002), it generally cannot melt in the open burning process; which has a highest observed temperature no more than 1000 °C (EPA, 1997). Thus, the loss of glass from source to TPS ends up only in recycling (calculated from Assumption A2) and dumping. Following the same logic of Assumption A2, the mass of plastics and paper in dumping and open burning at source are calculated.
Table A2. Waste flows and composition in the comparison scenario.
Type of WasteGeneration (100 kg)Collected to TPSBurning (B) + Dumping (D)Transported to LandfillCompostingRecycling by WBRecycling by Informal Sector at SourceRecycling Informal Sector at TPSRecycling Informal Sector at LandfillLandfill
C (%)Mass (kg)C (%)D_S_Mass (kg)B_Mass (kg)D_TPS Mass (kg)Mass (kg)C (%)S_Mass (kg)TPS_Mass (kg)Mass (kg)C (%)Mass (kg)C (%)Mass (kg)C (%)Mass (kg)C (%)Mass (kg)
Organic5243.53958.13 14.8828.5458.910.450.12--------28.540
Plastics11.66.0908.1320.3460.242.0443.928.09--4.6438.30.28310.020.12711.340.336151.873.584
Glass3.61.8122.4190.23500.5531.0612.19--1.4411.90.1134.010.19817.650.0152.311.046
Paper10.84.9336.5860.6160.4281.6083.0856.37--4.3235.60.50417.830.23921.320.230.862.886
Metals4.30.6540.8740000.0970.20--1.7214.21.92668.140.55749.680.09714.960
Sum (Recyclable)- 113.49--------12.12-2.826-1.122-0.648--
Textiles3.52.9363.92--1.0061.933.98----------1.930
Rubber1.90.5030.672--0.1720.3310.68----------0.331
Others12.314.42919.27--4.9459.48419.58----------9.484
Total10074.897-5.6634.04425.2148.45-0.450.1212.12-2.826-1.122-0.648-47.799
1 Missing number is unimportant for the calculation.
Assumptions in building comparison scenario
The assumptions set in the baseline scenario still hold. However, due to the prospective nature of the building comparison scenario, less data is available the baseline scenario. Thus, more assumptions have to be made to predict the changes:
Assumption A5. The level of public acceptance of WB is set at 40%. Public acceptance of WB is the degree of the communities’ and institutions’ participation in the WB program. In an ex-ante assessment, this could be measured through the public’s willingness to accept [7]. The community acceptance of WB on a rural Indonesian island was 37.5% [7]. As environmental awareness and knowledge affect people’s attitude towards waste management [40,41,42], it is reasonable to assume that citizens in Bandung City with relatively higher level of education and more exposure to environmental campaigns would be more willing to participate in WB.
Assumption A6. Public acceptance directly decides the percentage of recyclables flow to WB at source. Forty percent public acceptance indicates that 40% of all plastics, paper, glass, and metal waste generated at source would flow to WB in baseline scenarios. Under this assumption, WB would receive 12.12% of all MSW generated, which includes 4.64% plastics, 1.44% glass, 4.32% paper, and 1.72% metal. The share of plastics, glass, paper and metal being recycled through WB are 38.28%, 11.88%, 35.64%, and 14.19%. Correspondingly, the percentage and composition of waste flowing to other processes at source would be reduced.
Assumption A7. In a comparison scenario, a neighborhood consists of 450 households on average [39]. Bandung City has a total of 736,494 households [66]. If one WB unit is to be established in each neighborhood, this would generate 1637 WB units. Taking the public acceptance into account, each WB unit shall hold 180 customers.
Assumption A8. Composting processes are not affected by the introduction of WB. This applies to both individual composting and communal composting.
Assumption A9. The composition of waste arriving at landfill is supposed to be the same as the one being dumped at TPS, except for metal which is still assumed being recycled 100%.

Appendix B

Model settings in GaBi
Waste collection from household to TPS is done by communities through hand cart [74] or carried by household. There is no energy or water consumed in the process. As the capital equipment is not within the system boundary, therefore, the environmental impact of this collection process is omitted.
Transportation from TPS to landfill which is 45 km away from Bandung City uses trucks of Mitsubishi brand, with a 6t capacity [64]. PDK deploys 18 units of rented trucks for this work, which in total make 192 trips a day to the landfill [60]. Thus, the average load of each truck is 4.49 ton. The current emission standard adopted in Indonesia is Euro II [75]. Considering the trucks run with a full load to the landfill and an empty load back, the utilization is 0.5. All other settings (e.g., distance, share of motorway, rural, or city) use the default value of the generic truck model in GaBi.
As there is no generic landfill model for Indonesia in the GaBi database, the process of landfilling for European Union (EU) with leachate treatment and without gas utilization are adapted for this assessment. The adaptation considers the different waste composition at Sarimukti Landfill in contrast to European countries in the baseline scenario. The generic model for the dumping of waste is not included in the GaBi database. The dumping of waste is approximately modeled by removing leachate treatment from the landfill model (EU). The models also incorporate the different waste composition at source and at TPS.
Generic process for open burning of household waste is also unavailable in the GaBi database. Therefore, a process for MSW open burning is created based on the CO2 emission factor calculated following the Intergovernmental Panel on Climate Change (IPCC) guideline on GHG emissions [76], and experimental results on the emissions of other air pollutant gas and ash content analysis conducted by the United States (US) Environmental Protection Agency (EPA) [77]. These data are used to model the open burning process in Indonesia despite that the process is based on a different waste composition.
The home composting process is created in GaBi according to a study on the mass balances and life cycle inventory of home compositing of organic waste [78]. The generic model in GaBi for open windrow composting is applied for the communal composting at TPS. Furthermore, the avoided burden of the production of substituted chemical fertilizers is included in the model of communal composting.
The recycling chain in the background system consists of the transportation of waste to the recycling factories, production of secondary materials, and the avoided production out of raw materials. The underlying assumptions of the recycling chain processes are that recovered materials can replace virgin materials and that there is a sufficient market demand for the materials recovered from the waste stream. Transportation to the recycling factories mainly differs in terms of the transportation distance. The plastic and metal recycling factories are mostly located within Bandung City, paper is processed, for example, in Bekasi City, and metal recycling often happens in Jakarta [39]. By applying the worst-case-scenario principle, the transportation distance of paper and metal are 134 km and 151 km, respectively. The transportation distance of both plastic and glass are 30 km. The rest settings are the same as the transportation to landfill process. Recycling process and avoided burdens are modeled using the generic models of paper, plastic, glass, steel, aluminum, and copper from GaBi. As there is no information of the share of different metals being recovered in Bandung City, the relative share of steel, aluminum, and copper (92.61%, 5.96%, and 1.42%, respectively) are based on the recycling statistics of selected metal in the US [79]. The share of different types of plastics is included in building the model as detailed as possible. Limited to data availability, the crediting of all types of plastic waste are separately modeled, while only the recycling of polyethylene terephthalate (PET) and polypropylene (PP) are specified.
The recycling through WB process is added in the comparison scenario which collects a fraction of recyclables from all the other waste flows at source except for composting. The operation of WB units is supposed to have low or no electricity, no water consumption. Therefore, no environmental impact is counted in the operation of WB.

Appendix C

Table A3. Scores of all indicators and impact categories.
CollectionTransportationFinal DisposalResource Recovery
Climate0+10+1
 Global warming potential (GWP)0+10+1
Terrestrial ecosystem0+10+1
 Terrestrial acidification potential (TAP)0+10+1
 Terrestrial ecotoxicity potential (TETP)0+10+1
Aquatic ecosystem0+10+1
 Eutrophication potential (EP)0+10+1
 Freshwater aquatic ecotoxicity potential (FAETP)0+10+1
 Marine aquatic ecotoxicity potential (MAETP)0+10+1
Abiotic resource depletion0+10+0.5
 Abiotic depletion (ADP) elements0+100
 Abiotic depletion (ADP) fossil0+10+1
Poverty000−1
 Income of actors below international poverty line000−1
Energy supply & efficiency0−0.50−0.5
 Energy consumption0−10−1
 Energy intensity0000
Job & employment000+0.67
 Job creation0000
 Quality of job created000+1
 Reduction of vulnerable employment000+1
Health+0.5+0.5+0.5+1
 Risk of health incidences+10+1+1
 Human toxicity potential0+10+1
Education & skill development+0.330+0.33+0.33
 Provision of trainings or campaigns000+1
 Participation of trainings or campaigns0000
 Application of knowledge+10+10
Egalitarian society000+0.5
 Inclusion of low-income households in waste service000+1
 Rate of female workers000+1
 Income of housewives000+1
 Inclusion of informal sector000−1

References

  1. UNEP. Global Waste Management Outlook; United Nations Environment Programme: Nairobi, Kenya, 2015. [Google Scholar]
  2. Guerrero, L.A.; Maas, G.; Hogland, W. Solid waste management challenges for cities in developing countries. Waste Manag. 2013, 33, 220–232. [Google Scholar] [CrossRef] [PubMed]
  3. Dhokhikah, Y.; Trihadiningrum, Y.; Sunaryo, S. Community participation in household solid waste reduction in Surabaya, Indonesia. Resour. Conserv. Recycl. 2015, 102, 153–162. [Google Scholar] [CrossRef]
  4. Wilson, D.C. Development drivers for waste management. Waste Manag. Res. 2007, 25, 198–207. [Google Scholar] [CrossRef] [PubMed]
  5. Erses Yay, A.S. Application of life cycle assessment (LCA) for municipal solid waste management: A case study of Sakarya. J. Clean. Prod. 2015, 94, 284–293. [Google Scholar] [CrossRef]
  6. Wulandari, D.; Utomo, S.H.; Narmaditya, B.S. Waste Bank: Waste Management Model in Improving Local Economy. Int. J. Energy Econ. Policy 2017, 7, 36–41. Available online: http://www.econjournals.com/index.php/ijeep/article/view/4496/2990 (accessed on 8 June 2018).
  7. Meidiana, C.; Yakin, H.A.; Wijayanti, W.P. Household’s Willingness to Accept Waste Separation for Improvement of Rural Waste Bank’s Effectivity. In Solid Waste Management in Rural Areas; Mihai, F.-C., Ed.; InTech: Rijeka, Croatia, 2017. [Google Scholar] [Green Version]
  8. Zurbrügg, C.; Caniato, M.; Vaccari, M. How Assessment Methods Can Support Solid Waste Management in Developing Countries—A Critical Review. Sustainability 2014, 6, 545–570. [Google Scholar] [CrossRef] [Green Version]
  9. Permana, A.S.; Towolioe, S.; Aziz, N.A.; Ho, C.S. Sustainable solid waste management practices and perceived cleanliness in a low income city. Habitat Int. 2015, 49, 197–205. [Google Scholar] [CrossRef]
  10. Simões, P.; Marques, R.C. On the economic performance of the waste sector. A literature review. J. Environ. Manag. 2012, 106, 40–47. [Google Scholar] [CrossRef] [PubMed]
  11. Wilson, D.C.; Rodic, L.; Cowing, M.J.; Velis, C.A.; Whiteman, A.D.; Scheinberg, A.; Vilches, R.; Masterson, D.; Stretz, J.; Oelz, B. ‘Wasteaware’ benchmark indicators for integrated sustainable waste management in cities. Waste Manag. 2015, 35, 329–342. [Google Scholar] [CrossRef] [PubMed] [Green Version]
  12. Zaman, A.U.; Lehmann, S. The zero waste index: A performance measurement tool for waste management systems in a ‘zero waste city’. J. Clean. Prod. 2013, 50, 123–132. [Google Scholar] [CrossRef]
  13. Bueno, G.; Latasa, I.; Lozano, P.J. Comparative LCA of two approaches with different emphasis on energy or material recovery for a municipal solid waste management system in Gipuzkoa. Renew. Sustain. Energy Rev. 2015, 51, 449–459. [Google Scholar] [CrossRef]
  14. Li, H.; Nitivattananon, V.; Li, P. Developing a Sustainability Assessment Model to Analyze China’s Municipal Solid Waste Management Enhancement Strategy. Sustainability 2015, 7, 1116–1141. [Google Scholar] [CrossRef] [Green Version]
  15. Ibáñez-Forés, V.; Bovea, M.D.; Coutinho-Nóbrega, C.; de Medeiros-García, H.R.; Barreto-Lins, R. Temporal evolution of the environmental performance of implementing selective collection in municipal waste management systems in developing countries: A Brazilian case study. Waste Manag. 2018, 72, 65–77. [Google Scholar] [CrossRef] [PubMed]
  16. Bernstad, A.; La Cour Jansen, J.; Aspegren, H. Life cycle assessment of a household solid waste source separation programme: A Swedish case study. Waste Manag. Res. 2011, 29, 1027–1042. [Google Scholar] [CrossRef] [PubMed]
  17. Ma, J.; Hipel, K.W. Exploring social dimensions of municipal solid waste management around the globe—A systematic literature review. Waste Manag. 2016, 56, 3–12. [Google Scholar] [CrossRef] [PubMed]
  18. Allesch, A.; Brunner, P.H. Assessment methods for solid waste management: A literature review. Waste Manag. Res. 2014, 32, 461–473. [Google Scholar] [CrossRef] [PubMed]
  19. Guinée, J.B.; Heijungs, R.; Huppes, G.; Zamagni, A.; Masoni, P.; Buonamici, R.; Ekvall, T.; Rydberg, T. Life Cycle Assessment: Past, Present, and Future. Environ. Sci. Technol. 2011, 45, 90–96. [Google Scholar] [CrossRef] [PubMed]
  20. Onat, N.; Kucukvar, M.; Halog, A.; Cloutier, S. Systems Thinking for Life Cycle Sustainability Assessment: A Review of Recent Developments, Applications, and Future Perspectives. Sustainability 2017, 9, 706. [Google Scholar] [CrossRef]
  21. Guinée, J.B. Life Cycle Sustainability Assessment: What Is It and What Are Its Challenges? In Taking Stock of Industrial Ecology; Clift, R., Druckman, A., Eds.; Springer: Cham, Switzerland, 2016; pp. 45–68. [Google Scholar] [Green Version]
  22. Guinée, J.B.; Huppes, G.; Heijungs, R.; van der Voet, E. Research Strategy, Programmes and Exemplary Projects on Life Cycle Sustainability Analysis (LCSA); Leiden University: Leiden, The Netherlands, 2009. [Google Scholar]
  23. Tarne, P.; Traverso, M.; Finkbeiner, M. Review of Life Cycle Sustainability Assessment and Potential for Its Adoption at an Automotive Company. Sustainability 2017, 9, 670. [Google Scholar] [CrossRef]
  24. Sala, S.; Farioli, F.; Zamagni, A. Life cycle sustainability assessment in the context of sustainability science progress (part 2). Int. J. Life Cycle Assess. 2013, 18, 1686–1697. [Google Scholar] [CrossRef]
  25. UN, General Assembly. Sustainable Development: Protection of Global Climate for Present and Future Generations of Humankind; A/70/472, 15 December 2015; United Nations Digital Library: New York, NY, USA, 2015. [Google Scholar]
  26. UN, General Assembly. Report of the Open Working Group of the General Assembly on Sustainable Development Goals; A/68/970, 12 August 2014; United Nations Digital Library: New York, NY, USA, 2014. [Google Scholar]
  27. ICSU; ISSC. Review of Targets for the Sustainable Development Goals: The Science Perspective; International Council for Science: Paris, France, 2015. [Google Scholar]
  28. Kühnen, M.; Hahn, R. Indicators in Social Life Cycle Assessment: A Review of Frameworks, Theories, and Empirical Experience. J. Ind. Ecol. 2017, 21, 1547–1565. [Google Scholar] [CrossRef]
  29. Wulf, C.; Werker, J.; Zapp, P.; Schreiber, A.; Schlör, H.; Kuckshinrichs, W. Sustainable Development Goals as a Guideline for Indicator Selection in Life Cycle Sustainability Assessment. Procedia CIRP 2018, 69, 59–65. [Google Scholar] [CrossRef]
  30. Maier, S.; Beck, T.; Francisco Vallejo, J.; Horn, R.; Söhlemann, J.-H.; Nguyen, T. Methodological Approach for the Sustainability Assessment of Development Cooperation Projects for Built Innovations Based on the SDGs and Life Cycle Thinking. Sustainability 2016, 8, 1006. [Google Scholar] [CrossRef]
  31. Stefanova, M.; Tripepi, C.; Zamagni, A.; Masoni, P. Goal and Scope in Life Cycle Sustainability Analysis: The Case of Hydrogen Production from Biomass. Sustainability 2014, 6, 5463–5475. [Google Scholar] [CrossRef] [Green Version]
  32. Van der Giesen, C.; Kleijn, R.; Kramer, G.J.; Guinée, J. Towards application of life cycle sustainability analysis. Rev. Metall. 2013, 110, 31–38. [Google Scholar] [CrossRef]
  33. Hu, M.; Kleijn, R.; Bozhilova-Kisheva, K.P.; Di Maio, F. An approach to LCSA: The case of concrete recycling. Int. J. Life Cycle Assess. 2013, 18, 1793–1803. [Google Scholar] [CrossRef]
  34. World Bank. WHAT A WASTE: A Global Review of Solid Waste Management; World Bank: Washington, DC, USA, 2012. [Google Scholar]
  35. Goedkoop, M.; Heijungs, R.; Huijbregts, M.; Schryver, A.D.; Struijs, J.; van Zelm, R. ReCiPe 2008: A life Cycle Impact Assessment Method Which Comprises Harmonised Category Indicators at the Midpoint and the Endpoint Level; Ministerie van VROM: Den Haag, The Netherlands, 2012. [Google Scholar]
  36. ISO. Environmental Management—Life Cycle Assessment—Principles and Framework; International Standard Organization: Geneva, Switzerland, 2006. [Google Scholar]
  37. IPCC. Chapter 1: Introduction. In IPCC Guidelines for National Greenhouse Gas Inventories: Waste; IPCC, Ed.; Intergovernmental Panel on Climate Change: Geneva, Switzerland, 2006; Volume 5, pp. 1–8. [Google Scholar]
  38. Montanari, S. Plastic Garbage Patch Bigger Than Mexico Found in Pacific. 2017. Available online: https://news.nationalgeographic.com/2017/07/ocean-plastic-patch-south-pacific-spd/ (accessed on 12 June 2018).
  39. Damanhuri, E. Informal Collectors of Recyclable Waste and Use Goods in Indonesia. In 3R Policies for Southeast and East Asia; Kojima, M., Ed.; ERIA: Jakarta, Indonesia, 2010; pp. 71–100. [Google Scholar]
  40. Ramadan, B.S.; Alam, F.C.; Rahardyan, B. The influence of environmental campaign on public awareness in maintaining the cleanliness and waste reduction program: A case study of Bandung City. Sci. J. PPI-UKM 2016, 3, 32–37. [Google Scholar] [CrossRef]
  41. Singhirunnusorn, W.; Donlakorn, K.; Kaewhanin, W. Household Recycling Behaviours and Attitudes toward Waste Bank Project: Mahasarakham Municipality. J. Asian Behav. Stud. 2012, 2. Available online: https://fspu.uitm.edu.my/cebs/images/stories/cebs/jabsv2n6c4p35to48.pdf (accessed on 12 June 2018). [CrossRef]
  42. Aleluia, J.; Ferrão, P. Characterization of urban waste management practices in developing Asian countries: A new analytical framework based on waste characteristics and urban dimension. Waste Manag. 2016, 58, 415–429. [Google Scholar] [CrossRef] [PubMed]
  43. Babaei, A.A.; Alavi, N.; Goudarzi, G.; Teymouri, P.; Ahmadi, K.; Rafiee, M. Household recycling knowledge, attitudes and practices towards solid waste management. Resour. Conserv. Recycl. 2015, 102, 94–100. [Google Scholar] [CrossRef]
  44. European Commission. ILCD Handbook—General Guide on Life Cycle Assessment—Detailed Guidance, 1st ed.; Publications Office of the European Union: Luxembourg, 2010. [Google Scholar]
  45. Opendata. Available online: http://data.bandung.go.id/ (accessed on 12 June 2018).
  46. Hijau Lestari. Available online: http://www.hijaulestari.org/) (accessed on 12 June 2018).
  47. Mungcharoen, T.; Sridowtong, S.; Saibuatrong, W. Benefits of 3R: From a Life Cycle Perspective. In 3R Policies for Southeast and East Asia; Kojima, M., Ed.; ERIA: Jakarta, Indonesia, 2010; pp. 1–21. [Google Scholar]
  48. Bandung City. Bandung City Masterplan. 2011. Available online: http://www.jdih.setjen.kemendagri.go.id/files/KOTA_BANDUNG_18_2011.pdf (accessed on 12 June 2018).
  49. CIA. gov. The World Factbook—Central Intelligence Agency, Indonesia. 2018. Available online: https://www.cia.gov/library/publications/the-world-factbook/geos/id.html (accessed on 12 June 2018).
  50. World Bank. Overview, Indonesia. 2018. Available online: http://www.worldbank.org/en/country/indonesia/overview (accessed on 12 June 2018).
  51. Tarigan, A.K.M.; Sagala, S.; Samsura, D.A.A.; Fiisabiilillah, D.F.; Simarmata, H.A.; Nababan, M. Bandung City, Indonesia. Cities 2016, 50, 100–110. [Google Scholar] [CrossRef]
  52. Aprilia, A.; Tezuka, T.; Spaargaren, G. Municipal Solid Waste Management with Citizen Participation: An Alternative Solution to Waste Problems in Jakarta, Indonesia. In Zero-Carbon Energy Kyoto 2010, Proceedings of the Second International Symposium of Global COE Program “Energy Science in the Age of Global Warming--Toward CO2 Zero-Emission Energy System”; Yao, T., Ed.; Springer: Tokyo, Japan; New York, NY, USA, 2011; pp. 56–62. [Google Scholar]
  53. Meidiana, C.; Gamse, T. Waste Reduction Effect on Methane Emission in Landfill. Adv. Nat. Appl. Sci. 2011, 5, 269–276. Available online: http://www.aensiweb.com/old/anas/2011/269-276.pdf (accessed on 12 June 2018).
  54. Profil Persampahan Kota Bandung (Waste Profile of Bandung City). 2016. Available online: https://inbesa.wordpress.com/tag/bandung/ (accessed on 12 June 2018).
  55. Damanhuri, E.; Handoko, W.; Padmi, T. Municipal Solid Waste Management in Indonesia. In Municipal Solid Waste Management in Asia and the Pacific Islands: Challenges and Strategic Solutions; Pariatamby, A., Tanaka, M., Eds.; Springer: Singapore, 2014; pp. 139–155. [Google Scholar]
  56. Opendata Kota Bandung. Produksi Jenis Sampah Menurut Jenisnya di Kota Bandung (Dataset). 2017. Available online: http://data.bandung.go.id/dataset/produksi-jenis-sampah-menurut-jenisnya-tahun-2014 (accessed on 13 June 2018).
  57. Waste Atlas—Interactive Map with Visualized Waste Management Data. Available online: http://www.atlas.d-waste.com/ (accessed on 13 June 2018).
  58. Damanhuri, E.; Wahyu, I.M.; Ramang, R.; Padmi, T. Evaluation of municipal solid waste flow in the Bandung metropolitan area, Indonesia. J. Mater. Cycles Waste Manag. 2009, 11, 270–276. [Google Scholar] [CrossRef]
  59. Damanhuri, E.; Padmi, T. Current Situation of Waste Recycling in Indonesia. In 3R Policies for Southeast and East Asia; Kojima, M., Damanhuri, E., Eds.; ERIA: Jakarta, Indonesia, 2009; pp. 23–52. [Google Scholar]
  60. Rahayu, N.; Yudoko, G. Backcasting Integrated Municipal Solid Waste Managemetn in Bandung City: A literature Review. In Proceedings of the 3rd International Conference on Technology and Operations Management, Bandung, Indonesia, 4–6 July 2012; pp. 539–547. [Google Scholar]
  61. Opendata Kota Bandung. Data Sebaran Lokasi TPS PD Kebersihan Kota Bandung Tahun 2016 (Dataset). 2016. Available online: http://data.bandung.go.id/dataset/data-sebaran-lokasi-tps-pd-kebersihan-kota-bandung-tahun-2016 (accessed on 13 June 2018).
  62. Zahra, M. Presiding over a Flood of Waste: A Case Study on a Local Movemenet for Domestic Waste Management at the Household Level, Bandung City, Indonesia. Master’s Thesis, Lund University, Lund, Sweden, 2017. [Google Scholar]
  63. Maryati, S.; Humaira, A.N.S.; Putri, H.T. Relationship between Solid Waste Service Characteristics and Income Level in Metropolitan Bandung Raya. MIMBAR Jurnal Sosial Pembangunan 2016, 32, 233–242. [Google Scholar] [CrossRef]
  64. Opendata Kota Bandung. Kendaraan Angkutan Truk Sampah Hasil Bantuan Tahun 2015 (Datasest). 2015. Available online: http://data.bandung.go.id/dataset/kendaraan-angkutan-truk-sampah-hasil-bantuan-tahun-2015 (accessed on 13 June 2018).
  65. Ramdhani, M.Y.; Sururi, M.R.; Ainun, S.; Roosmini, D.; Pribadi, K.; Sugeng, B.; Hadihardaja, I.K. Leachate Treatment from Sarimukti Landfill Using Ozone with Sludge from Water Treatment Plant as a Catalyst. MATEC Web Conf. 2018, 147, 4006. [Google Scholar] [CrossRef] [Green Version]
  66. Opendata Kota Bandung. Datasets—Portal Data Kota Bandung. 2017. Available online: http://data.bandung.go.id/dataset?res_format=CSV&organization=perusahaan-daerah-kebersihan&license_id=cc-by (accessed on 13 June 2018).
  67. Thinkstep AG. GaBi ts. 2018. Available online: https://www.thinkstep.com/software/gabi-lca/gabi-professional (accessed on 9 August 2018).
  68. Guinée, J.B.; Gorrée, M.; Heijungs, R.; Huppes, G.; Kleijn, R.; de Koning, A.; van Oers, L.; Wegener Sleeswijk, A.; Suh, S.; Udo de Haes, H.A.; et al. Handbook on Life Cycle Assessment. Operational Guide to the ISO Standards. IIa: Guide; Kluwer Academic Publishers: Dordrecht, The Netherlands, 2002; ISBN 1-4020-0228-9. [Google Scholar]
  69. Purba, H.D.; Meidiana, C.; Adrianto, D.W. Waste Management Scenario through Community Based Waste Bank: A Case Study of Kepanjen District, Malang Regency, Indonesia. IJESD 2014, 212–216. [Google Scholar] [CrossRef]
  70. Premakumara, D.G.J.; Soedjono, E.S.; Kataoka, Y.; Fitriani, N. Transition from Waste Management to Resource Management: A Potential of Waste Bank Program in Indonesian Cities. JSM Environ. Sci. Ecol. 2016, 4, 1037. Available online: https://www.jscimedcentral.com/EnvironmentalScience/environmentalscience-4-1037.pdf (accessed on 19 June 2018).
  71. Aparcana, S. Approaches to formalization of the informal waste sector into municipal solid waste management systems in low- and middle-income countries: Review of barriers and success factors. Waste Manag. 2017, 61, 593–607. [Google Scholar] [CrossRef] [PubMed]
  72. Sekito, T.; Prayogo, T.B.; Dote, Y.; Yoshitake, T.; Bagus, I. Influence of a community-based waste management system on people’s behavior and waste reduction. Resour. Conserv. Recycl. 2013, 72, 84–90. [Google Scholar] [CrossRef]
  73. Wilson, D.C.; Rodic, L.; Scheinberg, A.; Velis, C.A.; Alabaster, G. Comparative analysis of solid waste management in 20 cities. Waste Manag. Res. 2012, 30, 237–254. [Google Scholar] [CrossRef] [PubMed] [Green Version]
  74. Aprilia, A.; Tezuka, T.; Spaargare, G. Household Solid Waste Management in Jakarta, Indonesia: A Socio-Economic Evaluation. In Greenhouse Gas Emissions from Housing and Manure Management Systems at Confined Livestock Operations; Borhan, M.S., Mukhtar, S., Capareda, S., Rahman, S., Eds.; INTECH Open Access Publisher: Rijeka, Croatia, 2012. [Google Scholar] [Green Version]
  75. Indonesia: Heavy-Duty: Emissions. Available online: https://www.transportpolicy.net/standard/indonesia-heavy-duty-emissions/ (accessed on 15 June 2018).
  76. Pipatti, R.; Vieira, S.M.M. IPCC Guidelines for National Greenhouse Gas. Inventories: Waste; Intergovernmental Panel on Climate Change: Geneva, Switzerland, 2006. [Google Scholar]
  77. Lemieux, P.M. Evaluation of Emissions from the Open Burning of Household Waste in Barrels: Volume 1. Technical Report; US Environmental Protection Agency, National Risk Management Research Laboratory: Washington, DC, USA, 1997.
  78. Andersen, J.K.; Boldrin, A.; Christensen, T.H.; Scheutz, C. Mass balances and life cycle inventory of home composting of organic waste. Waste Manag. 2011, 31, 1934–1942. [Google Scholar] [CrossRef] [PubMed] [Green Version]
  79. USGS National Minerals Information Center. 2015 Minerials Yearbook: Recycling—Metals [Advance Release]; USGS National Minerals Information Center: Washington, DC, USA, 2015.
Figure 1. Overview of the ex-ante Life Cycle Sustainability Analysis (LCSA) of innovations in the Municipal Solid Waste Management (MSWM) system.
Sustainability 10 03208 g001
Figure 2. Three steps of goal & scope definition (adapted from a past paper [31]).
Sustainability 10 03208 g002
Figure 3. Simplified life cycle of MSWM (summarized from a past study [1]).
Sustainability 10 03208 g003
Figure 4. MSWM system and waste flows in the baseline scenario (adapted from a past paper [58]).
Sustainability 10 03208 g004
Figure 5. The MSWM system and waste flows in the comparison scenario with WB.
Sustainability 10 03208 g005
Figure 6. Global warming potential in the MSWM life cycle.
Sustainability 10 03208 g006
Figure 7. Visualization of assessment results by impact category. (a) Assessment results in the collection phase. (b) Assessment results in the transportation phase. (c) Assessment results in the final disposal phase. (d) Assessment results in the resource recovery phase.
Sustainability 10 03208 g007
Table 1. Summary of the indicator system.
Sustainability DimensionImpact CategorySDGsIndicatorAssessment Method
EnvironmentalClimate13Global warming potential (GWP)LCA–CML 2001
Terrestrial ecosystem 2, 15Terrestrial acidification potential (TAP)LCA–ReCiPe 2016
Terrestrial ecotoxicity potential (TETP)LCA–CML 2001
Aquatic system6, 14Eutrophication potential (EP)LCA–CML 2001
Freshwater aquatic ecotoxicity potential (FAETP)LCA–CML 2001
Marine aquatic ecotoxicity potential (MAETP)LCA–CML 2001
Abiotic resource depletion 17, 8, 9Abiotic depletion (ADP) elementsLCA–CML 2001
Abiotic depletion (ADP) fossilLCA–CML 2001
EconomicPoverty1Income of actors below international poverty lineQuantitative 3
Energy supply & efficiency7, 8, 9Energy consumptionLCA
Energy intensityQuantitative 3
Job & employment8, 9, 11, 12Job creationQuantitative 3
Quality of job createdQuantitative 3
Reduction of vulnerable employmentQuantitative 3
SocialHealth2, 3, 6Risk of health incidencesQuantitative 3
Human toxicity potentialLCA–CML 2001
Education & skill development4Provision of trainings or campaignsQuantitative 3
Participation of trainings or campaignsQuantitative 3
Application of knowledgeQuantitative 3
Egalitarian society5, 10, 11, 16Inclusion of low-income households in waste serviceQuantitative 3
Rate of female workersQuantitative 3
Income of housewivesQuantitative 3
Inclusion of informal sector 2Quantitative 3
1 Newly added impact category to Maier et al. [30]. 2 Indicator from a past paper [11]. 3 Indicators could be quantitatively assessed, but are qualitative in the case study due to resource limitation.
Table 2. Scoring rules of indicator.
ConditionPositive ChangeNegative ChangeNo Change (Less Than 10%), Irrelevant or Lack of Data
Score+1−10
Table 3. Scores of the impact category: impact.
CollectionTransportationFinal DisposalResource Recovery
GWP0+10 1+1
Total0+10+1
1 Reduction of GWP in comparison scenario is less than 10% from the baseline scenario, scored “0”.
Table 4. Scores of the impact category: poverty.
CollectionTransportationFinal DisposalResource Recovery
Income of actors below international poverty line000−1
Total000−1
Table 5. Summary of scores by impact category.
CollectionTransportationFinal DisposalResource Recovery
Climate0+10+1
Terrestrial ecosystem0+10+1
Aquatic ecosystem0+10+1
Abiotic resource depletion0+10+0.5
Poverty000−1
Energy supply & efficiency0−0.50−0.5
Job & employment000+0.67
Health+0.5+0.5+0.5+1
Education & skill development+0.330+0.33+0.33
Egalitarian society000+0.5

