Peanut Shell for Energy: Properties and Its Potential to Respect the Environment
by
 , , and
Miguel-Angel Perea-Moreno
1 ,
,
Francisco Manzano-Agugliaro
2 ,
,
Quetzalcoatl Hernandez-Escobedo
3 and
Alberto-Jesus Perea-Moreno
1,* 1
Departamento de Física Aplicada, ceiA3, Campus de Rabanales, Universidad de Córdoba, 14071 Córdoba, Spain
2
Department of Engineering, ceiA3, University of Almeria, 04120 Almeria, Spain
3
Faculty of Engineering, Campus Coatzacoalcos, University of Veracruz, Coatzacoalcos, Veracruz 96535, Mexico
*
Author to whom correspondence should be addressed.
Sustainability 2018, 10(9), 3254; https://doi.org/10.3390/su10093254
Submission received: 16 August 2018
/
Revised: 8 September 2018
/
Accepted: 10 September 2018
/
Published: 12 September 2018
(This article belongs to the Special Issue Sustainability in Mediterranean Climate)
Abstract
:The peanut (Arachys hypogaea) is a plant of the Fabaceae family (legumes), as are chickpeas, lentils, beans, and peas. It is originally from South America and is used mainly for culinary purposes, in confectionery products, or as a nut as well as for the production of biscuits, breads, sweets, cereals, and salads. Also, due to its high percentage of fat, peanuts are used for industrialized products such as oils, flours, inks, creams, lipsticks, etc. According to the Food and Agriculture Organization (FAO) statistical yearbook in 2016, the production of peanuts was 43,982,066 t, produced in 27,660,802 hectares. Peanuts are grown mainly in Asia, with a global production rate of 65.3%, followed by Africa with 26.2%, the Americas with 8.4%, and Oceania with 0.1%. The peanut industry is one of the main generators of agroindustrial waste (shells). This residual biomass (25–30% of the total weight) has a high energy content that is worth exploring. The main objectives of this study are, firstly, to evaluate the energy parameters of peanut shells as a possible solid biofuel applied as an energy source in residential and industrial heating installations. Secondly, different models are analysed to estimate the higher heating value (HHV) for biomass proposed by different scientists and to determine which most accurately fits the determination of this value for peanut shells. Thirdly, we evaluate the reduction in global CO2 emissions that would result from the use of peanut shells as biofuel. The obtained HHV of peanut shells (18.547 MJ/kg) is higher than other biomass sources evaluated, such as olive stones (17.884 MJ/kg) or almond shells (18.200 MJ/kg), and similar to other sources of biomass used at present for home and industrial heating applications. Different prediction models of the HHV value proposed by scientists for different types of biomass have been analysed and the one that best fits the calculation for the peanut shell has been determined. The CO2 reduction that would result from the use of peanut shells as an energy source has been evaluated in all production countries, obtaining values above 0.5 ‰ of their total emissions.
1. Introduction
Emissions of pollutants into the atmosphere are the cause of the deterioration of air quality and the cause of numerous health, economic, and environmental problems. Large cities and some industrial areas concentrate levels of air pollution, with vehicle traffic being the main culprit [1,2].
Carbon dioxide (CO2) is one of the most abundant compounds in the atmosphere, being the most important of the so-called “greenhouse gases”. It plays an important role in the vital processes of plants, animals, and humans and, in appropriate quantities, contributes to keeping the earth’s temperature within the limits of life [3,4]. However, since the Industrial Revolution, there has been a continuous increase in the amount of CO2 emitted into the atmosphere due to the intensive use of fossil fuels [5]. They have affected the natural greenhouse effect and are causing unprecedented climate change which, for many, is the greatest threat to the environment. Over the last 100 years, the global average temperature has increased by 0.76 °C. Eleven of the 12 hottest years since 1850 were concentrated between 1995 and 2006 [6,7].
According to experts’ forecasts, if no action is taken to limit greenhouse gas emissions, the average global temperature could rise by between 1.8 and 4 °C before the end of the 21st century [8].
In Europe, the fight against climate change is a key priority of the sustainable development strategy, which explains why it has long been at the forefront of international efforts to combat climate change by committing itself to making Europe a highly energy-efficient, low-carbon economy [9,10,11].
The main element of environmental policy in Europe is the Kyoto Protocol and the policies resulting from it [12]. One of the main strategies associated with these policies is the introduction of the Emissions Trading Scheme (ETS) created in 2005 [13]. This mechanism is one of the cornerstones of the European energy system, in which a price is set for carbon dioxide and which allows CO2 emission rights to be traded in order to promote their efficient reduction [14,15].
Another policy related to the Kyoto Protocol has been support for renewable energy sources, which has allowed for an increase in this sector [16,17]. This growth in renewable energy generation and the increased use of gas in the electricity sector has reduced the amounts of greenhouse gases in electricity production [18]. However, this progress towards reducing CO2 emissions is insufficient to meet the targets set by European climate change policies.
In 2008, the European Commission approved the Climate and Energy Package, known as the 20-20-20 Plan, which contains binding legislation for Member States to ensure compliance with the climate and energy targets for 2020, including the following [19]:
- -
- Reduce 20% of the emissions of greenhouse gases (GHG) that were recorded in 1990 (well above the Kyoto target of 8%).
- -
- Achieve that renewable sources constitute 20% of total energy consumption.
- -
- Improve energy efficiency by 20%.
In addition, this package of measures includes a commitment to increase the rate of greenhouse gas reduction from 20% to 30%.
The EU also aims to improve its energy efficiency by 20% by the same deadline. Moreover, the EU has offered to increase its GHG emission reduction figure by 2020 from 20% to 30% if other major economies contribute fairly to the international reduction effort [20].
Biomass is the totality of organic matter, of plant or animal origin, and the materials that come from its natural or artificial transformation [21]. Directive 2009/28/EC encourages the use of renewable sources for the production of energy and proposes a definition of biomass which includes not only substances of plant and animal origin but also any type of biological waste from agricultural, industrial, and municipal activities [22].
A range of thermal, physical, or biological processes can convert biomass into energy through several types of biofuels [23,24,25,26]. Biomass can be classified according to its origin as wood, energy crops, agricultural waste, food residues, and industrial waste [27]. Agricultural waste provides around 33% of total biofuels use, accounting for 39%, 29%, and 13% of biofuel use in Asia, Latin America, and Africa, respectively, and 41% and 51% of biofuel usage in India and China, respectively [28].
The peanut (Arachys hypogaea) is a plant of the Fabaceae family (legumes), as are chickpeas, lentils, beans, and peas and is originally from South America. The first intentional peanut introduction into Europe was not reported, but American exotic plants were often harvested and first introduced into Europe from the first voyage of Columbus [29].
Its use is mainly for culinary purposes, in confectionery products, or as a nut and is also used to produce biscuits, breads, sweets, cereals, and salads. Peanut butter is by far the largest product made from peanut in the United States, but it is rarely consumed outside that country [30]. Also, due to its high percentage of fat, peanuts are used for industrialized products, such as oils, flours, inks, creams, lipsticks, etc. Regarding biofuels, the nut has been successfully used to produce biodiesel [31].
The production of peanuts according to the Food and Agriculture Organization (FAO) statistical yearbook in 2016 was 43,982,066 t, produced in 27,660,802 hectares [32]. Peanuts are grown mainly in Asia, with a global production rate of 65.3%, followed by Africa with 26.2%, the Americas with 8.4%, and Oceania with 0.1% (Figure 1).
The list of the five largest producing countries is headed by China with a production of 33,309,998 t, followed by India with 6,857,000 t, Nigeria with 3,028,571, the United States with 2,578,500 t, and Sudan with 1,826,000 t [32]. However, the peanut yield is as high as 3000 kg ha−1 in the United States, while the average in tropical Africa is 800 kg ha−1 [33]. Therefore, there is still much potential for an increase in world production if the appropriate agronomic techniques were used in countries with such poor yields.
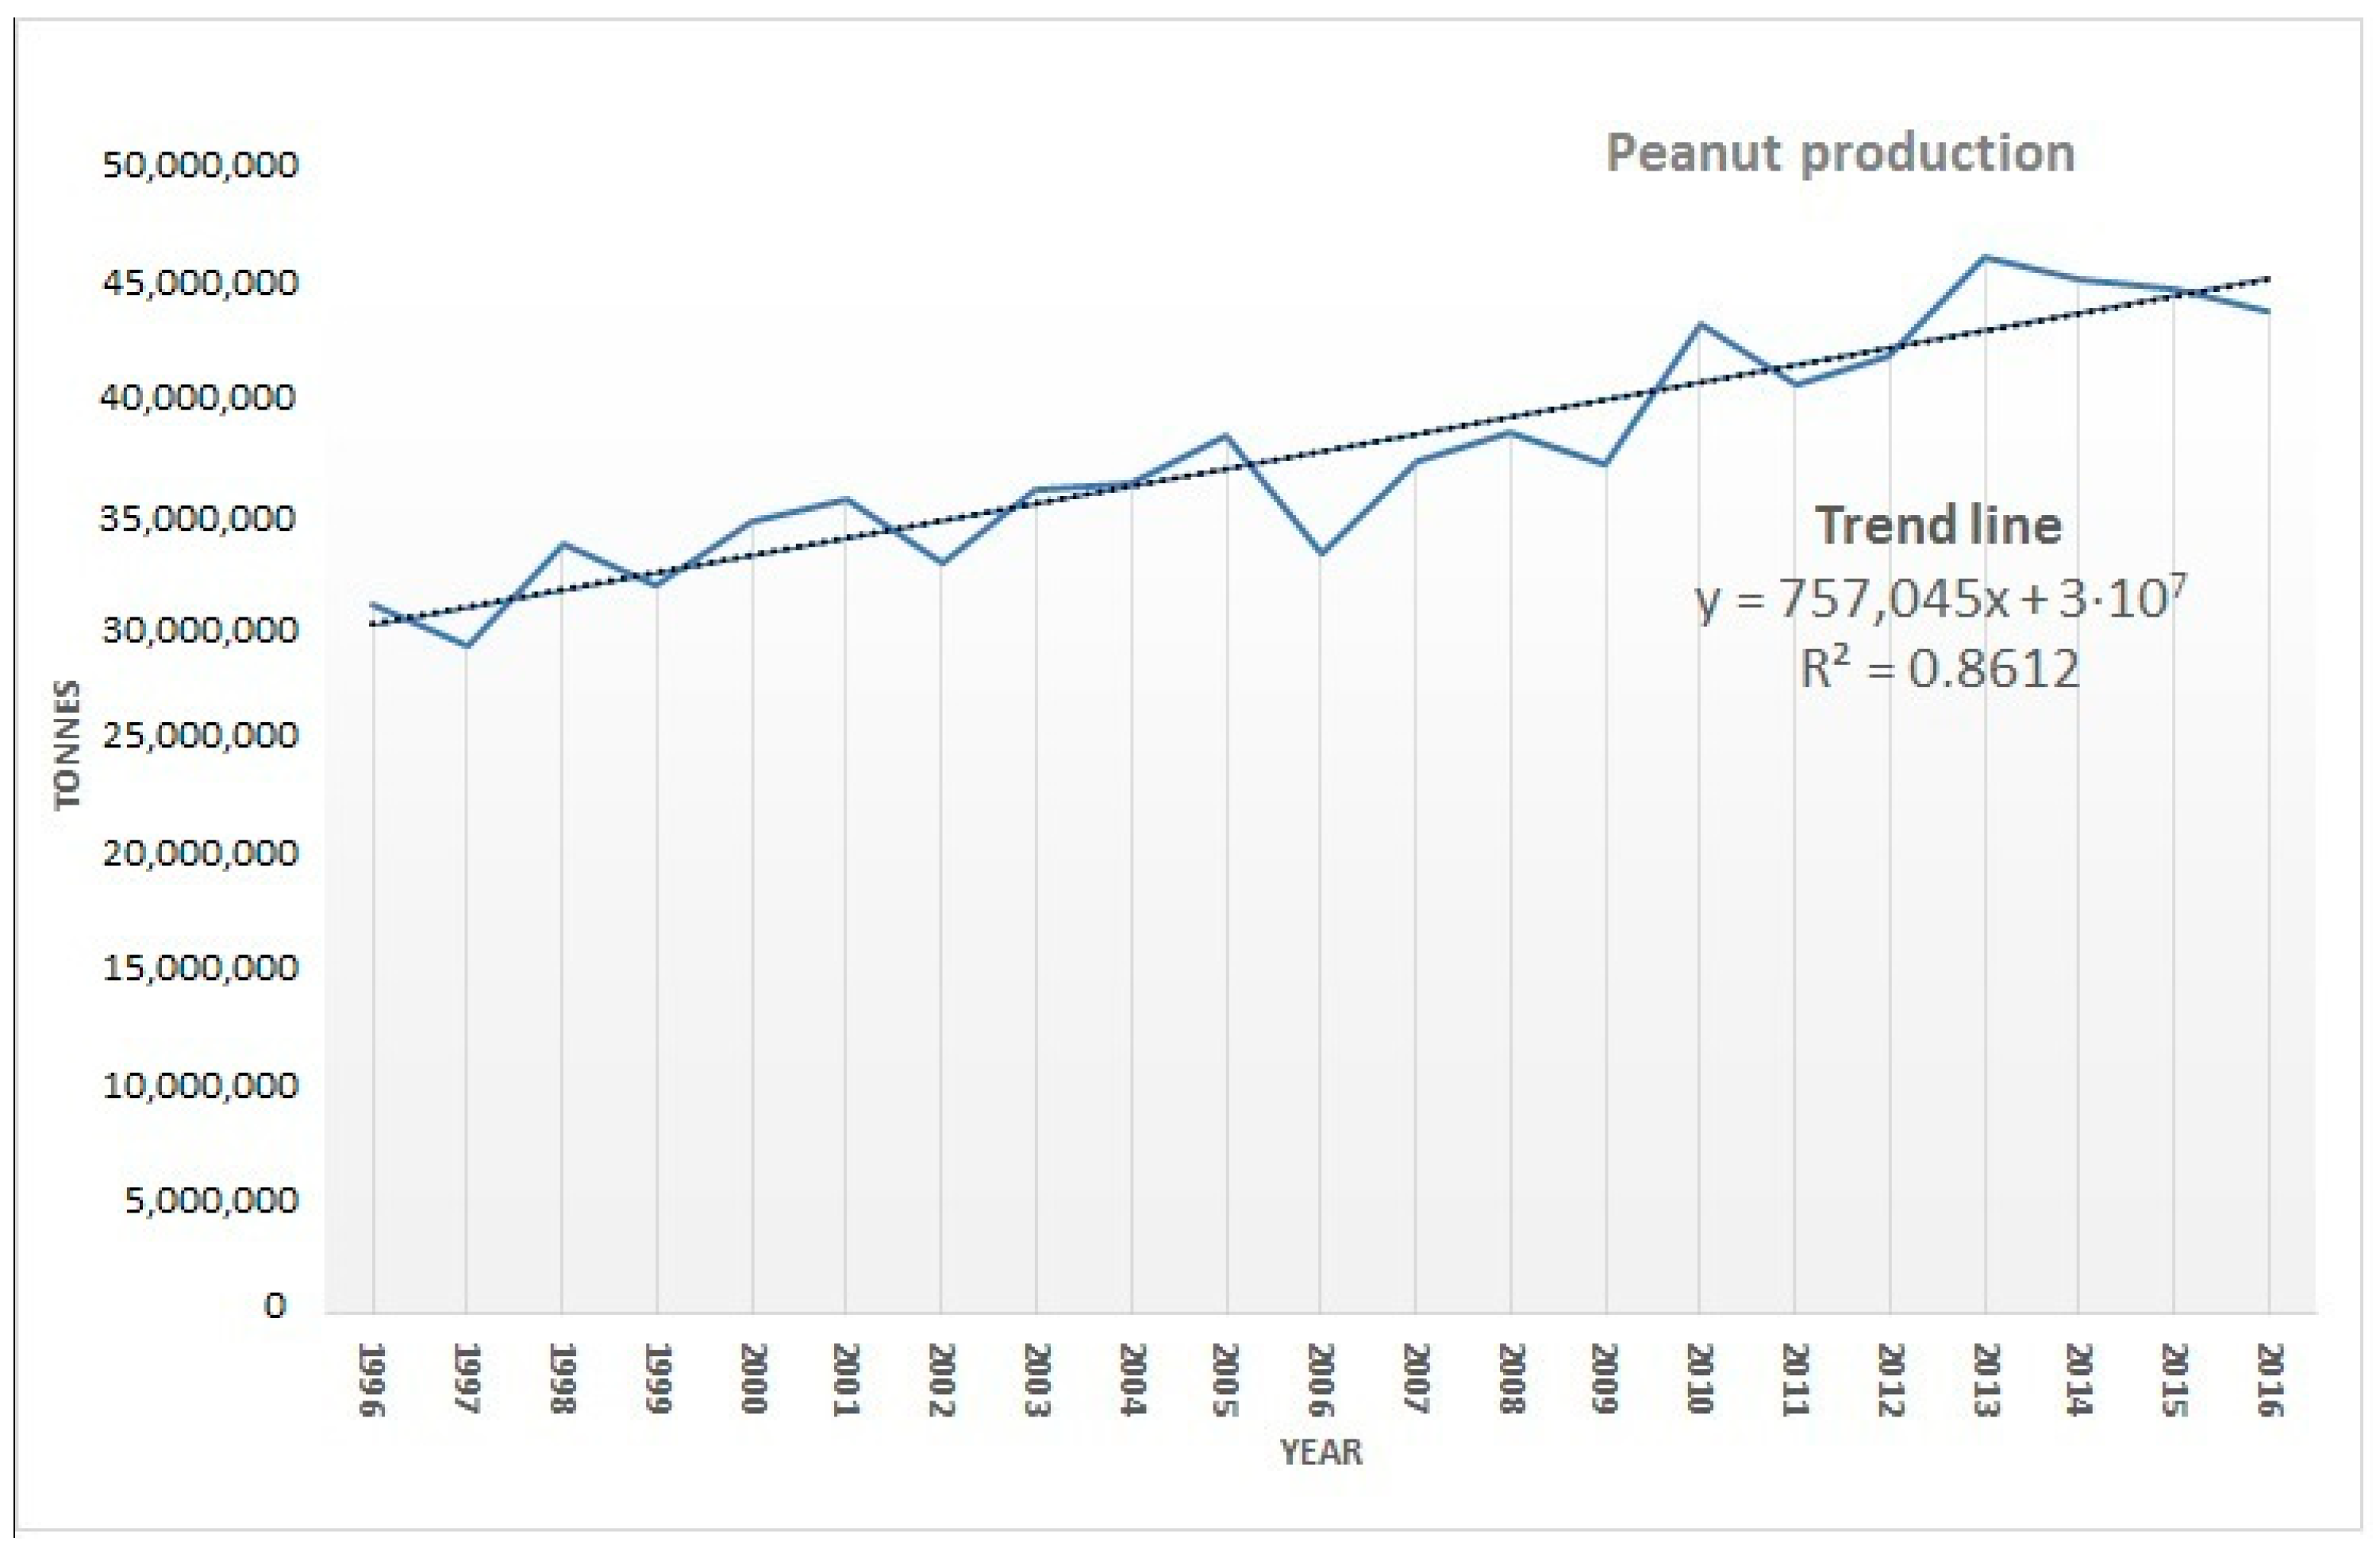
Figure 2 shows the evolution of world peanut production over a 20-year period.
The peanut industry is one of the main generators of agroindustrial waste (shells). This residual biomass has a high energy content that is worth exploring [34].
The peanut shell is the main residue of the peanut industry and represents between 25% and 30% of the total weight of the legume, being eliminated as residues in the final stage of the processing of the peanut, either for oil production or for direct consumption without shell. Annually, there is a world production of this waste of around 11,000,000 t from the peanut industry that is still unexplored.
Therefore, there is a large amount of waste from the peanut industry that is being disposed of that can be used as biomass for energy purposes.
In Mediterranean countries, there are many boilers that are currently being used with fossil fuels and if they were adapted for use with other types of biomass, such as peanut shells, this would achieve large reductions in CO2 emissions to the atmosphere and, therefore, greater environmental sustainability [35].
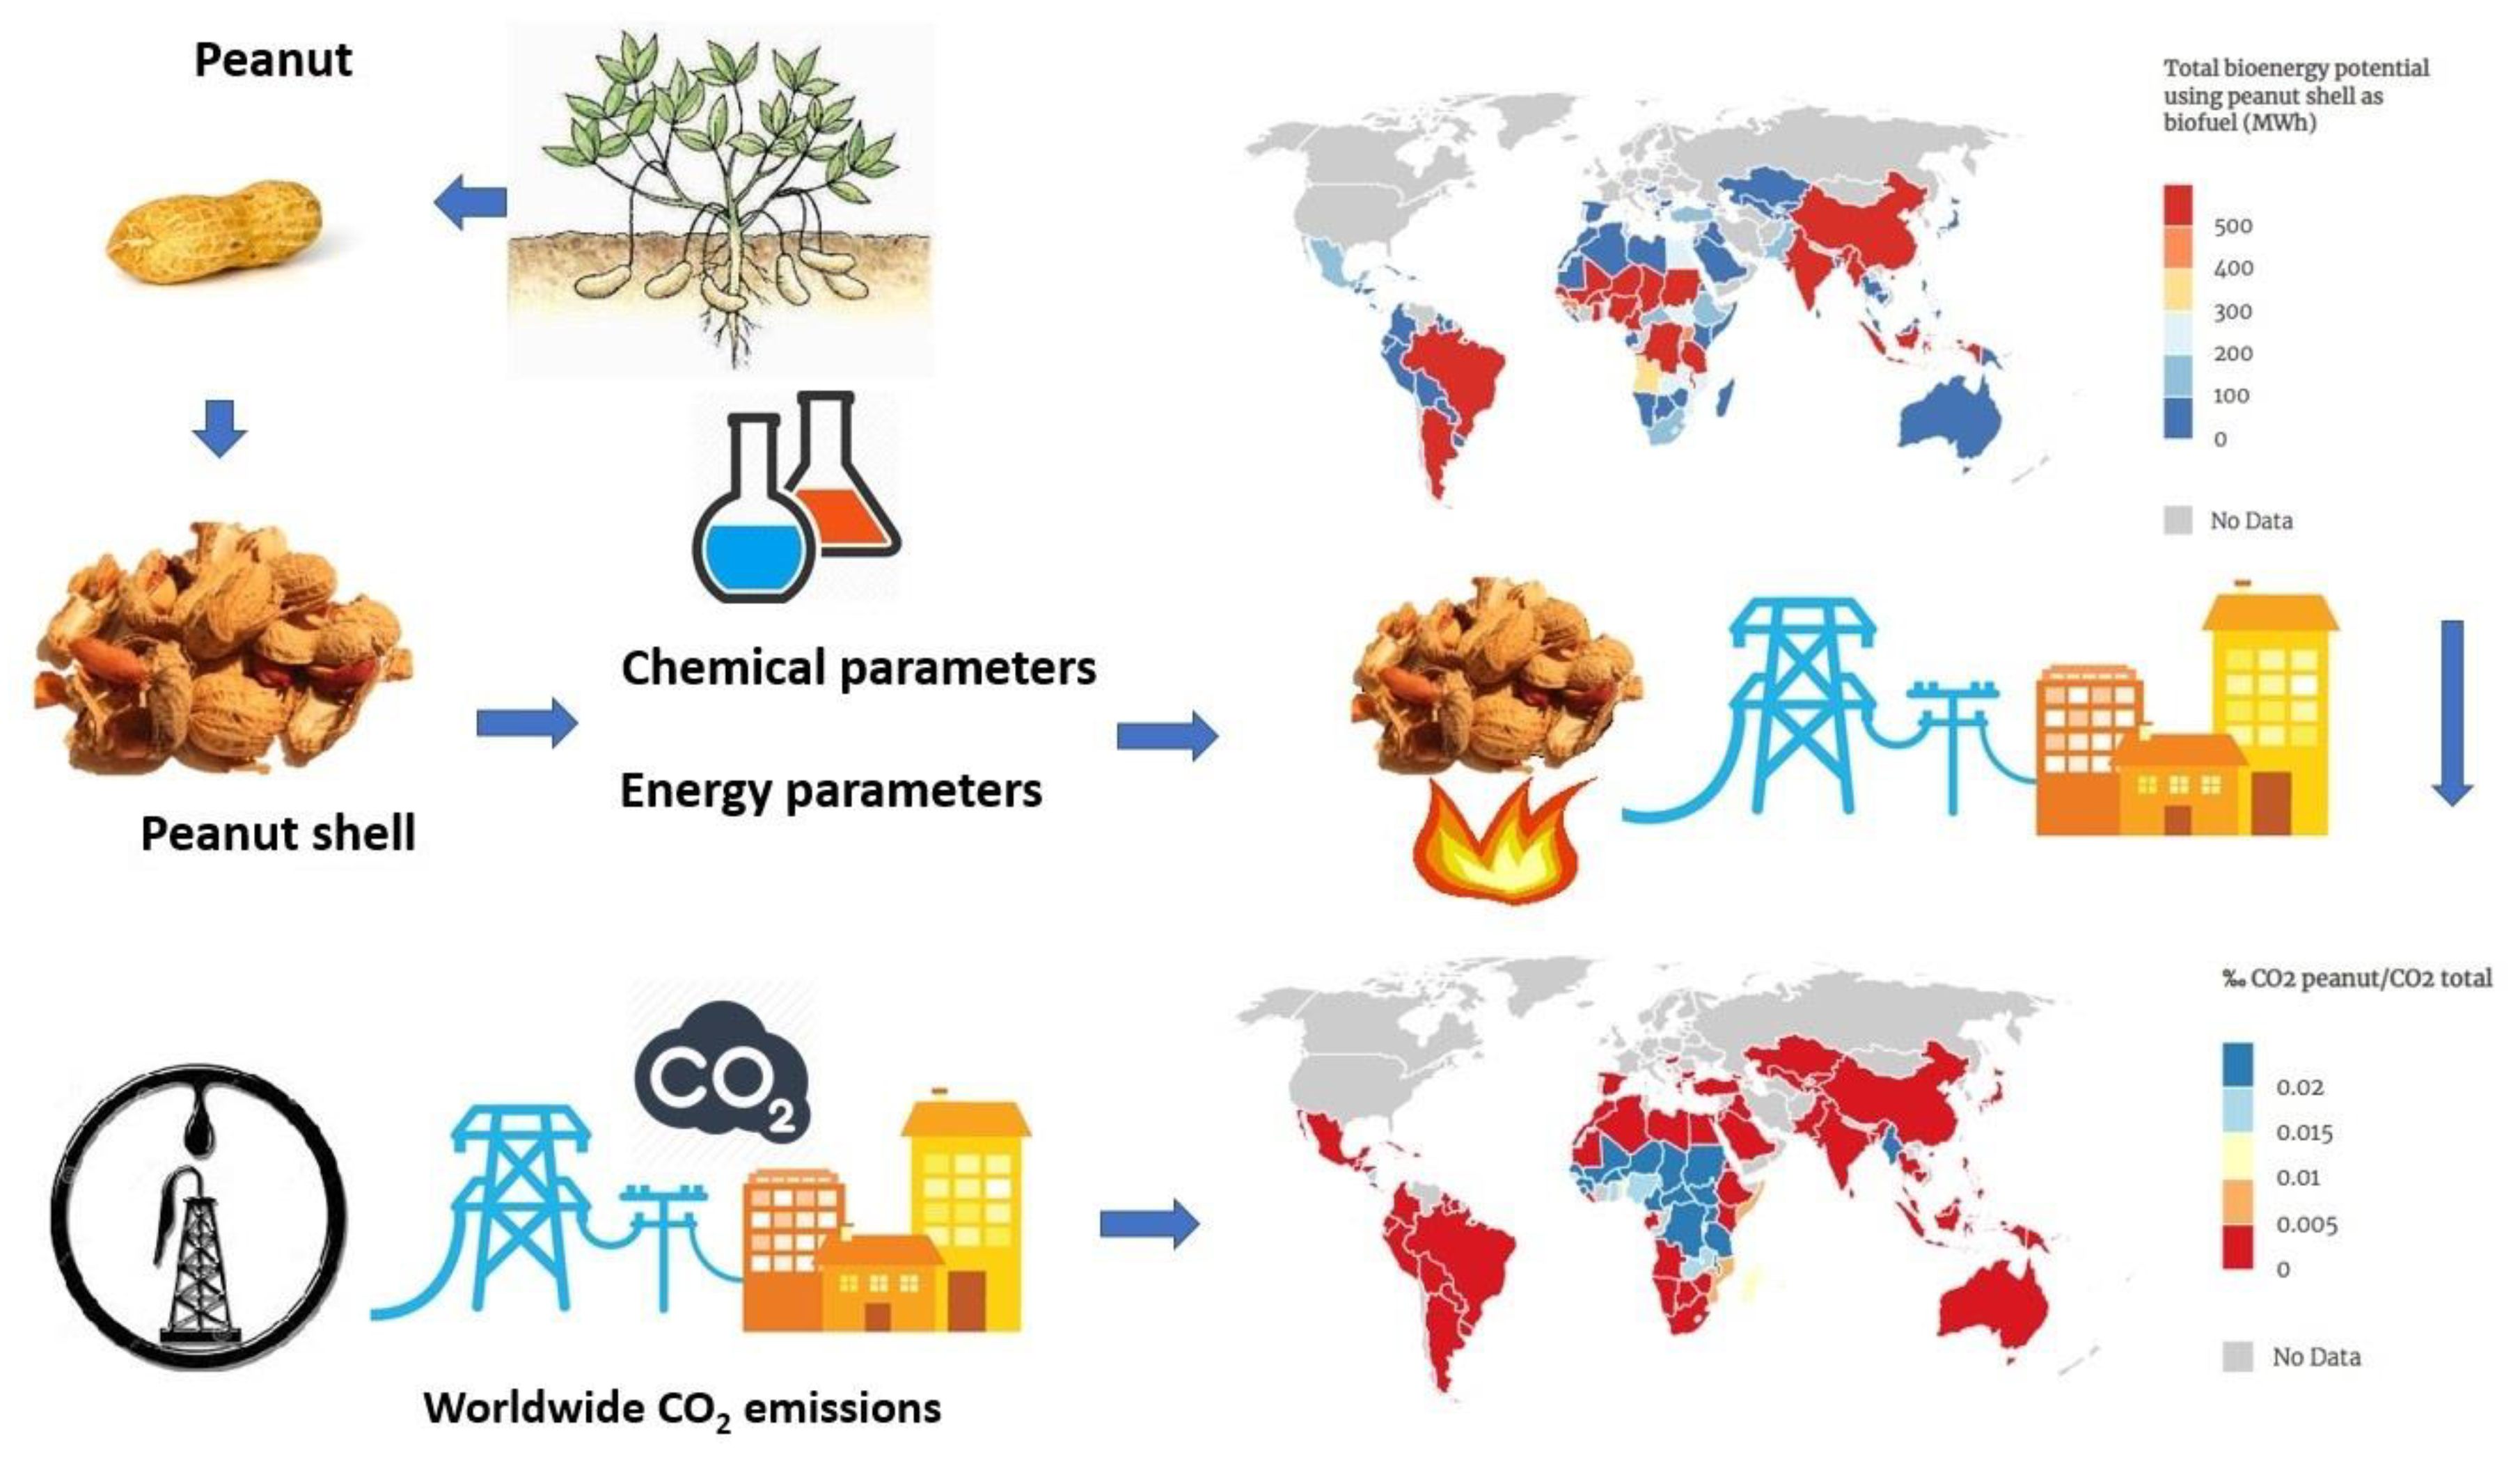
The main objectives of this study are, firstly, to evaluate the energy parameters of peanut shells as a possible solid biofuel applied as an energy source in residential and industrial heating installations. Secondly, different models are analysed to estimate the higher heating value (HHV) for biomass proposed by different scientists and to determine which most accurately fits the determination of this value for peanut shells. Thirdly, we evaluate the reduction in global CO2 emissions that would result from the use of peanut shells as biofuel.
2. Materials and Methods
2.1. Peanut Shells from Industrial Processing Samples for the Study
In order to study the energy potential of peanut shells, 3000 g of peanut shell residue samples was taken from various Andalusian industries (Figure 3).
2.2. Quality Parameters for Peanut Shell
The standard UNE-EN 14961-1 “Solid biofuels—Fuel specifications and classes—Part 1: General requirements”, established by the Spanish Association for Standardization and Certification (AENOR), were applied to determine the quality parameters for peanut shells. These standards, units, and parameters are shown in Table 1.
2.2.1. Physical Parameters
Moisture is defined as the total amount of water contained in the total mass of a biomass sample. Moisture may exist on the outside surface of the biomass or be embedded within it [36].
2.2.2. Chemical Parameters
The chemical properties mainly concern the composition of the constituent elements of biomass (nitrogen, hydrogen, carbon, oxygen, and sulphur). The ash content (inorganic elements) and behaviour are also often of interest.
Elemental Analysis
Elemental analysis allows us to establish the percentage by weight of the main elements with the greatest presence in the molecule structure of the organic material: carbon (C), hydrogen (H), nitrogen (N), oxygen (O), and sulphur (S). From the knowledge of these constituents, the oxidation reactions can be established, so that, for example, the precise air for combustion (stoichiometric air) can be determined. There are also certain empirical formulations which, based on the percentage by weight of each element, allow us to obtain an approximation of its energy content (calorific value) [21].
Immediate Analysis
Immediate analysis provides the moisture, ash, volatile material, and fixed carbon content of the biomass, expressed as percentages by weight. Basically, this analysis serves to identify the fraction of the biomass in which its chemical energy (fixed carbon and volatile compounds) and inert fraction (ash and moisture) are stored.
Volatile matter is the portion of fuel that is released in the form of gases and vapours (hydrocarbons) when the biomass is thermally decomposed [37].
Fixed carbon and ashes are the fractions that remain once the volatile matter has been released. Fixed carbon, in combustion processes, continues to burn slowly after the volatiles are released.
Ashes are the inorganic residues that remain after the combustion of fixed carbon and vary in their composition and participation percentages according to the biomass source and collection methods used [37].
2.2.3. Energy Parameters
The calorific value is the chemical energy of the fuel that can be transformed directly into thermal energy by a thermochemical oxidation (combustion) process. This property is usually expressed in units of energy per units of mass (generally kJ/kg, MJ/kg, or lime/kg). Its value is terminated experimentally by a device called a calorimetric pump [21].
There are two ways of expressing the calorific value of a fuel. If, after combustion, the water formed in the combustion gases (from moisture or hydrogen oxidation) is found in liquid form, the highest heating value (HHV) is obtained. If it remains in the form of steam, the lower heating value (LHV) is obtained. They can be expressed per unit of wet fuel or dry fuel [21].
3. Results and Discussion
The energetic properties of peanut shells were analysed from their main statistical descriptors. In addition, these properties were compared with those of other biomass waste.
3.1. Peanut Shell Quality Parameters
Samples of peanut shells obtained from the peanut industry were analysed in order to evaluate and determine the quality parameters.
The first step in the application of a fuel is to determine its chemical composition. The chemical composition of a fuel determines its properties, quality, applications, and environmental problems that can cause its combustion.
Table 2 shows the average, median, standard deviation, and minimum and maximum values of the various parameters.
It is important to know the percentage of N, S and Cl that each type of biomass has to study the environmental impact caused by its combustion, percentage of ash that causes problems of thermal efficiency in boilers, as well as the quantities of C, H, and O in order to estimate the calorific value of the biomass in question.
Peanut shells contribute to environmental conservation because their emissions into the atmosphere are lower than those of solid fuels because of their low sulphur (0.54%), nitrogen (0.50%), and chlorine (0.07%) content. Table 3 shows a comparison of the parameters obtained from peanut shells and other biofuels used in boilers, such as olive stones, pine pellets, almond shells, or avocado stones.
The biggest advantage is the neutral CO2 balance by closing the carbon cycle that the plants began to grow. Therefore, it can be said that emissions from biomass are not pollutants, since their composition is basically part of the CO2 captured by the plant from which the biomass originates and water vapour.
The accumulation of ash deposits inside biomass boilers causes problems of thermal efficiency and can obstruct the ducts through which the combustion gases circulate. The ashes generated after biomass combustion are particularly problematic due to their low melting points and the high concentrations of alkaline metals they contain, which encourage corrosion of the pipes and walls of the boiler.
The average ash content in the peanut shell is 4.26%, which when compared to other biomass, such as olive stones (0.77%), avocado stones (2.86%), oak pellets (3.32%), and almond shells (0.55%), it can be observed that although it is a high value, it is within the average ash values produced by other biofuels used in boilers.
Despite all the advantages of biomass as a fuel, it also causes significant technical problems in boilers. It is very important to consider the Cl content of the biomass, since ashes with a low melting point are generated, which at 700–800 °C, begin to soften and have corrosive properties, so the impact of the deposition of these ashes on the system must be taken into account. If there is a large amount of ash deposition, this can lead to a failure which can lead to a boiler stoppage. In this case, costly manual cleaning of the heat transfer surfaces will be necessary.
If we analyse the values of chlorine for peanut shells, we can see that these values are much lower than those obtained for almond shells, pine pellets, or avocado pits, so its use as a biofuel would improve the problems of corrosion in the hips.
Thermal applications with heat and hot water production are the most common in the biomass sector, although they can also be used for electricity production. Biomass can feed an air-conditioning system (heat and cold) in the same way as if it were powered by gas, diesel, or electricity.
Thermal production can be carried out by means of:
- -
- Stoves, usually of pellets or wood, that create a single room and usually act simultaneously as decorative elements.
- -
- Low power boilers for single-family homes or small buildings.
- -
- Boilers designed for a block or building of flats, which act as central heating.
- -
- Thermal power stations that heat several buildings or installations (district heating) or a group of houses.
Normally, residual biomass has a high moisture content (over 100% on a dry basis), so it requires prior conditioning for subsequent use for energy purposes. The peanut shell has a very low moisture content (5.79%), which is a great advantage since it is not necessary to dry it for energy purposes.
The values of HHV and LHV in peanut shells vary between 18.572 and 18.522 MJ/kg and 17.122 and 17.100 MJ/kg, respectively. The variations are very slight when applying the standard deviation, and they are similar values to the ones that have been obtained by other authors: 18.920 MJ/kg [43] or 19.2 MJ/kg [44]. It should be noted that the calorific value of peanut shells is similar or even higher than that of other biofuels. For example, the HHV of peanut shells (18.47 MJ/kg) is higher than olive stones (17.885 MJ/kg) or almond shells (18.200 MJ/kg). Table 3 shows this comparison and the HHV biomass/HHV peanut shell ratio, which shows that there are no variations above 10%.
Many of the resources covered by the term solid biofuels for the production of heat and/or electricity are characterized by their high moisture content. The fact that biofuels always have a certain moisture content is due to two causes. On the one hand, it should be borne in mind that water is the vehicle for transporting nutrients in plant matter, i.e., water is an inherent component of this. On the other hand, the resources considered here are characterized as all plant matter by their hygroscopicity, that is, by their capacity to absorb and lose moisture according to the environmental conditions of the surrounding environment in order to maintain the hygrometric balance. The water content can reach values even higher than 60% of the total weight of the biofuel, increasing the costs associated with its handling (transport, storage, and feeding in the plant) and making it difficult to carry out all the operations necessary for its energy transformation (milling, densification, combustion, etc.).
In the case of peanut shells, its moisture content is very low, which means that no drying treatment would be necessary, making it an ideal biofuel for use in the production of heat in household or industrial boilers.
3.2. Predictive Models for Estimating the HHV of Peanut Shell
The biomass HHV can be calculated theoretically from correlation equations that relate the elemental composition of biomass and other chemical elements. Table 4 shows 16 correlation equations of relevant authors in this field that have been used to calculate the HHV value of different biomasses from the experimental values of their elemental composition, sulphur, ash, fixed carbon, and volatile matter.
It should be borne in mind that the formulas analysed correspond to the HHV prediction for different types of biomass, in which the number of samples or the analysis methodology used must be taken into account. Therefore, it should be noted that despite the different origins of the formulas proposed by the different authors, the prediction results of HHV from peanut shells are very similar.
If we observe Table 5, the best prediction result of the HHV value for peanut shell has been achieved with Equation (12) with a deviation of 0.165%, followed by Equation (11), proposed by Demirbas et al. (2004), with a deviation of 0.259%. In third place is Equation (9), proposed by Tillman (1978), with a deviation of 0.444%, and fourthly, Equation (18). In addition, it should be noted that Equations (9), (11), (12), and (18) require only one parameter for their calculation, assuming that HHV is a linear function of its the carbon content, and then the algebraic equation has the form HHV= a + b·C, where C is the carbon content (%). This has proven to be the most optimal formula for the calculation of HHV, with an expected error of less than 1% in absolute value. It should be noted that carbon and oxygen almost always account for about 90% of the biomass weight and that the correlation between carbon and oxygen is also high [44], so the results are logical. Therefore, the main advantage of this equation is that, using the data from an elemental component of biomass such as carbon, more sophisticated laboratory equipment is not needed, which is not always available everywhere.
3.3. Potential of Peanut Shell for Reducing CO2 Emissions
Carbon dioxide emissions into the atmosphere are a major environmental concern. Considered one of the reasons for climate change, an alternative to fossil fuels is making its way: biomass.
The burning of fossil fuels is one of the main reasons for global warming. The search for energy sources to replace coal or oil is necessary to maintain sustainable economic development. This section shows the benefits of using peanut shells as a biofuel to reduce CO2 emissions.
Once the different energy parameters of the peanut shell are known, its energy potency can be calculated from the world production of peanuts using Equation (21):
where:
Ec is the potential of energy production using the peanut shell as biofuel in each country (MWh);
RH is relative humidity (10%);
Pc is the peanut shell production in each country (kg);
HHV is the higher heating value (18.547 MJ/kg);
fs is the factor of shell in a whole peanut (30%);
Uc is the unit conversion (0.000277778 Wh/J).
Figure 4 shows the global energy produced using peanut shells as biofuel. The largest production of energy from peanut shells is found in China (25,579.75 MWh), followed by India (11,440.42 MWh), Nigeria (5253.69 MWh), the United States (3637.60 MWh), and Sudan (2891.79 MWh).
In many industrialized countries, biomass accounts for more than 50% of national energy consumption. There, the consumption of energy biomass is often much lower due to the predominant contribution of “fossil fuels”. This situation reached a turning point in the 1970s with the first oil crisis, which allowed us to glimpse the unsustainability of a model based on the almost exclusive use of fossil resources. Since then, there has been a growing interest in energy saving and efficiency as well as in the consumption of local renewable resources, including biomass, with the dual objective of reducing energy dependence and CO2 emissions. Therefore, in order to limit this increase in emissions, strategic plans such as the European Union’s Strategic Framework for 2030 or the United States’ Clean Energy Plan have been implemented, in which the United States undertakes to reduce CO2 emissions by 32% by 2030 [58].
Energy competitiveness needs to be complemented by other measures to tackle climate change, i.e., to curb the increase in greenhouse gas emissions without damaging economic growth:
- -
- Efficiency improvement.
- -
- Limitation of inefficient coal-fired power stations.
- -
- Decrease in methane emissions from oil and gas.
- -
- Reform of fossil fuel subsidies.
- -
- Increase in renewable energies, without their use leading to a loss of competition with respect to other countries where there are no measures to reduce greenhouse gas emissions.
In this work, the CO2 reduction that would result from the use of peanut shells as an energy source has been evaluated using the method explained in Figure 5. For this purpose, the total emissions values for 2014 (last updated) provided by the World Data Bank (http://databank.worldbank.org/data/home.aspx) [58] and data of world peanut production from the same year (2014) provided by FAO [32] have been taken as a reference. It has also been taken into account that if the energy that can be produced from peanut shells were produced from conventional energy sources, these would generate 0.357 t of CO2.
Therefore, the global CO2 savings would be equivalent to if the energy produced by the peanut shell were produced by conventional sources. It is logical that the greatest savings in CO2 emissions would occur in those countries with the highest production of peanuts, since they would be the largest producers of energy with this biofuel. The top 10 countries are: China (18.22 kt), India (4.08 kt), Nigeria (1.88 kt), Myanmar (0.83 kt), Argentina (0.64 kt), Chad (0.44 kt), Senegal (0.37 kt), United Republic of Tanzania (0.90 kt), and the United States (1.30 kt).
Figure 6 shows a comparison between the savings in CO2 emissions and the total emissions produced in each country per thousand. If we analyse this figure, we can see that the 10 countries with the greatest savings in CO2 emissions in relation to their total emissions are: Chad (0.60‰), Central African Republic (0.22‰), Mali (0.20‰), Malawi (0.17‰), Niger (0.10‰), Gambia (0.09‰), Guinea-Bissau (0.08‰), United Republic of Tanzania (0.07‰), Sudan (0.07‰), and Guinea (0.07‰).
4. Conclusions
Biomass residues are a potentially huge source of energy-producing materials. This study has evaluated the energy parameters of peanut shells as a possible solid biofuel applied as an energy source in industrial and residential heating installations and the reduction in global CO2 emissions that would result from the use of them.
The HHV is a major property of biomass fuels. The HHV of peanut shells obtained (18.547 MJ/kg) is higher than other biomass sources such as almond shells (18.200 MJ/kg) or olive stones (17.885 MJ/kg) and similar to other sources of biomass presently used for industrial and home heating applications. Different prediction models of the HHV value proposed by scientists for different types of biomass have been analysed and the one that best fits the calculation for the peanut shell has been determined. Therefore, of the mathematical equations analysed for the estimation of HHV, the best performers were linear equations which were based only on total carbon content, which have shown a deviation below 1%; specifically, HHV = −3.147 + 0.468 C.
The possibilities for applications of the use of renewable energy sources such as biomass to replace fossil fuel combustion as a primary energy source is vital in all countries of the world. Peanuts are grown mainly in Asia, with a global production rate of 65.3%, followed by Africa with 26.2%, the Americas with 8.4%, and Oceania with 0.1%. The CO2 reduction that would result from the use of peanut shells as an energy source has been evaluated and the 10 countries with the highest CO2 savings are: China (18.22 kt), India (4.08 kt), Nigeria (1.88 kt), Myanmar (0.83 kt), Argentina (0.64 kt), Chad (0.44 kt), Senegal (0.37 kt), United Republic of Tanzania (0.90 kt) and the United States (1.30 kt). If we compare between the savings in CO2 emissions and the total emissions produced in each country per thousand, the 10 countries with the greatest savings in CO2 emissions in relation to their total emissions are: Chad (0.60‰), Central African Republic (0.22‰), Mali (0.20‰), Malawi (0.17‰), Niger (0.10‰), Gambia (0.09‰), Guinea-Bissau (0.08‰), United Republic of Tanzania (0.07‰), Sudan (0.07‰), and Guinea (0.07‰).
Finally, the moisture content of peanut shell is very low, which means that no drying treatment would be necessary, making it an ideal biofuel for use in the production of heat in household or industrial boilers. In addition, the combustion technologies are available commercially worldwide. As biomass is the only renewable carbon-based fuel, its use is playing an increasingly important role in climate protection.
Author Contributions
M.-A.P.-M. dealt with literature review and article writing. M.-A.P.-M. and Q.H.-E. analyzed the data. F.M.-A. and A.-J.P.-M.: Research idea, article writing and formatting. They share the structure and aims of the manuscript, paper drafting, editing and review. All authors have read and approved the final manuscript.
Funding
This research received no external funding.
Conflicts of Interest
The authors declare no conflict of interest.
References
- Nie, S.; Huang, Z.C.; Huang, G.H.; Yu, L.; Liu, J. Optimization of electric power systems with cost minimization and environmental-impact mitigation under multiple uncertainties. Appl. Energy 2018, 221, 249–267. [Google Scholar] [CrossRef]
- Zhang, S.; Ren, H.; Zhou, W.; Yu, Y.; Chen, C. Assessing air pollution abatement co-benefits of energy efficiency improvement in cement industry: A city level analysis. J. Clean. Prod. 2018, 185, 761–771. [Google Scholar] [CrossRef]
- Jung, J.; Koo, Y. Analyzing the Effects of Car Sharing Services on the Reduction of Greenhouse Gas (GHG) Emissions. Sustainability 2018, 10, 539. [Google Scholar] [CrossRef]
- Lee, S.; Kim, M.; Lee, J. Analyzing the Impact of Nuclear Power on CO2 Emissions. Sustainability 2017, 9, 1428. [Google Scholar] [CrossRef]
- Cho, S.; Na, S. The Reduction of CO2 Emissions by Application of High-Strength Reinforcing Bars to Three Different Structural Systems in South Korea. Sustainability 2017, 9, 1652. [Google Scholar]
- O’reilly, C.M.; Alin, S.R.; Plisnier, P.D.; Cohen, A.S.; McKee, B.A. Climate change decreases aquatic ecosystem productivity of Lake Tanganyika, Africa. Nature 2003, 424, 766. [Google Scholar] [CrossRef] [PubMed]
- Garrabou, J.; Coma, R.; Bensoussan, N.; Bally, M.; Chevaldonné, P.; Cigliano, M.; Diaz, D.; Harmelin, J.G.; Gambi, M.C.; Kersting, D.K.; et al. Mass mortality in Northwestern Mediterranean rocky benthic communities: Effects of the 2003 heat wave. Glob. Chang. Biol. 2009, 15, 1090–1103. [Google Scholar] [CrossRef]
- Wilby, R.L.; Dawson, C.W.; Barrow, E.M. SDSM—A decision support tool for the assessment of regional climate change impacts. Environ. Model. Softw. 2002, 17, 145–157. [Google Scholar] [CrossRef]
- Reckien, D.; Heidrich, O.; Church, J.; Pietrapertos, F.; De Gregorio-Hurtado, S.; D’Alonzo, V.; Foley, A.; Simoes, S.G.; Lorencová, E.K.; Orruk, H.; et al. How are cities planning to respond to climate change? assessment of local climate plans from 885 cities in the EU-28. J. Clean. Prod. 2018, 191, 207–219. [Google Scholar] [CrossRef]
- D’Agostino, D.; Parker, D. A framework for the cost-optimal design of nearly zero energy buildings (NZEBs) in representative climates across Europe. Energy 2018, 149, 814–829. [Google Scholar] [CrossRef]
- De la Cruz-Lovera, C.; Perea-Moreno, A.-J.; de la Cruz-Fernández, J.-L.; Alvarez-Bermejo, J.A.; Manzano-Agugliaro, F. Worldwide Research on Energy Efficiency and Sustainability in Public Buildings. Sustainability 2017, 9, 1294. [Google Scholar] [CrossRef]
- Yama, A.; Abe, N. Ex-post assessment of the Kyoto protocol—Quantification of CO2 mitigation impact in both annex B and non-annex B countries. Appl. Energy 2018, 220, 286–295. [Google Scholar] [CrossRef]
- Nava, C.R.; Meleo, L.; Cassetta, E.; Morelli, G. The impact of the EU-ETS on the aviation sector: Competitive effects of abatement efforts by airlines. Transp. Res. Part A Policy Pract. 2018, 113, 20–34. [Google Scholar] [CrossRef] [Green Version]
- Newbery, D.; Pollitt, M.G.; Ritz, R.A.; Strielkowski, W. Market design for a high-renewables European electricity system. Renew. Sustain. Energy Rev. 2018, 91, 695–707. [Google Scholar] [CrossRef]
- European Commission. EU Reference Scenario 2016 Energy, Transport and GHG Emissions—Trends to 2050 Main Results. 2016. Available online: https://ec.europa.eu/energy/sites/ener/files/documents/20160712_Summary_Ref_scenario_MAIN_RESULTS%20(2)-web.pdf (accessed on 20 July 2018).
- Gallo, C.; Faccilongo, N.; La Sala, P. Clustering analysis of environmental emissions: A study on Kyoto protocol’s impact on member countries. J. Clean. Prod. 2018, 172, 3685–3703. [Google Scholar] [CrossRef]
- Ali, Y. Carbon, water and land use accounting: Consumption vs production perspectives. Renew. Sustain. Energy Rev. 2017, 67, 921–934. [Google Scholar] [CrossRef]
- Perea-Moreno, M.-A.; Hernandez-Escobedo, Q.; Perea-Moreno, A.-J. Renewable Energy in Urban Areas: Worldwide Research Trends. Energies 2018, 11, 577. [Google Scholar] [CrossRef]
- Perea-Moreno, A.-J.; Perea-Moreno, M.-A.; Hernandez-Escobedo, Q.; Manzano-Agugliaro, F. Towards forest sustainability in mediterranean countries using biomass as fuel for heating. J. Clean. Prod. 2017, 156, 624–634. [Google Scholar] [CrossRef]
- Pleßmann, G.; Blechinger, P. Outlook on south-east European power system until 2050: Least-cost decarbonization pathway meeting EU mitigation targets. Energy 2017, 137, 1041–1053. [Google Scholar] [CrossRef]
- Perea-Moreno, A.-J.; Aguilera-Ureña, M.-J.; Manzano-Agugliaro, F. Fuel properties of avocado stone. Fuel 2016, 186, 358–364. [Google Scholar] [CrossRef]
- Filipe dos Santos Viana, H.; Martins Rodrigues, A.; Godina, R.; Carlos de Oliveira Matias, J.; Jorge Ribeiro Nunes, L. Evaluation of the Physical, Chemical and Thermal Properties of Portuguese Maritime Pine Biomass. Sustainability 2018, 10, 2877. [Google Scholar] [CrossRef]
- Agugliaro, F.M. Gasification of greenhouse residues for obtaining electrical energy in the south of Spain: Localization by GIS. Interciencia 2007, 32, 131–136. [Google Scholar]
- Casanova-Peláez, P.J.; Palomar-Carnicero, J.M.; Manzano-Agugliaro, F.; Cruz-Peragón, F. Olive cake improvement for bioenergy: The drying kinetics. Int. J. Green Energy 2015, 12, 559–569. [Google Scholar] [CrossRef]
- Perea-Moreno, A.J.; Juaidi, A.; Manzano-Agugliaro, F. Solar greenhouse dryer system for wood chips improvement as biofuel. J. Clean. Prod. 2016, 135, 1233–1241. [Google Scholar] [CrossRef]
- Manzano-Agugliaro, F.; Sanchez-Muros, M.J.; Barroso, F.G.; Martínez-Sánchez, A.; Rojo, S.; Pérez-Bañón, C. Insects for biodiesel production. Renew. Sustain. Energy Rev. 2012, 16, 3744–3753. [Google Scholar] [CrossRef]
- Al-Hamamre, Z.; Saidan, M.; Hararah, M.; Rawajfeh, K.; Alkhasawneh, H.E.; Al-Shannag, M. Wastes and biomass materials as sustainable-renewable energy resources for Jordan. Renew. Sustain. Energy Rev. 2017, 67, 295–314. [Google Scholar] [CrossRef]
- Yevich, R.; Logan, J.A. An assessment of biofuel use and burning of agricultural waste in the developing world. Glob. Biogeochem. Cycles 2003, 17. [Google Scholar] [CrossRef] [Green Version]
- Hammons, R.O.; Herman, D.; Stalker, H.T. Origin and early history of the peanut. In Peanuts; Elsevier: Amsterdam, The Netherlands, 2016; pp. 1–26. [Google Scholar]
- McArthur, W.C.; Grise, V.N.; Doty, H.O., Jr.; Hacklander, D.; US Peanut Industry; US Department of Agriculture; Economic Research Service. Agricultural Economics Report; EMS Publications: Washington, DC, USA, 1982; p. 493.
- Ramos, M.J.; Fernández, C.M.; Casas, A.; Rodríguez, L.; Pérez, Á. Influence of fatty acid composition of raw materials on biodiesel properties. Bioresour. Technol. 2009, 100, 261–268. [Google Scholar] [CrossRef] [PubMed]
- FAOSTAT. Agriculture Data. 2016. Available online: http://www.fao.org/faostat/en/#home (accessed on 13 May 2018).
- Olayinka, B.U.; Etejere, E.O. Growth analysis and yield of two varieties of groundnut (Arachis hypogaea L.) as influenced by different weed control methods. Indian J. Plant Physiol. 2015, 20, 130–136. [Google Scholar] [CrossRef] [PubMed]
- Zhao, X.; Chen, J.; Du, F. Potential use of peanut by-products in food processing: A review. J. Food Sci. Technol. 2012, 49, 521–529. [Google Scholar] [CrossRef] [PubMed]
- Rinaldi, A.; Schweiker, M.; Iannone, F. On uses of energy in buildings: Extracting influencing factors of occupant behaviour by means of a questionnaire survey. Energy Build. 2018, 168, 298–308. [Google Scholar] [CrossRef]
- Sebastián Nogués, F. Energía de la Biomasa; Prensas Universitarias de Zaragoza: Zaragoza, Spain, 2010; Volume I, p. 558. ISBN 978-84-92774-91-3. [Google Scholar]
- Mata-Sánchez, J.; Pérez-Jiménez, J.A.; Díaz-Villanueva, M.J.; Serrano, A.; Núñez-Sánchez, N.; López-Giménez, F.J. Statistical evaluation of quality parameters of olive stone to predict its heating value. Fuel 2013, 113, 750–756. [Google Scholar] [CrossRef]
- García, R.; Pizarro, C.; Lavín, A.G.; Bueno, J.L. Spanish biofuels heating value estimation. Part I: Ultimate analysis data. Fuel 2014, 117, 1130–1138. [Google Scholar] [CrossRef]
- García, R.; Pizarro, C.; Lavín, A.G.; Bueno, J.L. Biomass sources for thermal conversion. Techno-economical overview. Fuel 2017, 195, 182–189. [Google Scholar] [CrossRef]
- Arranz, J.I.; Miranda, M.T.; Montero, I.; Sepúlveda, F.J.; Rojas, C.V. Characterization and combustion behaviour of commercial and experimental wood pellets in south west Europe. Fuel 2015, 142, 199–207. [Google Scholar] [CrossRef]
- Gómez, N.; Rosas, J.G.; Cara, J.; Martínez, O.; Alburquerque, J.A.; Sánchez, M.E. Slow pyrolysis of relevant biomasses in the mediterranean basin. Part 1. Effect of temperature on process performance on a pilot scale. J. Clean. Prod. 2016, 120, 181–190. [Google Scholar] [CrossRef]
- González, J.F.; González-García, C.M.; Ramiro, A.; Gañán, J.; González, J.; Sabio, E.; Román, S.; Turegano, J. Use of almond residues for domestic heating: Study of the combustion parameters in a mural boiler. Fuel Process. Technol. 2005, 86, 1351–1368. [Google Scholar] [CrossRef]
- Abe, H.; Katayama, A.; Sah, B.P.; Toriu, T.; Samy, S.; Pheach, P.; Adams, M.A.; Grierson, P.F. Potential for rural electrification based on biomass gasification in Cambodia. Biomass Bioenergy 2007, 31, 656–664. [Google Scholar] [CrossRef]
- Singh, M.; Singh, R.; Gill, G. Estimating the correlation between the calorific value and elemental components of biomass using regrassion analysis. Int. J. Ind. Electron. Electr. Eng. 2015, 3, 18–23. [Google Scholar]
- Jenkins, B.M.; Ebeling, J.M. Correlations of physical and chemical properties of terrestrial biomass with conversion. In Symposium Papers-Energy from Biomass and Wastes; Inst of Gas Technology: Des Plaines, IL, USA, 1985; pp. 371–403. [Google Scholar]
- Sheng, C.; Azevedo, J.L.T. Estimating the higher heating value of biomass fuels from basic analysis data. Biomass Bioenergy 2005, 28, 499–507. [Google Scholar] [CrossRef]
- Yin, C.Y. Prediction of higher heating values of biomass from proximate and ultimate analyses. Fuel 2011, 90, 1128–1132. [Google Scholar] [CrossRef] [Green Version]
- Graboski, M.; Bain, R. Properties of biomass relevant to gasification. Surv. Biomass Gasif. 1979, 2, 21–65. [Google Scholar]
- Callejón-Ferre, A.J.; Velázquez-Martí, B.; López-Martínez, J.A.; Manzano-Agugliaro, F. Greenhouse crop residues: Energy potential and models for the prediction of their higher heating value. Renew. Sustain. Energy Rev. 2011, 15, 948–955. [Google Scholar] [CrossRef]
- Channiwala, S.A.; Parikh, P.P. A unified correlation for estimating HHV of solid, liquid and gaseous fuels. Fuel 2002, 81, 1051–1063. [Google Scholar] [CrossRef]
- Bridgwater, A.V.; Double, J.M.; Earp, D.M. Technical and Market Assessment of Biomass Gasification in the United Kingdom; ETSU Report; UKAEA: Harwell, UK, 1996. [Google Scholar]
- Tillman, D.A. Wood as an Energy Resource; Academic Press: New York, NY, USA, 1978; p. 266. ISBN 978-0-12-691260-9. [Google Scholar]
- Annamalai, K.; Sweeten, J.M.; Ramalingam, S.C. Estimation of gross heating values of biomass fuels. Trans. ASAE 1987, 30, 1205–1208. [Google Scholar] [CrossRef]
- Demirbaş, A.; Demirbaş, A.H. Estimating the calorific values of lignocellulosic fuels. Energy Explor. Exploit. 2004, 22, 135–143. [Google Scholar] [CrossRef]
- Jimennez, L.; Gonzales, F. Study of the physical and chemical properties of lignocellulosic residues with a view to the production of fuels. Fuel 1991, 70, 947–950. [Google Scholar] [CrossRef]
- Demirbaş, A. Calculation of higher heating values of biomass fuels. Fuel 1997, 76, 431–434. [Google Scholar] [CrossRef]
- Cordedo, T.; Marquez, F.; Rodriguez-Mirasol, J.; Rodriguez, J.J. Predicting heating values of lignocellulosics and carbonaceous materials from proximate analysis. Fuel 2001, 80, 1567–1571. [Google Scholar] [CrossRef]
- World Bank 2018. Available online: http://databank.worldbank.org/data/home.aspx (accessed on 1 August 2018).
Figure 1.
Worldwide peanut production (year 2016).
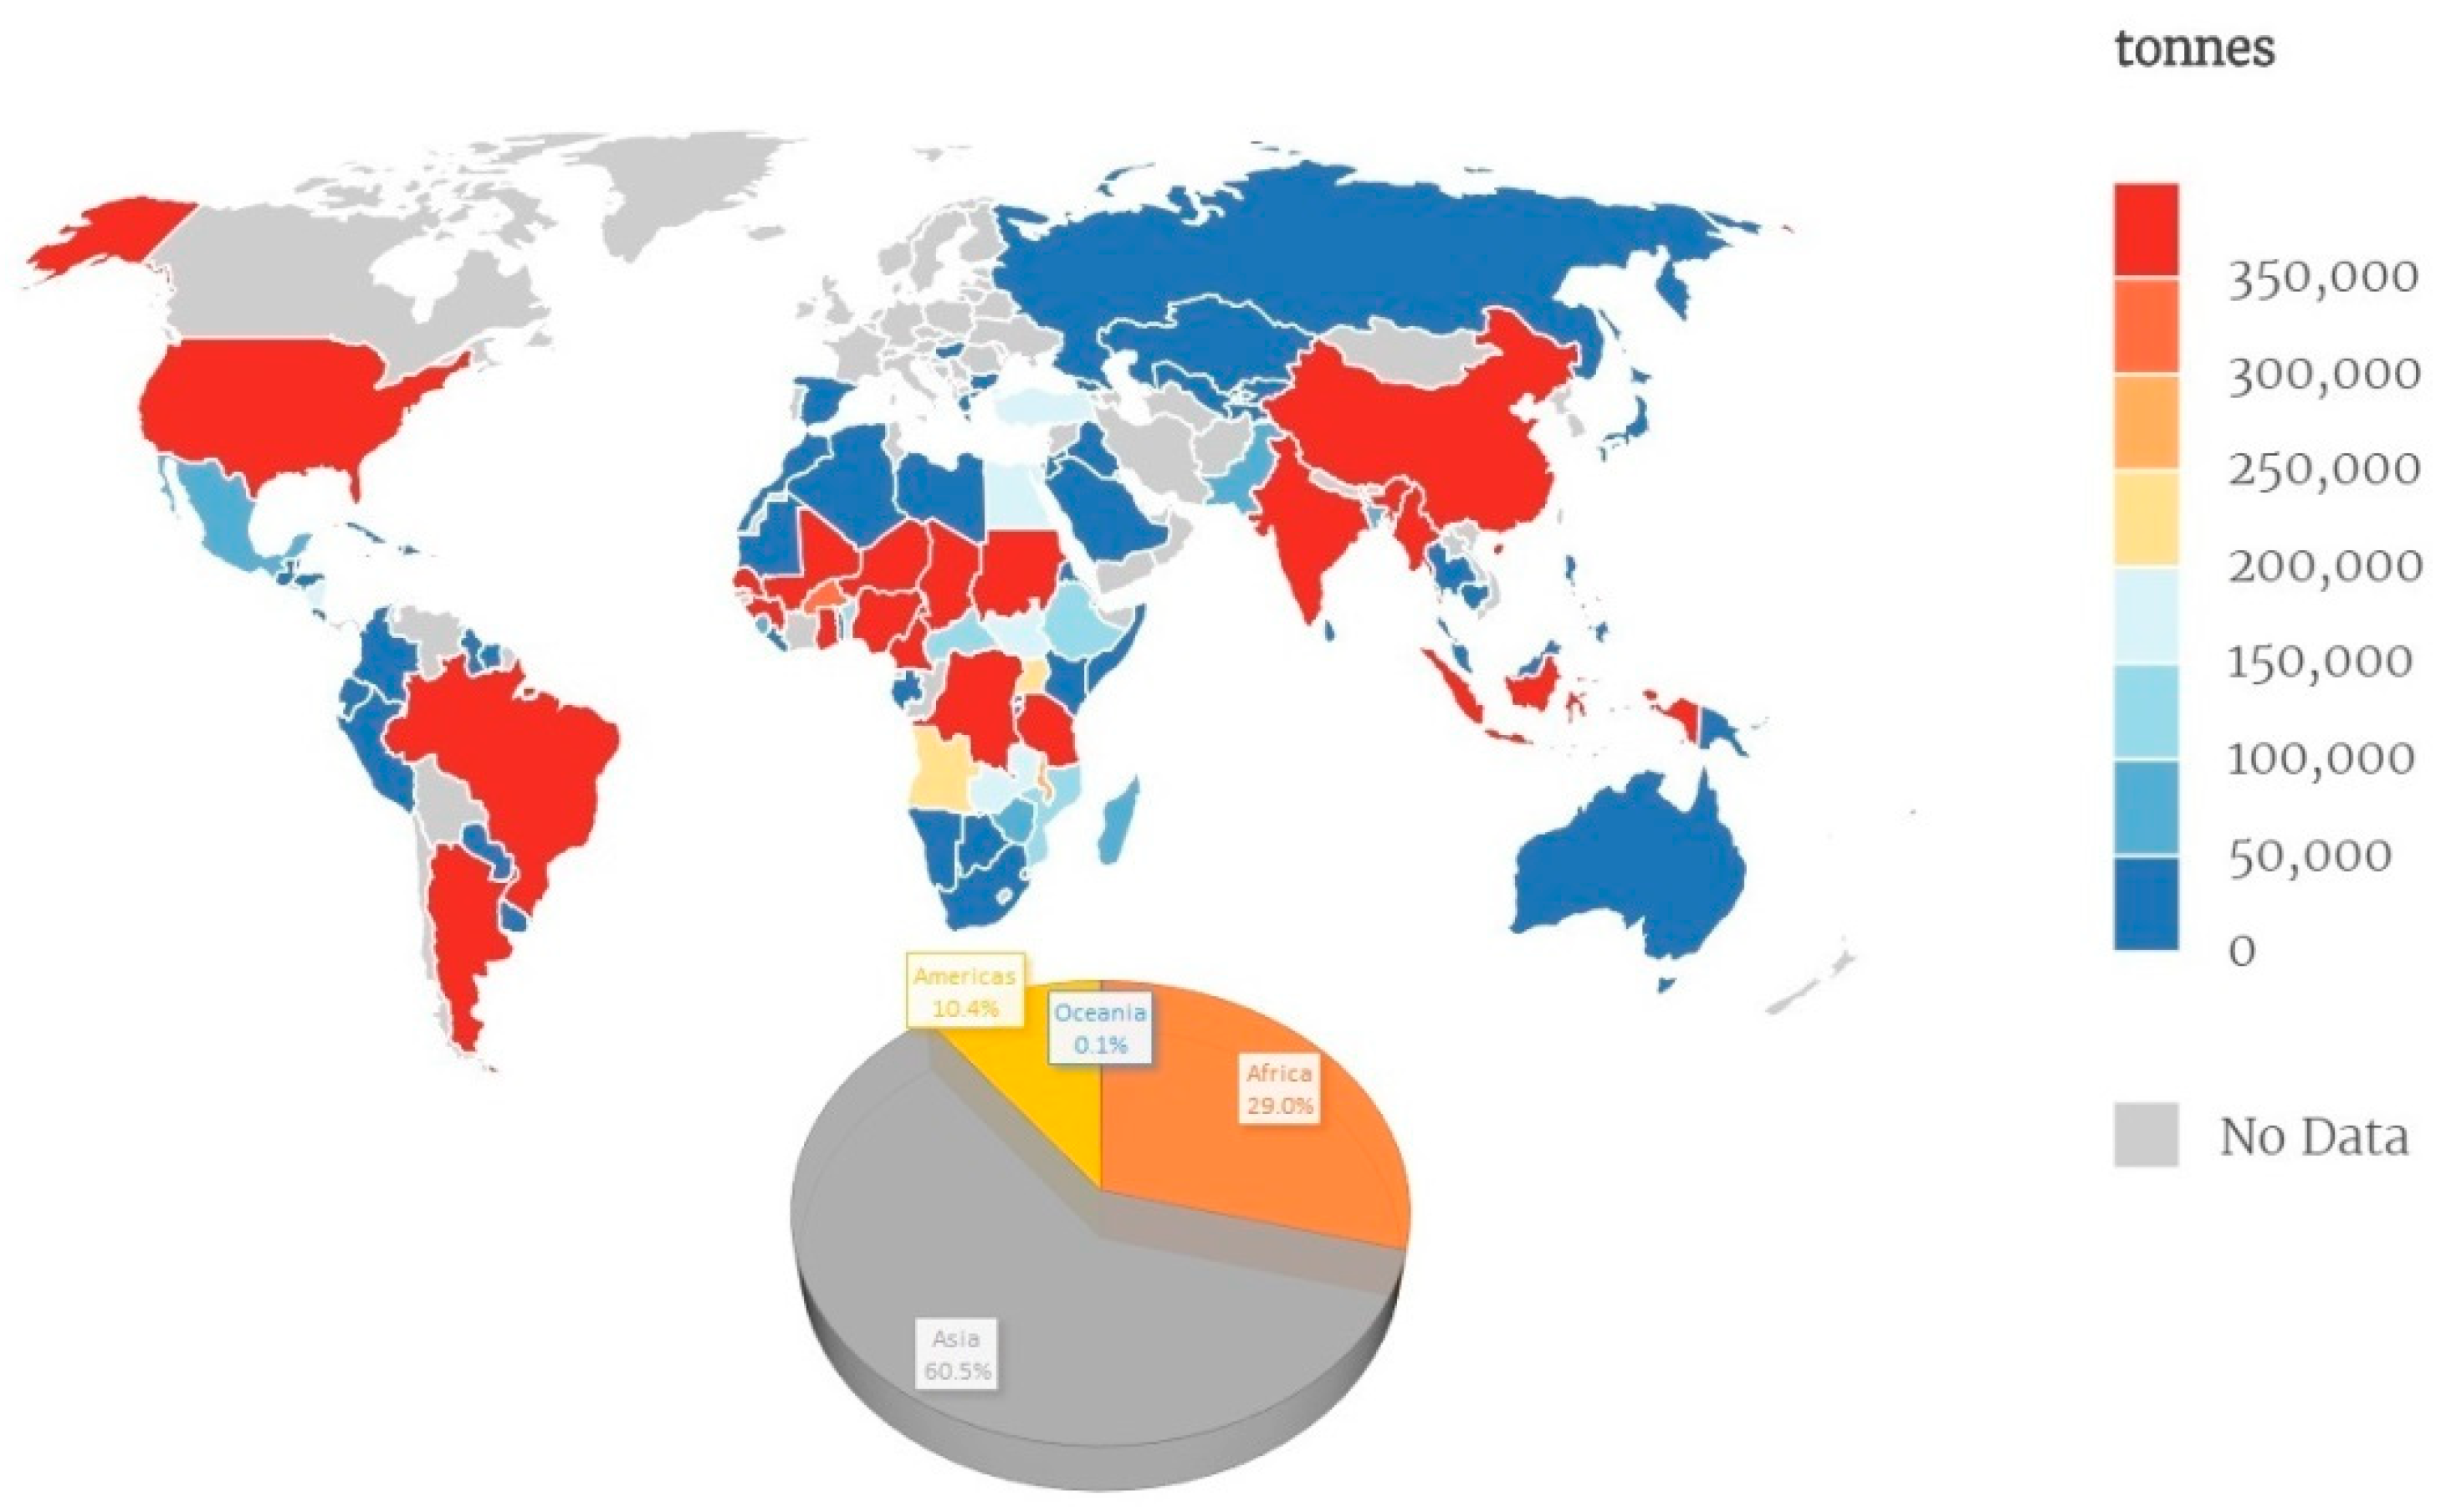
Figure 2.
World peanut production during a 20-year period [32].
Figure 2.
World peanut production during a 20-year period [32].

Figure 3.
Peanut shells from industrial processing.

Figure 4.
Total bioenergy potential using peanut shell as biofuel.

Figure 5.
Methodology for reducing CO2 emissions by using peanut shell.

Figure 6.
Potential of peanut shell for reducing CO2 emissions compared to total CO2 emissions for peanut producer countries.
Figure 6.
Potential of peanut shell for reducing CO2 emissions compared to total CO2 emissions for peanut producer countries.


Table 1.
Biomass quality parameter standards and measurement equipment used.
| Parameter | Unit | Standards | Measurement Equipment |
|---|---|---|---|
| Moisture | % | EN 14774-1 | Drying Oven Memmert UFE 700 |
| Ash | % | EN 14775 | Muffle Furnace NABERTHERM LVT 15/11 |
| Higher heating value | MJ/kg | EN 14918 | Calorimeter Parr 6300 |
| Lower heating value | MJ/kg | EN 14918 | Calorimeter Parr 6300 |
| Total carbon | % | EN 15104 | Analyzer LECO TruSpec CHN 620-100-400 |
| Total hydrogen | % | EN 15104 | Analyzer LECO TruSpec CHN 620-100-400 |
| Total nitrogen | % | EN 15104 | Analyzer LECO TruSpec CHN 620-100-400 |
| Total sulphur | % | EN 15289 | Analyzer LECO TruSpec CHN 620-100-400 |
| Total chlorine | mg/kg | EN 15289 | Titrator Mettler Toledo G20 |
| Volatile matter | % | EN 15148 | Muffle Furnace NABERTHERM LVT 15/11 |
| Fixed carbon | % | EN 15148 | Muffle Furnace NABERTHERM LVT 15/11 |
Table 2.
Quality parameters data of peanut shell samples.
| Parameter | Unit | Standard Value | Standard Deviation (SD) | Maximum Value | Minimum Value |
|---|---|---|---|---|---|
| Moisture ** | % | 5.79 | --- | 5.79 | 5.79 |
| Ash content * | % | 4.26 | 0.15 | 4.41 | 4.11 |
| HHV * | MJ/kg | 18.547 | 0.025 | 18.572 | 18.522 |
| LHV * | MJ/kg | 17.111 | 0.011 | 17.122 | 17.100 |
| Total carbon * | % | 46.42 | 0.007 | 46.427 | 46.413 |
| Total hydrogen * | % | 6.61 | 0.016 | 6.626 | 6.594 |
| Total nitrogen * | % | 0.50 | 0.012 | 0.512 | 0.488 |
| Total sulphur * | % | 0.54 | 0.01 | 0.55 | 0.53 |
| Total oxygen * | % | 41.77 | 2.453 | 44.223 | 39.317 |
| Total chlorine * | % | 0.07 | 0.001 | 0.071 | 0.069 |
| Volatile matter * | % | 84.90 | 1.09 | 85.99 | 83.81 |
| Fixed carbon * | % | 13.40 |
* dry bases, ** wet bases.
Table 3.
Comparison of peanut shell with other biomass materials.
| Parameters | Unit | Avocado Stone [21] | Olive Stone [37,38,39] | Pine Pellets [39,40] | Peanut Shell | Almond Shell [39,41,42] |
|---|---|---|---|---|---|---|
| Moisture | % | 35.20 | 18.45 | 7.29 | 5.79 | 7.63 |
| HHV | MJ/kg | 19.145 | 17.884 | 20.030 | 18.547 | 18.200 |
| LHV | MJ/kg | 17.889 | 16.504 | 18.470 | 16.994 | 17.920 |
| Ash content | % | 2.86 | 0.77 | 0.33 | 4.26 | 0.55 |
| Total carbon | % | 48.01 | 46.55 | 47.70 | 46.42 | 49.27 |
| Total hydrogen | % | 5.755 | 6.33 | 6.12 | 6.61 | 6.06 |
| Total nitrogen | % | 0.447 | 1.810 | 1.274 | 0.50 | 0.120 |
| Total sulphur | % | 0.104 | 0.110 | 0.004 | 0.54 | 0.050 |
| Total oxygen | % | 42.80 | 45.20 | 52.30 | 41.77 | 44.49 |
| Total chlorine | % | 0.024 | 0.060 | 0.000 | 0.07 | 0.01 |
| % | 103.22 | 96.43 | 110.05 | 100 | 98.13 |
Table 4.
Evaluated HHV correlation equations.
| No. | Name of the Authors and Reference | Correlation Equation (MJ/kg) |
|---|---|---|
| (1) | Jenkins and Ebeling (1) [45] | HHV = −0.763 + 0.301 C + 0.525 H + 0.064 O |
| (2) | Sheng and Azevedo (1) [46] | HHV = −1.3675 + 0.3137 C + 0.7009 H + 0.0318 O |
| (3) | Yin [47] | HHV = 0.2949 C + 0.8250 H |
| (4) | Graboski and Bain [48] | HHV = 0.328 C + 1.4306 H − 0.0237 N + 0.0929 S − (1 − Ash/100)·(40.11 H/C) + 0.3466 |
| (5) | Callejón-Ferre et al. [49] | HHV = −3.440 + 0.517 (C + N) − 0.433 (H + N) |
| (6) | Channiwala and Parikh [50] | HHV = 0.3491 C + 1.1783 H + 0.1005 S – 0.1034 O − 0.0151 N − 0.0211 Ash |
| (7) | Sheng and Azevedo (2) [46] | HHV = 19.914 − 0.2324 Ash |
| (8) | Brigwater et al. [51] | HHV = 0.341 C + 1.323 H + 0.068 S − 0.0153 Ash − 0.1194 (O − N) |
| (9) | Tillman [52] | HHV = – 1.6701+0.4373 C |
| (10) | Annamalai et al. [53] | HHV = 0.3516 C + 1.16225 H – 0.1109 O + 0.0628 N + 0.10465 S |
| (11) | Demirbas (1) [54] | HHV = − 0.459+0.4084 C |
| (12) | Callejón-Ferre et al. [49] | HHV = −3.147 + 0.468 C |
| (13) | Jenkins and Ebeling (2) [45] | HHV = 1.209 + 0.379 C |
| (14) | Jimenez and Gonzalez [55] | HHV = −10.81408 + 0.3133 (VM + FC) |
| (15) | Demirbas (2) [56] | HHV = 0.312 FC + 0.1534 VM |
| (16) | Cordero et al. [57] | HHV = 0.3543 FC + 0.1708 VM |
| (17) | Jenkins and Ebeling (3) [45] | HHV = −0.049 + 0.332 C + 0.851 H − 0.036 O |
| (18) | Jenkins and Ebeling (4) [45] | HHV = 3.210 + 0.3333 C |
| (19) | Jenkins and Ebeling (5) [45] | HHV = 0.007 + 0.311 C+0.752H + 0.006 O |
| (20) | Demirbas (3) [54] | HHV = 0.4182 (C + H) − 3.4085 |
Table 5.
Results of the different higher heating value (HHV) prediction models.
| Equation Number | Correlation Value (MJ/kg) | Difference | % Deviation |
|---|---|---|---|
| (1) | 19.353 | −0.806 | 4.345 |
| (2) | 19.156 | −0.609 | 3.282 |
| (3) | 19.143 | −0.596 | 3.211 |
| (4) | 19.599 | −1.052 | 5.671 |
| (5) | 17.739 | 0.808 | 4.356 |
| (6) | 19.632 | −1.085 | 5.848 |
| (7) | 18.924 | −0.377 | 2.033 |
| (8) | 19.618 | −1.071 | −5.775 |
| (9) | 18.629 | −0.082 | 0.444 |
| (10) | 19.459 | −0.912 | 4.919 |
| (11) | 18.499 | 0.048 | 0.259 |
| (12) | 18.578 | −0.031 | 0.165 |
| (13) | 18.802 | −0.255 | 1.376 |
| (14) | 19.983 | −1.436 | 7.744 |
| (15) | 17.204 | 1.343 | 7.239 |
| (16) | 19.249 | −0.702 | 3.782 |
| (17) | 19.484 | −0.937 | 5.051 |
| (18) | 18.682 | −0.135 | 0.727 |
| (19) | 19.665 | −1.118 | 6.028 |
| (20) | 18.763 | −0.216 | 1.166 |
© 2018 by the authors. Licensee MDPI, Basel, Switzerland. This article is an open access article distributed under the terms and conditions of the Creative Commons Attribution (CC BY) license (http://creativecommons.org/licenses/by/4.0/).
Share and Cite
MDPI and ACS Style
Perea-Moreno, M.-A.; Manzano-Agugliaro, F.; Hernandez-Escobedo, Q.; Perea-Moreno, A.-J. Peanut Shell for Energy: Properties and Its Potential to Respect the Environment. Sustainability 2018, 10, 3254. https://doi.org/10.3390/su10093254
AMA Style
Perea-Moreno M-A, Manzano-Agugliaro F, Hernandez-Escobedo Q, Perea-Moreno A-J. Peanut Shell for Energy: Properties and Its Potential to Respect the Environment. Sustainability. 2018; 10(9):3254. https://doi.org/10.3390/su10093254
Chicago/Turabian StylePerea-Moreno, Miguel-Angel, Francisco Manzano-Agugliaro, Quetzalcoatl Hernandez-Escobedo, and Alberto-Jesus Perea-Moreno. 2018. "Peanut Shell for Energy: Properties and Its Potential to Respect the Environment" Sustainability 10, no. 9: 3254. https://doi.org/10.3390/su10093254
Note that from the first issue of 2016, this journal uses article numbers instead of page numbers. See further details here.