1. Introduction
In recent years, social life cycle assessment (S-LCA) has gained popularity as a viable decision-making tool for achieving more inclusive and comprehensive sustainability standards [
1,
2,
3]. An increasing number of industry leaders, public/non-profit stakeholders, and private manufacturers have applied a range of S-LCA methodologies to not only identify socioeconomic aspects along product life cycles, but also to “tell the story of social conditions in the production, use, and disposal of products” [
4,
5,
6,
7]. In recent years, applications of S-LCA have targeted energy products and industries, especially those related to alternative fuels, such as palm oil, biodiesel, and other bio-based value chains [
6,
8,
9,
10]. Importantly, however, as S-LCA is a quickly evolving practice it remains under considerable, yet nonetheless supportive, scrutiny as it moves beyond its initial methods [
11,
12,
13]. In this paper, we explore the role and viability of financial models as a means of offering more flexible approaches to life cycle assessments that increasingly incorporate complex social and cultural values.
As outlined elsewhere [
14,
15], there exist a number of challenges relating to the methodological approaches and operationalization of S-LCA. Some of the most pressing issues, for instance, involve systematizing fundamental practices of S-LCA, such as harmonizing the selection of indicators and streamlining S-LCA methodologies to established LCA approaches [
16]. Likewise, attention to the availability and geographic variability of complex social data and the consideration of the challenges inherent in the compatibility between qualitative and quantitative assessment methods in any S-LCA study are of considerable debate [
17,
18].
With these issues in mind, the focus of much academic literature in S-LCA remains centered on the wide-scale applicability of S-LCA [
9,
10,
19,
20,
21,
22], and a number of attempts have been made to flesh out a general yet functional S-LCA tool similar to those available for environmental life cycle assessments (E-LCA) [
23]. However, a number of S-LCA approaches use techniques, such as Likert or color scales, to gauge social implications of a range of products under study [
6,
24,
25,
26,
27] and are vulnerable to uncertainties due, in part, to their general incompatibility with quantitative measurements.
Considering these ongoing challenges, in this paper we develop and test a unique S-LCA tool, which we have called the GreenZee model. Using a software-based framework, the GreenZee model is the first tool of its kind to offer clear a financial output of the social impacts of products along their lifecycle. Specifically, the model employs a detailed technical framework adapted from established S-LCA guidelines [
1] and translates a variety of quantitative inputs, such as ‘importance levels’ of social impact categories and their sub-categories, into financial (i.e., monetary) outputs, otherwise represented as ‘strengths’ of social impact categories and their sub-categories. To test the operationalization of the model, we explore a hypothetical case study of the biodiesel industry in Newfoundland, Canada. While this represents a single perspective, in practice, the GreenZee model represents an important step forward in building a tool that can widen S-LCA to other energy systems and industrial sectors and in a variety of geographical contexts. While potentially offering a practical tool for life-cycle practitioners, the GreenZee model also represents an important theoretical approach for S-LCA researchers to explore and test alternative applications that are needed in this emerging field.
The paper is structured as follows. First, we begin with a brief discussion of the trajectory of recent S-LCA approaches. Second, we outline the central methodological approaches of the GreenZee model. Here, we define the model’s four phases: (i) the definitions of the goal and scope of the study; (ii) the life cycle inventory analysis; (iii) the life cycle impact assessment; and (iv) the life cycle interpretation. Third, we test the GreenZee model through a case study of biodiesel production in the context of Newfoundland and Labrador, Canada. Fourth, we consider several methodological challenges and explore key questions concerning the implementation and practical applications of the GreenZee model in the biodiesel sector and beyond. Conclusions are drawn in the final section.
Geographies of Social Life Cycle Assessment
The relatively rapid development of S-LCA approaches in the last decade has resulted in a rich literature and useful methodological debate. The widening range of case studies included in S-LCA experimentation speaks directly to the growing awareness and possibilities of social analyses as important life cycle assessment foci. At present, prominent S-LCA case studies and product prototypes include fertilizers [
28]; food [
7,
29]; electronics and electronic wastes [
30,
31,
32]; construction materials [
33]; and biofuels and bio-based value chains [
6,
9]. Recent S-LCA case studies that highlight biofuels, such as palm oil, speak to the growing interest in assessing the (social) sustainability of alternative fuels given their relatively rapid adoption in the face of climate change and global inequality. In particular, many of these studies pinpoint social ‘hotspots’ in energy and fuel system production (e.g., exploitative labor relations, alienation, and other negative impacts on the well-being of local communities) that are in significant need of re-evaluation and change if social equity and sustainability continue as societal priorities [
9,
10,
34,
35,
36].
Although the level of interest in S-LCA continues to climb and a plethora of approaches test its methodological boundaries, a standard S-LCA method is yet to be defined. The emerging S-LCA literature is replete with discussions about the challenges of methodological rigor and standardization, and most identify data context, collection, and interpretation as central obstacles [
3,
14,
17,
18,
37,
38,
39].
As Chen and Holden [
40] argue, issues of context encumber our ability to develop a general S-LCA that is geographically sensitive and capable of integrating location-specific data. In this case, there is no one-size-fits-all for system modelling as economic, cultural, and political differences between scales or locations (e.g., nations, regions, sectors) can vary dramatically. Indeed, a ‘geography of S-LCA’ highlights both an inherent variability in context and temporality in life-cycle research and the need for methodological flexibility to meet changing spatial and temporal resolutions [
40,
41]. Yet, as has been pointed out [
3,
14,
30], access to sensitive data that pinpoint social impacts at more local scales—and which potentially highlight critical socio-ethical hotspots—is extremely limited.
Besides context, varying approaches to data collection also represent a continuing challenge to a standard S-LCA method and application. Indeed, data collection techniques have ranged widely and include aggregated national data [
30]; data derived from in-depth interviews with key informants [
42]; dichotomous questionnaires (e.g., yes/no) [
43] and Likert scales [
6] that survey stakeholder opinions and attitudes; and mixed methods and multi-criteria analyses [
44]. In the case of research approaches that use Likert scales, data interpretation is particularly limited as complex subjective phenomena may not be aptly described using the limited wording of a descriptive approach [
45]. In addition, a participant may experience confusion when there are too many response categories to choose from or too few categories that fully capture participants’ experiences, opinions, or intents [
46]. Lastly, Svensson [
47] argues that the sum scores used in Likert methods may result in incorrect results since, in the case of social assessments that use dichotomous classifications, there are many ongoing challenges with the validity and reliability of research questionnaires developed for dichotomous scales and their corresponding results. With dichotomous scales there remain challenges of ambiguity and the potential for multiple values which cannot be uncovered simply by a pair of criteria [
48].
Considering these and other ongoing limitations in S-LCA approaches, we explore the GreenZee model as an alternative to current techniques. In particular, we argue that while the leading S-LCA approaches offer valuable steps toward evaluating social criteria, other methods, such as those that focus on qualitative financial inputs and outputs, contribute enhanced flexibility, robustness, and sensitivity to the complex geographies of social values.
2. Materials and Methods
Our central objective is to develop a simple yet practical S-LCA methodology. In so doing, we base our approach on internationally accepted and standardized principles of S-LCA developed in the guidelines and criteria presented in the “Social Life Cycle Assessment of Products” and compiled by the Society of Environmental Toxicology and Chemistry (SETAC) under the United Nations Environmental Programme (UNEP) [
1]. The aim of the UNEP S-LCA approach is to formalize the analyses and assessments of the social impacts of a product over its life cycle. This analysis is closely related to established LCA approaches as they offer the most well-defined and globally understood methodologies for analyzing the environmental impacts of products. Following LCA and the SETAC-UNEP approaches, the GreenZee model includes the goal and scope of the study, an S-LCA data inventory, an impact assessment, and an interpretation of the results. The comparability and reliability of the model is contingent on the level of variability or uncertainty of the input data [
49]. Keeping this aspect in mind, the GreenZee model is developed through a deterministic rather than stochastic approach (i.e., probability distributions) as it excludes randomness in the decision-making process and strengthens the overall reliability of the model.
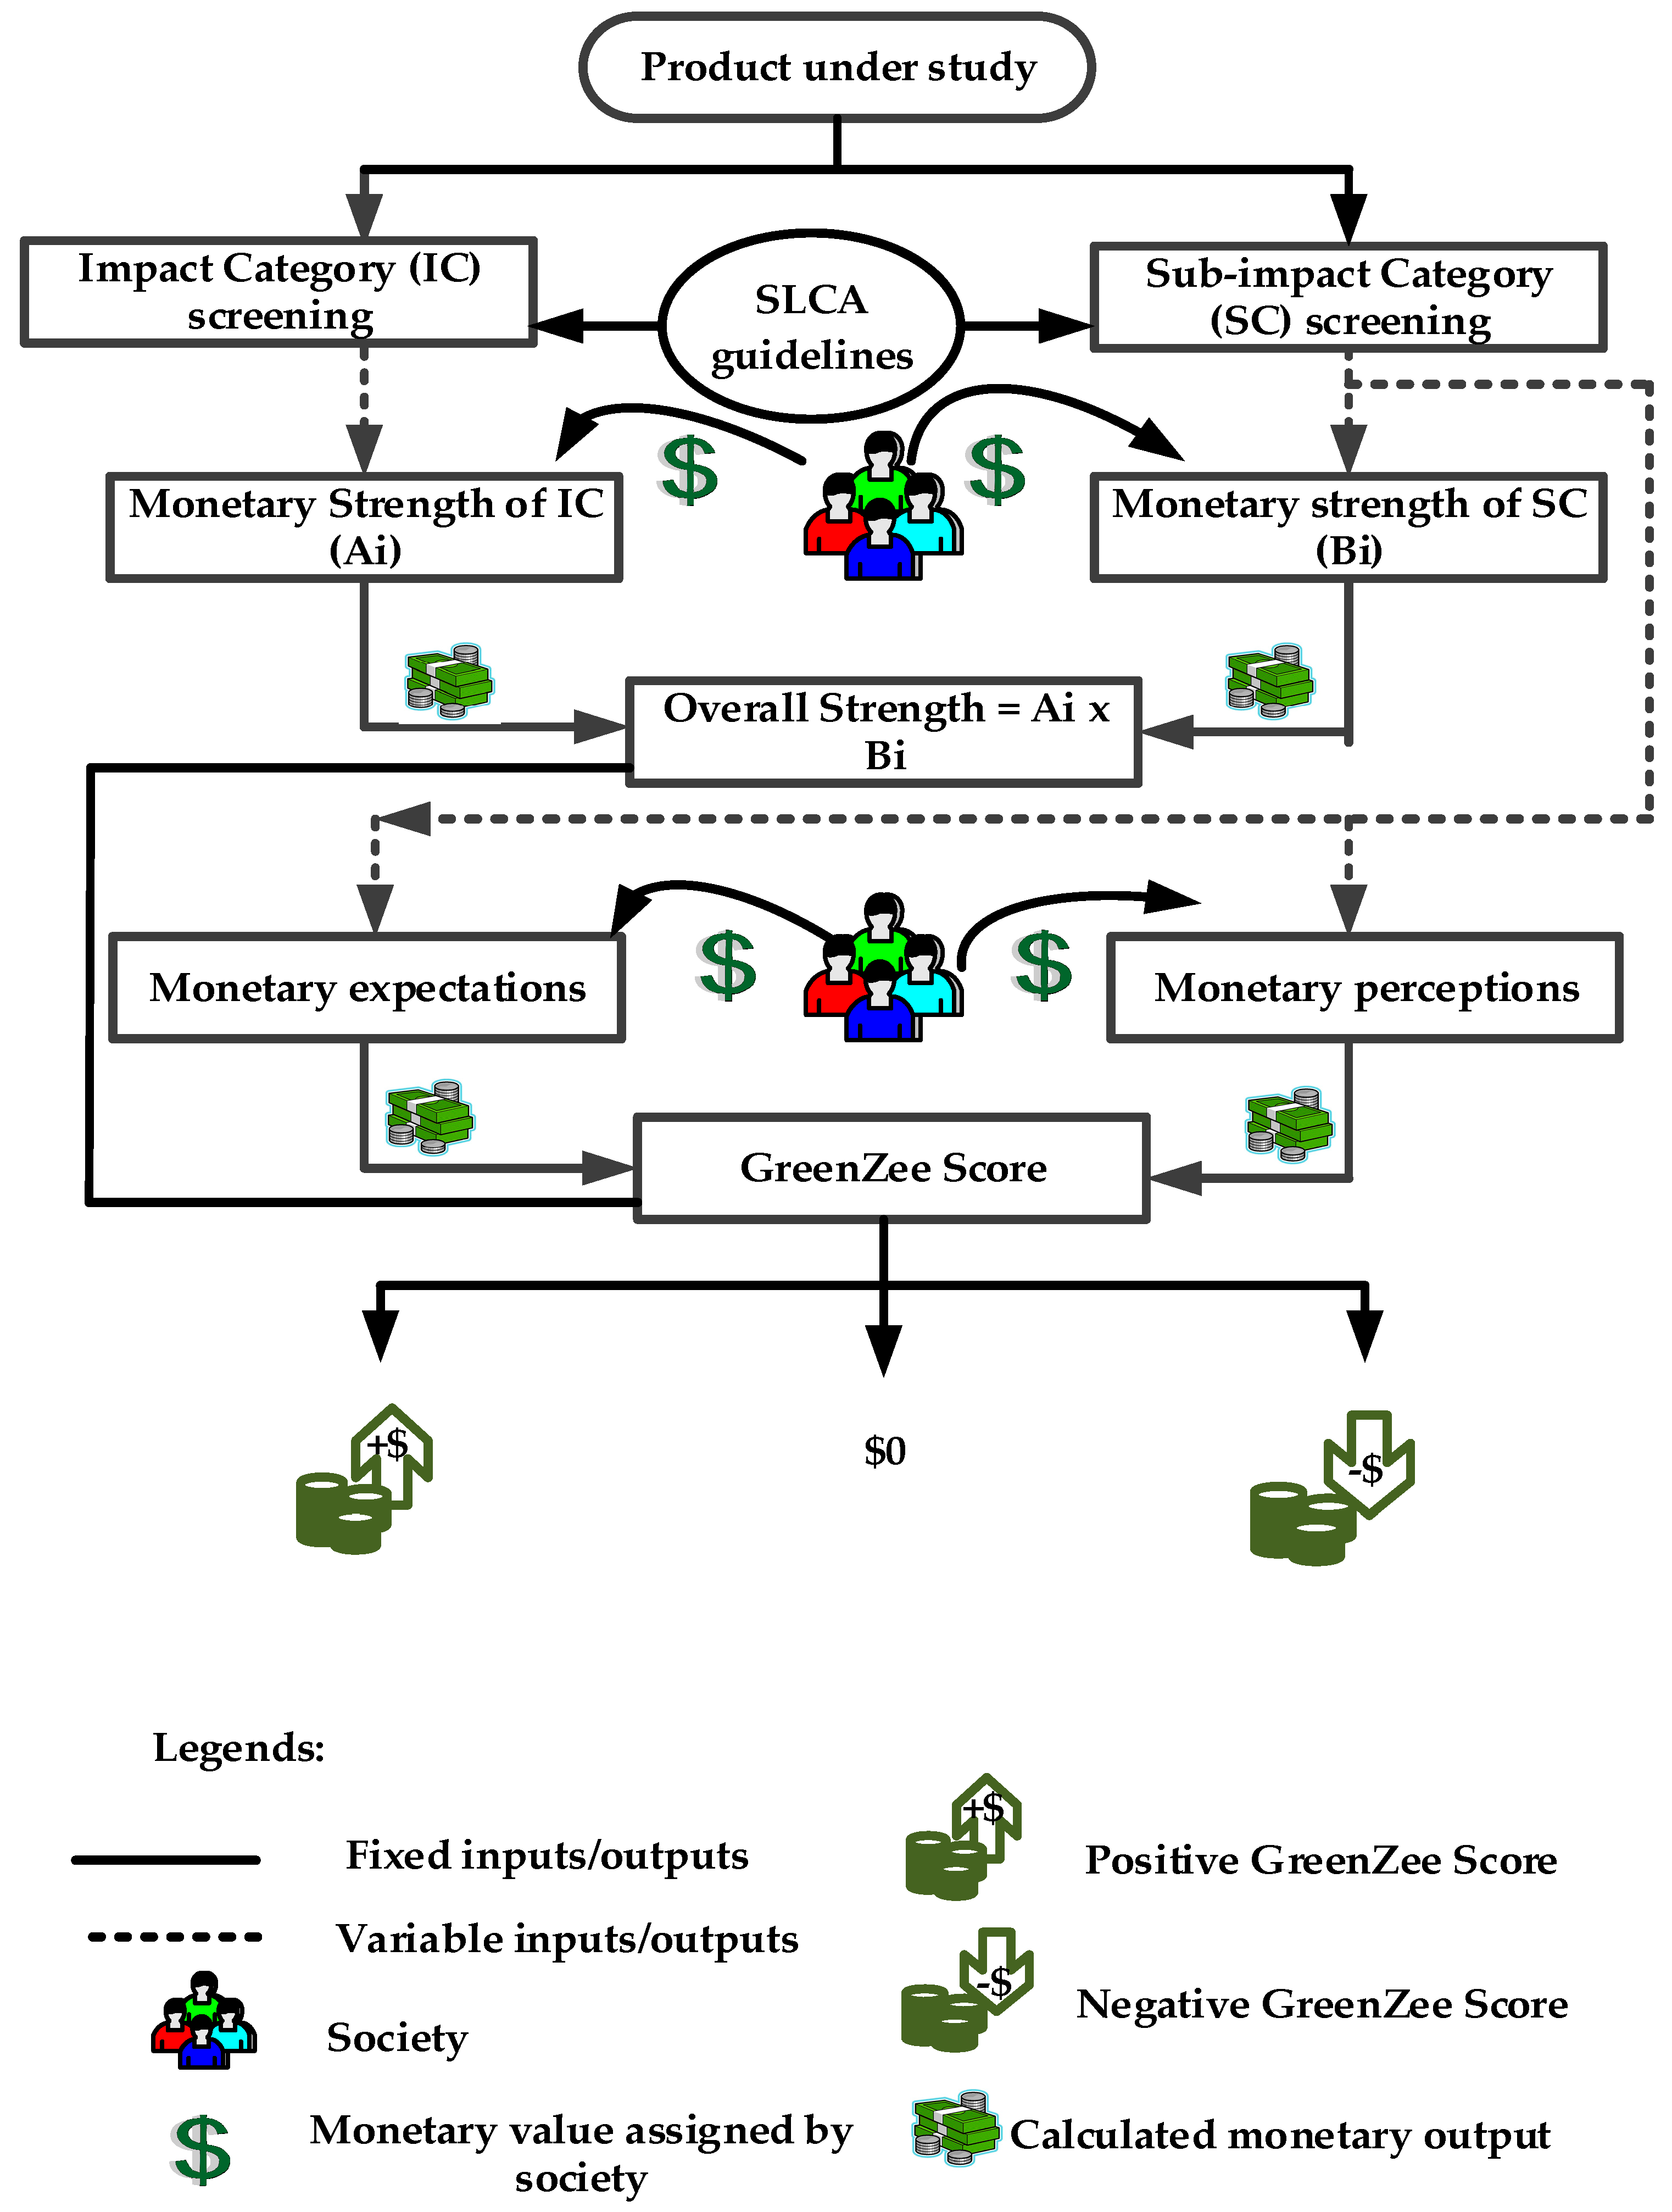
In this section, we outline the GreenZee model through an evaluation and consideration of each of the S-LCA attributes. The technical framework of the methodology is presented in
Figure 1.
2.1. Phase 1: Definition of the Goal and Scope of the Study
According to the SETAC guidelines, the identification and definition of the goal and the scope of the study are the preliminary steps to performing any S-LCA. While the goal describes the intended applications to perform the study, the scope defines the depth and breadth of the study [
1]. We follow the SETAC guidelines to describe Phase 1 of the GreenZee methodology and to define the goal and the scope of the study. In following the SETAC rationale, we first define a clear statement specifying the objective of the study for the GreenZee model. In particular, this is the use of the products/services with defined parameters. For example, the objective of the study could be the S-LCA of biodiesel [
50].
In the next step, we define the scope of the study and include a definition of the function (i.e., the performance characteristics) and the functional unit (i.e., the bases on which the study is performed) of the product/service. In the case of biodiesel, the function is the use of the biodiesel as an alternate fuel to petroleum-based diesel fuels. Relative to petroleum-based fuels, biodiesel is considered as ‘environmentally friendly’ with significantly less adverse environmental impacts [
51]. Switching to biofuels is therefore being increasingly argued as a path to more cleaner environments and healthier societies.
In this study, the functional unit is the social impact of producing and using 1 kg of biodiesel. Typically, the size of a production unit is dependent on the requisite quantity of a product that one intends to produce. A large production unit (typically over millions of tons) will produce large volumes of a product [
51], and therefore such huge quantities of products could have high social impacts (either positive or negative) on society, while the opposite is also true. Hence, the functional unit can be defined as the amount of product to be produced. It is clear, however, that using such a simple definition means that the functional unit is both complex and dynamic in nature.
It is important to note that in defining the scope of the study, care should be taken to delineate the study boundaries. If we consider again the example of biodiesel, we must acknowledge that biodiesel is composed of a variety of chemical components and is produced through a series of complex chemical reactions. In defining the system boundary for biodiesel production, we choose to include the social implications of input streams (e.g., chemical inputs and utilities) and the biodiesel production process, including its output streams. Since each chemical and utility in the input streams will have their own S-LCA, their respective social implications are ignored and thus are excluded from the scope of the current case study.
Recent treatments of S-LCA methodologies by life-cycle experts argue that the focus of S-LCA studies should centre on the processes of product development [
52]. Yet, as S-LCA practices have evolved, others have argued that it is a firm’s ‘conduct’ (e.g., corporate social responsibility) that should be the focus of the S-LCA approach [
19,
21,
53,
54]. With a focus on the process of product development, limitations arise as distinct products are made from a wide range of raw materials that can also be the products of other processes. Performing an S-LCA study on a single product process therefore does not result in a complete and reproducible social impact study for all products. A focus on the firm’s conduct, for instance, could ‘mislead’ the results since it is logistically challenging to disentangle the complex assemblage of inputs and contributions of each product, especially in the case where a firm/producer is involved in manufacturing more than one product.
In recognizing these limitations, the GreenZee model draws a clear system boundary around product life-cycle stages and assesses the social implications of products on communities, or indeed society, associated with each step by performing an S-LCA study on each individual stage. In this case, there is a need to consider the raw materials of each product stage and how their associated social implications should be included in the boundary definitions, unless their monetary values (refer to the assessment section, Phase 3) are not considered a significant contribution. In situations where there are too many products/processes (e.g., a petroleum refinery produces dozen of products at one time), a system boundary should be defined by considering those products/processes for which there could be considerable social and socio-economic impacts (positive or negative) as identified by stakeholders.
2.2. Phase 2: Life Cycle Inventory Analysis
In the life-cycle inventory phase of the GreenZee model, we first define the ‘social activity variables’ needed for the S-LCA study (see
Figure 2). A key aspect of the GreenZee framework is its flexibility and generalizability as an S-LCA model and its applicability to a wide range of products and services. In this case, social activity variables are defined as a list of impact categories and subcategories.
In order to meet the requirements of a comprehensive inventory analysis, a detailed literature review and survey is performed to develop an exhaustive database of possible social activity variables associated with various products/services. In this case, we compile all of the legitimate activity variables into the GreenZee model. These variables have been identified and highlighted across the S-LCA studies in the literature [
5,
6,
7,
24,
26,
30,
43,
55].
2.3. Phase 3: Life Cycle Impact Assessment
As with all LCA studies, the impact assessment, including a detailed LCA inventory and thorough deterministic modelling, represents the most important phase. The GreenZee model consists of two novel steps: first, it assigns monetary importance levels to impact categories and sub-impact categories; and, second, it assigns ‘real’ money values to expectations and perceptions in sub-impact categories.
As presented in
Figure 1, the first step in life-cycle impact assessment involves choosing the social activity variables from the GreenZee model that are considered relevant to the product/service under consideration. For example, if we were to evaluate the human rights category concerning the case of biodiesel then a child-labour-free workplace and adequate working hours are considered important aspects to the study. These variables are then incorporated into a comprehensive S-LCA of biodiesel. It is worth mentioning here that for simplicity purposes, the interdependencies among social variables in the GreenZee model are not considered. However, there are methodologies available in the literature [
56,
57] that study the interdependencies of variables and can be integrated into the GreenZee model.
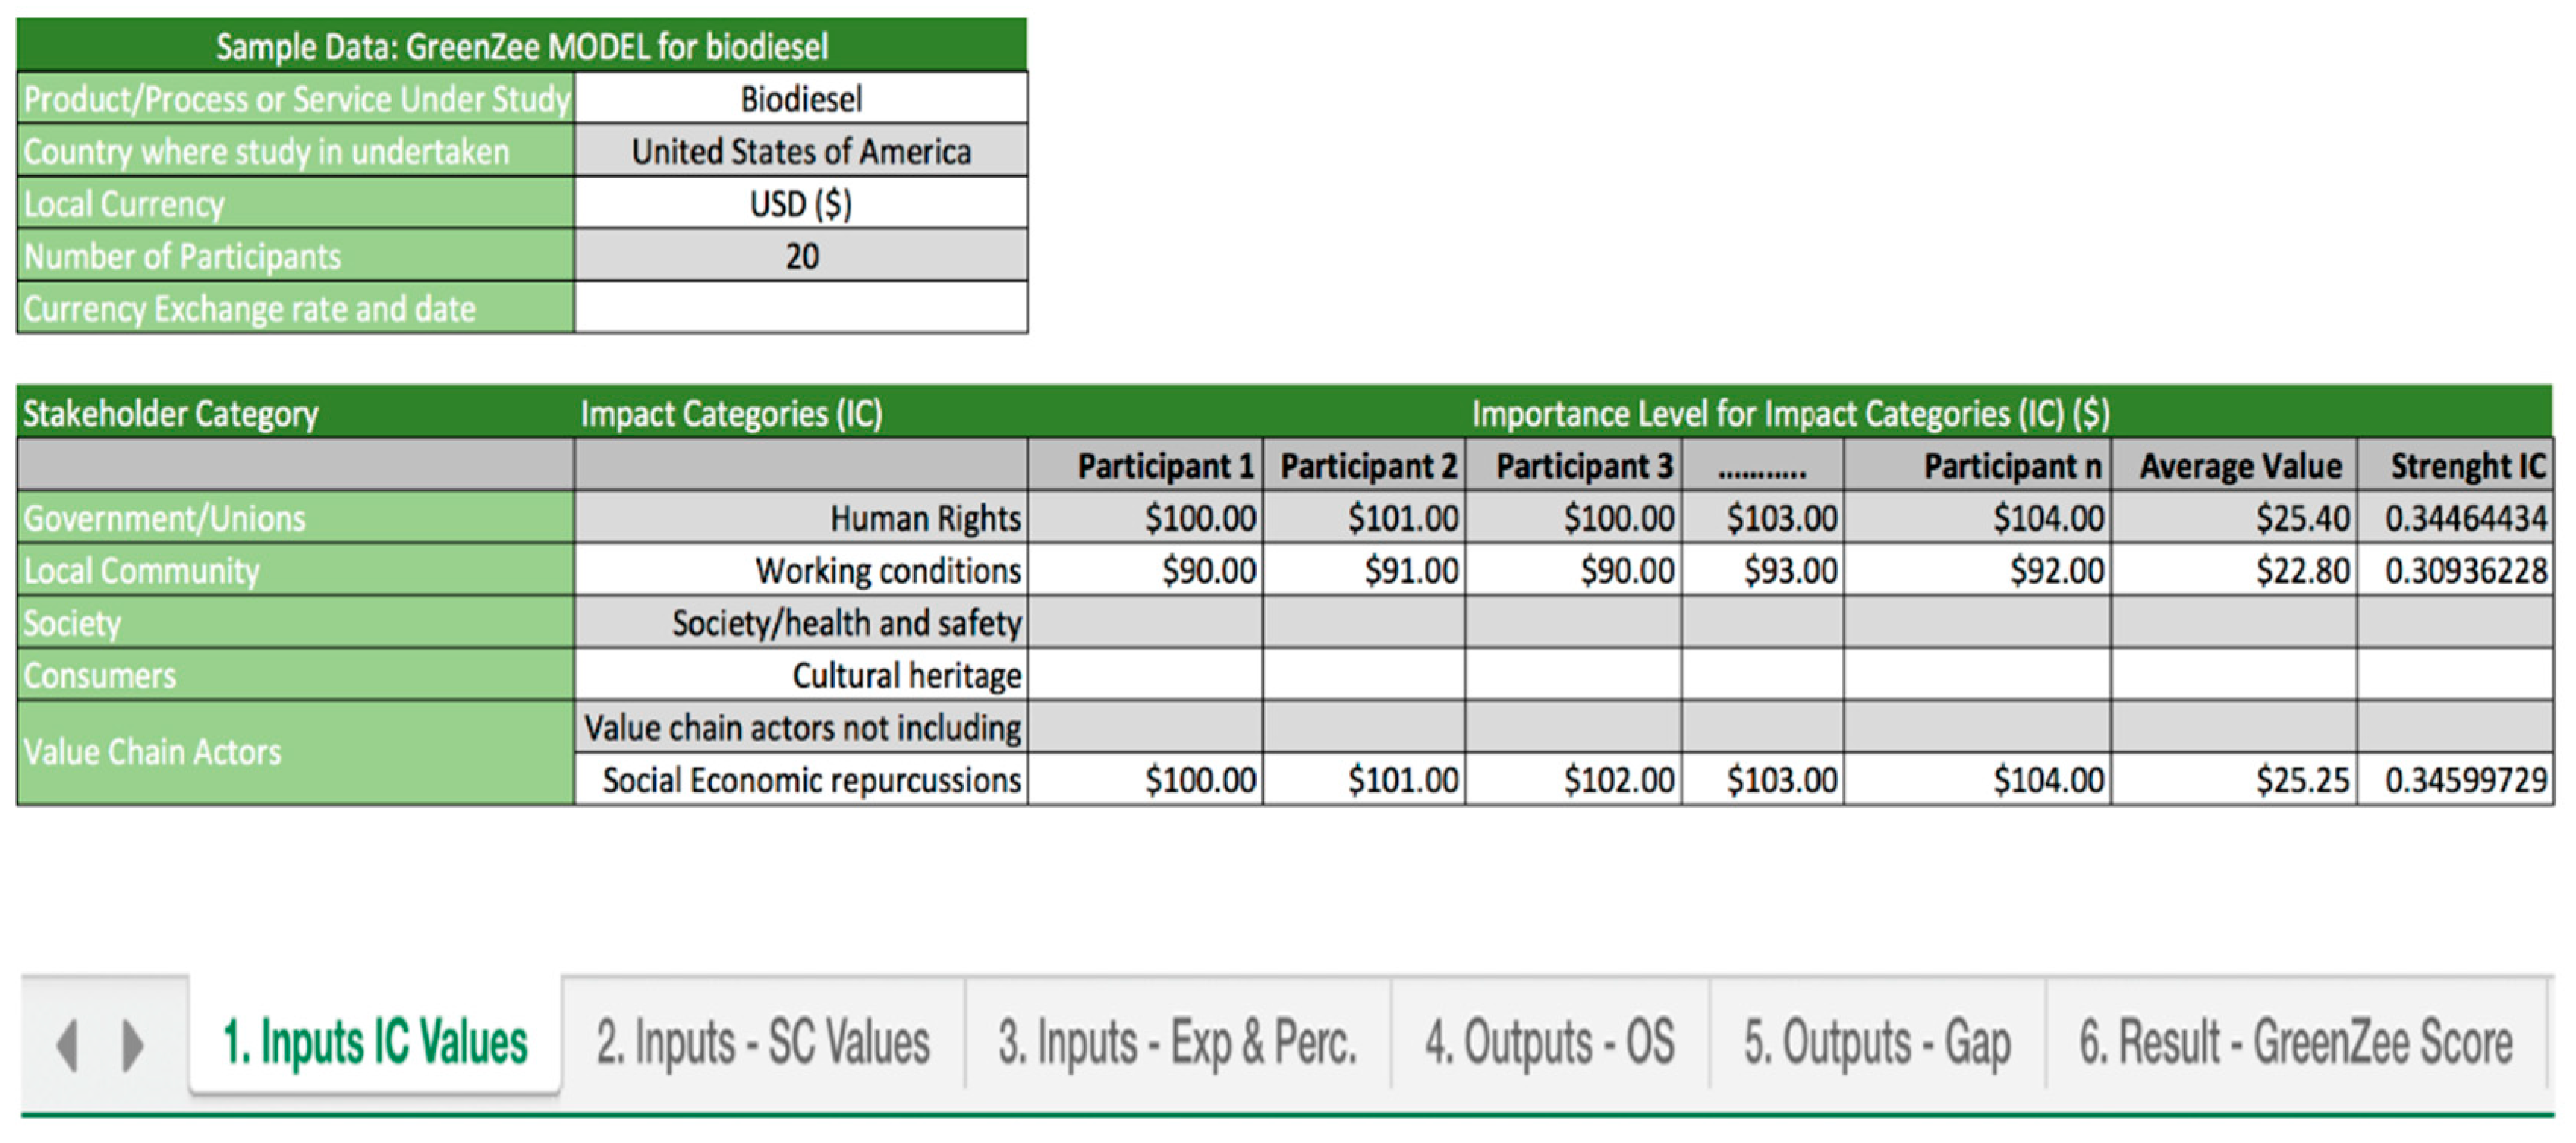
The identification and selection of stakeholders is a crucial step in assessing S-LCA using the GreenZee model. Stakeholders are defined as individuals or groups that may be affected by or may affect product/service at each stage of a product’s life cycle. Stakeholders include employees, government and non-government organizations related to the specific product/service under consideration, value chain actors, and local community members. To have a balanced approach, it is recommended to have equal number of participants for each stakeholder category and efforts should be made not to include the participants having conflicts of interest either in the study or the product/services under consideration (more detail on this process is available in the following case study section). Stakeholders are interviewed using questionnaires. These questionnaires are based on the social activity variables chosen for the product/service under study. The scoring approach consists of assigning the monetary values to each social activity variable by the stakeholders in the study. The scores represent the monetary importance level assigned to impact categories, sub-impact categories, expectations, and perceptions. The monetary scores are assigned by reporting how much stakeholders are willing to pay for the product/process or service in terms of their local currency. This identifies the how important or unimportant that category is for related stakeholders. The lowest possible bound is zero, an upper bound is pre-defined by mutual consent between the stakeholders, and the scoring should be made between the lower and pre-defined upper bounds.
Figure 2 highlights an example whereby a biodiesel consumer in the United States is asked how much importance, defined in USD (
$), he/she gives to a child-labour-free workplace.
In
Figure 2, there are six background worksheets consisting of three inputs, two outputs, and a results worksheet. The inputs are the variables generated from the questionnaires for impact categories (shown in
Figure 2) and sub-impact categories and consumers’ expectations and perceptions (second and third worksheet, respectively, not shown in
Figure 2). In practice, the GreenZee user populates the values in the ‘inputs’ worksheets, while the built-in code in MS Excel calculates ‘outputs’ (presented in the outputs worksheet) and generates the final ‘result’, otherwise called the GreenZee score (see
Section 2.3). The ‘Input—IC values’ worksheet (shown in
Figure 2) is completed for our biodiesel example. For this sample, we assume that the biodiesel product is made and consumed in the United States and hence ‘currency exchange rate and date’ is ‘not applicable (N/A)’. The scores for two impact categories are random inputs.
The GreenZee model allows more than one stakeholder to assign a monetary value to one social activity variable. As a result, the final output is a “strength” reported for each variable. The variable’s strength is the average monetary value for each category, ‘impact category’ (IC) and strength subcategory (SC), of individual ICs and SCs and is computed using Equations (1) and (2), respectively.
where
AVmi represents an average value for an individual social variable i assigned by m participants;
Ami shows the monetary importance level allocated to i by m participant; and
N denotes total number of participants in the study.
The strength of an individual social variable is computed as follows:
where n is the number of social variables or impact categories.
Using a similar mode of calculation, the strength of a sub-category (SC) is calculated as below:
Here, i represents an individual social variable for a sub-category (SC), and n is the number of social variables of the sub-category under consideration.
The overall strength (OS), based on IC and SC, is then calculated by taking an algebraic product of strength IC and strength SC as shown in the equation below and represented in
Figure 1.
In the second step, stakeholders assign money values to the expectations and perceptions of each social activity variable filtered in Phase 2. The questionnaires are designed to collect stakeholders’ expectations, based on their role, about social aspects of the product under consideration. For example, stakeholders could be asked: ‘how important or unimportant is it to make a product, such as biodiesel, in an organization which is child-labour-free’? Given our focus on developing monetary values that can be compared, we ask stakeholders to assign dollar values to their answers. In other words, stakeholders’ expectations are translated in dollar terms. A financial weightage of expectation (shown in Equation (3)) is then calculated by taking the average of the monetary expectation of the respective social activity variables as given by the following equation:
where AE mi represents the average value of expectations allocated by m participants to an individual social variable i in the expectation category.
Ami denotes the monetary value allocated to i by m participant
Similarly, the social perception is assessed by designing the questions based on stakeholders’ perceptions. Stakeholders are asked to re-assign a monetary value to the product based on the actual state of social aspects. In this case, stakeholders could be asked: ‘according to your experience, how do you perceive the current practices of product manufacturing with respect to being child-labour-free?’ A financial weightage of perception is then calculated by taking the average of the monetary perception for each social activity variable. The monetary gap is then calculated by subtracting the average of the monetary expectation from the average of the monetary perception for the respective social activity variables as shown in the equation below:
The equation above is represented in USD currency units; however, the model can also be replicated in any local currency. This unique aspect of the GreenZee model encourages the use of S-LCA methods across contexts and geographies.
Both the GreenZee model and the methodology explained in this phase are automated in MS Excel. The user only needs to input monetary values and the model will compute the average monetary values and financial weightage values of both expectation and perception.
2.4. Phase 4: Life Cycle Interpretation
The outputs from the analysis in Phase 3 are used to compute the final GreenZee score. The GreenZee score represents the financial sum product of the corresponding monetary values of overall strength and the monetary gap computed in Phase 3. The mathematical model to compute the GreeZee score is the following:
All three quantities are reported in terms of currency units (dollars in our case). In MS Excel, the GreenZee score is represented as: GreenZee Score ($) = SUMPRODUCT (array 1, array 2), where array 1 and array 2 denote the corresponding ranges of the OS and the Monetary gap. The function SUMPRODUCT shows the sum of the products of the corresponding ranges or arrays.
There are three aspects associated with a GreenZee score: the sign (positive or negative), the numeric value, and the currency units. With respect to the sign and the numeric values, there are three significant outcomes that may occur, and each has a distinct interpretation. First, a positive GreenZee score represents a positive social impact of the product/service on society; second, a negative score represents a negative social impact of the product/service on society; and third and last, a zero GreenZee score represents no effect on society.
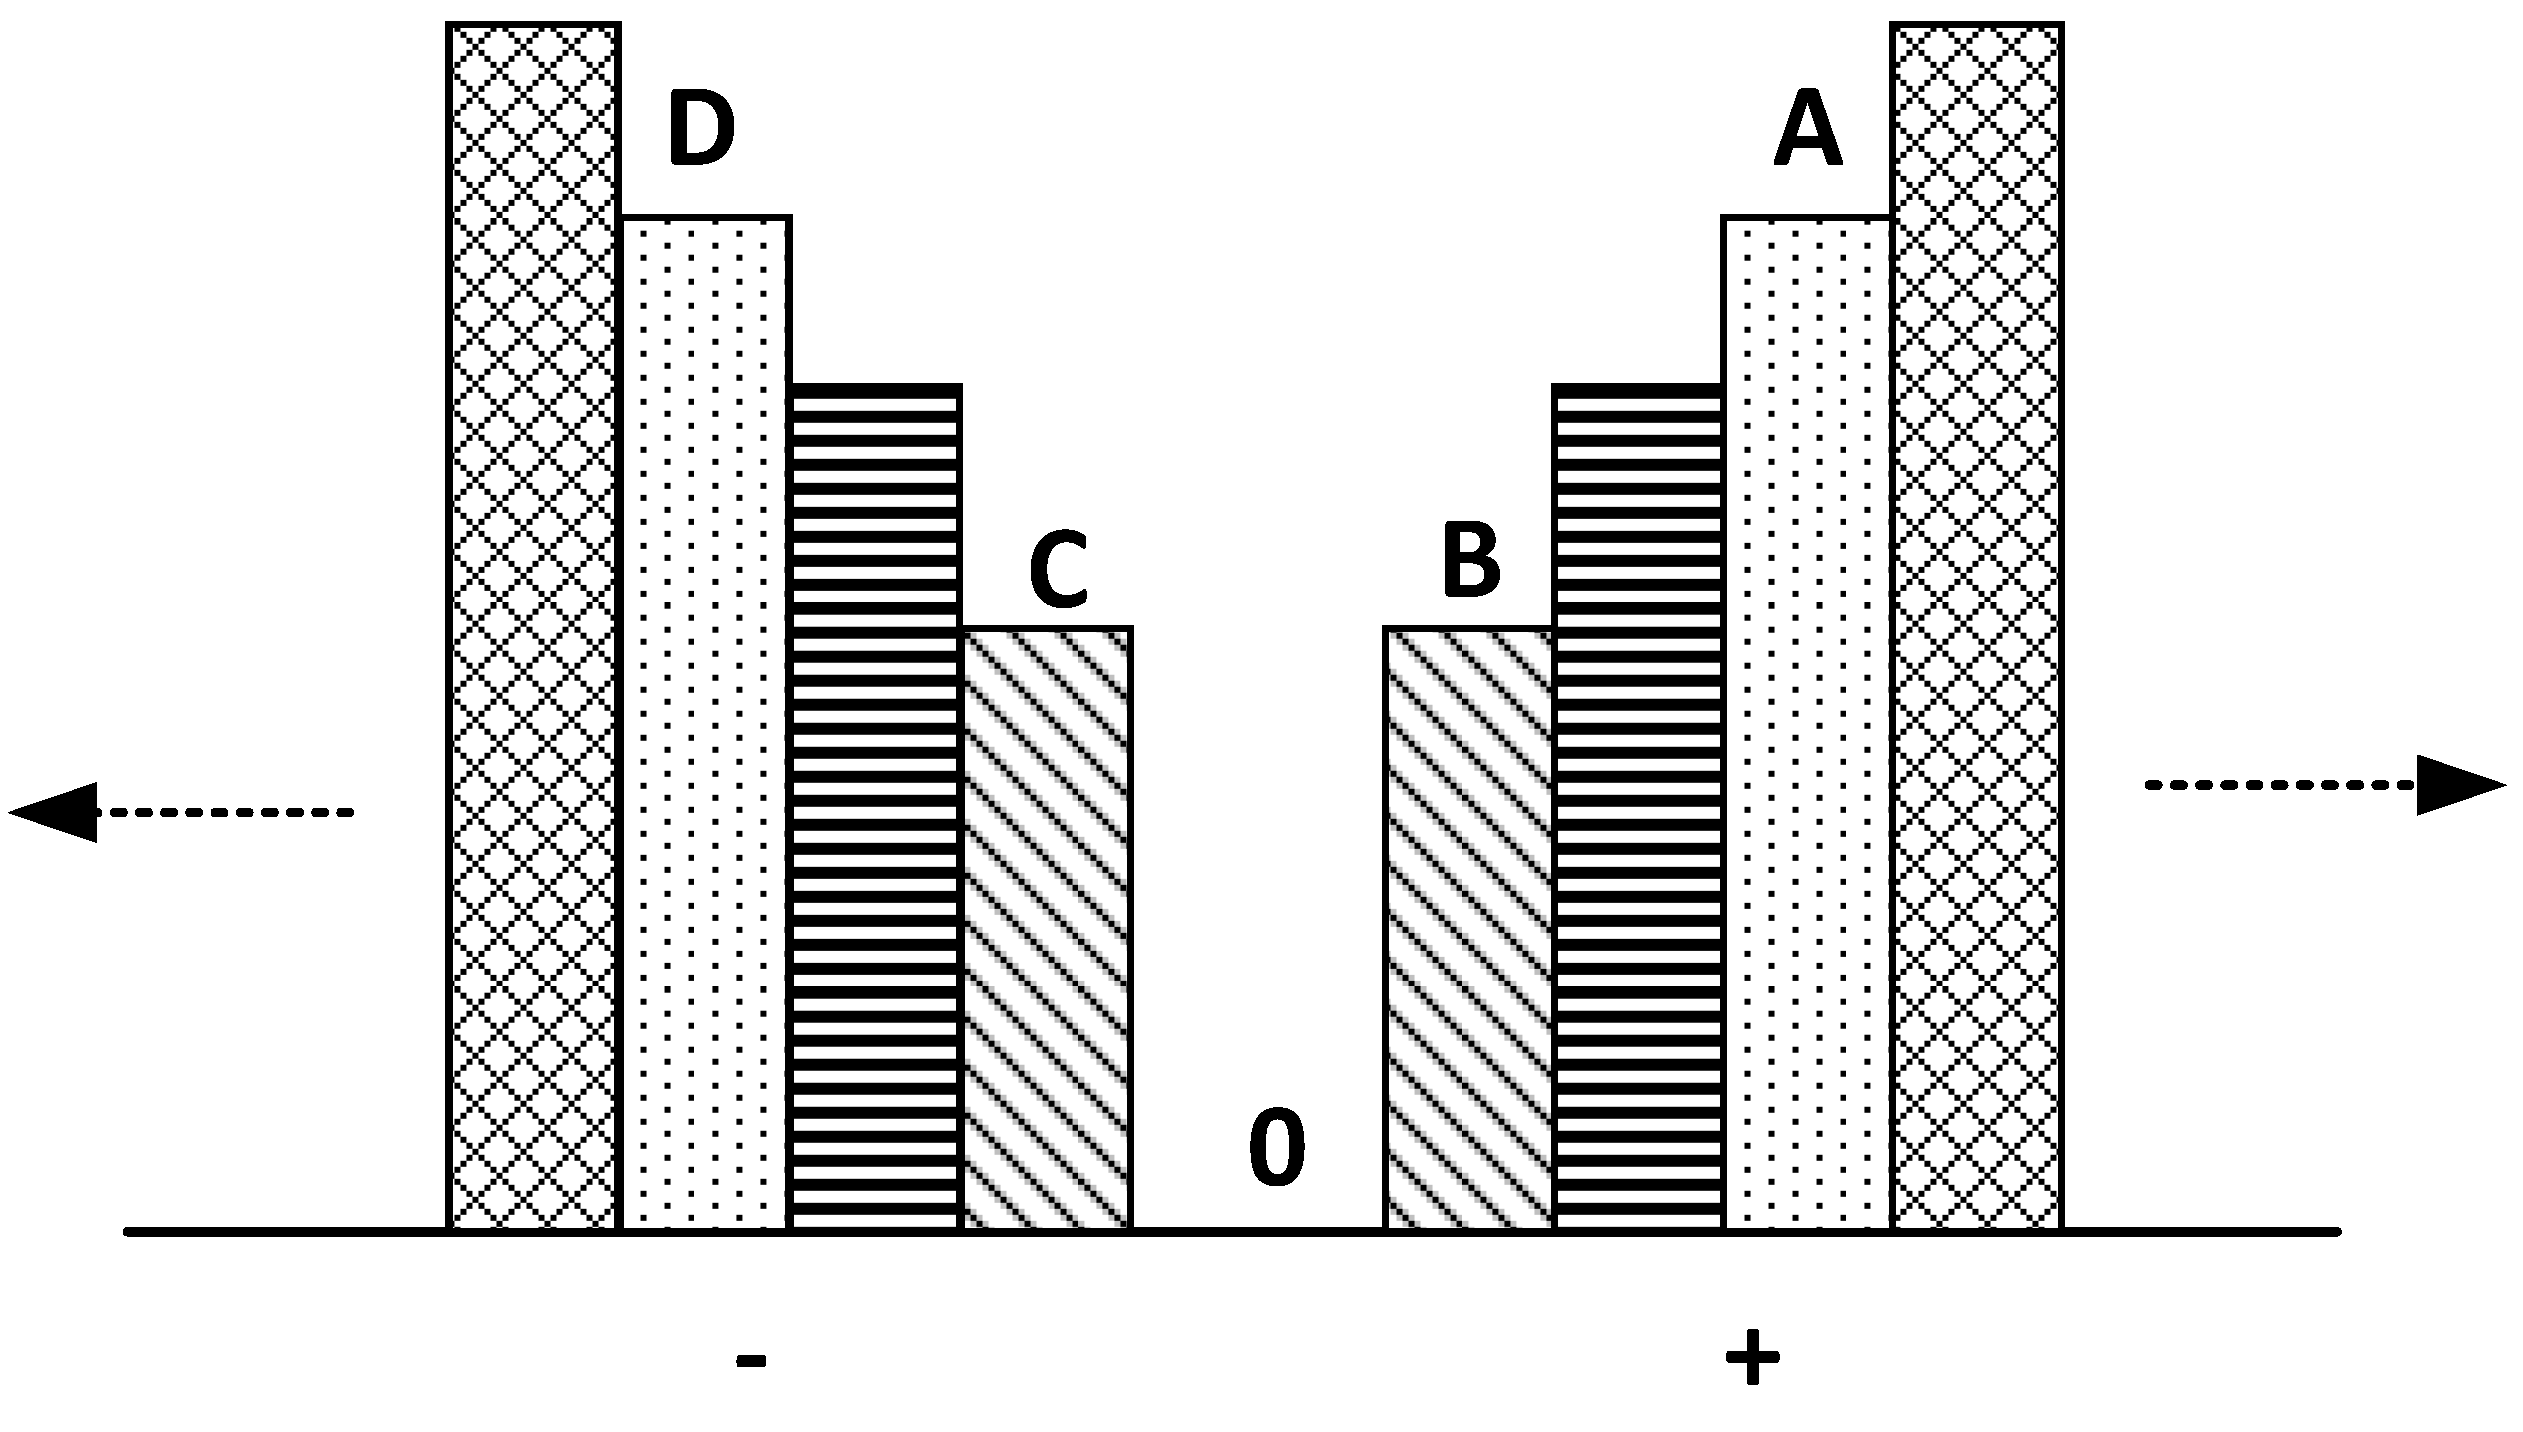
While comparing the S-LCA of two or more different products/services, the GreenZee decision scale, represented in
Figure 3, can be used to understand and compare multiple S-LCAs. Referring to
Figure 3, there are three possible outcomes and interpretations of the GreenZee score. First, if two or more products/services receive positive scores then the product/service with the higher positive score (i.e., the higher numeric value) has the higher social impacts. Referring to
Figure 3, a product with a GreenZee score at point A has a higher positive S-LCA than a product at point B. Similarly, if two or more products/services have negative scores the product/service with the lower negative score (i.e., the lower numeric value) is determined to have less social impacts through its S-LCA study. Referring to
Figure 3, a product with a GreenZee score at point C has fewer social impacts than a product having a GreenZee score at point D.
Second, if one product/service has a positive score and another has a negative score then the product/service with the positive score is considered as a ‘better’ overall product/service for the society. In
Figure 3, this situation can be presented by comparing positive scores holders (A and B) with negative scores holders (C and D). In this case, products with positive scores holders (A and B) are better to use than those with negative scores holders (C and D). In another instance, if one product/service has a positive score and another has a zero score then the product with the positive score is considered ‘better’ for society while the product/service with a zero score has no impact on society. Finally, if the product/service has a negative score and another has a zero score then the product with a zero score is considered ‘better’ for society and is contingent upon the positive impacts from economic and environmental LCA, while a product with a negative score results in negative impacts on society.
2.5. Application: Testing the GreenZee Model: The Case of Biodiesel Production
In this section, we operationalize and test the GreenZee model using a local case study of biodiesel production in Newfoundland and Labrador (NL), a Canadian province with a well-established oil and gas sector. Recently, the province has invested in biodiesel production and biofuel infrastructure as a key strategy toward building a diversified and ‘greener’ energy profile. Although plans for the first biodiesel facility have met with uncertainty, increasing investments in the region are expected to pave the way for biodiesel production plants co-located with lumber facilities already in place throughout the province [
58]. Proponents of bio-based energy have increasingly fought for biorefineries in the province particularly as this sector represents new opportunities during a period of considerable downturn in the conventional oil economy. For our purposes, the biodiesel industry in NL represents a useful and important sector for exploring S-LCA. Overall, proponents claim that a locally based biodiesel industry is crucial to building provincial innovation, providing for skilled employment opportunities, enabling rural development and agricultural transition (e.g., from small-scale to large-scale farming), and fulfilling soaring consumer energy demands [
59,
60,
61]. Employment, for instance, represents an important socio-economic argument as skilled and relatively high-paid work is required across the biodiesel value chain, from the production of biomass feedstock and chemical conversion of biomass into biodiesel at the industrial level to the end-user supply chain. In addition, the development of ‘marginal’ and rural land to grow biomass feedstock and the potential to scale up the agriculture industry through biofuel production represent possible ‘game changers’ for the province. So too, the production of biodiesel would help to meet local and global demands both for alternative forms of bioenergy and energy products that meet new environmental standards.
In recent years, as the value of biofuels has risen across NL and Canada, our understanding of the economic, environmental, and especially social impacts remains limited [
62,
63,
64,
65]. To address this, in this section we consider NL’s biodiesel industry as a case study to both assess the strengths and weaknesses of the GreenZee model and to build more transferable S-LCA approaches across varying geographies and sectors. The scope of this case study covers all stages of biodiesel production, including: the production and transportation of biomass raw materials (i.e., wood by-products); the local refinement of biodiesel fuel in NL; the transportation of consumable biofuel to local gas stations; and, finally, the consumption of biofuel within the province by local consumers.
To simplify, we assume that all of the key production processes are performed within the province and there is no import of any material from outside NL. Furthermore, the inputs for the GreenZee model are based on expert opinions, and we define experts as individuals who have an extensive knowledge and understanding of the policy issues in biofuel. In this case study, experts are chosen strategically so as to not have any conflicts of interest for the product under consideration. For example, owners of local petroleum businesses would not be included in the study since the development of a biofuel (or any alternate fuels to petroleum) may impact their business and the responses could bias the results. Considering this issue, experts with wide-ranging backgrounds but who have knowledge of the industry are selected. This list can include, for instance, experts from government agencies, community leaders, academia, and non-governmental organizations (NGOs). When possible, and in order to reduce bias, it is also important to obtain an equal representation of participants from varied backgrounds.
To test the operationalization of the GreenZee model, we selected two local experts from academic institutions to provide inputs. These experts were selected based on their extensive knowledge of the local oil and gas industry and their insights into the social implications of the biofuel sector in NL. In this hypothetical application, we average the participants’ scores to show the computational steps of the GreenZee model.
The analysis follows through three steps. In step one, the participants shortlist the social factors (i.e., impact categories and their associated subcategories) that they deem to be the most relevant to the social sustainability of biodiesel. The shortlisted impact categories include: human rights, working conditions, social/health and safety, cultural heritage, and socio-economic repercussions (
Table 1). In step two, the participants choose three sub-impact categories for each of the impact categories selected in step one (
Table 1). To simplify the calculations and their presentation, both impact categories and subcategories are assigned abbreviations (e.g., Human rights (HR); a child-labour-free workplace (HR1); and so on).
In step three, the participants complete questionnaires and offer ratings based on
Table 1. For example, to score the importance level for human rights (as shown in
Table 2), participants were asked how much monetary importance they give to human rights. The remaining questionnaires are developed in the same fashion. In this case, participants provide their scores or ratings in local currency (i.e., CDN) in four rounds of questionnaires. In the first round, the participants assign a monetary value (or, importance level) to each impact category. While the minimum monetary value assigned can be
$0, there is no maximum monetary limit. However, in order to avoid wide differences in responses, including ‘wild guesses’, participants mutually decide on a ‘floor limit’; for instance, a score can have mutually decided parameters of
$0 to
$100. In this case,
$0 would represent the minimum score and
$100 as the absolute maximum score, and the participants can assign a score between these two extremes. Alternatively, experts can decide on a monetary value, otherwise understood as a ‘reference value’, and can assign values around the reference value (either higher or lower than reference value) based on their individual opinions. In this study, experts used the second approach.
4. Discussion
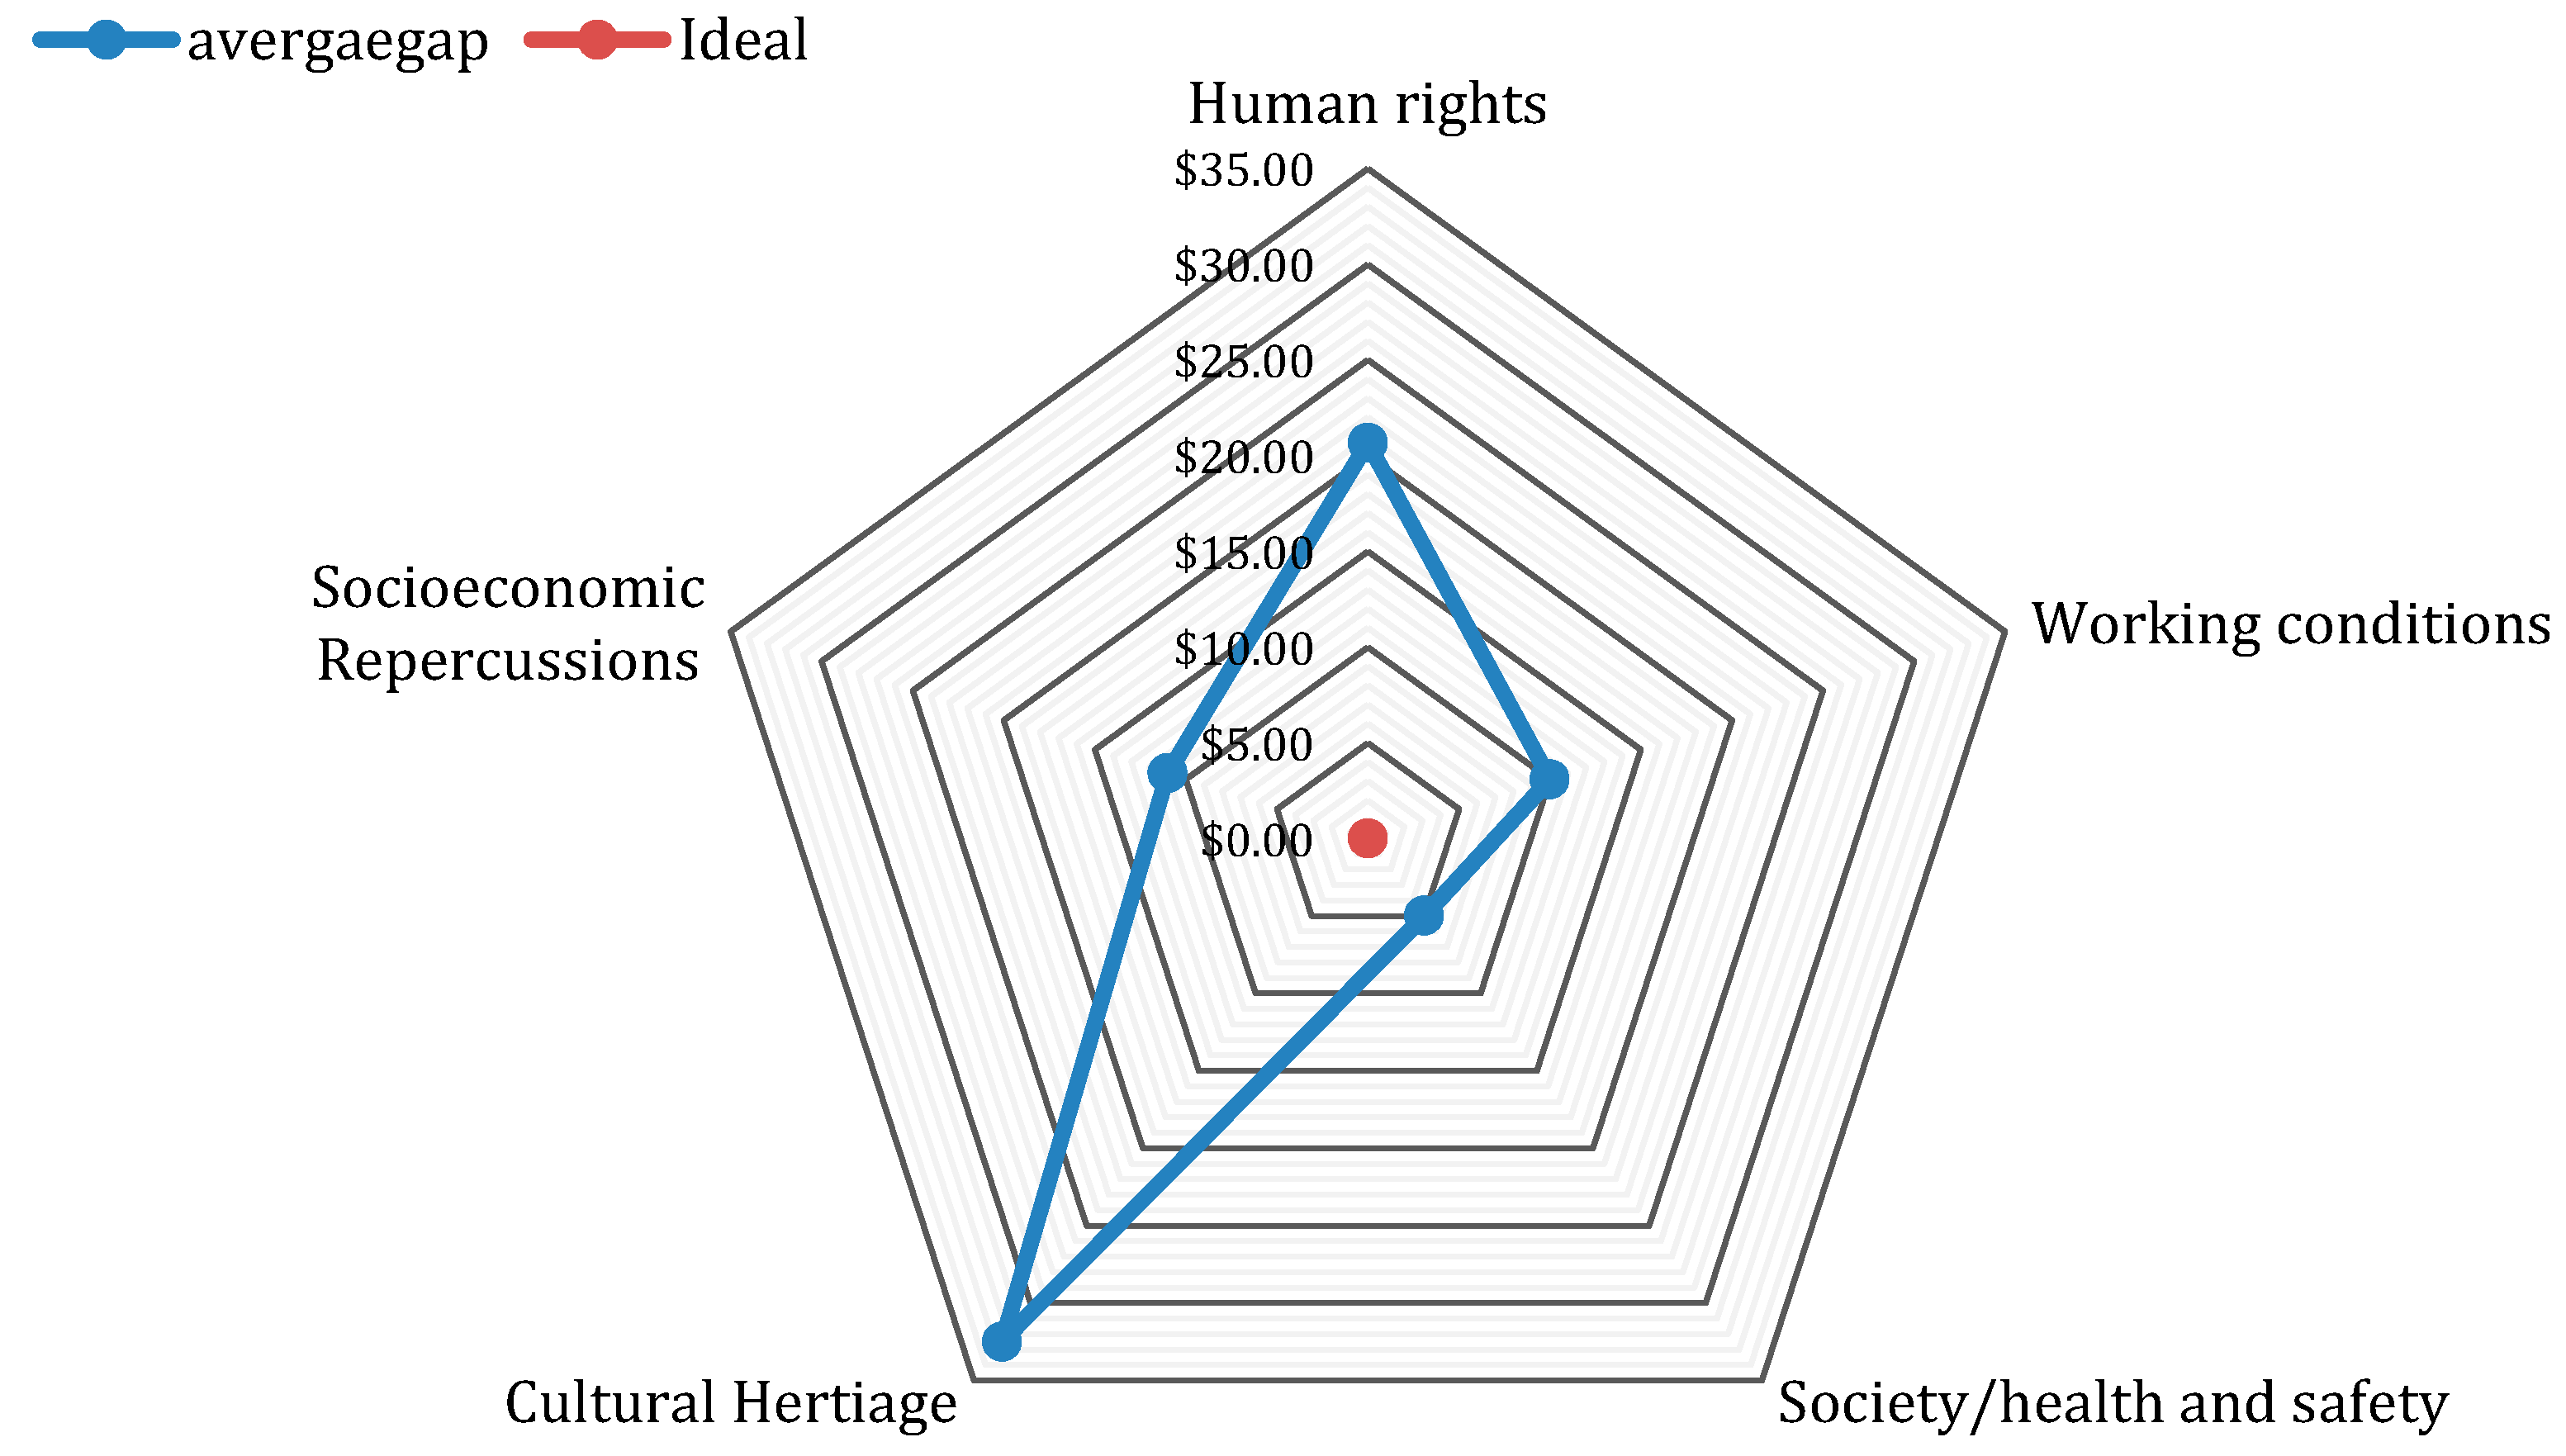
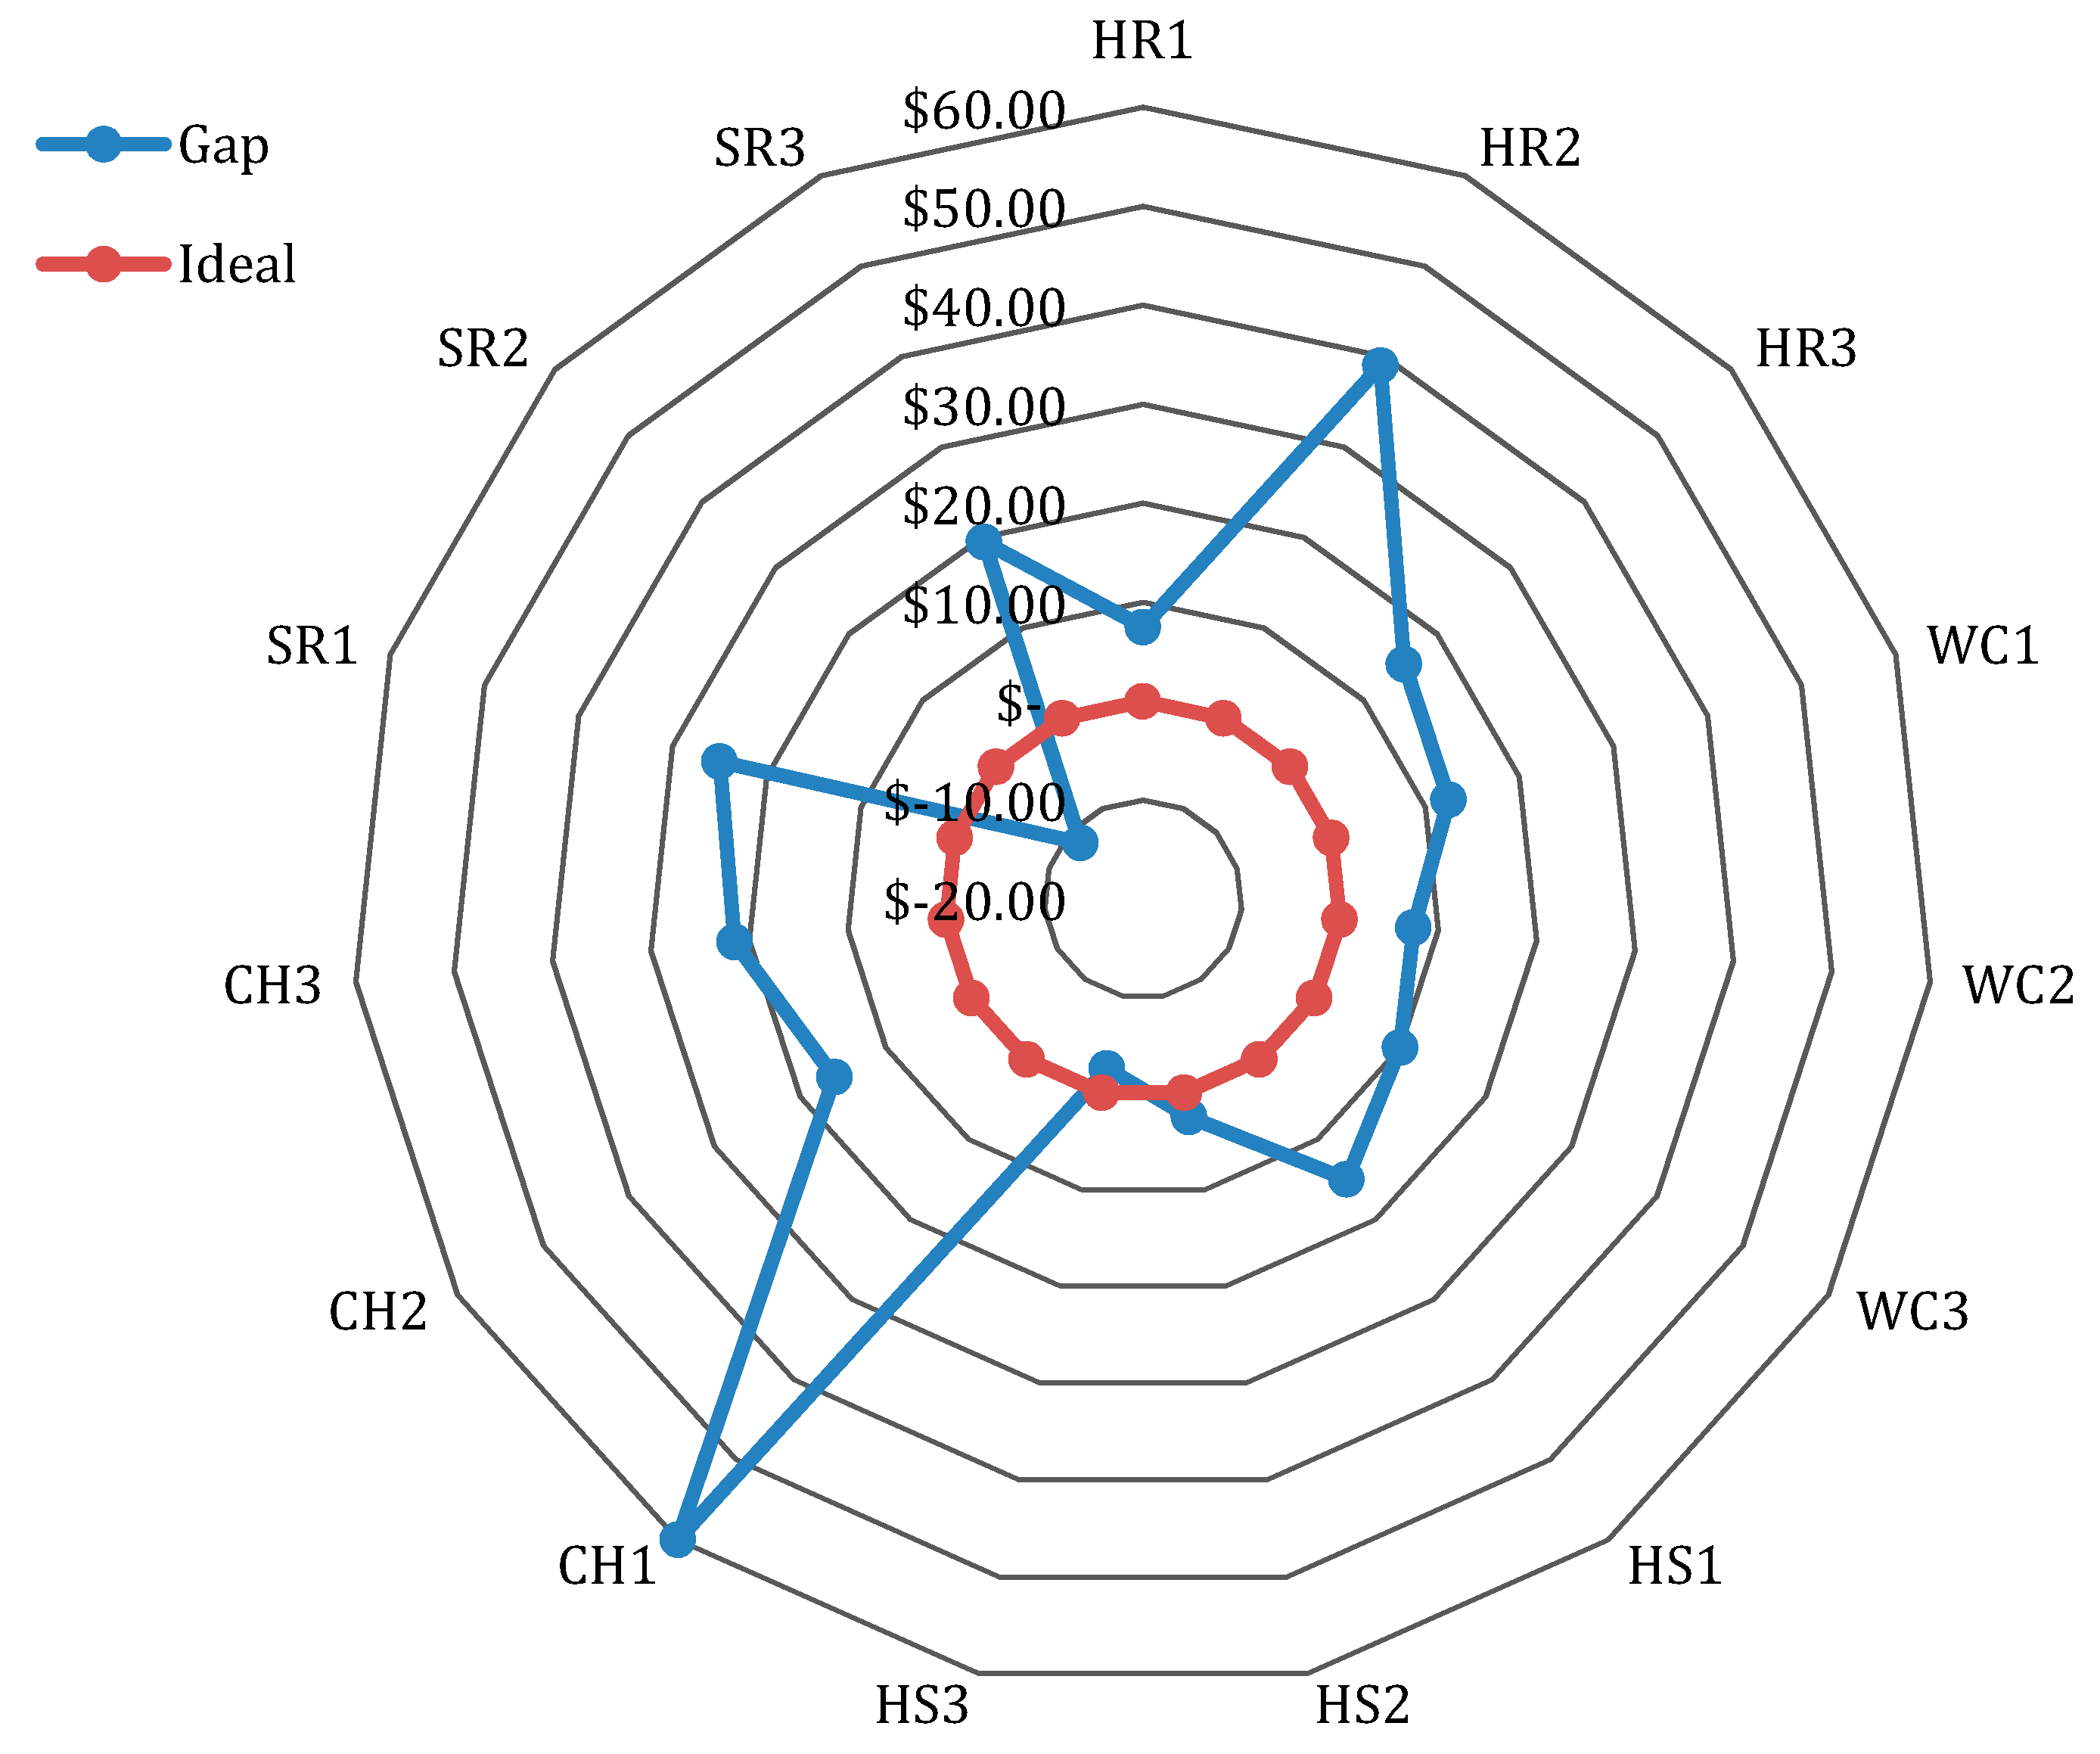
Our hypothetical operationalization of the GreenZee model presents several important findings, which are represented in radar charts (
Figure 4 and
Figure 5).
Figure 4 shows the average gap for the respective impact categories where the gap indicates the sum of perception minus expectation. Since there are no negative values for the five impact categories, we can infer that according to the participants’ inputs, none of the categories have negative social impacts and the production of biodiesel in NL would support social sustainability overall. Considering that there are no negative social implications associated between the participants and the impact categories, it is important to explore the positive implications of each impact category.
An important point concerns the gap between perception and expectation. In particular, in an ideal situation there should be no divergence (gap = 0) between the perception and expectation of social implications. The average gap denotes the average gap values from the GreenZee model for the respective impact categories. Simply put, while a positive gap indicates a relatively socially sustainable impact, a negative gap indicates negative impacts on society.
As we show in
Figure 4, the ‘society/health and safety’ category has the least significant gap between the perceived and expected conditions. In this test, we can see that with the three indicators of ‘society/health and safety’ (i.e., importance of sustainability issues; economic growth and development; the use of environmentally friendly products), perceptions are higher than expectations. Considering the results of sub-impact categories of ‘society/health and safety’, the analysis suggests that the use of environmentally friendly products in manufacturing of biodiesel is of considerable importance. This aspect is justified through analysing HS1, HS2, and HS3 in
Figure 5, which shows the difference of expectations and perceptions for individual categories’ subcategories.
The next least average gaps are ‘working conditions’ (+$10) and ‘socioeconomic repercussions’ (+$11), respectively. The gap in both of these categories is relatively small and positive, indicating that both impact categories and their respective categories WC1, WC2, and WC3 and SR1, SR2, and SR3 have positive social implications and that the social impacts are higher than those of ‘society/health and safety’.
The human rights (HR) impact category and its associated sub-impact of ‘working conditions’ (WC) has an average gap of +
$20.67, indicating that the level of perceived conditions exceeds the level of expectations and shows a positive social impact. As its sub-impact categories indicate in
Figure 5, it is expected that there will be no child labour force used in producing biodiesel in NL. This result is also supported and controlled by strict state (e.g., federal and provincial) regulations regarding child labour in the workplace. Moreover, the results indicate that participants perceive the biodiesel industry to promote equal opportunities (HR2 in
Figure 2) in workplaces. This indicates that there is potential for positive and tangible impacts in shaping a socially sustainable biodiesel sector in NL.
Fair wages are also perceived to have positive impacts on society. On the ground, the NL government has set minimum wages and as such, labourers cannot, under law, be given wages below these standards (The formation of labour unions, which typically drive up wage standards, was not included in this study).
The most notable gap is represented in the cultural heritage category (+
$32.5). With the widest and most positive gap, we can infer that biodiesel production could involve positive socio-cultural impacts in NL. Considering the monetary aspects of the respective sub-impact categories, the biodiesel production in NL is perceived to support a wide range of cultural values, including maintaining support for a socio-culturally diverse labour market (
Figure 5) and contributing to a more sustainable working environment and local community.
In
Figure 5, the perception of two key sub-categories, the ‘use of environmentally friendly (green) products in technology upgrades’ (HS3) and ‘mental health’ (SR2), have lower dollar values than their expectations. In particular, HS3 shows an average gap of −
$2.50 while SR2 shows an average gap of −
$11.50. This indicates that there is a perceived need to use environmentally friendly products while installing a biodiesel production plant in NL. A higher negative gap of mental health indicates that there is a perceived need for increased attention to mental health issues in the production of biodiesel in the province.
Overall, our hypothetical test shows a GreenZee score of +3.13. Referring to
Figure 3, the GreenZee score is positive, which suggests that there are no perceived negative social impacts of producing biodiesel in NL and therefore biodiesel production can potentially translate to more sustainable social impacts. With this GreenZee score, the analysis has shown there would be a positive impact of biodiesel production; however, to answer the question: ‘how much positive impact will there be on the society?’, one would need to compare the biodiesel GreenZee score of +3.13 (from this analysis) with some other product’s GreenZee score. Given the need for comparisons, it is vital for users to compare GreenZee scores of multiple products in order to determine the which products have the minimum and maximum social impacts as per
Figure 3.
Finally, it is important to note that this case study provides an illustration of the GreenZee model and that these hypothetical results are not intended to be used for other research purposes. Indeed, financial models, such as the GreenZee, depend on wider participation and input from a range of experts and stakeholders.
Overall, our analysis shows that the specification of the system boundary is pivotal to the implementation of the GreenZee model since S-LCA studies require an analysis of the complete life cycle of a product/service. Following this approach, the data for the GreenZee model are collected for each product stage, including: the production of raw materials, the end-user of the final product, and the disposal stage of the product. Since the production, use, and disposal of a product may not be completed in the same geographical region, then the results propose to apply the GreenZee model wherever these product life stages exist. Take, for example, a product that is produced in Canada and exported to the United States. Here, an S-LCA practitioner using the GreenZee model would obtain monetary data from both the manufacturer and local communities (e.g., consumers, local labour markets) of the production units in both the Canadian and American markets. The GreenZee score is then a resulting calculation of both data sets. In order to have consistency in units, the monetary values are converted into one currency depending on existing currency conversion rates. The results of the GreenZee analysis represent a comprehensive list of sub-categories that are used to perform S-LCA of any product/service. Categories that are not applicable to a product are left blank, registered as null, and are automatically omitted from the analysis.
The core outcome of this research lies in developing a financial model for the S-LCA of products and/or services. The analysis shows that the GreenZee model can be implemented in any country using the local currency as units for each selected category and sub-category. The interpretation of the GreenZee score shows that a product with a positive score has positive social impacts while a product with negative score has negative social impacts. The interpretation of the GreenZee score also shows that if a score zero is obtained, there are no social impacts of the product and in order to check the sustainability of the product, other life-cycle studies (e.g., economic and environmental life cycle assessments) should be performed to check the feasibility and consistency of the product. Since the GreenZee model is built in MS Excel, a sensitivity analysis can be performed by changing one monetary input value and observing its impact on the entire S-LCA study.
5. Conclusions
The development of new S-LCA methodologies is responding to calls from consumers, enterprises, and public authorities for increased transparency of social and economic circumstances in product/service manufacturing. This paper adds a new direction in social impact assessment approaches. The proposed S-LCA framework, called the GreenZee model, represents a novel methodology that focuses on financial or monetary modelling as a decision support tool for product/service stakeholders’ writ large. The proposed GreenZee model provides several contributions worth outlining.
First, the GreenZee model offers a scalar flexibility that is often a central challenge for other S-LCA approaches. Here, the monetary modelling that is at the heart of the framework provides users with a relatively simple approach to translating a variety of quantitative inputs (as importance levels) into financial outputs (as strength levels) that are easy to manipulate and compare not only within but among local communities. In the past, the characterization and assessment of the social impacts of products have been daunting tasks. The central obstacle of most S-LCA approaches lies in the discrepancies and divergence of social impact ‘units’ across space, making any evaluation of a combined socio-economic impacts a serious challenge. Overall, the GreenZee model proposed here bridges the gap and advances the S-LCA of products in local monetary terms through using harmonized currency units to represent social impacts. Such an approach encourages a degree of methodological flexibility that is not currently possible in S-LCA techniques.
Second, the proposed GreenZee model provides an extensive database of the various social impact factors that can be related and applicable to a broad range of products/services. The GreenZee model overcomes key research limitations, such as the non-compliance of one product/service S-LCA model to another product/service. In terms of products, the GreenZee model can be implemented on all three product levels (i.e., core, actual, and augmented product) and on new product development (NPD) stages. In terms of services, the GreenZee model registers the social implications inherent in the interactions between an enterprise and its consumers both locally and system-wide.
Third, to assess the social impacts of products/services, the proposed model translates the qualitative information (subjective expectations and perceptions of interviewed participants or stakeholders) into quantitative data (financial inputs and outputs); hence, the model is based on a ‘deterministic approach’ [
12,
66]. A deterministic approach allows for the use of fixed inputs to determine fixed output values rather than having different outputs as is the case in a stochastic modelling approach.
Fourth and finally, as we show in our case study, the GreenZee model represents a step forward in developing social and socio-economic life cycle assessment methodologies for new energy systems and alternative energy products, such as biofuel. As pressures mount for new forms of ‘clean’ and ‘green’ energy and alternative fuels, there is a subsequent need to identify potential social challenges in their development and implementation. Indeed, understanding the social conditions in the life cycle of energy systems and their key technologies will remain significant especially as industry leaders are increasingly held accountable for the impacts of their products. Clearly, the GreenZee model presented here is one step in promoting S-LCA across diverse energy and industrial sectors, and as such, more research is required to operationalize and test this model that can help to produce a more socially sustainable world. It is important to note that the inputs from only two experts in this study are merely designed to test and demonstrate how the GreenZee model works and therefore the results do not represent a comprehensive S-LCA of biodiesel in NL. As a future direction, it is recommended to include a larger and diverse group of stakeholders or key decision-makers when implementing the GreenZee model in an actual case study.


