Abstract
One of the most serious concerns about mega event-related changes to small cities is how to effectively utilize newly developed public attractions after the Olympic Games. Making connections with existing local amenities and forming attraction networks can be effective strategies for continuing a city’s revitalization. However, despite the expected benefits, attraction network research shows that these benefits often fail to materialize. With the case of Gangneung, a 2018 Winter Olympic hosting city, this study investigated visitation patterns to 19 selected attractions using network analysis. The results indicate that the most influential nodes are located on the northern coast, the eastern coast, and in the south downtown area, those nodes being the central locations where the strongest of connections are made. New attractions such as the Olympic Park and Walwha Linear Park were rather isolated. While seasonal and periodic variations, visitors’ residences, and destination choice attitudes had a significant effect on visitation patterns, the attraction networks, modes of transportation, proximity to region, and type similarity were not significant factors in the forming of visitation patterns. The results make a methodological contribution to tourist behavior and network research. In addition, beyond individual attraction development, the results provide practical implications in regard to networking and cooperation between multiple attractions using temporal and spatial strategies such as management/investment prioritizing, travel route development, and program scheduling.
1. Introduction
1.1. Olympic and New Local Attractions
Mega events such as the Winter Olympic bring great changes to small cities. While they are expected to make positive changes, such as city branding [1,2,3,4], economic benefits [5], and non-infrastructural benefits [2,6], they also bring negative changes, such as gentrification and social exclusion [7,8], short term development for the sole purpose of Olympic bidding [7], and cultural splits [9].
One of the biggest changes to host cities is the development of local attractions. For example, according to a local research report [10], comparing three winter Olympic host cities, on average, 300,000 to 400,000 m2 of new public amenities such as a new plaza, a residential park, and a city park are developed in preparation for the Olympics. Turin, despite having the largest population (0.9 million), had the smallest newly developed public outdoor space (286,000 m2), indicating the limitations of available land in high-density development. In comparison, Nagano, with a smaller population (0.37 million), had the largest developed area (446,000 m2), indicating more available land in a lower density development than Turin. Finally, Gangneung (0.2 million) had an area (310,000 m2) similar to Turin, suggesting more available land than Turin. Unlike Turin or Nagano where Olympic venues and related amenities are distributed around the city, in Gangneung city, all of the venues were located in Olympic Park. In Gangneung, in addition to Olympic Park, diverse local attractions were developed, including new commercial streets, a new linear park along the underground railway site, a new neighborhood park near the athlete’s village, and a new plaza in front of the new express railway station. Accordingly, one of the most critical concerns is the post-management and planning of these new attractions after the Olympic Games.
1.2. Local Attractions Network in Small Cities and Influential Factors
Several Winter Olympics host cities are small, the population of which ranges from 0.2 million to 0.3 million, or even much smaller than that. Public amenities and attractions in these small cities tend to be widely spread out. Unlike major cities where there is a separate, designed urban park or plaza, in small cities the existing natural attractions, historical sites, and local amenities are utilized instead, and new attraction development is closely associated these existing ones. The role of these sites as tourist spots are emphasized and these sites often have issues such as the seasonal gap in the number of visitors and conflicts between residents and visitors. Accordingly, there is a need for differentiated planning and management of attractions and amenities in small cities and towns.
Tourist behavior is understood as a complex phenomenon, influenced by destination factors (e.g., environments, landscape), tourist factors (e.g., travel motives, past experiences), and the interactions between these [11,12]. In much of the touristic attraction literature, the attractions visited have been shown to be associated with destination characteristics or travel settings such as locations and proximity [13], attraction types [13,14], big event impact [15], seasons and week periods [16,17,18], transportation options [19], length of stay [20], and so on. Other factors associated with attraction visits are characteristics involving the tourists themselves, such as residences for visitors [11,21], prior visit experiences [11], and travel motives or choice attitudes [12,22,23]. Thus, effective, demand-driven management and planning of tourist attractions must be practiced based on a clear understanding of these factors affecting tourism-related behavior.
However, these factors have so far been investigated in a more isolated manner [12] and mostly for the major touristic cities or focusing on individual attraction. Often, small cities or rural towns struggle because the pulling power of their attractions is not enough. A network of several attractions can be an effective strategy to increase the power of these destinations as well as to mitigate problems such as seasonal gaps and differentiated needs of residents and tourists [14]. Few studies have examined tourist movement patterns to multiple destinations, which could lead to revelations on the liaison potential of attractions. Research on why movement patterns or flows are formed as they are, and their underlying mechanisms, are also limited. A recent study has [24] examined an agricultural village network and evaluated the spatial centrality of 43 rural towns in South Korea. Another study [13] investigated the influential factors affecting attraction networks such as the various types of proximity in terms of physical locations, program types, and evaluation status. A recent study [20] has found that the staying period (e.g., short, mid, long) significantly affects the network density.
This study examines the attraction network potential and the influential factors affecting the attractions network in Gangneung city where new public attraction development has been active since preparations for the 2018 Winter Olympics. Beyond individual attractions, this study aims at revealing how they are related and whether the new attractions are well connected to existing ones based on flow data of visitor movement. This would provide helpful baseline data for demand-driven, attraction planning, such as public transportation connection and program scheduling. In addition, this study aims to make a methodological contribution by applying network analysis to tourist flow investigation. Recently, many touristic attraction studies have shown an innovative methodological approach, including the big data analytics method [25], Bluetooth tracking [26], geo-tagged social media, geo-tagged photos, and blog text mining [1,27,28,29,30,31]. Social network analysis is one of these new approaches and has seen increased usage in different fields of social science [13,15,20,24]. As an extension of previous studies [13,20], this study attempts to deepen the understanding of attraction networks and the underlying mechanisms beneath the flow of tourist movement.
2. Methods
2.1. Study Location
Gangneung is a coastal city on the East Sea of South Korea. The city is famous for its natural seashore landscape, historical sites, and adjacent fishing villages (Figure 1). There are popular natural attractions such as sandy beaches (i.e., Kyoung-po and An-mok beach), as well as sites of historical significance sites such as Korean traditional housing (e.g., O-Juk-heon and Seon-kyo-jang). These places are heavily occupied during vacation seasons and weekends. Since Gangneung was named a host to the 2018 Winter Olympics, several new public attractions were actively developed, including Olympic Park, the front square of the express rail station, Linear Park, and the Market Street underground railway site. New express railways reduced travel time from Gangneung to Seoul to approximately one hour and drew tourists into the old downtown district where the new KTX station is located. Thus, new tourist routes were expected to develop and there has been a need for new contents and programs to satisfy these increasing demands. For this study, 19 city attractions are selected to examine the tourists’ movement flow and pattern (Figure 1).
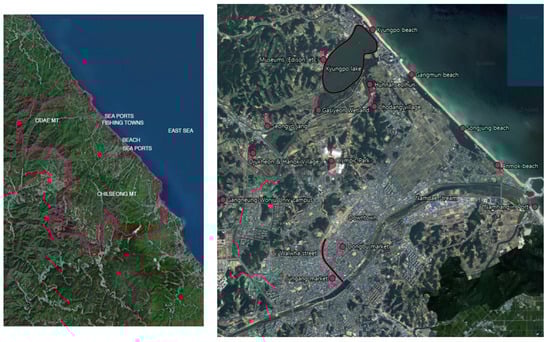
Figure 1.
Location of Gangneung on the East Coast area, South Korea. The selected 19 attractions include a variety of natural assets, cultural amenities, and historical sites referenced on the city website and social media.
2.2. Destination, Travel Setting, Personal Trait Variables
In a broad sense, destinations, travel settings, and personal preferences have been known to be major factors affecting the tourist attraction network. The preceding tourism literature indicates three major categories of factors that affect tourist choice and behavior including destination characteristics, travel settings, and the personal traits of tourists. In previous studies, these factors have been examined for their significance in how they affect the destination choices and visitation patterns of tourists; however, very few studies have examined the influence of these factors on the attraction network and on relations between individual attractions. In regard to city conditions, the most critical variables have been selected for this study in order to test their impact on attraction liaisons (e.g., network density, centrality degree, connection degree), which may be helpful for the planning and management of attraction networks. These critical variables are location proximity, program similarity, seasonal variations, week and weekend differences, modes of transportation, residences, and personal preferences.
2.3. Data Collection and Respondents Profile
The purpose of this study is to identify a pattern of visitor movements to and from multiple attractions and the factors affecting the flow of these movements. To collect data for visitations to multiple attractions, we developed a city map survey with marks indicating the location of 19 local attractions (Figure 1). The participants were asked to check all the places they have visited or plan to visit as well as to specify the hours they have stayed or plan to stay at a particular location. To test the effect of destination characteristics (e.g., location and programs), the 19 locations are categorized into three regions as well as three types (e.g., natural attractions, cultural museums and historical sites, and local amenities).
In addition, to test the effect of travel settings, the participants were asked to report their transportation method (e.g., car, public bus, taxi), travel budget (e.g., approximate won), and staying period (e.g., one day, one night, two nights, three nights, more than four nights). Lastly, regarding personal factors, the participants were asked to answer questions about their residences (e.g., Gangneung, domestic, other countries) and visit frequency (e.g., first time, more than two times, regular visits). In addition, nine items were included in the survey to measure the destination preferences of the participants. For example, they were asked to rate the importance of certain aspects that factor in to their choice of places they want to visit such as, ‘popular places in social media’, ‘gorgeous and unique natural environment’, ‘unique architecture or structures with artistic value’, ‘special programs including festivals and cultural events’, ‘educational opportunities via local history and culture’, and ‘accessibility, transportation, and parking lot availability’. A seven-point Likert scale was used for these ratings ranging from −3 (=negative) to 3 (=positive).
The participants were recruited from four tourist attractions (O-Juk-heon, Kyong-po Beach, Olympic Park, Walwha Park commercial street) and the express bus terminal. During the survey period (pre-Olympic season), the express rail station was still in construction, thus, it was not included as a survey site. Using a convenient sidewalk sampling method, 130 visitors, in total, participated in the survey. Two student surveyors participated in an education session and conducted the surveys. To account for seasonal and weekend factors, the survey was conducted 18 times during the fall (September and October) and winter (December) of 2017 during weekdays and weekends.
As for the survey respondent profile, some are evenly distributed, but others are not. The participants’ backgrounds were reasonably balanced for gender: 54% male and 46% female (Table 1). However, in terms of age, about half of the respondents were young college students and the other respondents ranged from 30 to 50 years (58% in their 20s and 33% in their 30s through 50s). The residence profile showed that more than half of the participants were tourists from other cities, making up 65% of those surveyed, and 35% were residents. Among tourists, most participants were more than second-time visitors (81%) and first-time visitors were few (19%). For travel settings, trip periods were reasonably balanced: 52% visited during the fall and 42% during the winter, and as well as 58% visited during the week while 42% visited during the weekend. The most common forms of transportation can be largely divided into three major groups: owner-driven cars (44%), public bus (24%), and taxis (14%). The travel budget was fairly evenly divided: those planning to spend less than $100 made up 42% of respondents while those who planned to spend less than $300 per person made up 50% of respondents. As for the number of trip companions, 23 % travelled alone, 52% travelled in a pair, and 25% travelled in groups of more than three. The durations they have stayed or planned to stay in Gangneung were concentrated on two to three nights, and can largely be divided between two major groups: one day (22%) and two or three nights (69%).

Table 1.
Respondents’ profile
2.4. Network Analysis
Three different types of network analysis procedures were used in this research: (1) descriptive statistics based on degree centrality; (2) correlations and regressions analysis using quadratic assignment procedure (QAP); and (3) network density comparison analysis (NCT). All the collected survey data was entered into a Microsoft Excel spreadsheet, after which the Statistical Program, R version 21, was used for further analysis. For data preparation, the data matrix was transformed from two-mode data to one-mode data: two modes to weighted one mode, weighted two-mode to weighted one-mode. For the first phase of descriptive analysis, the degree centrality of each node (e.g., 19 attractions) and the weights of each edge (e.g., connections weights between attractions) were calculated. Finally, the node and edge data were visualized with circle sizes and line widths on the aerial map using the i-graph package of R.
The second part of the analysis comprised correlation and regression analysis. When there is information about different kinds of relations among the same sets of actors, it is often of considerable research interest to determine if the probability (or strength) of a tie of one type is related to the probability (or strength) of another [32]. Correlation calculates the measure of association between the relations in two matrices. For this, quadratic assignment procedures (QAP) are used to develop standard errors to test for the significance of association. In addition to correlating one relation with another, another interest involves predicting one relation knowing the other. The traditional approach for this is linear regression which can test the predictability of multiple variables on dependent variables. To examine the significance of relationships between the ‘destination factors’ (e.g., geographical adjacency, program similarity) and attraction networks, as well as, the predictability of those factors on attraction network, we conducted QAP correlation and regression analysis, a useful hypothesis testing method. Regional proximity and type proximity were selected as independent variables in consideration of city conditions. Regional proximity reflects spatial ties or adjacency among tourist attractions. We classified the attractions into three categories based on their geographic locations. If attraction A and attraction B are in the same region, they would have a tie and the cell in the matrix is given a value of 1. Otherwise, if there is no regional tie, the cell is given a value of 0. Type proximity indicates program or content similarity among the attractions. The 19 attractions were categorized into three groups including natural attractions, cultural or historical sites, and local amenities. In the same way, the value 1 was given to the cell when two attractions fit the same category. The attraction network is the dependent variable in this study. First, a valued 19 × 19 matrix (i.e., weighted one mode data) was generated based on visitations to multiple attractions in this matrix. Each cell (x, y) had a value that indicates the numbers of visitors who visit both attraction x and y. To apply network analysis to existing data sets, the data must be transformed into binary data, for example, either the value 0 or 1. For dichotomizing the existing cell values, the mean of all cell values is selected as a cut-off value [33]. The cell values less than the mean value were reassigned with ‘0’ and those equal to or more than the mean values were assigned with ‘1’.
Lastly, in accordance with the purposes of this study, which examines the impact of ’travel settings and tourist factors’ on attraction networks (e.g., residents and tourists, first time visitors and multiple time visitors, and private car and public transportation), we conducted a network comparison analysis. For this study, this is effective method to identify if there are significant differences between two different types of networks with same attraction points, for example, movement patterns made by different tourist groups or under the different travel settings. In this stage, all the data is re-categorized based on factors chosen for testing. For example, to identify personal preference types, a dimensional analysis (factor analysis) was additionally conducted to determine whether useful attitude type categories could be identified based on importance rating patterns. Next, to set the same sample number for each network to compare, a random sampling method was utilized using random seed function in R. If the category had samples that were too small, the data was excluded. Again, each data set is transformed to one-mode data and exported again to proper format for further comparison analysis. Lastly, to test if there is a significant difference between the two paired network data (i.e., residents’ and tourists’ networks), we utilized network density comparison analysis, a bootstrap paired sampled t-test in UCINET. All the statistical significances were tested at the 95% significance level. The number of permutations for bootstrapping is set up to 10,000.
3. Results
3.1. Descriptive Analysis of Touristic Attraction Network
The results of descriptive network analysis can be divided into two categories: (1) the degree centrality of each attraction and (2) the weighted connections among the attractions. First, the eigenvector centrality is calculated with two types of attraction network and shown in Table 2; eigenvector centrality 1 indicates the centrality value based on the visitations to each attraction (e.g., unweighted two mode data) and the eigenvector centrality 2 is analyzed based on the visitor’s duration of stay at various attractions (e.g., weighted two mode data). For the network analysis based on staying time, weighted two mode data matrix was developed. In this matrix, instead of the value of 1 or 0, specific time durations are assigned to the each cell. For example, if a person has stayed in Kyeongpo beach for two-and-a-half hours, 2.5 is assigned to the cell value in weighed two mode matrix. In unweighted two mode matrix, 1 is assigned to the cell value regardless of the staying duration. The standardized eigenvector centrality of each attraction ranges from 0 to 1. Results found that most attractions have a centrality value of more than 0.5, except for Olympic Park (0.36). The core attractions, the highest centrality group (more than 0.9), includes Kyungpo Beach (1.0), Anmok Beach (0.97), O-jukhun (0.95), downtown (0.92), and Kyungpo Lake (0.91), which are connected to numerous other attractions. The second highest group (0.7–0.8) includes Gangmun Beach (0.87), Jungang Market (0.87), GWNU campus (0.81), Chodang Village (0.80), museums (0.75), and Seonkyo House (0.75), and Songjung Beach (0.72). The lowest group (less than 0.6) includes Walwha Street (0.59), Gasiyeon (0.56), Namhangjin port (0.55), Namdae River (0.53), and Olympic Park (0.36). Centrality results based on staying time show similar, but more salient differences among attractions. The highest centrality group (more than 0.9) has a smaller number than the visitation network and includes Kyungpo Beach (1.0), Anmok Beach (0.96), and downtown (0.94). O-jukhun (0.65) and Kyungpo Lake (0.69) are not in the highest group anymore. The second highest group (0.6~0.8) includes Jungang Market (0.75), Gangmun Beach (0.73), Kyungpo Lake (0.69), and O-jukhun (0.65). The lowest group (0.1–0.4) has a larger number and the group includes Namhangjin port (0.39), Seonkyo House (0.37), Dongbu Market (0.35), Gasiyeon (0.33), museums (0.32), Huhnansulheon Park (0.31), Walwha Street (0.30), Namdae River (0.29), and Olympic Park (0.19).
Table 2.
Descriptive statistics of two tourist attraction networks: eigenvector centrality ranges from 0 to 1; eigenvector centrality 2 is measured based on the duration of visit, or staying time, at each attraction
In addition to the degree centrality, the connection strengths are calculated for both types of attraction networks. The results are graphically represented in Figure 2 and Figure 3. The Figure 2 shows the attraction networks based on visitations and Figure 3 shows the network based on the staying time. The connection strengths are presented as yellow edges with different widths. The connection strengths range from 0 to 100, from 0 to 80 for the visitation network, and from 0 to 100 for the staying time network. The results of the visitation network showed no big differences in connecting strengths between attractions. The network shows rather complex, web-like patterns of connections centered on multiple attraction points, for example, the Northern coast and East coast, the Northern coast and South downtown area, the Northern coast and historical sites. Unlike visitation networks, the staying time network shows clearer differences in connecting edge widths and a simpler pattern of connection. A strong triangular connection among the Northern coast attractions (e.g., Kyungpo Beach and Lake), East coast attractions (e.g., Anmok Beach), and South downtown area attractions (e.g., downtown, Jung-ang market) was distinctive in this network.
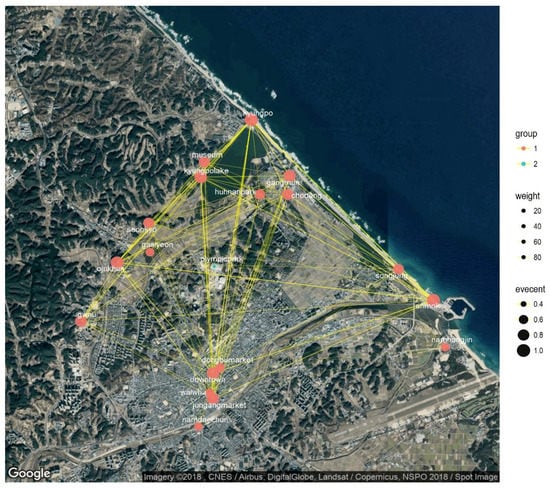
Figure 2.
Attraction network in Gangneung city (only visitation considered): Different node colors indicate different group members (based on cluster analysis); the size of node depends on the eigenvector centrality; width and transparency of edges depend on weights (strength of connections).
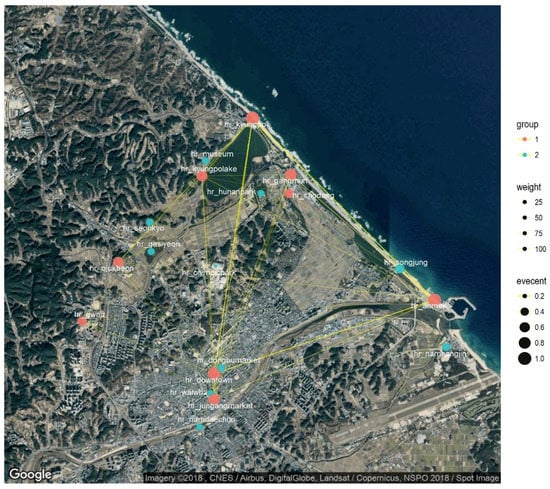
Figure 3.
Attraction network in Gangneung city (staying time considered): Different node colors indicate different group members (based on cluster analysis); the size of node depends on the eigenvector centrality; width and transparency of edges depend on weights (strength of connections).
Lastly, to categorize attraction groups based on centrality values, a cluster analysis was conducted. Through cluster analysis, 19 locations are largely grouped into two; (1) a red node indicates the high centrality group and (2) a blue node indicates the low centrality group. For visitation networks, all the attractions were categorized into the high centrality group except Olympic Park, suggesting the apparent isolation of new Olympic Park in the attraction network. Unlike the visitation network, the staying time network showed a more balanced divide between the high and low centrality group.
3.2. QAP Correlation and Regression
Quadratic assignment procedure (QAP) is a useful approach for testing hypotheses on relationships among multiple networks [34,35]. To test the factors affecting attraction networks, including geographical proximity and type similarity, we modeled hypothesized relationships among these variables and conducted QAP using UCINET 6.0. The attraction matrix was set to a dependent variable and location proximity and type proximity were set to independent variables. This method calculates the influence significance of the independent variables on the dependent variable. It also generated a pseudo R2 that is analogous to the R2 in ordinary least squares (OLS) regression. QAP regression, especially, is a useful tool in effectively avoiding the autocorrelation problem inherent in network data in which the biased estimators can be generated under the OLS context because the actors (units of analysis) respond with reference to one another.
The results of the correlations between the variables in our QAP models are shown in Table 3. The results of regression including standardized coefficients of the independent variables and the R2 of the QAP regression models are shown in Table 4. In the models, the adjusted R2 (0.0013) was not significant, indicating that only 0.13% of variance in the tourist attraction network can be explained by adjacency and content similarity. Therefore, both variables were not significant factors in determining the attraction network. As reported in Table 4, the coefficient for regional proximity was not significant (b = −0.033; p > 0.05). These results suggest that adjacency or distance between attractions do not impact the attraction network. In addition, the coefficient for type proximity was not significant (b = 0.093; p > 0.05), suggesting that similarity of contents or programs between attractions have no influence on attraction connections. In other words, visitors do not have a tendency to move around the attractions adjacent to each other or those programmed with similar themes. This confirms previous study results in that visitors prefer destinations with some variety [13,14].
Table 3.
Results of QAP correlations: p-values are in parentheses and significance levels follow: * p < 0.05
Table 4.
Results of QAP regression: number of permutations is 10,000. All coefficients presented are standardized coefficients. Standard errors are in parentheses. Significance level; the dependent variable is the tourist attraction network.
3.3. Network Density Comparison
Unlike correlation or regression analysis that reveals association strength or predictability, network density comparison focuses on identifying the differences between selected network relations. Similar to the classical paired sample t-test, this analysis is useful when making statistical comparisons to the densities of two relations for the same actors and when calculating estimated standard errors to test differences using the bootstrap method. When both relations are binary, this test identifies significant differences in the probability of a tie of one type and the probability of a tie of another type. If both relations are weighted, this reveals a significant difference in the mean tie strengths of the two relations. In this study, six pairs are tested based on residence, transportation mode, seasonal variations, and so on. For personal preferences, dimensional analysis indicates that there are two types of tendencies when participants choose specific local places to visit (Table 5). Two pairs for each type are tested (Table 6).
Table 5.
Factor analysis for choice attitude: factor loadings less than 0.3 are removed
Table 6.
Network density comparison; number of bootstrap samples is 10,000; p-values are in parentheses; significance level: ** p < 0.01, * p < 0.05, ︒ p < 0.1
Bootstrap approach results in which 10,000 sub-samples are generated are reported in the output. The difference between mean density ranges from 0.84 (preference 1) to 9.69 (residences). The standard error of the difference in the classical method ranges from 0.44 to 0.66; the standard error by bootstrap estimate ranges from 1.43 to 2.13. Overall, the conventional approach greatly underestimates the true sampling variability and gives a result that is too optimistic in rejecting the null hypothesis that the two densities are the same. By the bootstrap method, we can see that most networks compared show significant differences except for Preference 1. There are two-tailed probabilities of 0.0001 (seasonal variations), 0.0063 (week variations), 0.0106 (transportation), 0.0001 (residences), and 0.0001 (Preference 2). Thus, the results reveal with great confidence, for instance, the density of attraction ties in the case of fall and weekdays is greater than the density of attraction ties in the case of during winter and weekend. In addition, the density of attraction ties when visitors are interested in natural assets, architectural features, and accessibility is greater than the density of attraction ties when visitors are interested in activities and events. That is, the observed differences would arise very rarely by chance in random samples drawn from these networks. For example, the biggest difference was reported between residents (13.82) and tourists (4.13) in that the network density made by residents is significantly greater than that made by tourists.
4. Discussion and Conclusions
4.1. Discussion
Mega events such as the Winter Olympic bring great changes to small cities including general perception changes to host cities [36,37,38,39,40]. While they are expected to make positive changes, they also bring negative changes, such as gentrification and social exclusion, short term development for the sole purpose of Olympic bidding, and cultural splits. One of the most critical concerns is the post-management and planning of new local attractions after the Olympic Games.
Although attraction networking can be an effective strategy to increase the pulling power of the tourism industry in small cities, very little research has investigated network potentials between attractions and related factors. In order to fill this knowledge gap, this study examined multiple attraction visitation patterns and the influential factors in the case of Gangneung, a small vacation city hosting the 2018 Winter Olympic Games. On the one hand, the research findings contribute to the tourism network literature with an understanding of the pattern and the underlying mechanism of the tourist flow between multiple attraction points based on demand-driven data [41]. In addition, this research reveals the usefulness of network analysis to quantitatively measure the flow of visitors, and identify the major anchor points and connections strengths. On the other hand, it provides practical implications for attraction management for small cities that are facing new challenges, such as population decreases and post-management of public infrastructure after mega events.
For travel settings, the results found that seasonal (p = 0.00005 **) and periodical (p = 0.00315 *) variations significantly affect network density, which is consistent with the preceding research [16,17,18]. In particular, the attraction network in the fall season and on weekends was significantly denser than those in the winter and on weekdays, indicating that there is a need for timely management and scheduling of events and programs. Unlike periodic variations, the mode of transportation was not a significant factor affecting attraction networks. For example, public transportation users and owner–drivers do not show significantly different visitation patterns. Among personal characteristics, the residence (p = 0.00005 **) was a significant factor affecting network density. The flow of residents was significantly denser than that of tourists. It is not surprising that while tourists tend to travel to a few popular attractions (e.g., coastal areas, lakes, and O-juk heon), residents cover most of the attractions, including traditional local markets. This implies the need for networking or co-operating the known places with the less popular places. The results regarding the visitors’ personal preferences showed somewhat double-sided, complicated results. For example, the visitors who are in favor of natural attractions and fixed architectural features showed a significantly denser visitation pattern than those who are not. However, the visitors who make activities, trendy events, and programs a priority did not show a significantly different visitation pattern that those who did not. This may be because Gangneung is less expected to provide trendy events or activities, yet natural environments such as the coastal areas are influential so far. This implies a need for making an effort to develop appealing programs or trendy events to pair with existing natural and environmental assets management. For destination characteristics, contrary to our expectation and previous research findings, the regional proximity (i.e., distance) was not a significant factor affecting attraction networks. This suggests that Gangneung is a relatively small city, thus the distances among attractions may not be a significant barrier or reason for attraction visitation. This result is consistent with the above findings of the insignificant effect of transportation modes on network density. In addition, type proximity (e.g., contents and program similarities) was not a significant factor, indicating that visitors may want to experience some diversity when choosing multiple destinations, instead of concentrating on one type of activity or program.
As investigated in a preceding study [13], the degree centrality is efficient in identifying the key actors in attraction networks. The degree centrality analysis measures the influences of each individual node in a network, for example, and the more important role it plays, the higher central value it has. For this study, in attraction networks based on staying time, the centrality differences are clearly shown. Kyungpo Beach (1.00), Anmok Beach (0.96), and downtown (0.94) were the most influential groups, and a strong triangular connection was made among these cores (e.g., the Northern coast and historical sites, the East coast and South downtown area). The result implies that one of the more efficient strategies for the least influential attractions, such as the museums (0.32), the Gasiyeon Wetland (0.33), and the Namdae River (0.29), is to co-market with the major, more popular and significant attractions. New Olympic-related public spaces such as Olympic Park and Walwha Street were rather isolated in attraction networks, indicating that old and new public spaces are not well-connected yet. This may be because new attractions were still in renovation or construction. However, Olympic Park is located in a strategically important location between South downtown, where the new express railway was introduced and where the Northern coast is situated, which are traditionally popular attractions. In the near future, the express railway is anticipated to play a bridge role in drawing tourists from the northern coast into south old downtown. Specifically, the new KTX railway station would provide an opportunity to expand typical sightseeing routes to the central part of the downtown area where traditional markets and New City Park are located. These new public spaces, as well as an increase in railway users, may greatly change existing travel patterns, suggesting a critical need for longitudinal monitoring and research.
4.2. Theoretical and Practical Imlications
Theoretically, this study contributes to the understanding of tourism network literature, which little attentions have been paid to so far. Beyond individual attraction development, this study focused on inter-relationships between tourist attractions and found that there are key players or influencers leading the attraction network, with main connections being formed between these anchors. Unlike the cases examined in preceding studies, the attraction network of Gangneung did not show any significant relationship with either regional proximity or type similarity, indicating that these factors must be understood based on different city conditions such as city size. However, attraction networks are significantly affected by travel settings and the personal characteristics of visitors in this study.
Practically, the study recommends efficient planning strategies regarding networking and co-operating multiple attractions in Gangneung city. For temporal planning strategy, the study suggests the need for program scheduling for multiple attractions to complement each other and overcome periodic and seasonal gaps, specifically for the winter and weekdays. For spatial planning, triangular connections can be expanded and strengthened with the addition of relatively unrecognized attraction points. In addition, new travel route services (e.g., public shuttle service or touristic program routes) could potentially be provided based on this collected data. The results would be helpful in prioritizing the planning and management of attractions based on the degree of influence and isolation. Specifically, for Gangneung, this study provides useful baseline data for old and new Olympic attraction networking and co-marketing. This could eventually lead to efficient, continuous use (e.g., post-Olympic management) of Olympic-related public infrastructure and the continuation of post-Olympic revitalization.
4.3. Limitations and Future Study
This study focuses on Gangneung, a small city where new developments are actively occurring for the Olympic Games. Due to the specific conditions of this city, there is a clear limitation in transposing the results of this study to the tourist attraction networks of other cities, especially in terms of influential factors their impact on attraction networks. Relatively few studies, however, have investigated attraction networks, and thus additional cases should be examined for the purposes of more accurate comparisons based on city sizes, density, possible transportation modes, and so on. Also, this study focuses on pre-Olympic data when new public spaces are still in construction. One of the biggest changes is the new KTX (express railway) station that is expected (to form conditions) to draw tourists from coastal areas on the outskirts into the city center where traditional markets and local businesses are located. In particular, a new linear green space and public park, developed on the underground express railway, is expected to play an important role in revitalizing the large old city center due to its wider contact with existing commercial districts. Therefore, there is a clear need for further monitoring and research to determine if new public spaces are being effectively utilized after the Olympic period and are connecting with the necessary efficiency to traditionally popular attractions and new travel routes (i.e., Kyeong-po Beach, Ojuk-heon), for instances, a longitudinal study before, during, and after the Olympic Games regarding changes in the movement patterns of visitors.
Author Contributions
All authors have contributed to the intellectual content of this paper. The first author, E.-J.K., designed the study and was responsible for all statistical analyses and wrote the manuscript draft. Y.J. substantially contributed to develop the research idea and design. The corresponding author, Y.K., substantially contributed to the statistical interpretation and wrote the final manuscript. Conceptualization, Y.J.; Formal analysis, E.-J.K.; Funding acquisition, E.-J.K.; Investigation, Y.J.; Methodology, E.-J.K. and Y.K.; Supervision, E.-J.K.; Validation, Y.K.; Writing – original draft, E.-J.K.; Writing – review & editing, Y.K.
Funding
This research was funded by basic research program through the National Research Foundation of Korea (NRF) under the Ministry of Education (grant no. 2017010137). The APC was also funded by the National Research Foundation of Korea (NRF).
Conflicts of Interest
The authors declare no conflict of interest.
References
- Vanolo, A. The image of the creative city: Some reflections on urban branding in Turin. Cities 2008, 25, 370–382. [Google Scholar] [CrossRef]
- Gratton, C.; Preuss, H. Maximizing Olympic impacts by building up legacies. Int. J. Hist. Sport 2008, 25, 1922–1938. [Google Scholar] [CrossRef]
- Zhang, L.; Zhao, S.X. City branding and the Olympic effect: A case study of Beijing. Cities 2009, 26, 245–254. [Google Scholar] [CrossRef]
- Chappelet, J.L.; Lee, K.H. The emerging concept of sport-event-hosting strategy: Definition and comparison. J. Glob. Sport Manag. 2016, 1, 34–48. [Google Scholar] [CrossRef]
- Kasimati, E.; Dawson, P. Assessing the impact of the 2004 Olympic Games on the Greek economy: A small macroeconometric model. Econ. Model. 2009, 26, 139–146. [Google Scholar] [CrossRef]
- Minnaert, L. An Olympic legacy for all? The non-infrastructural outcomes of the Olympic Games for socially excluded groups (Atlanta 1996–Beijing 2008). Tour. Manag. 2012, 33, 361–370. [Google Scholar] [CrossRef]
- Davis, J.; Thornley, A. Urban regeneration for the London 2012 Olympics: Issues of land acquisition and legacy. City Cult. Soc. 2010, 1, 89–98. [Google Scholar] [CrossRef]
- Watt, P. ‘It’s not for us’ Regeneration, the 2012 Olympics and the gentrification of East London. City 2013, 17, 99–118. [Google Scholar] [CrossRef]
- Cheng, S.Y.; Rosner, J.L.; Chao, M.M.; Peng, S.; Chen, X.; Li, Y.; Kwong, J.Y.; Hong, Y.Y.; Chiu, C.Y. One world, one dream? Intergroup consequences of the 2008 Beijing Olympics. Int. J. Intercult. Relat. 2011, 35, 296–306. [Google Scholar] [CrossRef]
- Kim. Foreign Case Studies for Post-Management of Olympic Related Public Infrastructure in Gangneung, Local Reports; Gangneung-Wonju University: Gangneung and Wonju, Korea, 2018. [Google Scholar]
- Caldeira, A.M.; Kastenholz, E. Spatiotemporal behaviour of the urban multi-attraction tourist: does distance travelled from country of origin make a difference? Tour. Manag. Stud. 2015, 11, 91–97. [Google Scholar]
- Karl, M.; Reintinger, C.; Schmude, J. Reject or select: Mapping destination choice. Ann. Tour. Res. 2015, 54, 48–64. [Google Scholar] [CrossRef]
- Liu, B.; Huang, S.S.; Fu, H. An application of network analysis on tourist attractions: The case of Xinjiang, China. Tour. Manag. 2017, 58, 132–141. [Google Scholar] [CrossRef]
- Jurowski, C.; Combrink, M.S.; Cothran, C. Measuring probabilities in attraction visitation. In Proceedings of the 2007 TTRA International Conference: Tourism Travel and Research Association: Advancing Tourism Research Globally, Las Vegas, NV, USA, 17–20 June 2007. [Google Scholar]
- Leung, X.Y.; Wu, B.; Xie, F.; Xie, Z.; Bai, B. Overseas Tourist Movement Patterns in Beijing: The Impact of the Oympic Games. Tour. Travel Res. Assoc. 2016. Available online: https://scholarworks.umass.edu/ttra/2010/Oral/1/ (accessed on 4 September 2018).
- Butler, R.W. Seasonality in tourism: Issues and implications. Tour. Rev. 2001, 53, 18–24. [Google Scholar] [CrossRef]
- Hui, T.K.; Yuen, C.C. A study in the seasonal variation of Japanese tourist arrivals in Singapore. Tour. Manag. 2002, 2323, 127–131. [Google Scholar] [CrossRef]
- Song, H.; Li, G.; Witt, S.F.; Athanasopoulos, G. Forecasting tourist arrivals using time-varying parameter structural time series models. Int. J. Forecast. 2011, 27, 855–869. [Google Scholar] [CrossRef]
- Decrop, A. Destination choice sets: An inductive longitudinal approach. Ann. Tour. Res. 2010, 37, 93–115. [Google Scholar] [CrossRef]
- Kang, S.; Lee, G.; Kim, J.; Park, D. Identifying the spatial structure of the tourist attraction system in South Korea using GIS and network analysis: An application of anchor-point theory. J. Destin. Mark. Manag. 2018, 9, 358–370. [Google Scholar] [CrossRef]
- García-Palomares, J.C.; Gutiérrez, J.; Mínguez, C. Identification of tourist hot spots based on social networks: A comparative analysis of European metropolises using photo-sharing services and GIS. Appl. Geogr. 2015, 63, 408–417. [Google Scholar] [CrossRef]
- Mutinda, R.; Mayaka, M. Application of destination choice model: Factors influencing domestic tourists’ destination choice among residents of Nairobi, Kenya. Tour. Manag. 2012, 33, 1593–1597. [Google Scholar] [CrossRef]
- Lepp, A.; Gibson, H. Sensation seeking and tourism: Tourist role, perception of risk and destination choice. Tour. Manag. 2008, 29, 740–750. [Google Scholar] [CrossRef]
- Lee, S.H.; Choi, J.Y.; Yoo, S.H.; Oh, Y.G. Evaluating spatial centrality for integrated tourism management in rural areas using GIS and network analysis. Tour. Manag. 2013, 34, 14–24. [Google Scholar] [CrossRef]
- Miah, S.J.; Vu, H.Q.; Gammack, J.; McGrath, M. A big data analytics method for tourist behaviour analysis. Inf. Manag. 2017, 54, 771–785. [Google Scholar] [CrossRef]
- Versichele, M.; De Groote, L.; Bouuaert, M.C.; Neutens, T.; Moerman, I.; Van de Weghe, N. Pattern mining in tourist attraction visits through association rule learning on Bluetooth tracking data: A case study of Ghent, Belgium. Tour. Manag. 2014, 44, 67–81. [Google Scholar] [CrossRef]
- Chua, A.; Servillo, L.; Marcheggiani, E.; Moere, A.V. Mapping Cilento: Using geotagged social media data to characterize tourist flows in southern Italy. Tour. Manag. 2016, 57, 295–310. [Google Scholar] [CrossRef]
- Yuan, H.; Xu, H.; Qian, Y.; Li, Y. Make your travel smarter: Summarizing urban tourism information from massive blog data. Int. J. Inf. Manag. 2016, 36, 1306–1319. [Google Scholar] [CrossRef]
- Hu, Y.; Gao, S.; Janowicz, K.; Yu, B.; Li, W.; Prasad, S. Extracting and understanding urban areas of interest using geotagged photos. Comput. Environ. Urban Syst. 2015, 54, 240–254. [Google Scholar] [CrossRef]
- Vu, H.Q.; Li, G.; Law, R.; Ye, B.H. Exploring the travel behaviors of inbound tourists to Hong Kong using geotagged photos. Tour. Manag. 2015, 46, 222–232. [Google Scholar] [CrossRef]
- Tseng, C.; Wu, B.; Morrison, A.M.; Zhang, J.; Chen, Y.C. Travel blogs on China as a destination image formation agent: A qualitative analysis using Leximancer. Tour. Manag. 2015, 46, 347–358. [Google Scholar] [CrossRef]
- Hanneman, R.A.; Riddle, M. Introduction to Social Network Methods; University of California Riverside: Riverside, CA, USA, 2005. [Google Scholar]
- Shih, H.Y. Network characteristics of drive tourism destinations: An application of network analysis in tourism. Tour. Manag. 2006, 27, 1029–1039. [Google Scholar] [CrossRef]
- Borgatti, S. Testing Network Hypotheses. Colchester, Royaume Uni. 2004. Available online: http://www.analytictech.com/essex/lectures/hypotheses.pdf (accessed on 4 September 2018).
- Borgatti, S.P.; Everett, M.G.; Johnson, J.C. Analyzing Social Networks; Sage: Thousand Oaks, CA, USA, 2018. [Google Scholar]
- Chen, H. Medals, media and myth of national images: How Chinese audiences thought of foreign countries during the Beijing Olympics. Public Relat. Rev. 2012, 38, 755–764. [Google Scholar] [CrossRef]
- Chen, F.; Tian, L. Comparative study on residents’ perceptions of follow-up impacts of the 2008 Olympics. Tour. Manag. 2015, 51, 263–281. [Google Scholar] [CrossRef]
- Vanolo, A. The image of the creative city, eight years later: Turin, urban branding and the economic crisis taboo. Cities 2015, 46, 1–7. [Google Scholar] [CrossRef]
- Kirilenko, A.P.; Stepchenkova, S.O. Sochi 2014 Olympics on Twitter: Perspectives of hosts and guests. Tour. Manag. 2017, 63, 54–65. [Google Scholar] [CrossRef]
- Rocha, C.M.; Fink, J.S. Attitudes toward attending the 2016 Olympic Games and visiting Brazil after the games. Tour. Manag. Perspect. 2017, 22, 17–26. [Google Scholar] [CrossRef]
- Lee, Y.; Kim, I. Change and stability in shopping tourist destination networks: The case of Seoul in Korea. J. Destin. Mark. Manag. 2018, 9, 267–278. [Google Scholar] [CrossRef]
© 2018 by the authors. Licensee MDPI, Basel, Switzerland. This article is an open access article distributed under the terms and conditions of the Creative Commons Attribution (CC BY) license (http://creativecommons.org/licenses/by/4.0/).