1. Introduction
Nowadays, innovations and their successful implementation represent one of the key success factors that enable sustainable development of companies and countries, give resources to successful competition, and thus support the well-being of businesses, countries, and their populations. The link between business innovativeness and sustainability has been demonstrated in a number of scientific publications, where authors thoroughly investigate multidisciplinary and innovative methodologies for sustainable management in agriculture [
1], which help farmers to pursue more sustainable activities, develop a qualitative multi-criteria assessment tool for assessing innovative cropping systems [
2] or suggest indicators of sustainability [
3,
4]. These publications prove the positive impact of innovation on sustainability. The current situation in Lithuanian economy requires changes in the priorities: It is necessary to make a transition from the traditional production system focused on processing of raw materials, real estate and technical infrastructure economics to high value-added production and services in creative and sustainable processes. In the light of increasing cost factors of agricultural production, technological development and reducing numbers of working population, low-cost competition loses its meaning and impels to refocus on new sustainable business models. These types of situations concern the agricultural sector of Lithuania that is particularly affected by global competition. As a result, agricultural farms are adopting environmental sustainability innovations related to cutting back on energy, water and nondurable product consumption and minimizing waste and greenhouse gas emissions. A heavy burden falls on the farm management as they have to organise supervision of the production processes and at the same time to be innovative, to follow global technological development trends, and to adopt new approaches in order to withstand the increasing competition [
1]. Practice has demonstrated that only innovative farms can cope with market challenges and therefore farm innovativeness is becoming a very important characteristic in achieving at least satisfactory business results. An innovative farm is at least one step ahead, with less innovative farms falling behind in terms of their business results [
3]. Innovation stems directly from people’s knowledge, their willingness to pool it and to interpret it in their own unique way in the form of innovations. Lithuanian farms only are in the process of recognizing the advantages of reducing their environmental impact through new environmental policies and initiatives. An entrepreneur can be innovative, both through development of an innovative business (an unparalleled business idea), and improvement of business processes by exploiting most of new possibilities. Farms wishing to know their position in the ranking of a certain activity in terms of sustainable innovation need an instrument for measuring such innovation activities. Since no special method for assessment of farm sustainable innovativeness has yet been created, the search for the best methodology can be related to the use of some existing methods of assessment, improvement of some methods or development of an entirely new methodology for assessing farm sustainable innovativeness. The aim of this article is to develop a methodology for measuring farm innovativeness, which offers a possibility to rank farms according to this aspect.
2. Justification of the Need for Measuring Farm Sustainable Innovativeness
Under real-world conditions of economic globalisation and competitive business development, not only public administrations, but also business entities have to assess the existing situation in terms of innovation. However, in doing so, it is clearly not easy to make decisions on financing, staffing, and prioritisation of activities as the use of different criteria may result in a phenomenon being considered as favourable and positive or, on the contrary, even unacceptable. This is exactly the situation in measuring farm sustainable innovation, where a diversity of criteria could reflex the said phenomenon in more detail in order to produce more objective measurement results. Objectivity in measuring farm sustainable innovativeness is absolutely crucial and essential, since the results of such assessment would help public administrations to decide on financing of development projects [
5], perform their viability assessment [
6], and measure progress achieved, with the purpose of disseminating good practices [
5,
7].
Farmers are suppliers, who deliver their products to the end user or reseller. An innovative seller, who uses modern technologies and delivers a sustainable product, always tends to win more trust of farm product buyers. Smerecnik and Andersen [
8] have proven this proposition through an example of the situation in the US hotel and ski services. This phenomenon is undoubtedly inherent in other business sectors as well. Therefore, in order to choose a supplier, agricultural product buyers have to be able to measure innovativeness of farmer’s activity. When choosing a supplier, sustainable innovativeness is an important criterion of trust [
9]. The possibility of ranking farms according to the sustainable innovation criterion could allow for offering incentives to farms in the form of certain favourable terms or benefits for innovation leaders and would stimulate modest innovators to improve their innovation performance. In the modern competitive context, it may be useful for farms to know their relative position, in terms of innovation, with respect to other farms in the region/country in order to be more successful in promoting themselves and placing their production on the market in view of the fact the demand for eco-friendly products is increasingly growing. The issue of measuring farm sustainable innovativeness and their contribution to economic development represent one of the key aspects of economic theory. The diversity of proposed measuring methods and techniques can primarily be explained by the complexity of the problem. A considerable number of works has been dedicated to this problem; however, their analysis reveals certain shortcomings that can be explained by a lack of a deep quantitative analysis of the problem of intensification, rather than by arithmetical flaws. On the qualitative level, there is a clear understanding: Extensive growth is based on the expansion of the quantity of inputs, whereas intensive growth involves increased effectiveness. In practice, however, they are complimentary to each other and therefore they should be seen in an integrated way.
Therefore, due to the absence of a single summative indicator that would embrace all aspects of innovativeness and allow for assessing this phenomenon in a comprehensive manner, measuring farm sustainable innovativeness can be attributed to the category of multi-criteria tasks. Objective decisions regarding farm innovation levels can be achieved by using a set of assessment criteria, rather than a single one, i.e., the criteria should reflect the specificities of the farm operations and production, as well as different market situations [
10,
11]. Despite the evidence on the direct impact of farm innovation on business success, there has been very little research undertaken and the methodological potential for measuring farm innovativeness is very low. Literature on the subject describes innovativeness measuring methods that are either based on a single criterion with a focus on the selection of such criterion or dedicated to measuring innovativeness in a certain business sector other than agriculture. Typically, researchers measure innovativeness of people employed in a certain industry or the processes of innovative enterprise development opportunities and do not suggest an objective methodology for sustainable innovation quantification.
Mostly scientists address different assessment aspects in the fields of industrial production [
11,
12,
13], and construction technologies [
13,
14,
15]. It is difficult to see why, but in this respect, agribusiness is placed at a disadvantage: There is no targeted methodology or universal methods for measuring innovativeness that could be adapted for this specific business sector. The practical relevance of the discussed problem led to our decision to undertake research in this field.
Since measuring farms sustainable innovativeness is a purely voluntary choice, the first obvious task was to interview farms about their willingness and possibilities to participate in the assessment. Such assessments could include not only public agricultural organisations, but also private-owned farms that would have a possibility to find out their relative position, in terms of innovation or sustainability, with respect to other farms in their particular field in order to promote their innovative achievements that could represent the good quality of their products. It is understood that high quality is the key factor influencing customers’ purchasing decisions. Measuring farm sustainable innovativeness should use relative economic indicators and therefore no commercial secrets can be potentially disclosed by the evaluators. Such circumstances could act as a positive stimulus for the farms to decide to take part in the assessment. Farm sustainable innovation is a dynamic process as in the light of the conditions of tough competition farm management have to adopt innovative approaches in order to maintain or improve the quality of their products and to stand their ground. The assessment methodology should be based on interviews of the managing teams, who are aware of the existing farm situation along the lines of uptake of innovative solutions. Alternatively, farm sustainable innovativeness could be measured in agricultural enterprises in a certain agricultural sector in order to identify the most innovative players of the sector with the purpose of offering them incentives or giving them suitable publicity with a view to stimulating competition. Therefore, the interviewed farms should point out their priority lines of business where they would be able to justify their innovative operations and the fields of activity where it would be appropriate to look for innovative solutions in order to achieve better sustainable performance. The above arguments should be explained to farm managements to help them cope with the competitive environment.
3. Sustainable Innovativeness Assessment Model
The subject of the research is farms in the agricultural sector. The adequacy of the farm sustainable innovativeness measurement depends on a number of different factors. Some of them are directly related to the specificities of the business, some to the enterprise, and some to the consumer, staff and other external factors. As stated above, an objective assessment of farm sustainable innovativeness is only possible when the measuring takes into consideration different aspects and is performed in an integrated way using a set of assessment criteria. The need for comparison of farm innovation suggests treating a search for this solution as a multi-criteria measurement task. There are examples of similar suggestions described in scientific literature. For example, some authors [
16] proponents of multi-criteria methods for maintenance performance measurement, criticise decision-making following on from the results of measurements based on a single largest financial criterion [
12,
17]. Researchers in some publications also agree that multi-criteria methods in assessment of construction projects produce a more objective result [
3,
4,
13,
18]. The multi-criteria farm sustainable innovativeness measurement model proposed by us (
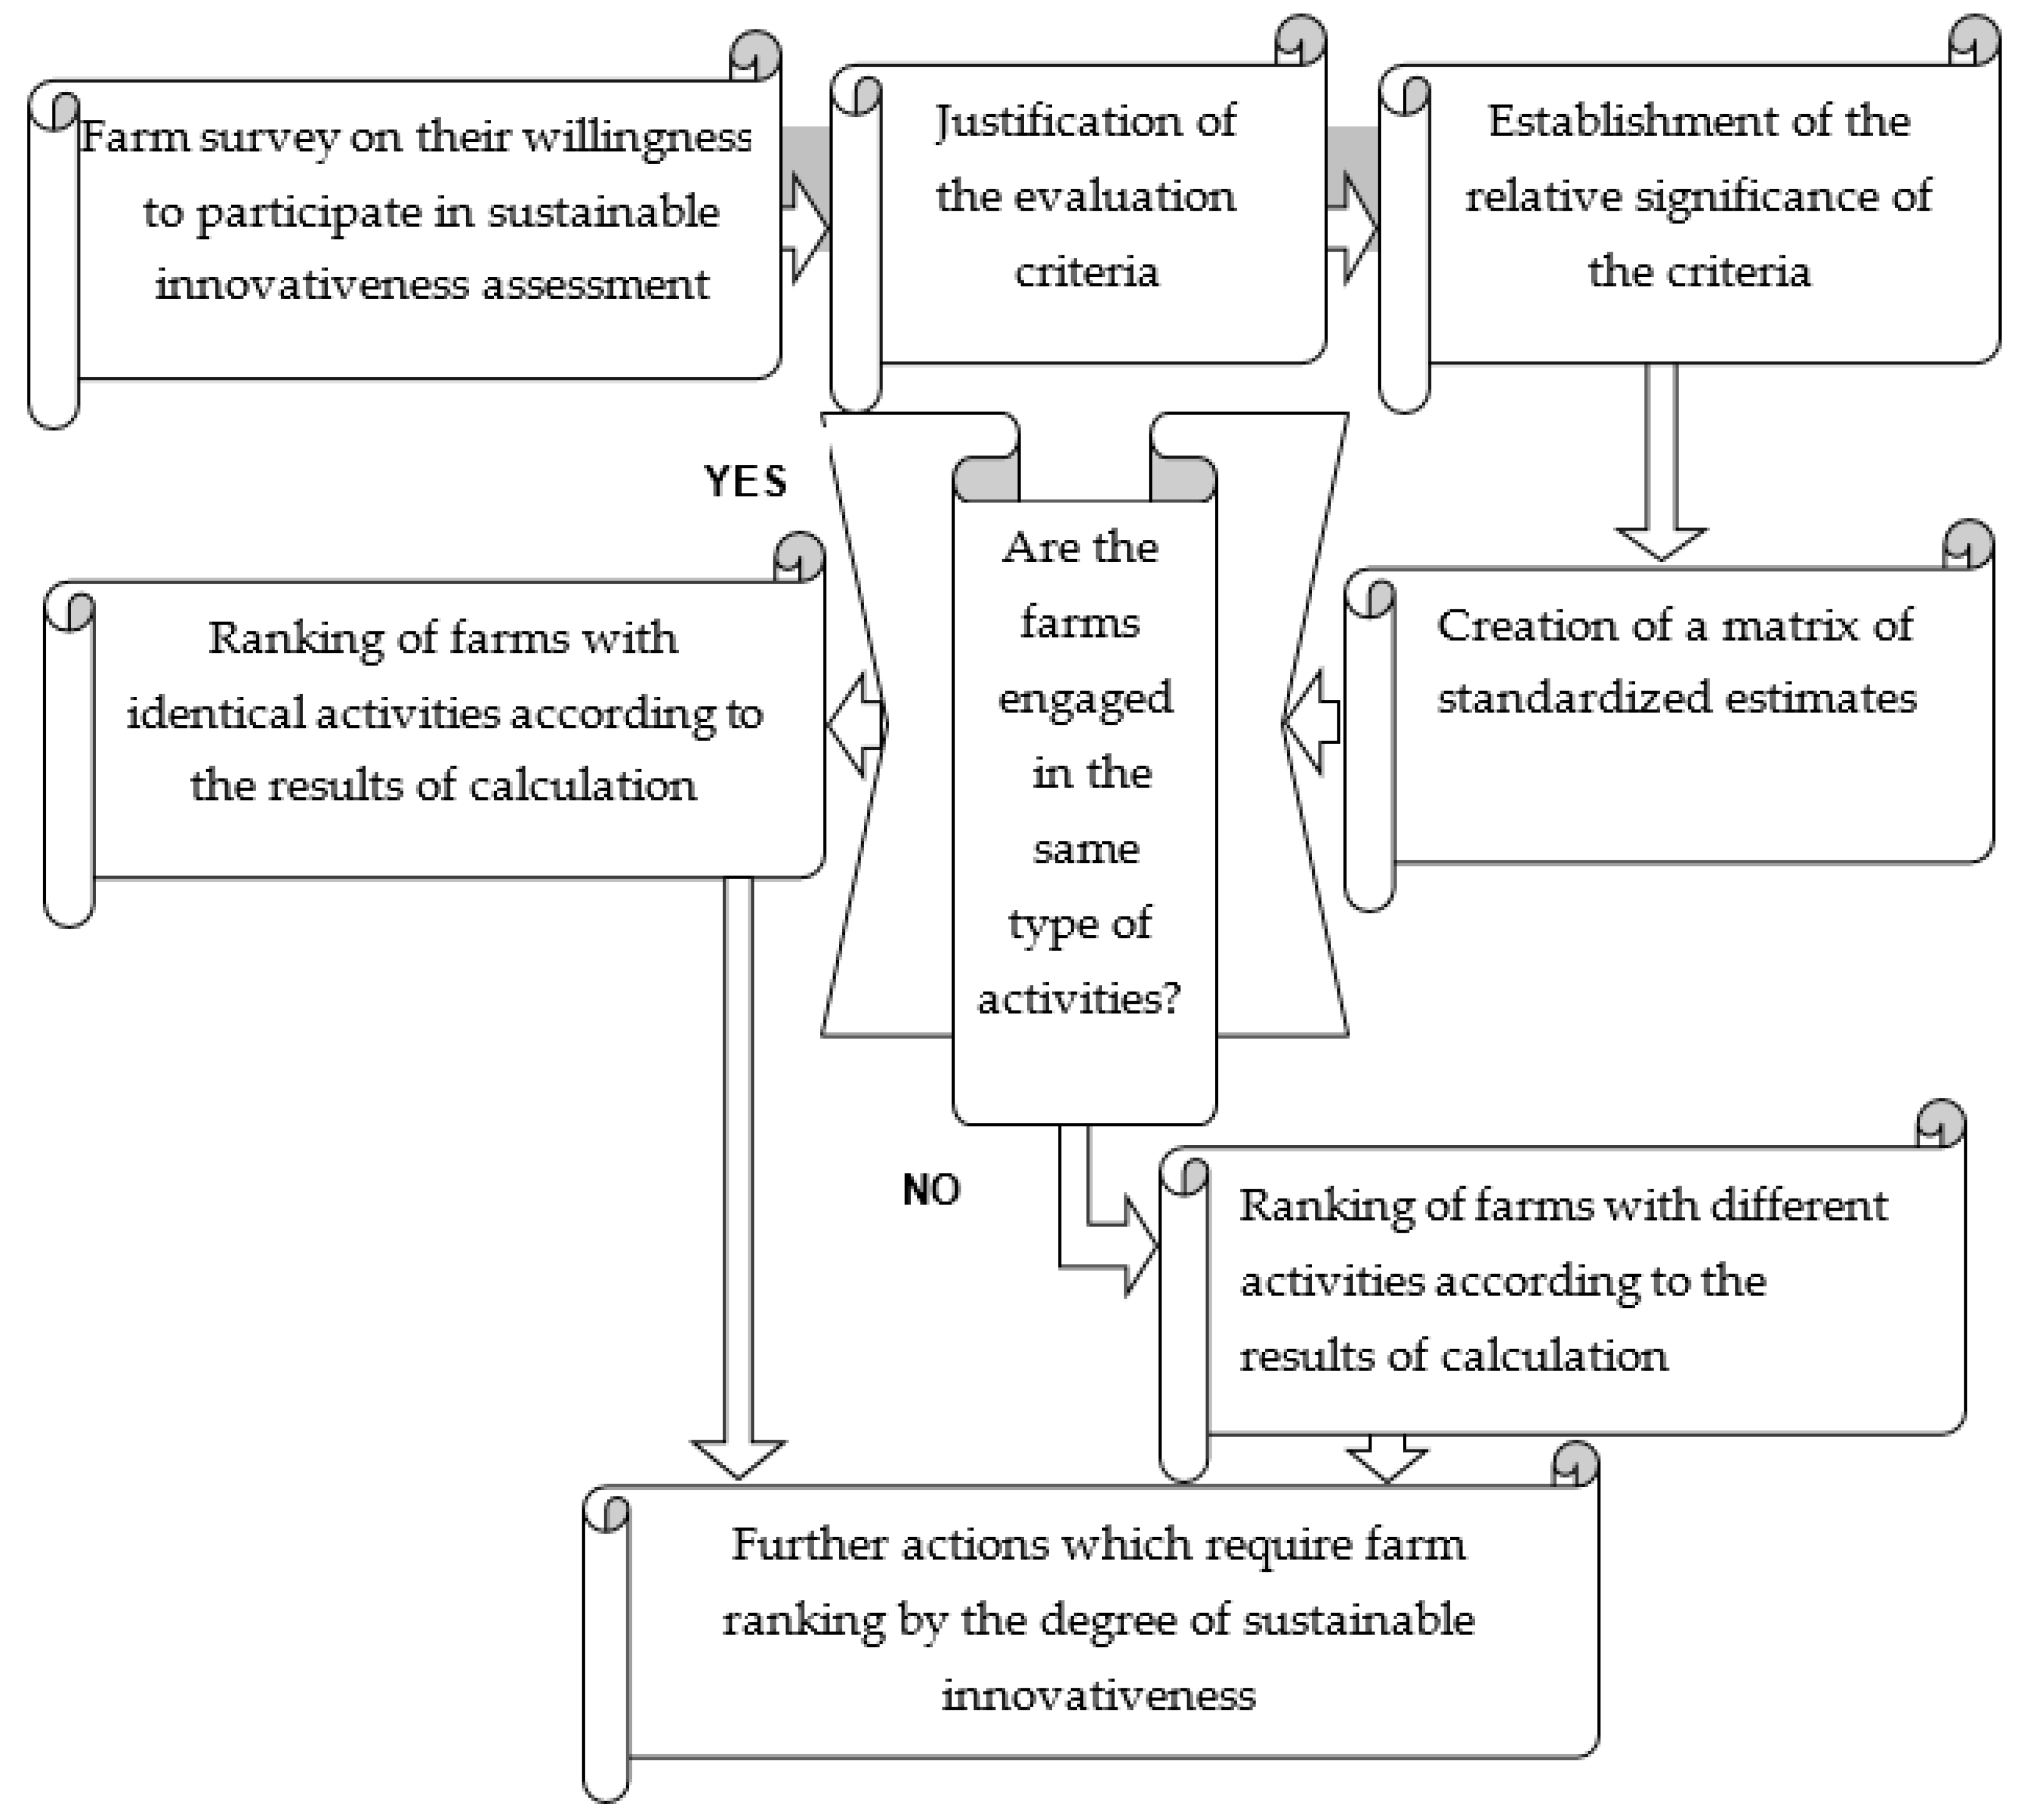
Figure 1) is based on the method of complex proportional assessment (COPRAS) suggested by authors, who proved the relevance of this method in assessing social phenomena [
18]. But why is this method recognised as the best?
The method meets the requirements for innovativeness assessment and it’s easy to use; this is important for farmers who want to evaluate sustainable innovation of their economy and to compare it with other farms. This method provides for using uncomplicated statistical computer programs (Excel, Statistica, SPSS, 9o and others) that are often already used in many farms in Lithuania for different applications including resource accounting.
The advantages of this method lie in the possibility to use both maximizing indicators (where a better result is expressed through a higher value) and minimizing indicators. Measuring innovation in agriculture involves both aforesaid groups of indicators. That allows to select more objective and more relevant criteria for assessment.
Furthermore, this method provides for the establishment of the importance of the criteria, which is particularly important in assessing any phenomena in agriculture, where it is necessary to deal with criteria of different importance.
Below is a description of required procedures provided for in the components of this model and model validation.
3.1. Farm Survey on Participation in Innovation Assessment
In measuring innovativeness, the first task is to make a list of farms that would agree to participate in the assessment. That is a challenging and time-consuming exercise, since the evaluators have to explain farm managers what the benefits of the assessment are and how its results can be used, and to guarantee and reassure them that no provided information will be used for any purposes that might cause commercial damage. Therefore, surveys of farm management are appropriate. The selection of farms usually depends on the measurement objective. For instance, the shortlist for an interview may include agricultural enterprises engaged in a certain business area, producers of identical products or agricultural research institutes, i.e., in order to identify the most sustainable innovative organisations, the choices are based on areas of business or type of the business product. Alternatively, the interview can involve enterprises willing to participate in the assessment without setting specific objectives. If so, this component should be added to the COPRAS model.
Since most modern farms are engaged in several commercial potentially innovative activities, and produce more than one product, the interviewed should consider their activities and identify priority areas where, according to the farms, they have achieved the best results reflecting high performance. Therefore, it would be appropriate to establish a questionnaire that farm management could use to assess their operations from the innovation perspective on, for example, a scale of 10. Maximum (or close to maximum) estimates in a certain area would be a clear indication of the willingness and determination of the farm management to participate in such innovation assessment. On the other hand, low scores would refer to the need for improvements in certain areas and the farm’s unwillingness to participate in the sustainable innovation assessment.
3.2. Justification of the Evaluation Criteria
The task of the selection of evaluation criteria is one of great responsibility and not an easy one. As a general rule, assessment methodologies give special attention and priority to this element of the assessment process. The validity of the assessment depends on the criteria applied. A broad range of assessment criteria ensures a more comprehensive and detailed assessment. The criteria for measuring farm sustainable innovativeness should be appropriate to the specific characteristics of an agricultural enterprise and the content of its activity. Selected criteria should express innovativeness as a specific trait of the farmers. Authors of some works suggest grouping the criteria [
3,
16]. For instance, some authors analyse service operational effectiveness and suggest classifying assessment criteria into general criteria describing future prospects and special criteria used only to address the working conditions of the staff [
16,
17]. They even agree with other researchers that it is appropriate to distinguish service operation criteria, which make it possible to measure both external and internal changes after a new technology is introduced. However, classification is appropriate if there are a huge number of criteria where their importance can be determined using group significance calculations in order to simplify and speed up the calculation process. On the other hand, determination of the importance of the criteria for a group of essentially similar criteria undermines the objectivity of the assessment. Therefore, measuring farm innovativeness should be based on an optimal set of criteria, which should not be classified in order to achieve a more objective assessment result. According to some researchers [
19,
20], to achieve objective assessment, the optimal number of criteria should be ten to fifteen (a smaller number would reduce the objectivity of the assessment, while the ceiling is established, because above it the assessment would become too complicated). Hence, this provision has to be complied in order to obtain objective results of the assessment.
It has already been mentioned that criteria selection is the main issue in assessing any phenomena. With respect of measuring farms innovativeness, some explorers claim that innovation is highly affected by corporate culture [
21,
22]. In their research, the authors emphasise the impact of corporate culture on the innovativeness of agricultural enterprises and claim that one of the indirect criteria of innovation could be the level of corporate culture. The said authors claim that one of the indicators of culture in an agricultural enterprise is their interest in innovation. In the area of agriculture, the main sources of sustainable innovation knowledge are printed media and the Internet. The indicators describing innovativeness of people or organisations are expressed as a number of new ideas over a certain period of time and a number of realised ideas over the same period of time [
19,
23]. It is obvious that innovative people often see not only existing, but also potential operational problems and offer ideas how to tackle them. They seek to improve the quality of the product of the operations or to increase the production volumes through realisation of their ideas. Furthermore, the number of the emerging ideas reflects the creativity level of an organisation or an individual person. Staff creativity, as a part of the innovative potential of an enterprise, represents the key competitive advantage and in many instances leads to innovative solutions in the organisation [
23]. Introduction of new products should take into consideration the ability of the enterprise in this regard. Creativity is characterised as the ability to take interest and reveal new phenomena and to find new ways of expression or approaches to a problem. The humanistic approach in psychology defines creativity as personality dispersion expressed by self-actualisation and self-expression [
24]. The more ideas people have, the more creative they are, so to say, creative people do not complain of a lack of ideas. There can be different sources of ideas, some of them described below (e.g., exhibitions, media, etc.), and it is understood that creativity is one of the components of sustainable innovation. The existence of ideas (even if they have not been implemented yet) clearly demonstrates the level of sustainable innovativeness. Ideas can be realised through project activity and therefore assessment of farm innovativeness should also take this aspect into consideration. Projects activity aimed at increasing farm sustainability is another possibility to realise ideas [
21,
25] and therefore the number of projects a farm is involved in should also be among innovation measurement criteria.
Given that sustainable innovation includes organisational, economic, productive, product or service aspects, to measure business activity from such innovation perspective, it is not sufficient to analyse financial statements for the last accounting period, which reflect innovation-related processes. Each number has to be analysed in a certain context and compared to others. Different benchmark values describing various aspects of sustainable operations can be calculated from the key indicators reflected in the financial statements. Irrespective of where relative valuation is used, in many cases relative indicators have clear advantages over absolute indicators. This analysis plays a useful role, since a number or value cannot be obvious or significant until it is compared to another number. Consequently, a ratio resulting from a comparison of two values is much more obvious than an absolute value [
26]. To that end, sustainable innovation could be expressed by the farm input ratio to proceeds from selling eco-friendly products. Ideally, each business seeks to cut expenditure and increase revenues. Definitely, reducing costs without a decline in the quality of the provided services or products is a difficult task; hence the best result can only be achieved by the most efficient innovative agricultural organisations.
Innovations can also be expressed by the number of staff required to complete a certain task [
24,
27,
28]. A lower number evidences a higher level of innovation, since innovative methods enable to perform tasks faster and to achieve potentially better quality. Other economic indicators showing the level of sustainable innovation should also be used in relative terms. When it is known which key financial ratio indicators show an improvement or a negative development, one can go into financial statements to examine the reasons for such changes [
29].
As for organisational sustainable innovation, it can also take the form of cooperation with other business entities in pursuit of a common objective. Notably, an important constituent of sustainable innovation is staff innovativeness. People are considered to be innovative if they introduce innovation in their work. Speaking of agricultural organisations, the management of innovative farms are interested in promoting sustainable innovation and use of computerised management systems that help deliver decisions in a more efficient way; they are active participants of agricultural fairs and conferences in order to gain more knowledge in the area of their concern. Furthermore, innovative instruments aimed at business intensification potentially result in a more efficient use of working time. More efficient work saves free time, when people can take up their hobbies and do things they like. As a matter of fact, the possibility of having free time is a topical issue for agricultural employees. The ability to use internet information shows the potential interest of farm workers in innovating [
28]. Not all rural residents of Lithuania use the Internet, while Internet penetration in urban areas comes up to 90%. Another indication of the sustainable innovativeness of business or public organisations could be the employees’ desire to learn and to grow. It is appropriate to express such indicator as the time spent in education institutions by the staff of an organisation. Individuals have to think out of the box to be open to new ideas for sustainability. As a general rule, young people make radical decision more easily [
30], therefore age would be another indicator of sustainable innovation. It appears that the age of employees has a direct impact on the numbers of innovative ideas for improvement of the performance of their organisation [
30,
31]. It is obvious that the age of the employees should also be addressed by the survey. Given these points, it is appropriate to suggest evaluation criteria that make it possible to achieve an acceptable expression of the farm sustainable innovativeness assessment results:
Number of ideas for improvement of farm performance sustainability over the last two years. This number includes ideas focused on better performance suggested and discussed not only by the management, but by all farm employees. Those can be ideas for both minor and global organisational or technical improvements in activities towards better sustainability.
Number of realised ideas for improvement of the performance sustainability. This number includes ideas suggested not only by the management, but by all farm employees that have already been implemented in the last two years. Those can be ideas for both minor and global organisational or technical improvements in towards for better sustainability of farm activity.
Average time spent by the employees on the Internet in the winter season for the purposes of development/improvement (personal development, improvement of business performance sustainability, etc.). The reason for choosing the winter season is that during that time agricultural employees directly involved in farming are relatively less occupied with the production activity and thus they have more free time.
Number of projects over the last two years. This means the number of the projects (some activities with other institutions) related to increasing the sustainability of the farm business performance.
Most popular agriculture publications the respondents read. This information offers insights into the staff development possibilities and their willingness to do so. Reference should be made to 6–7 main publications (including Sustainability), with a possibility to add some.
Number of computerised systems for farm management used in farm business.
Participation of all farm employees in professional development workshops/visits outside the farm over the last two years (number).
Participation in experiments, directed at energy saving, saving of raw materials or using environmentally friendly raw materials in the production over the last two years (number).
Eco-friendly (or ecological) product sales in 2017 to the number of employee ratio [
32]:
where
P is such product sales in 2017 (EUR) and
E is the number of people employed on the farm in 2017.
Average age of farm employees.
Eco-friendly/ecological production cost (EUR) ratio to the volume of marketed production [
32]:
where
C is eco-friendly/ecological production cost (investment) in 2017 (EUR) and
P is product sales in 2016 (EUR).
As can be seen from the above, the number of criteria and their content fully comply with the previously mentioned requirements.
3.3. Establishment of the Relative Importance of the Criteria
An expert method is proposed for the establishment of the relative importance of the criteria. The establishment of the criteria significance is one of the main elements in the assessment, since typically criteria are not equally important for the final decision and the possibility to quantify the importance of the criteria boosts the objectivity of the assessment.
It is proposed to use a scale of 100 points, where total estimates are calculated as follows:
where
Wie is an estimate of the
ith criterion by the
eth expert;
n is the number of experts;
Wi is the sum of all
i criterion estimates by all experts.
The equation below is used to establish the relative importance of the criteria:
In this case the sum of criteria importance will always equal one:
If the result is different, there must be a calculation error.
3.4. Creation of a Matrix of Standardised Values
The criteria of the proposed set are expressed in different dimensions. In order to be able to compare the calculated criteria, they are normalised, i.e., converted into a non-dimensional form that is appropriate for comparison purposes [
18].
where
xij is innovation estimate
j according to criterion
i;
m is the number of criteria;
is the importance of criterion
i;
n is the number of compared farms.
The sums (
S) of normalised estimates for each innovation description (
j) according to maximizing (the higher the value the better the option) and minimizing (the lower the value the better the option) criteria are calculated as follows:
The relative significance of each innovation under investigation is determined with regard to minimizing and maximizing sums of normalised criteria values using the following equation [
18]:
The investigated options of farm innovativeness are ranked according to the relative importance index
values. For the convenience of decision-makers, it is recommended to reflect the calculation results in the form presented in
Table 1.
To make calculations easier, it is appropriate to use the data in
Table 1 in order to calculate separately the denominator, numerator, quotient, and sum in Equation (9), and thus to arrive at the relative importance that denotes the farm sustainable innovativeness level and allows a comparison of farm performance in terms of such innovation.
The assessment results can show not only innovation levels in farms engaged in different activities, considering that those are the farms that take part in the assessment, but also allow a comparison of farms on the same list in a certain agricultural sector according to the degree of innovation.
The calculated relative importance index of farm innovativeness Q can be used to rank the farms according to the scope of innovative processes in their commercial activity. Depending on the measurement objective, the farms can be ranked using two different approaches: According to either one activity of the agricultural sector or the degree of innovativeness in farms engaged in different activities, without taking into consideration the nature of their business.
4. Practical Evaluation of the Innovation Level in Lithuanian Experimental Farms Following the Proposed Methodology
Fifteen Lithuanian state experimental farms were identified as the subject of the assessment. The farm managements were given questionnaires and were asked to evaluate their possibilities to participate in the sustainable innovation assessment and to point out their priority lines of their business on a scale of 10. According to the questionnaires, the Lithuanian state experimental farms listed below agreed to participate in the sustainable innovation assessment. They gave 9–10 points to the innovation level in their priority activities:
AB Kiaulių veislininkystė (pig breeding company);
VšĮ LSMU praktinio mokymo ir bandymų centras (centre for practical training and testing of the Lithuanian University of Health Sciences);
UAB Šilutės veislininkystė (breeding company);
UAB Dotnuvos eksperimentinis ūkis (experimental farm);
UAB Šeduvos avininkystė (sheep breeding company);
UAB Upytės eksperimentinis ūkis (experimental farm);
VšĮ ASU mokomasis ūkis (A. Stulginskis University training farm);
UAB Lietuvos žirgynas (stud farm).
Estimates of criteria importance are provided in
Table 2. Equation (3) is used to calculate total estimates by the experts, and Equation (4) is used to calculate the relative importance of the criteria. The estimates of different innovation descriptions are converted into non-dimensional values using Equation (6), while the sums of normalised estimates are calculated according to Equations (7) and (8).
The determination of the criteria importance was performed by agricultural experts representing different sectors:
(E1), Chief Project Management Specialist of Innovation Development Department, Lithuanian Centre of Agriculture Advisory Service;
(E2), Establishment of criteria importance Head of the Innovation Development Department, Lithuanian Ministry of Agriculture;
(E3), Head of the Statistical Department, Lithuanian Centre of Agriculture Advisory Service;
(E4), Deputy Director for Experimental Development of Lithuanian Research Centre for Agriculture and Forestry;
(E5), Head of Communication and Project Management Group, Lithuanian Ministry of Agriculture;
(E6), Professor, Aleksandras Stulginskis University.
The estimates of the relative significance of the criteria are used to calculate the final innovativeness values according to Equation (9).
In order to come up with indicators pertaining to the innovativeness level, a questionnaire was sent to the managing teams of the farms and required calculation were made.
The final calculation of farm innovation indicators according to Equation (9) is presented in
Table 3.
The obtained results show that the most innovative among Lithuanian experimental farms are UAB Šilutės veislininkystė and AB Kiaulių veislininkystė with a minor difference in their relative importance index values. The assessment used COPRAS method, which provides for the combined use of maximizing and minimizing indicators, and thus demonstrates that the result of the farm innovativeness assessment depends on the different levels of the assessment criteria importance. In the present case, the assessment was conducted in experimental farms with disparate nature of agricultural activities. The most sustainable innovative farms will be able to spread their best innovation practice and will pave the way for achieving better results in the area of agriculture.
5. Conclusions
The article explains potential different objectives of farm innovativeness measurement and justifies the multi-criteria nature of the innovation assessment. Accordingly, the developed assessment methodology is based on COPRAS method, which allows the assessment to use both maximizing and minimizing indicators that are very common in the area of agriculture. The standard COPRAS method has been improved by adding one more component, the content of which requires a survey of farmers for their willingness to participate in the assessment. The typical assessment criteria were chosen according to the characteristics of farmers related to implementing sustainable innovations.
The assessment methodology was expressed through the farm innovativeness assessment model. The suggested farm innovativeness assessment model represents a flexible system which enables, depending on the measurement objective, to assess farms engaged in the same type of activities or farms with different activities and to rank them according to the relative index of innovativeness. The article provides a justification for the objectives of sustainable innovativeness measuring in farms engaged in either the same or different activities. The model includes the following components: Farm survey on their willingness and possibilities to participate in innovation assessment, justification of the evaluation criteria, establishment of the relative importance of the criteria, creation of a matrix of standardised estimates, ranking of farms according to the results of calculation depending on the measurement objective (the farms included into the assessment can be engaged in the same or different types of business), and further actions where farm ranking by the degree of sustainable innovation is needed.
The developed farm sustainable innovativeness measurement model was tested in practice. Eight Lithuanian experimental farms involved in different agricultural activities agreed to participate in the innovativeness assessment. The proposed model was used to rank the farms according to the degree of innovation in their business. The final result refuted the opinion that farm innovativeness depends only on the possibilities to invest in a certain area. Indeed, staff creativity and the position of the management regarding certain areas of business make an essential contribution to the sustainable innovation levels in the organisation. In order to achieve a more objective sustainable innovativeness assessment result, it is appropriate to use both economic and organisational indicators.
It is fair to say, however, that a larger sample size of our study could have generated more accurate results. In the meantime, we analysed only state experimental farms to demonstrate the applicability of the methodology.


