Evaluation of Physical and Chemical Properties of South African Waste Foundry Sand (WFS) for Concrete Use


1
Department of Civil Engineering Technology, School of Civil Engineering and the Built Environment, Faculty of Engineering and the Built Environment, University of Johannesburg, P.O. Box 524, Auckland Park, Johannesburg 2006, South Africa
2
Department of Town and Regional Planning, School of Civil Engineering and the Built Environment, Faculty of Engineering and the Built Environment, University of Johannesburg, P.O. Box 524, Auckland Park, Johannesburg 2006, South Africa
*
Authors to whom correspondence should be addressed.
Sustainability 2019, 11(1), 193; https://doi.org/10.3390/su11010193
Submission received: 5 December 2018
/
Revised: 20 December 2018
/
Accepted: 22 December 2018
/
Published: 2 January 2019
(This article belongs to the Special Issue Sustainable Construction Materials)
Abstract
:The foundry industry in South Africa forms one of the greatest industries in the manufacturing sector. It produces waste foundry sand (WFS) that ends up in landfill sites. Around 80% of the WFS could be utilized as a substitute for sand in concrete. The utilization of WFS will benefit the industry, as raw materials (natural sand alternative) and energy are conserved, while costs of disposal are lowered. Soil pollution, as well as water and air resources, will be minimized and the foundries’ competitiveness will be improved. In this study, the physical and chemical properties of five WFSs (two clays and three chemically bonded molding sands) from Gauteng, South Africa were analyzed. The samples were investigated with a view to determine their conformity with applicable engineering criteria when used as a replacement, to various extents, of the fine aggregate. The main properties investigated included physical properties (particle gradation, moisture content, un-compacted bulk density, specific gravity, loss on ignition, clay content, and fineness modulus) and the chemical properties (X-ray fluorescence (XRF), X-ray diffraction (XRD), scanning electron microscopy/energy-dispersive X-ray spectroscopy (SEM/EDS), pH). The sands generally did not meet the standards pertaining to grading requirements. However, the chemical test results showed the composition of these sands to be comparable with results from other investigations and suitable for use as a natural sand replacement in concrete.
1. Introduction
Waste foundry sand (WFS) is a high-quality uniformly sized silica sand, which is used by foundries as part of metal casting and molding processes. The main metals that are cast comprise ferrous (steel and iron), and non-ferrous (brass, bronze, aluminum, and copper) metals. The chemical and physical characteristics of WFS rely heavily on the molding process types and the industry sector from which it emanates [1]. Foundry industries effectively reprocess and reuse the waste sand several times. Once it can no longer be used again, it is discarded from the cycle as a by-product in landfills. The voluminous discard as a result of the large amount of foundry sand produced worldwide created a serious waste management problem. In the United States (US), 3000 metal casting foundries generate six to 10 million metric tons of WFS each year, whereas only 10–15% is reused rather than landfilled [2].
According to the Department of Environmental Affairs, South African Waste Information Center, more than one million tons of hazardous waste went to South Africa’s 133 landfill sites in 2017 [3]. In South Africa, the foundry industry forms one of the core industries in the manufacturing sector. According to the South African Institute of Foundry men (SAIF), South Africa has a total of 170 foundry production plants [4], which produce an annual production of 430,000 metric tons per annum [5]. Geographically, 114 (66%) of the foundry production plants are situated in Gauteng, 27 in KwaZulu-Natal, 14 in Cape Town, and eight in the Eastern Cape. The foundries in Gauteng alone contribute 34.7% of the gross domestic product (GDP) in South Africa. Around 3000 tons of WFS is discarded annually by a single foundry in Gauteng, totaling 342,000 tons being discarded annually in Gauteng alone [4].
The foundry industry in South Africa is confronted with environmental constraints from a waste management aspect, as WFS is classified as hazardous waste according to the minimum requirements for the handling, classification, and disposal of hazardous waste (commencement of Chapter 4, Part 8: Sections 35–41 of the National Environmental Management: Waste Act 59 of 2008) [6]. South Africa is applying the leaching test, toxicity characteristic leaching procedure (TCLP); however, the problem is that, apart from the assessments between foundry sand and soil as reported by the international standards, South African WFS includes the elements Al, Fe, and Mn, which are vastly abundant in natural soils and are very significant since these elements produce oxides. Under the acidic conditions of the TCLP test, these macro elements would leach from inorganic materials [7]. However, the US, among other countries, declassified foundry sand as a hazardous material rendering it suitable as a natural sand alternative.
The results of the risk-assessment study examining the environmental effects of WFS conducted by the US Environmental Protection Authority (US EPA) revealed that there are some applications that will not imperil human health and may produce some environmental benefits [8]. The relevant risk assessment was conducted in a virgin garden soil, which revealed that the concentrations of metal in foundry sand were comparable to the concentrations found in natural soil [9]. However, recent studies established that WFS retains metal and carbon-based concentrations comparable to those which originate in normal soils and are at the low end of the range measured in agricultural soils [10,11]. Studies show that the WFS has a low metal-leaching potential, under the stated test conditions, and generally comprised test metals such as As, Ba, Cr, and Cu which were well below the test acceptable values [12]. However, in South Africa, a study conducted revealed that WFS should be considered as inert, rather than low-risk waste [7]. The evaluation, driven by risk-screening models and conservative assumptions, shows that the silica-based WFS from aluminum, steel, and iron foundries evaluated does not pose hazards of concern to ecological receptors or human health when used in manufactured soils [13].
Since the ferrous and non-ferrous foundries in Gauteng produce a voluminous quantity of WFS, there is a concern over the existing landfill sites which are also under pressure due to reducing life span on the account of ever-increasing waste generated annually [4]. Hence, most foundries in Gauteng have onsite private landfills because the current practice of disposal of WFS in municipal landfills is resulting in a depletion of available space and, hence, poses a financial problem for municipalities and the foundries due to the concomitant rapid increase in disposal costs and the stricter regulations from the municipalities. In South Africa, the average landfilling tipping fees of foundry by-products due to space shortages are about US $34 per ton inclusive of storage, transportation, and labor cost, while, in the United Kingdom, it is about US $4.3 [14].
With an end goal to lessen disposal costs in waste handling and environmental challenges, make best use of the life span of landfills, reduce ecological effects related with the natural sand mining, and address the waste stream issues through innovation options [15,16], the chemical and the physical properties of WFS must be understood. According to previous studies, WFS grain size distribution is unvarying, with 85–95% of the material between the 0.6 mm to 0.150 mm size range, and about 5% to 20% of WFS can be finer than 0.075 mm [17]. A past investigation, on 39 spent foundry sands, indicated that the dominant size portion ranged from 0.05 to 2 mm, constituting 76.6% to 100% (with a median of 90.3%) of the sand. The specific gravity of the WFS ranged between 2.39 and 2.79. WFS is non-plastic and has a low water absorption limit [18], when compared to natural sand. A few other researchers established that the suitability and WFS workability in flowable fill lies upon its physical properties such as specific gravity, density, particle gradation, fine contents, and absorption [19].
Others reported that the ranges that exist in the specific gravity (2.38–2.72), bulk density (1052–1554 kg/m3), and absorption (0.38–4.15%) mostly rest on the grain shapes, particle gradation, fine contents, and sand mineralogy [20]. A few researchers reported that the chemical composition of WFS relies on the type of metal and type of binder utilized, due to its rich silica content [21]. Its pH was reported as varying between 4 and 8, dependent on the type of binder and type of metal cast. This is because it is coated with a burnt carbon thin film, residual binder (resins/chemicals, sea coal, and bentonite), and dust [22]. Previous studies stated that some waste sand could be corrosive to metals [23]. In addition, the presence of phenols in foundry sand raises worries that the infiltration of precipitation over stockpiles might accumulate leachable segments, resulting in the releases of phenol into ground or surface water supplies. WFS stockpiles and origins must be examined to evaluate the need to establish control over potential phenol discharges [22,24,25].
As measured by the low Micro-Deval abrasion [26] and magnesium sulfate soundness loss test [27], WFS has good durability properties. An attrition test, known as the Micro-Deval abrasion test, involves the fine aggregate specimen being positioned in a jar of stainless steel with steel bearings and water alternated for 15 min at 100 rpm. The percentage loss was determined to relate excellently with the other physical properties and the magnesium sulfate soundness. Investigation indicated great loss of soundness [28], which might be attributed to the specimen’s sand loss bound and not an individual sand particle breakdown. The shearing resistance angle (similarly referred to as friction angle) of WFS ranges between 33 and 40 degrees and has higher results and durability properties of <2, similar to that of natural sands.
A number of the researchers also informed the potential utilization of WFS in different civil engineering applications, refractory mortars [29], bricks, blocks, and paving stones [30,31,32], highway [33,34], low-strength material control [35,36], the geotechnical field [20,37], hot-mix asphalt, asphalt concrete [38,39], and ceramic materials [40,41].
For any construction work, it is essential that the construction materials to be utilized meet the minimum required standards and criteria. Whether it is a general construction application or the specific development of construction products, such as in low-cost housing, it is required that the materials meet the required standard quality and specifications. This paper highlights in depth seven physical and four chemical properties of WFS to determine its suitability for use in concrete as a partial replacement to conventional sand. The physical properties include sieve analysis, hydrometer analysis, moisture content, uncompacted bulk density, specific gravity, fineness modulus (FM), and loss of ignition (LOI). The chemical properties include X-ray fluorescence (XRF), X-ray diffraction (XRD), scanning electron microscope (SEM) and energy-dispersive X-ray spectrometry (EDS) Analysis, and pH methods. The paper uniquely brings in a comprehensive assessment of these eleven tests to provide an understanding of the application of WFS for concrete use.
Aimed at this purpose, the physical properties and chemical composition of WFS must be understood. The particle size grading, strength, water requirement, absorption, and specific gravity are amongst the most significant material characteristics for concrete quality. Hence, the effect of the extent of natural sand replacement in concrete with WFS on the properties of concrete requires further investigation. Foundry industries work with ferrous metals (steel, iron, and stainless steel) and non-ferrous metals (aluminum, brass, and bronze). In the present study, the suitability of South African WFS from ferrous metals, specifically the clay-bonded (green sand) and the chemically bonded molding sand, for use in concrete, was assessed.
2. Materials and Methods
2.1. Materials
WFS samples were collected from five foundry sites in the Gauteng Province, South Africa. These comprised two clay-bonded systems (green sand) which were collected from the Isando Foundry and Guestro Casting and Machining (respectively referred to as samples WFS01 and WFS03), and three from chemically bonded systems from Forbes Bros. Founders, Johannesburg Foundry (rebranded as Sinvac casting) and Thomas Foundry (respectively referred to as samples WFS02, WFS04, and WFS05), as shown in Table 1. The samples collected had a mass of approximately 10 kg each; the laboratory methods utilized to assess the chemical and physical properties of the material are discussed below.
2.2. Methods
The methods used for evaluation of physical and chemical properties of WFS are discussed in this section.
2.2.1. Physical Properties
Seven methods for the evaluation of physical properties were used as follows:
- Sieve Analysis: The sieve analysis, fine content, and dust content of aggregate were conducted on the portion of the sample larger than 0.425 mm, in accordance with South African National Standards (SANS) 201:2008 [42].
- Hydrometer Analysis: This is the most generally utilized method for the analysis of the grain size distribution of the fine-grained fraction of a soil, using the calculation of sedimentation principles. In this study, hydrometer analyses were conducted (in accordance with the TMH1 1986 method) on the five WFS (two clay sands and three chemically bonded molding sands), using dispersing agents. Calgon 33:7 (comprising 17 g of sodium carbonate and 33 g of sodium hexametaphosphate when mixed in one liter of water) [43].
- Moisture Content: The moisture content determination by oven-drying of the five WFS used in this study was determined in accordance with SANS 3001-GR20:2010 [44]. The moisture state of WFS is significant as it affects the overall water content of the mix, in turn affecting workability and strength.
- Uncompacted Bulk Density: SANS 5845:2006 [45] was used to determine the uncompacted bulk densities of the five WFS.
- Specific Gravity: The specific gravity of the solids is the proportion of the weight of a unit volume of a solid soil to the weight of the same volume of water at 20 °C. The determination of relative density of WFS was conducted in accordance with SANS 3001-AG23:2014 [46] for solid soil that passes through a 4.75-mm sieve, using the pycnometer method.
- Fineness Modulus (FM): This is a dimensionless limit, which defines the average particle size and gives a relative indication of the fineness or coarseness of the aggregate. The FM of the five WFS samples used in this study was determined by sieving the material through the specified sieves and was calculated by adding the cumulative percentage passing the 4.75 mm, 2.36 mm, 1.18 mm, 0.6 mm, 0.3 mm, and 0.150 mm, divided by 100. This method was carried out according to SANS 1083:2017 [47].
- Loss on Ignition (LOI): This was carried out to estimate organic matter and the carbonaceous content of the five WFS. In this study, the weight losses related to the evolutions of carbon dioxide and water were quantified by recording the mass before and after controlled heating at 950 °C in the muffle furnace. The LOI tests were performed in accordance with the American Society of Testing and Materials (ASTM D7348-13:2008) [48].
2.2.2. Chemical Properties
Four methods for the evaluation of chemical properties were used as follows:
- X-ray Fluorescence (XRF): The XRF measurements were performed on the five WFS samples using a Rigaku ZSX Primus II with SOQ analysis software, which provides the major and minor rapid quantitative determination of atomic elements. An approximate 10-g sample of each non-grounded dry sample was pressed to form a pellet after mixing with wax. The sample was placed into the sample holder of the XRF spectrometer for quantitative analysis of the chemical composition. X-ray fluorescence (XRF) measurement conditions is shown in Table 2.
- X-ray Diffraction (XRD): This method was used for the mineral phase’s identification and the status of the crystallinity of the five WFS in the powered samples. A Rigaku Ultima IV with PDXL software analysis equipped with ICDD reference pdf 2010 cards for identification, operating using the method of scattering slit, was used. Approximately 10 g of each sample was mechanically milled using a vibrating milling machine. The milled samples were placed in a ˂35-µm sieve shaker for screening samples into powered form. The sample was placed on the holder of the Rigaku Ultima IV X-ray diffractometer for phase identification.
- Scanning Electron Microscope (SEM) and Energy-Dispersive X-ray Spectrometry (EDS) Analysis: The morphology of the five WFS samples was determined by the use of electron microscopy (SEM) TESCAN. SEM was joined with an energy-dispersive X-ray spectrometer (EDS) software analysis to identify the sizes, structure, and composition of discrete particles. Graphite road was used as a coating method for the SEM and EDS analysis. The electron backscattering diffraction technique, which estimates the effect of the WFS non-analyzed component, was adopted, and the installed QantMap software was used to gather a representative spectrum of the elements in the samples through the X-ray detector. Each sample was dried for 24 h at 100 °C.
- pH: The pH of the soils and waste samples was determined. Wastes may be sludges, non-aqueous liquids, or solids. The pH of the five WFS was evaluated in accordance with EPA Method 9045D [49].
3. Results and Discussion
3.1. Physical Properties of WFS
The physical properties of WFS help determine the general suitability and, in particular, the workability of WFS for use in concrete. Particle shape, fineness modulus, and particle gradation influence the workability and compacted density of concrete.
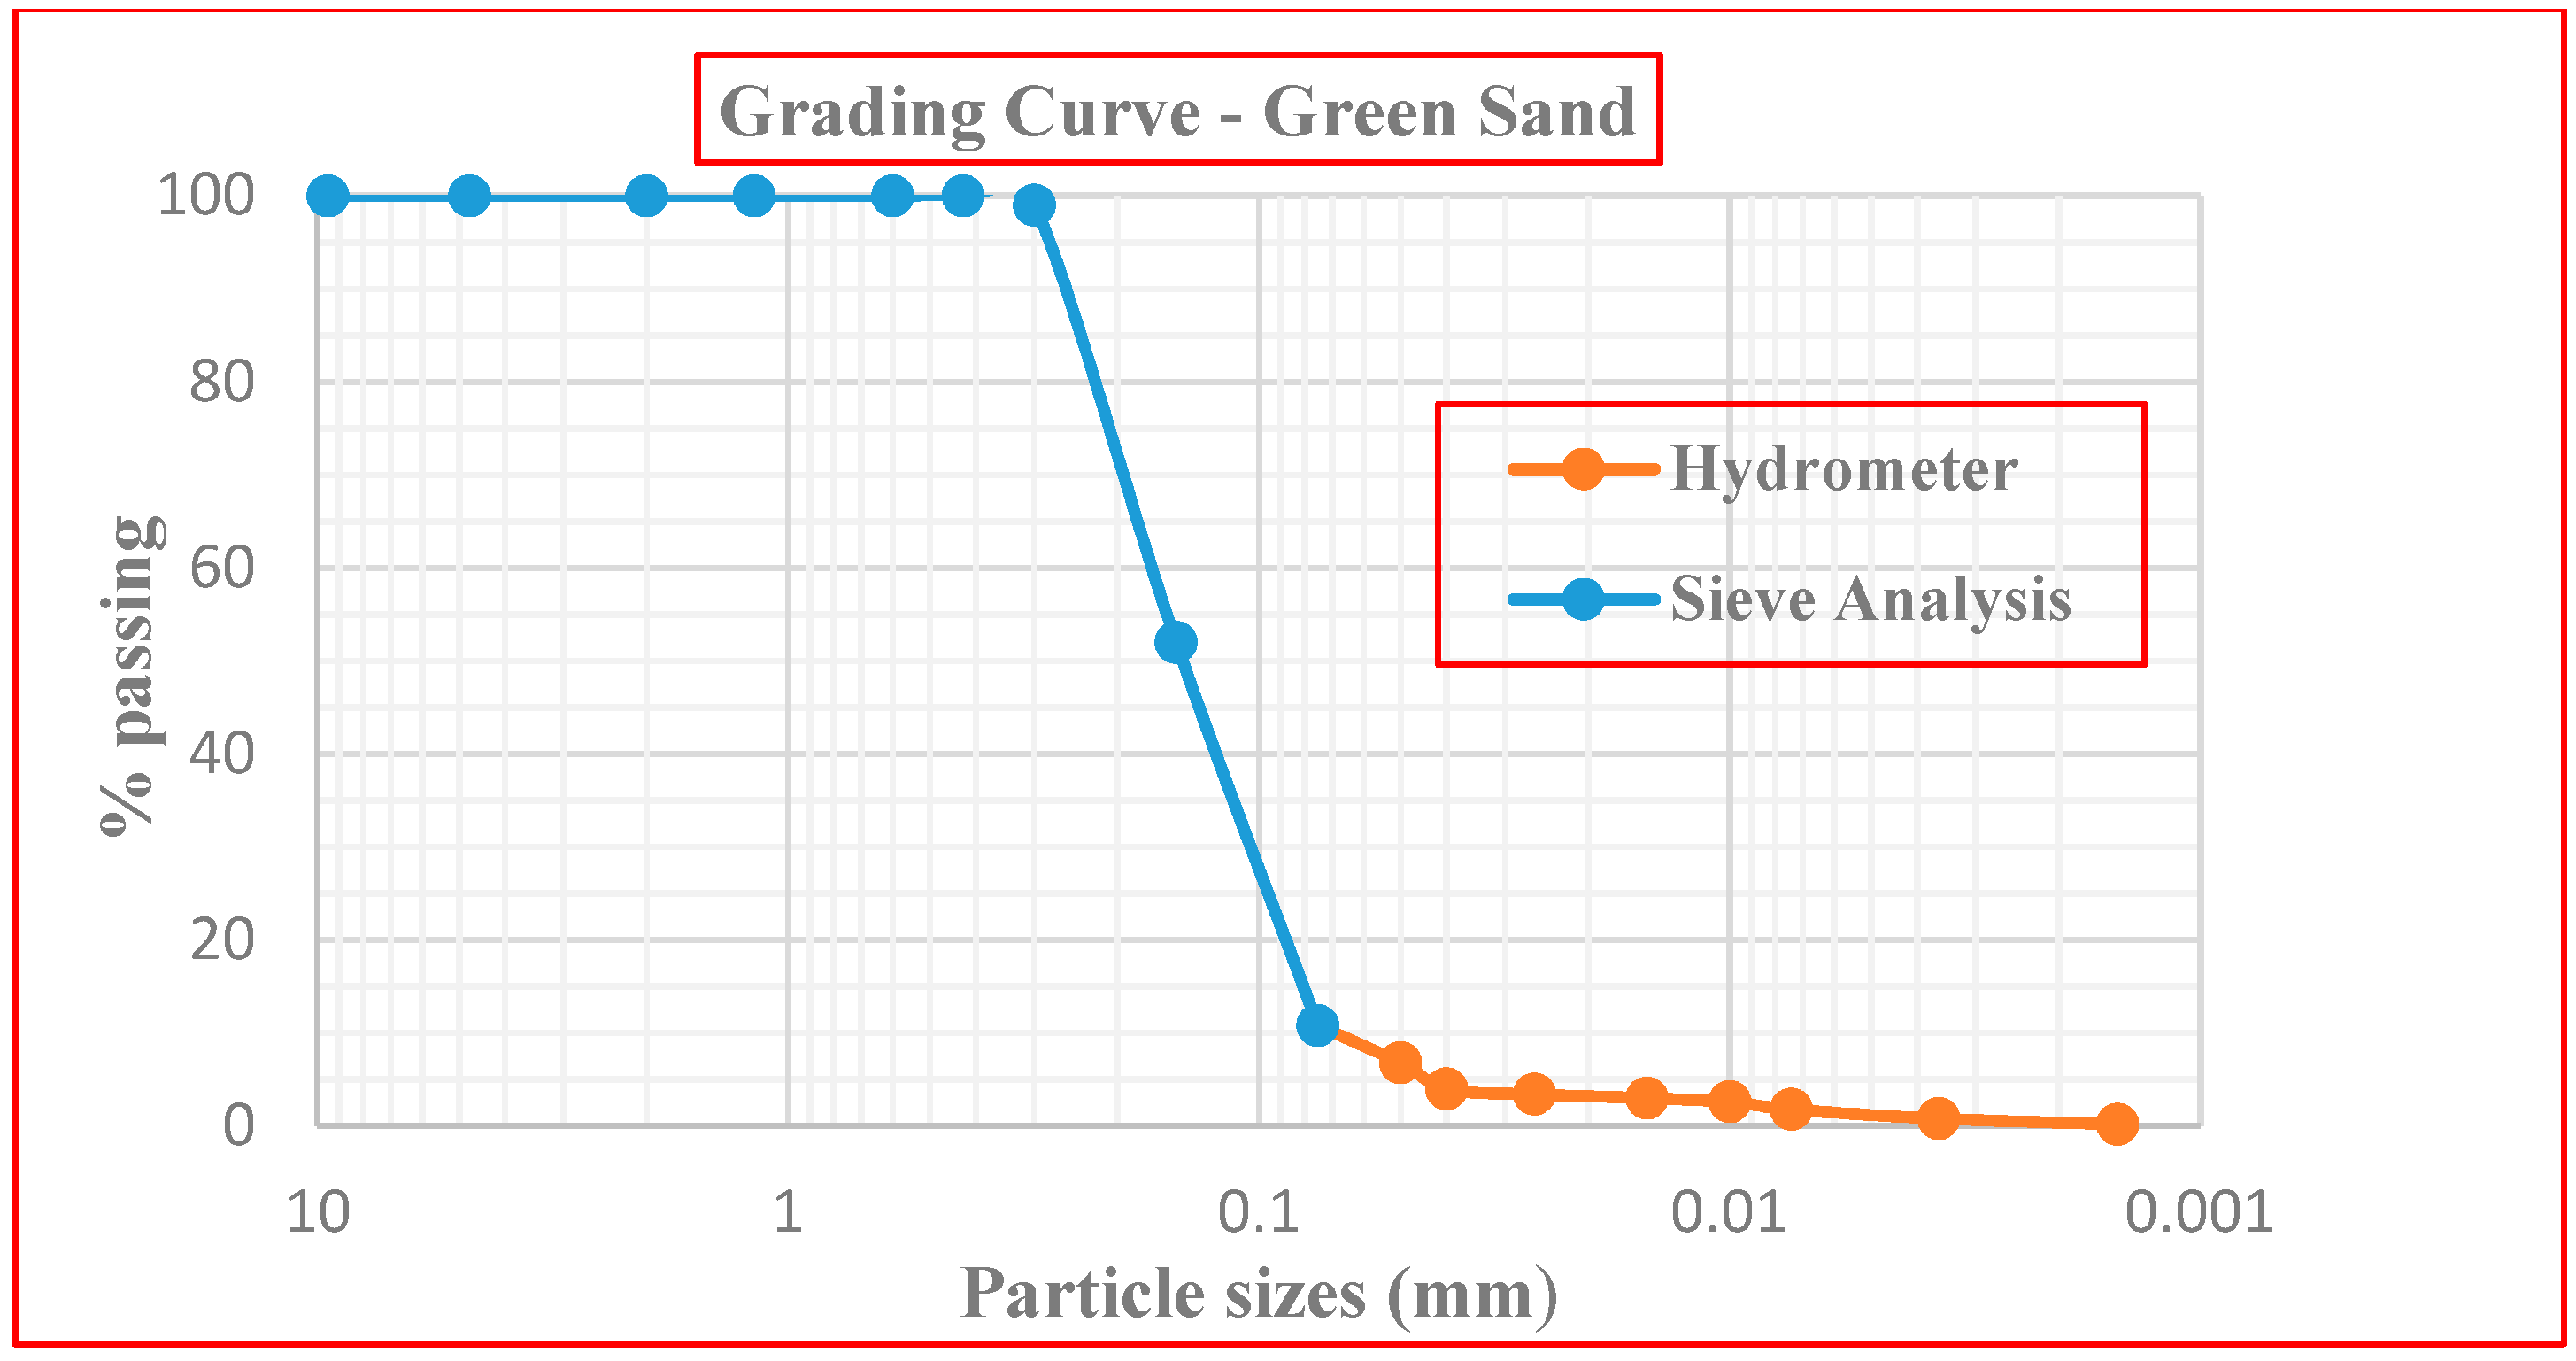
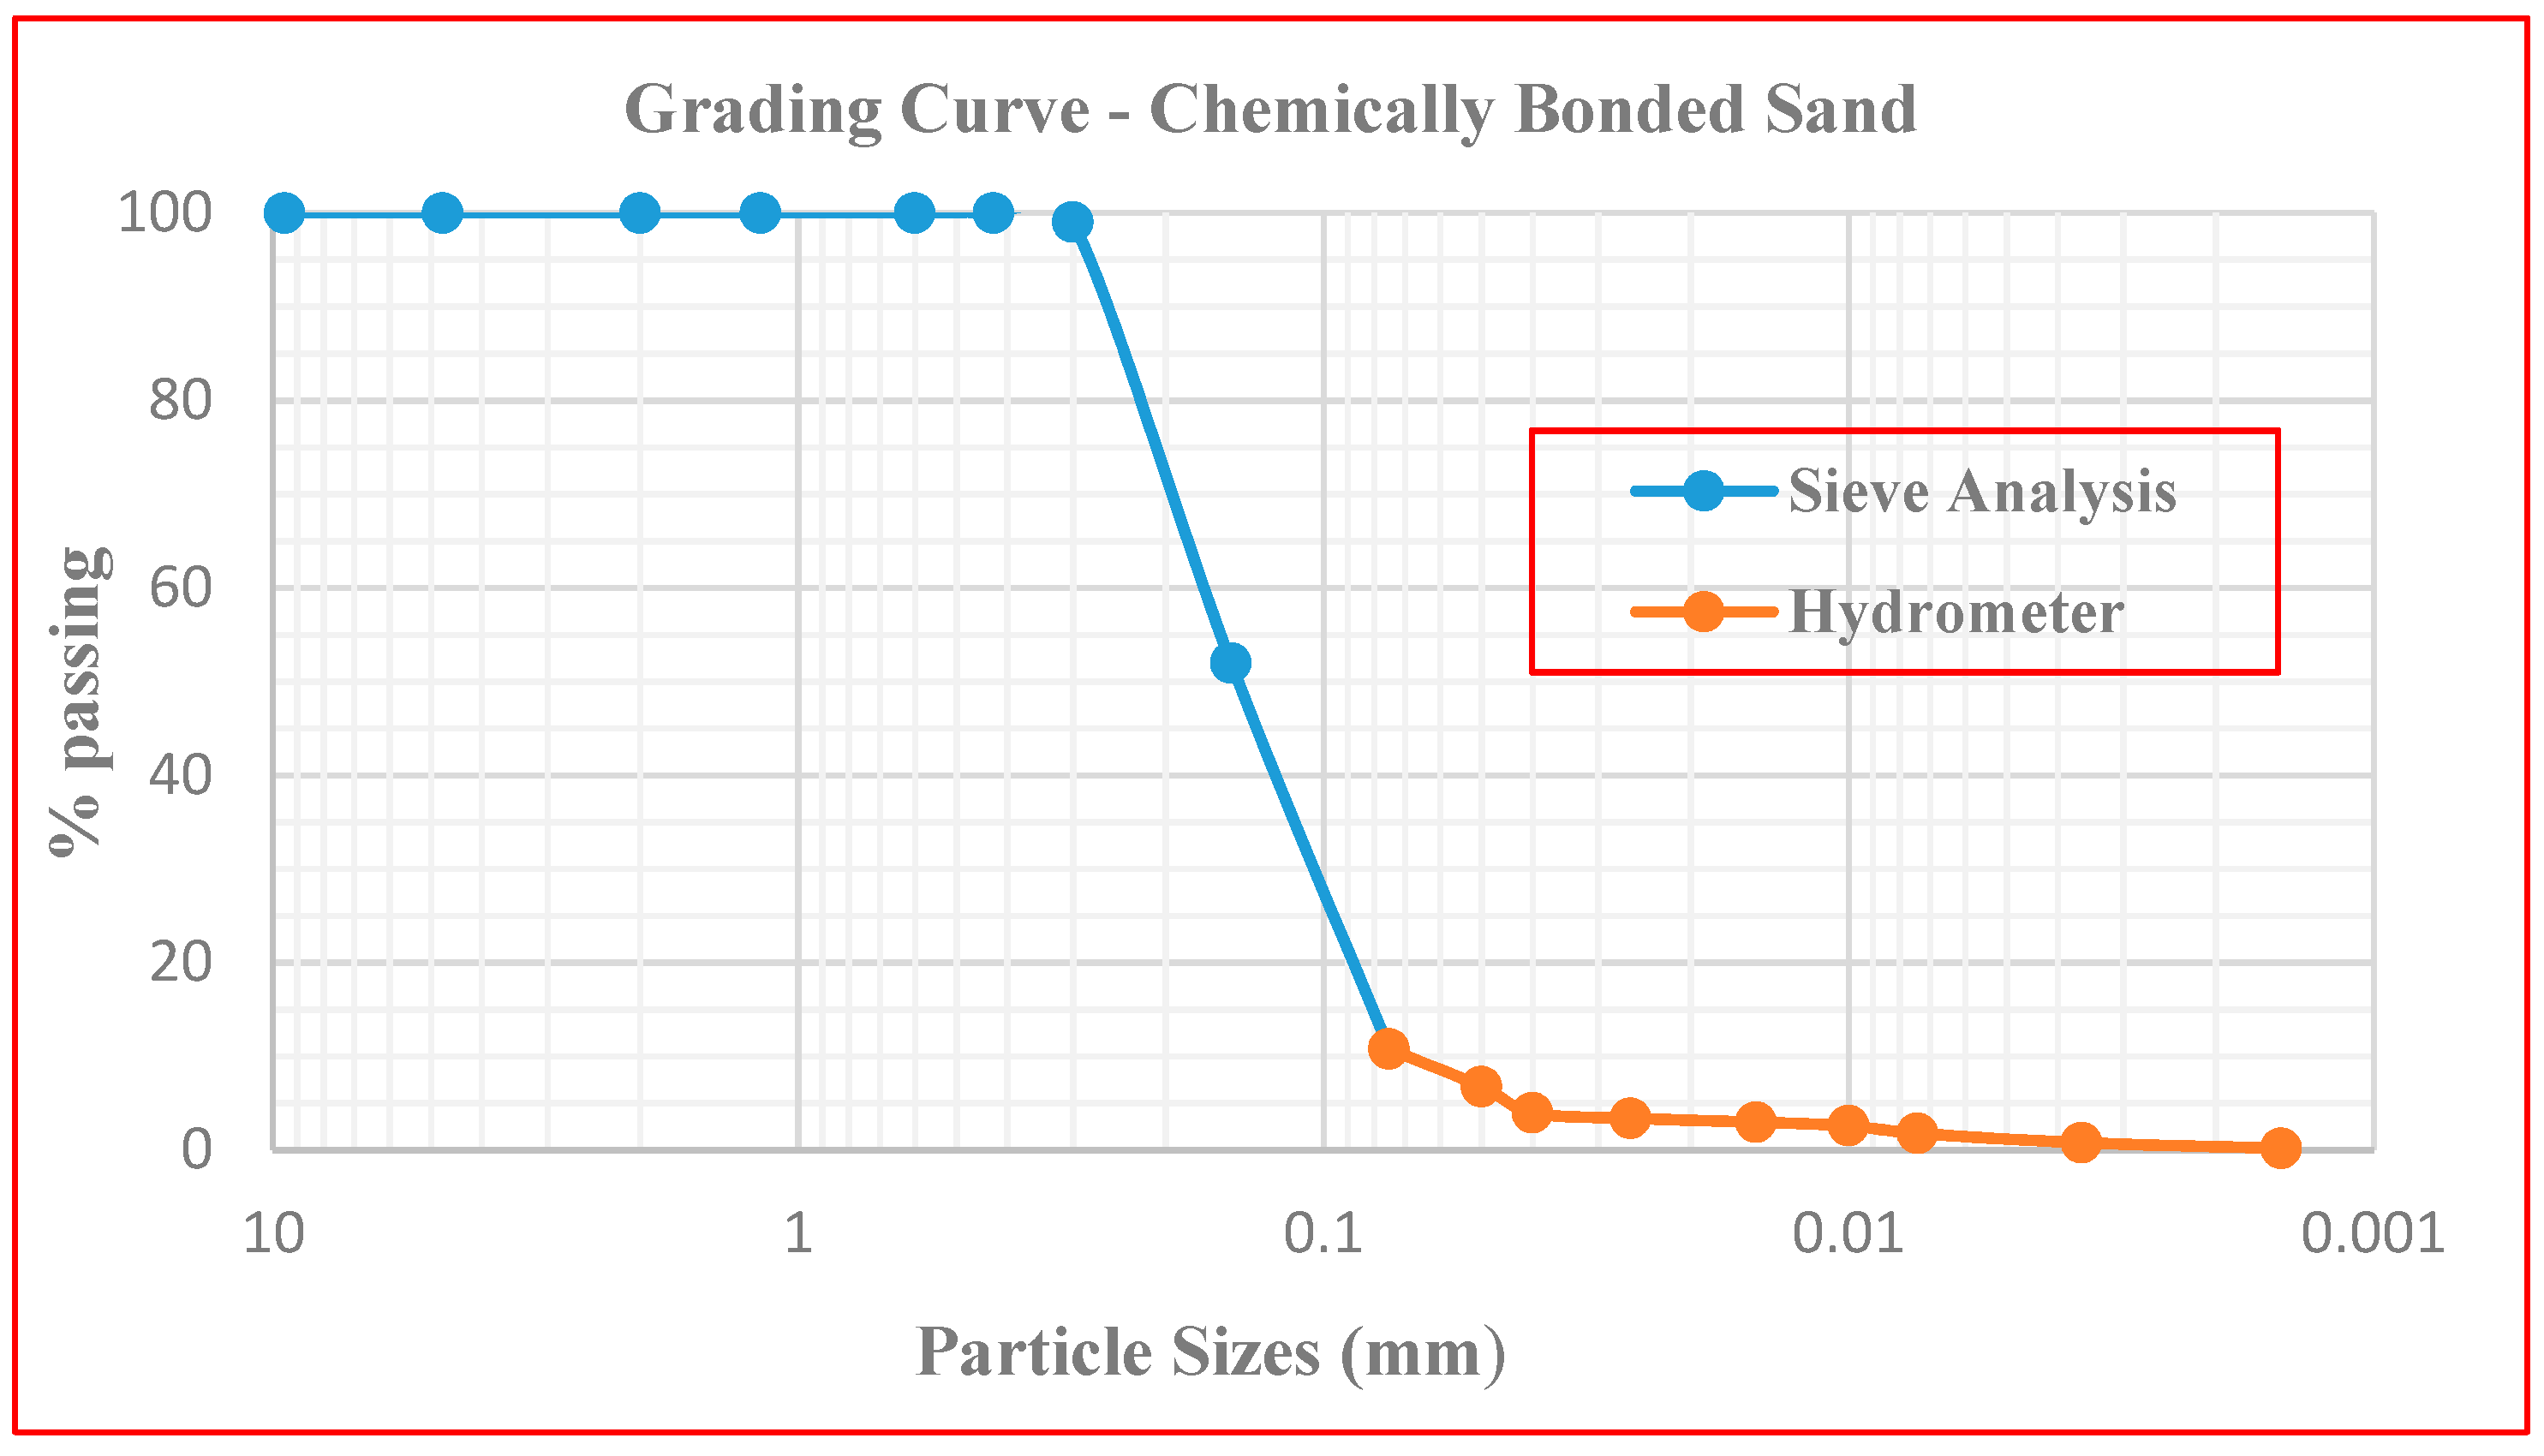
Particle size distribution. The standard specification for concrete material aggregates in South Africa is SANS 1083:2008 [47]. In accordance with this standard, all the samples tested met the requirement of 95% to 100% passing 4.57 mm, but failed to meet the standard requirement of 0% to 10% passing 0.150 mm. According to the Indian Standards for coarse and aggregate specification for natural sources for the concrete (IS 383:1970) [50] grading zone, WFS01, WFS02, WFS03, and WFS05 met the requirement of 80% to 100% passing 0.60 mm. This confirms that WFS01, WFS02, WFS03, and WFS05 fall within zone IV, representing finer sand. The green sand (WFS01) and the chemically bonded sand (WFS02) had 21% and 12%, respectively, passing through the 0.150-mm sieve, thereby satisfying the grading limit criteria [47].
WFS03 (green sand) and WFS05 (chemically bonded sand) exceeded the allowable 25% passing 0.15 mm, with values of 42% and 52%, respectively. Sample WFS04, with 4% passing the 0.150-mm sieve, complied with a suggested grading value of a lower limit of 3% passing the 0.150-mm sieve [51]. For the grading limit requirement for aggregate from natural sources as specified by SANS 1083:2008 [47], WFS samples WFS01, WFS02, and WFS04 met all the criteria.
In the present study, it was observed that the WFS particle size distribution was relatively even with most of the sizes ranging between 0.600 mm and 0.150 mm. This confirmed the report of some past research [21,52], where the WFS particle size distribution was relatively uniform, with sizes ranging between 0.600 mm and 0.150 mm. These WFS samples were categorized as medium to fine sands and satisfied the conditions for overall fine aggregate. The particle size distribution results (sieve and hydrometer analysis) of percentage passing of samples WFS01–WFS05 are presented in Table 3, with the SANS 1083:2008 [47] grading acceptability ranges. The gradation results of all the samples (WFS01 to WFS05) are presented in Table 4, Table 5, Table 6, Table 7 and Table 8, respectively.
The results of the particle size gradation curve (sieve and hydrometer analysis) of all the percentage passing of samples WFS01–WFS05 are plotted in Figure 1. The individual gradation curve results are presented in Figure 2, Figure 3, Figure 4, Figure 5 and Figure 6 respectively. Figure 1 indicates that a common shape dominates the gradation of WFS. Approximately 90% by mass of grains are uniformly distributed between the sizes of 0.15 mm and 0.80 mm. From the grading curves, WFS is finer and less graded than typical fine aggregate. The grading results of this investigation are comparable with those of other researchers [53,54,55].
Table 9 shows the grading characteristics of the WFS. D10, D30, and D60 are the largest sizes of particle diameter in the finest 10%, 30%, and 60% of the sample, respectively (from Figure 1). The coefficient of uniformity (Cu), D60/D10, provides an indication of the uniformity of the particle sizes. Unity (a value of 1.0) would indicate a single sized sample. The coefficient of curvature (Cc), D302/D60 × D10, evaluates the curvature of the gradation curve. According to ASTM D2487-06:2004 [56], the Unified Soil Classification System (USCS), well-graded sand should have a Cu equal to or greater than 6 and a Cc between 1 and 3. From Table 9 and Figure 1, it is evident that only WFS03 complies with these criteria.
These results conformed with those of previous investigations [21,54,55], in that nearly 90% of grains are in the range of 0.15 mm and 0.80 mm.
i. Fine Content. For the five WFS, the fraction finer than 75 µm, determined by washing, is included in Table 10 (column P7). The results varied between 2% and 26% (average 9.3%), comparable with the results of research by others [57]. This recommends that constituents less than 75 µm may be alienated from greater particles more capably and entirely by washing. Clarifications might consist of further degradation of break-up and particles of compound grains during washing and dispersing. The clay-bonded WFS samples (WFS01 and WFS03) contained, on average, 19% fine content, which is comparatively finer than the chemically bonded WFS samples (which contained an average of 2.9%).
ii. Fineness Modulus (FM). FM is an index of average aggregate fineness—the coarser the aggregate, the greater the FM. The FM values of the five samples are included in Table 10 (column P4). According to SANS 1083:2008 [47], the limiting FM for fine aggregate for concrete use ranges from 1.2 to 3.5. For the fine aggregate used in concrete, according to ASTM C 33:2003 [57], the FM generally ranges from 2.3 to 3.1, while the American Concrete Institute (ACI) standard ranges from 2.0 to 3.3. Samples WFS01, WFS02, and WFS04 complied with SANS 1083:2008 [47] with FMs of 1.2, 1.4, and 3.2, respectively. Samples WFS03 and WFS05 had FMs of 1.0 and 0.5, respectively; hence, they did not comply with any of the abovementioned standards.
iii. Clay/Silt Content. In accordance with SANS 1083:2008 [47], WFS01 and WFS03 (clay-bonded) contained a higher clay/silt percentage of 13% and 26% respectively; hence, they failed to meet the standard requirement limit of fine aggregate for concrete use. The other two samples (WFS02 and WFS04) met the clay/silt content standard requirements for use in concrete. It was concluded that bentonite (clay contents) occupied the mainstream of fine content. Apart from the clay content, fine materials are also composed of very fine sand particles and silts that are circulated by the residue chemical additives and binders from the molded processes and by the wash water [20]. The relative low amount of portion of fine materials, i.e., chemical additives, binders, and bentonite may have played a vital part in the processes of cement hydration. The clay content values of the five samples are included in Table 10. According to SANS 1083:2008 [47], the limiting clay content for fine aggregate for concrete use is 2.0%.
In establishing the variant of the physical properties of the five WFS samples, the molding processes play an important role, as presented in Figure 1 and Table 10. A range of molding progressions are utilized in present foundries, introduced mostly in the parts of refractory material originals, metal types, binders, additives, core reclamation operations, and molding and binding systems. The mentioned factors, as reported [54,55], may have affected the reshaping virgin foundry sand process into WFS.
iv. Moisture Content. The elaborated outcome of moisture contents of the five WFS samples (WFS01 to WFS05) are presented in Table 11, while the result summary is included in Table 10 (column P1). The moisture content of the five WFS analyzed ranged from 0.2% to 8.3%. The chemically bonded sample, WFS02, displayed a relatively high-water content of 8.3%, while sample WFS03 had a moisture content of 1.9%. Samples WFS01, WFS04, and WFS05 had moisture contents less than 1%. This variation might be correlated to the water contents initially set in the system of foundry sands. In a previous research report [39], WFS was reported to be virtually dry. The moisture content of the chemically bonded samples was reported to be in the range of 0.11% to 3.48% and clay (green) sand samples ranged from 0.08% to 4.59%. According to the America Concrete Institute (ACI), moisture content acceptable limits range between 0% and 10%; thus, WFS01 to WFS05 were deemed acceptable.
Clay systems need about 10% water for bentonite binding activation; however, 2% to 3% water is required as a catalyst or solvent for organic binder activation [58]. Neglecting moisture content can incorrectly affect the calculation of volume of water in mix design.
Aggregates are not completely solid, but rather contain a certain level of porosity. Pores may be located in the center of the aggregate, while others may actually connect to the surface of the aggregate. When calculating the bulk specific gravity of an aggregate, both the volume of the aggregate and that of all its pores were taken into consideration to avoid its effect on concrete properties. These pores will likely contain a certain level of moisture that will affect the performance of the concrete if appropriate corrections are not made to account for the actual moisture content of the aggregates. If the moisture content is higher than the aggregate’s absorption value, the aggregates will contribute free water to the mix. From the study, all sample results had no effect on the W/C ratio; hence, no change was observed. This means that the 28-day compressive strength of each mix would likely not be reduced, and the W/C ratios comply with the limits established by the South African National Standard.
v. Uncompacted Bulk Density. The elaborated results of uncompacted bulk density of the five WFS samples (WFS01 to WFS05) are presented in Table 12, while the result summary is included in Table 10 (column P2).
The results range from 1165 kg/m3 to 1473 kg/m3. This range is possibly ascribed to the variation in particle gradation, fine content, sand mineralogy, and grain shape. According to SANS 5845:2006 [45], the uncompacted bulk densities for lightweight aggregate must be in the range between 1120 and 1760 kg/m3. According to ACI Committee 221 (1996) [59], sands with an uncompacted bulk density less than 1120 kg/m3 are most normally utilized in lightweight concrete. In accordance with ASTM C 29:1997 [60], uncompacted bulk density normally utilized in normal-weight concrete varies from about 1200 to 1750 kg/m3. The compacted bulk density and loose bulk density of waste foundry sand was reported [61] as 1890 kg/m3 and 1690 kg/m3. Hence, all the samples (WFS01 to WFS05) complied with this criterion. Round shape and good gradation lead to a structure of compactness and high density [20].
vi. Specific Gravity. The elaborated results of specific gravity of the five WFS samples (WFS01 to WFS05) are presented in Table 13 and Table 14, while the result summary is included in Table 10 (column P3). These values ranged between 2.3 and 2.8. The sea coal dust, which is known to be porous with carbon content, might have resulted in the slightly lower specific gravity in the case of the green WFS (WFS01 and WFS03).
The specific gravities stated in previous works on four green sand samples varied from 1.985 to 2.45 [21,55], whereas the specific gravity of chemically bonded WFS was found to be 2.60 [55]. The specific gravity of WFS was observed to be 2.18 [21], while it was also stated that the specific gravity of WFS varies between 2.39 and 2.79 [62]. All results of the present study had similarities with the results from the past studies as shown in Table 9 (column P3). Differences in specific gravity might be ascribed to the variation in fine content, particle gradation, sand mineralogy, grain shape, and sand binder. Numerous foundries still utilize binders, for instance, sawdust, clay, and wood flour for casting. The specific gravity of the WFS is reduced due to the presence of these particles; furthermore, the density of the concrete decreases by producing air voids in the concrete. According to ACI (specific gravity), the acceptable limit ranges from 2.30 to 2.90, while, in the case of ASTM C 128:2001 [63], the limit ranges from 2.4 to 2.9. Hence, WFS01 to WFS05 met the standard specific gravity criteria.
vii. Loss on Ignition. The elaborated results of loss on ignition of the five WFS samples are presented in Table 15 and Table 16, while the result summary is included in Table 17. Essentially, this test determines the carbonaceous material content in the WFS. The results from the tested samples (WFS01 to WFS05) indicated that all the samples contained carbonaceous materials in dissimilar percentages. The presences of high carbonaceous content in sample WFS03 may be ascribed to the sea coal dust and lime present in green sand, which was oxidized to ash, talc, carbon dioxide, and calcium carbonate at the temperature of 950 °C. The chemically bonded sands (WFS02 and WFS05) showed a relatively lower content of carbonaceous substance when compared to the clay-bonded sand samples (WFS01 and WFS03), which displayed a higher content. The present study variations of both waste sands are ascribed to the sand binders and metal type being cast, which concurs with the findings of other research [21].
3.2. Chemical Properties of WFS
i. X-ray Fluorescence (XRF). From the results shown in Table 17, silica oxide (SiO2) is the predominant element existing in all samples and with the highest percentage present. When comparing the elemental composition of the green sand (clay-bonded) WFS samples (WFS01 and WFS03) to chemically bonded samples (WFS02, WFS04, and WFS05), it was observed that the latter comprised less aluminum oxide (Al2O3) and had no trace of magnesium oxide (MgO); this can be ascribed to the partial loss of binder and high casting temperature. The main components of all samples were found to be silica (SiO2), alumina (Al2O3), and ferric oxide (Fe2O3). These three main components stated in the study show similar results reported by past researchers [20,52].
The chemical composition of the grain was found to be appropriate for Portland cement manufacturing. The highest oxide (SiO2, Al2O3, and Fe2O3) contents of the present study conformed to a past report [21].
ii. X-ray Diffraction of WFS (XRD). The XRD technique was carried out to determine the mineralogy of the particle size fraction present, as well as the phase and spectra composition. The results of the diffractogram analysis of WFS01 to WFS05 are similar in the diffraction patterns observed upon comparing the green sand in contrast to chemically bonded sand. Quartz (SiO2) was the major detected crystalline phase and the most common among the molding sand. From the diffraction pattern of the WFS, new peaks were identified suggesting the presence of new mineralized phases. The green sand samples displayed the occurrence of a new mineralized phase (othorclase), while the chemically bonded sand exhibited the existence of sillimite, corundum, and periclase as the mineralized phase of the casting system. The results revealed that silica has the highest percentage of all the elements and compounds present, as shown by the XRD analysis. This remains the major mineral within waste stream casting sand [64,65]. The combine X-ray diffractogram peak results of samples (WFS01 to WFS05) are presented in Figure 7.
The previous studies highlight that the chemical composition of the waste foundry sand depends on the type of metal, type of binder, and combustible used, which influences the performance. WFS is generally rich in silica and coated with a thin film of burnt carbon, residual binder (bentonite, sea coal, and resins/chemicals), and dust. Silica sand is hydrophilic and, consequently, attracts water to its surface [17]. The chemical composition of WFS as reported by research [21,31,32] shows that silica oxide (SiO2) is the predominant element existing in all samples and with the highest percentage present. The total amounts of major components in WFS01 to WFS05 (SiO2, Al2O3, and Fe2O3) are 93.64%, 94.86%, 91.23%, 94.59%, and 83.47%, respectively [1,2,3]. Evidently, both the green sand and chemically bonded sands contain large SiO2 content due to their origins from sands. Generally, high amounts of SiO2 in aggregates result in greater hardness [31].
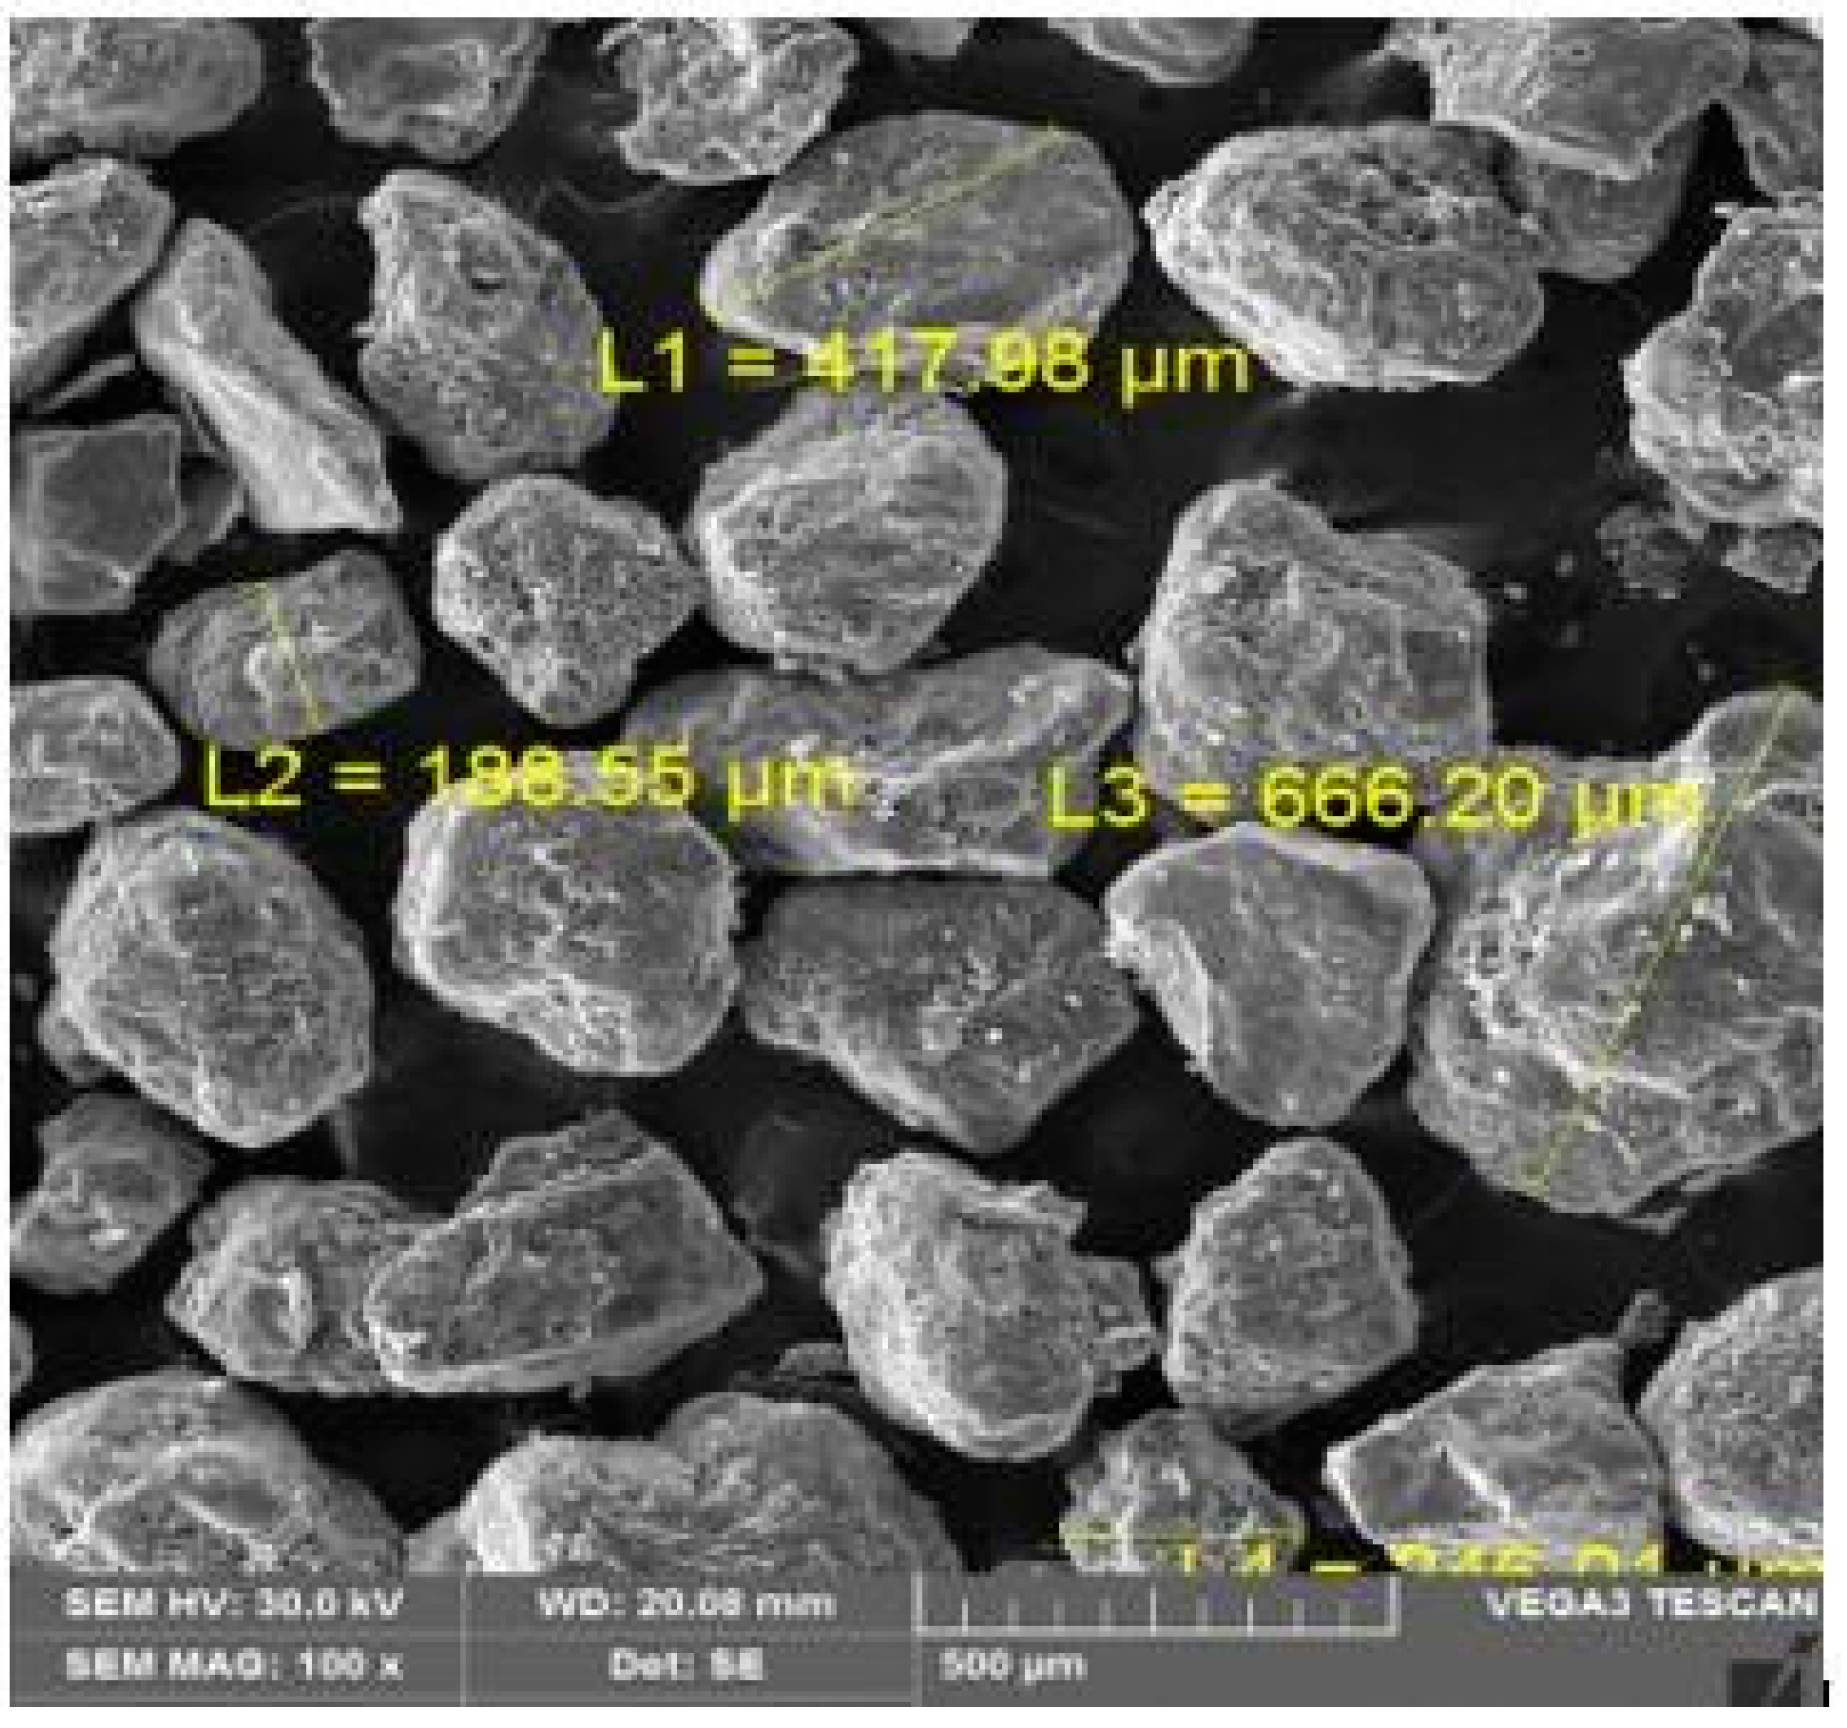
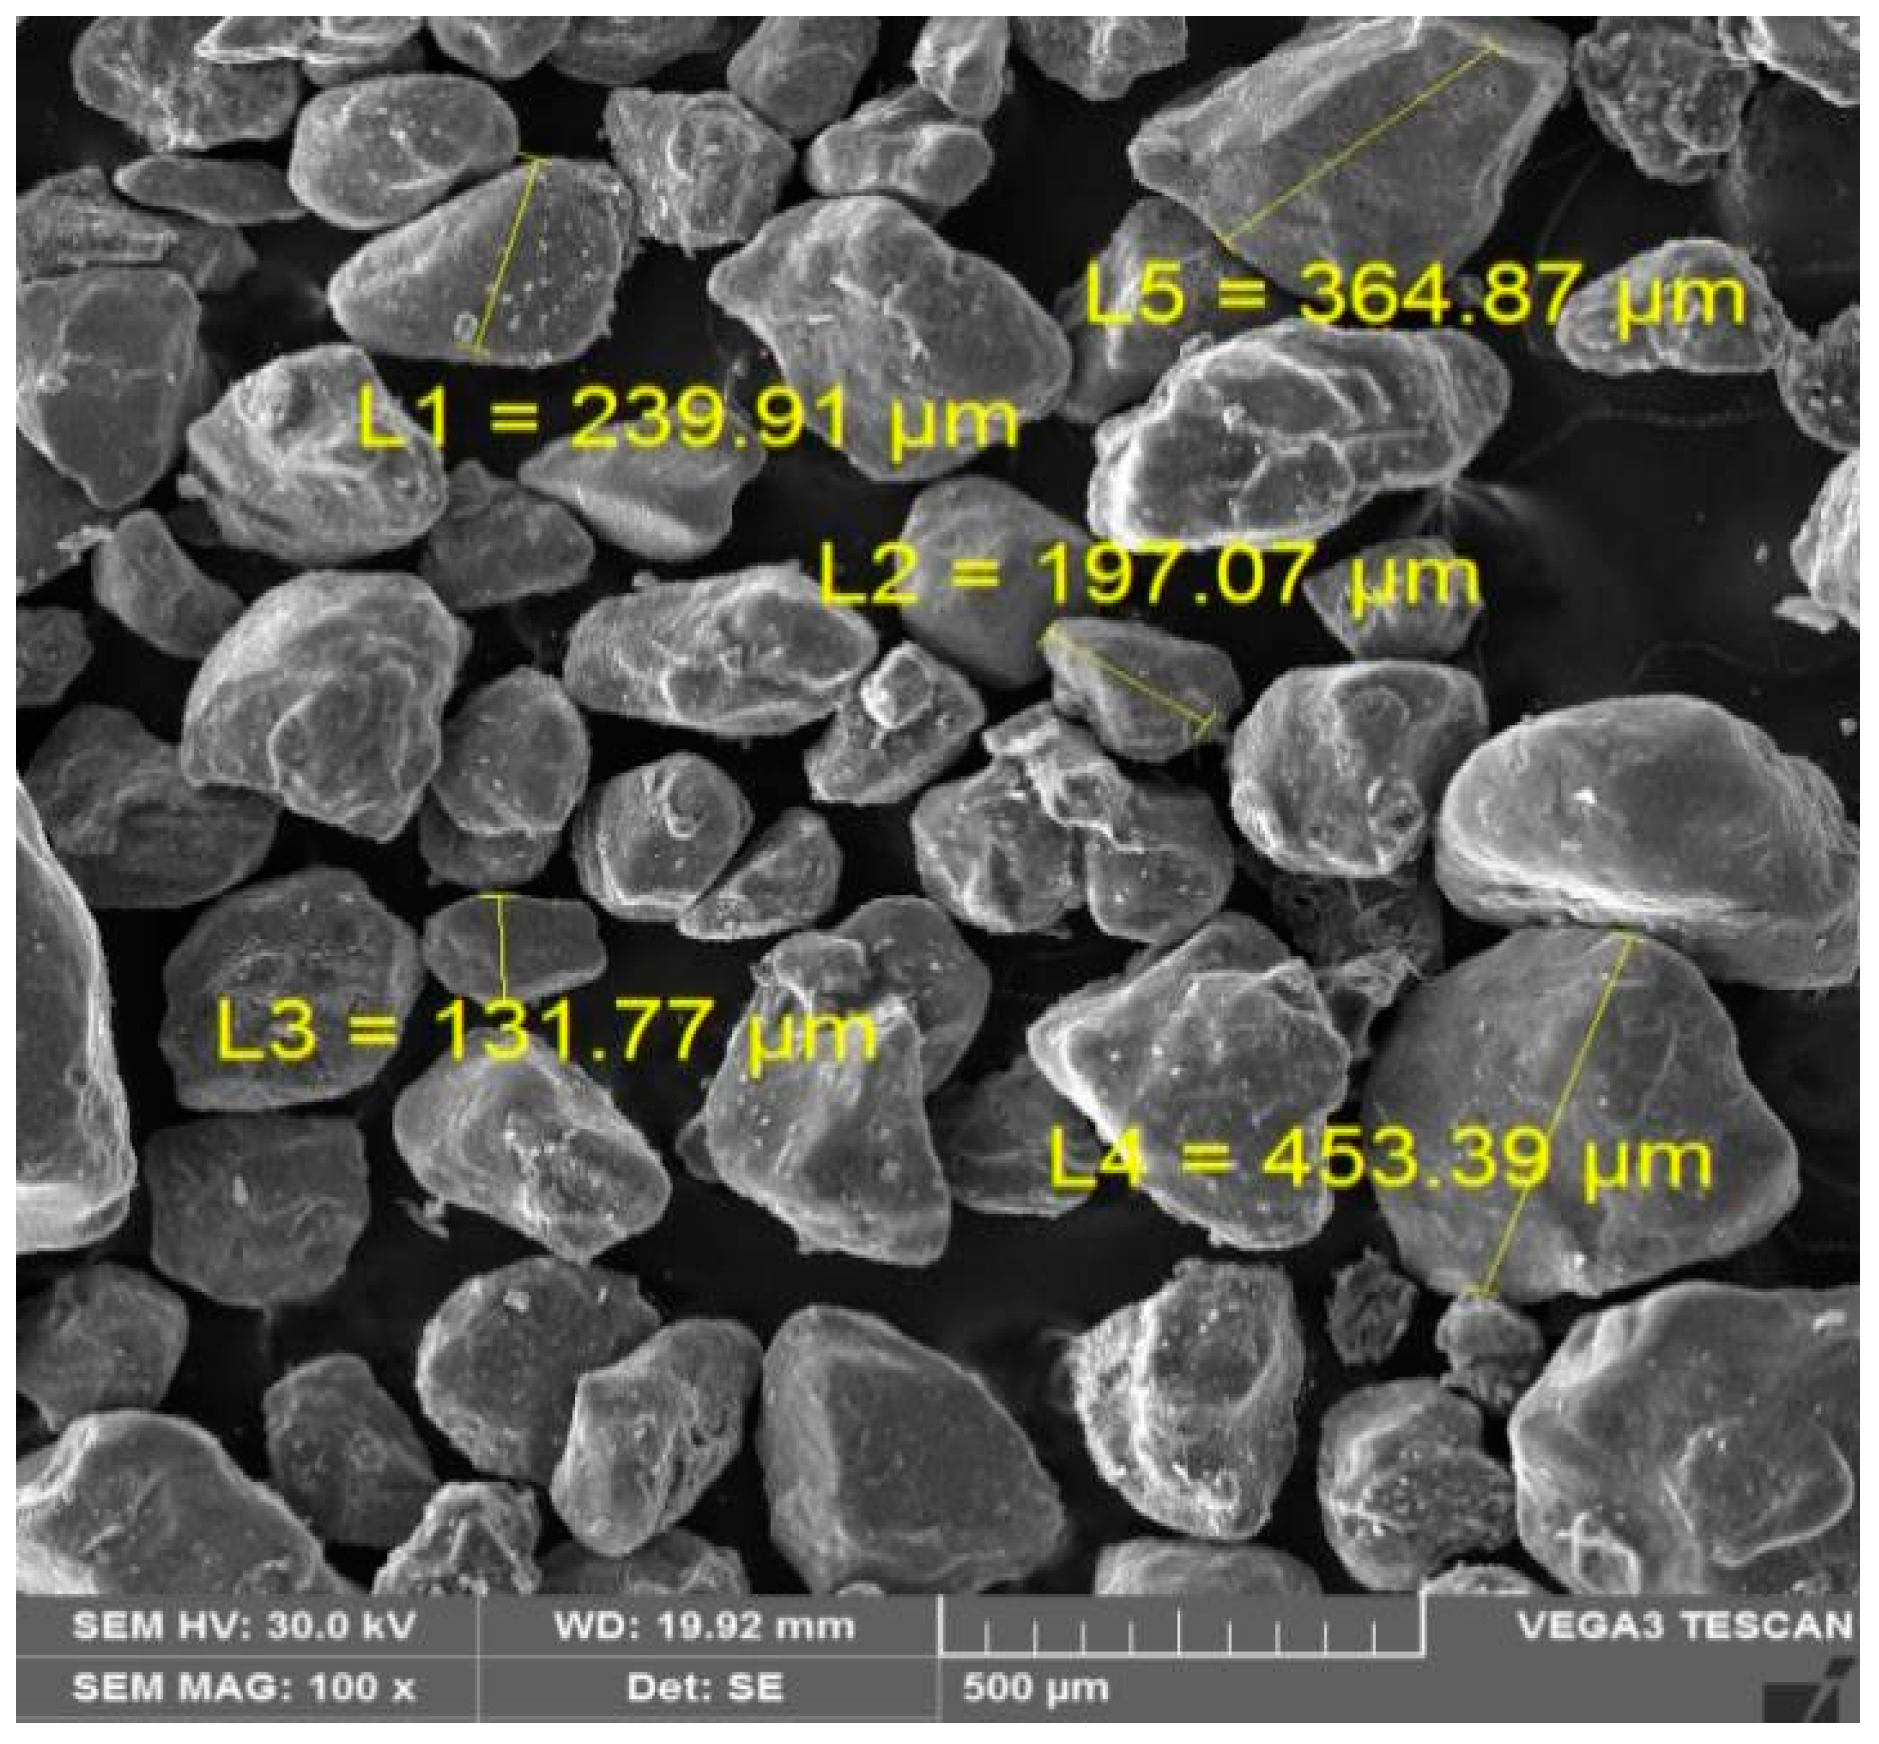
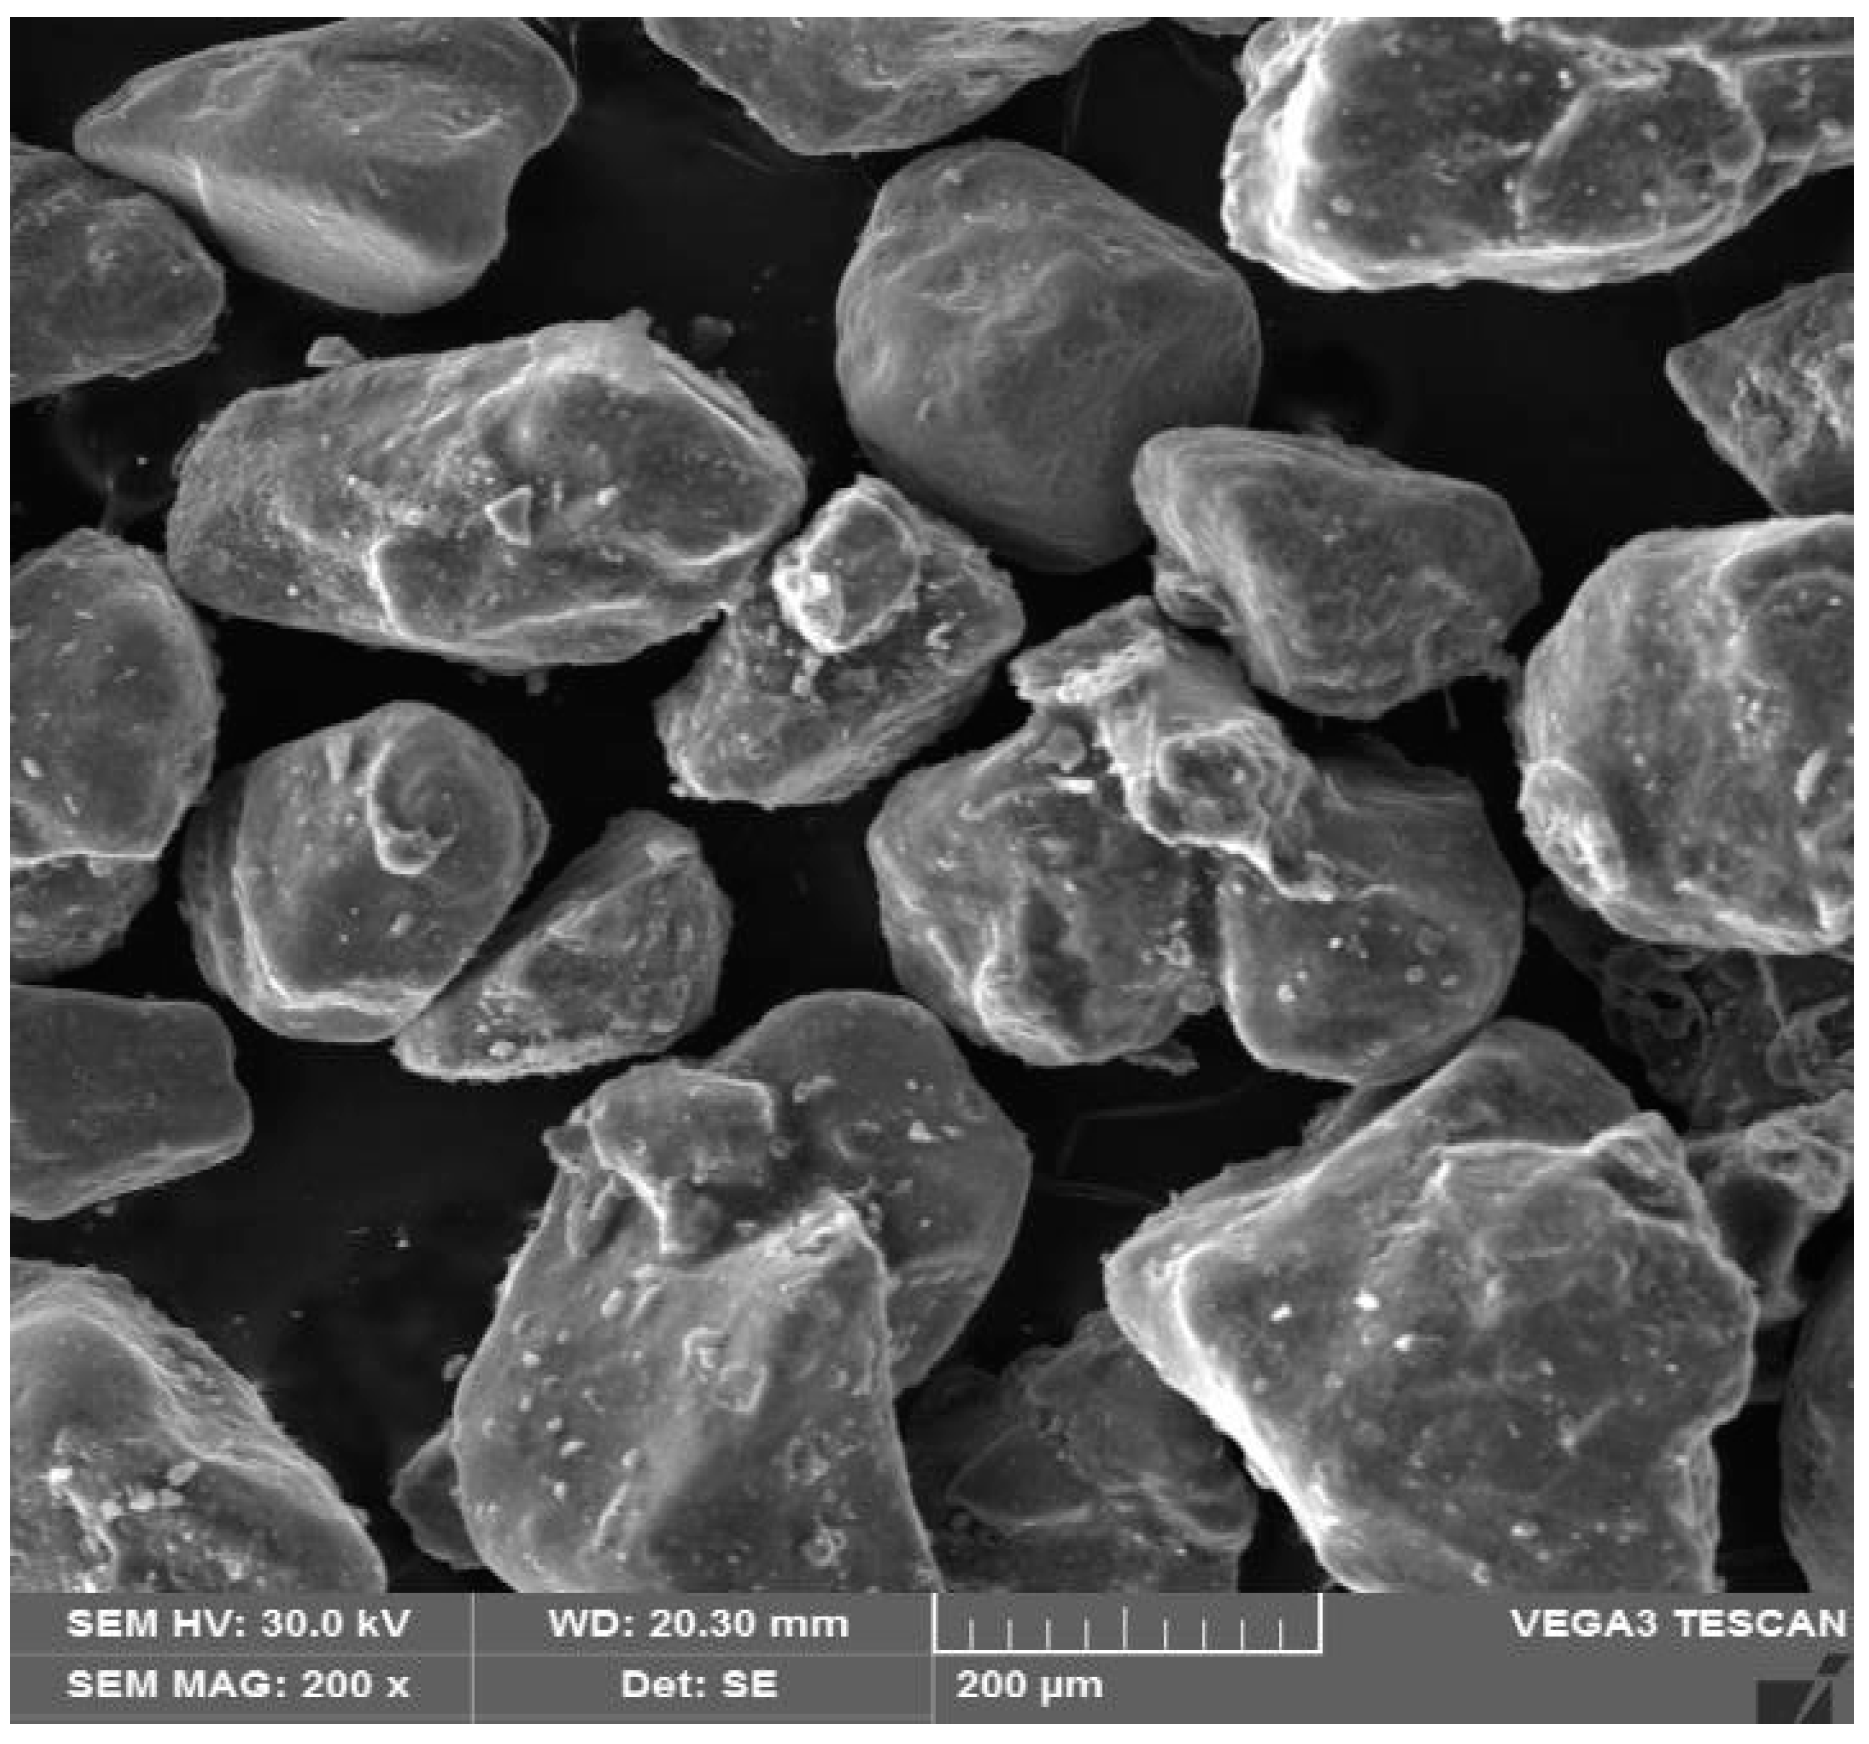
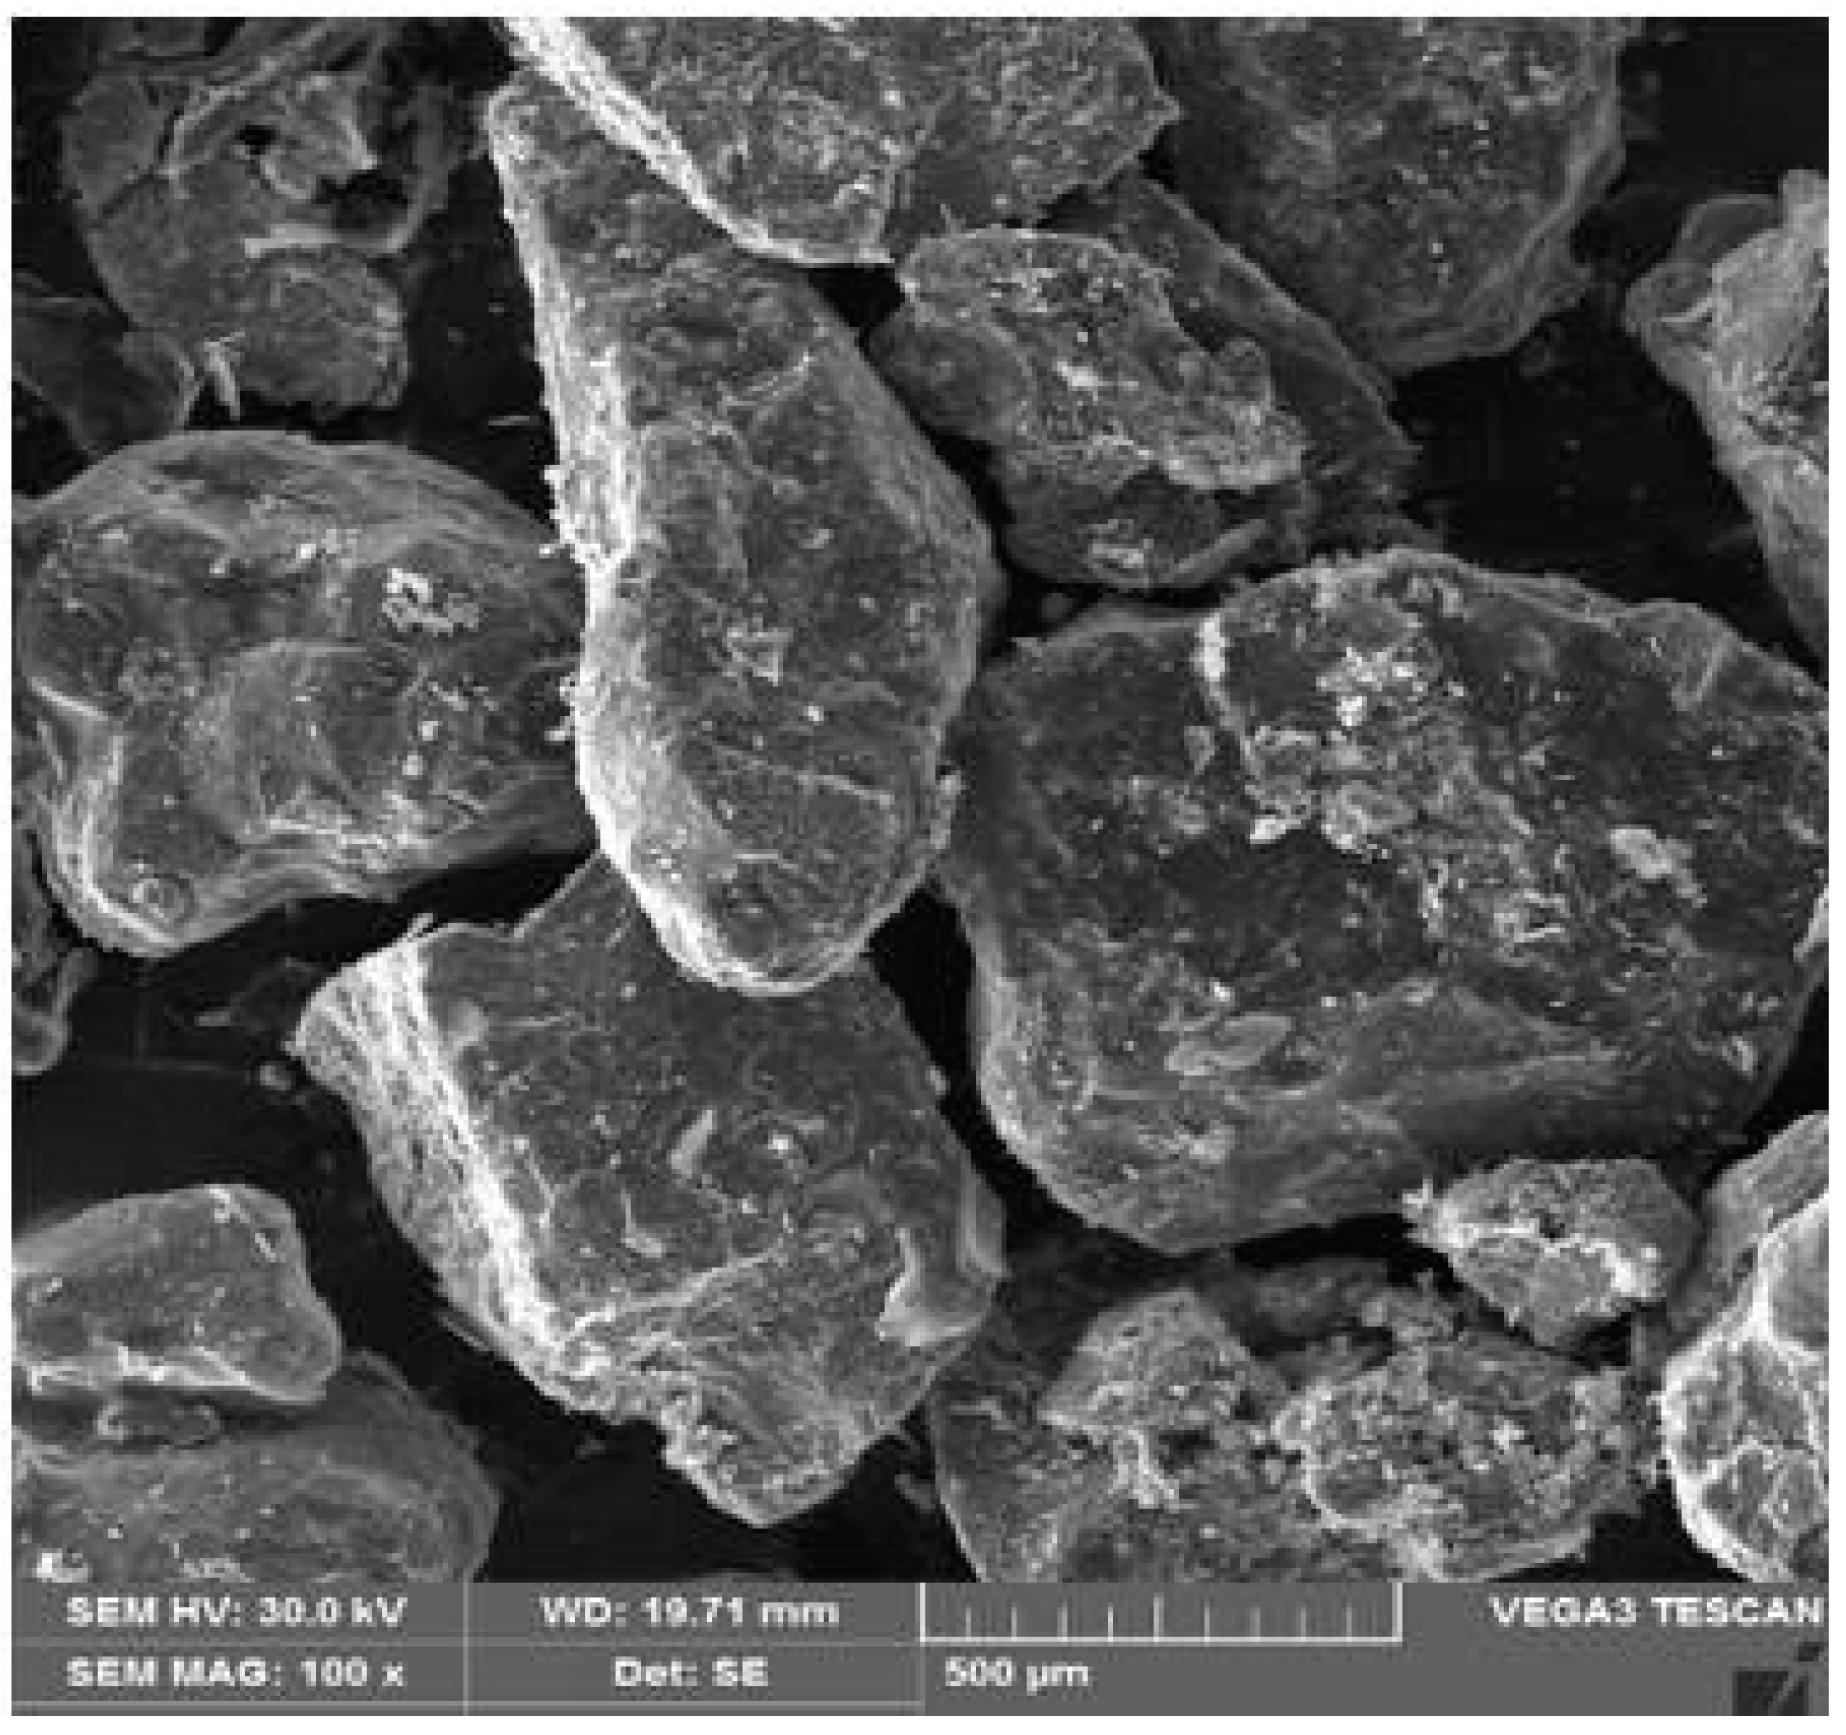
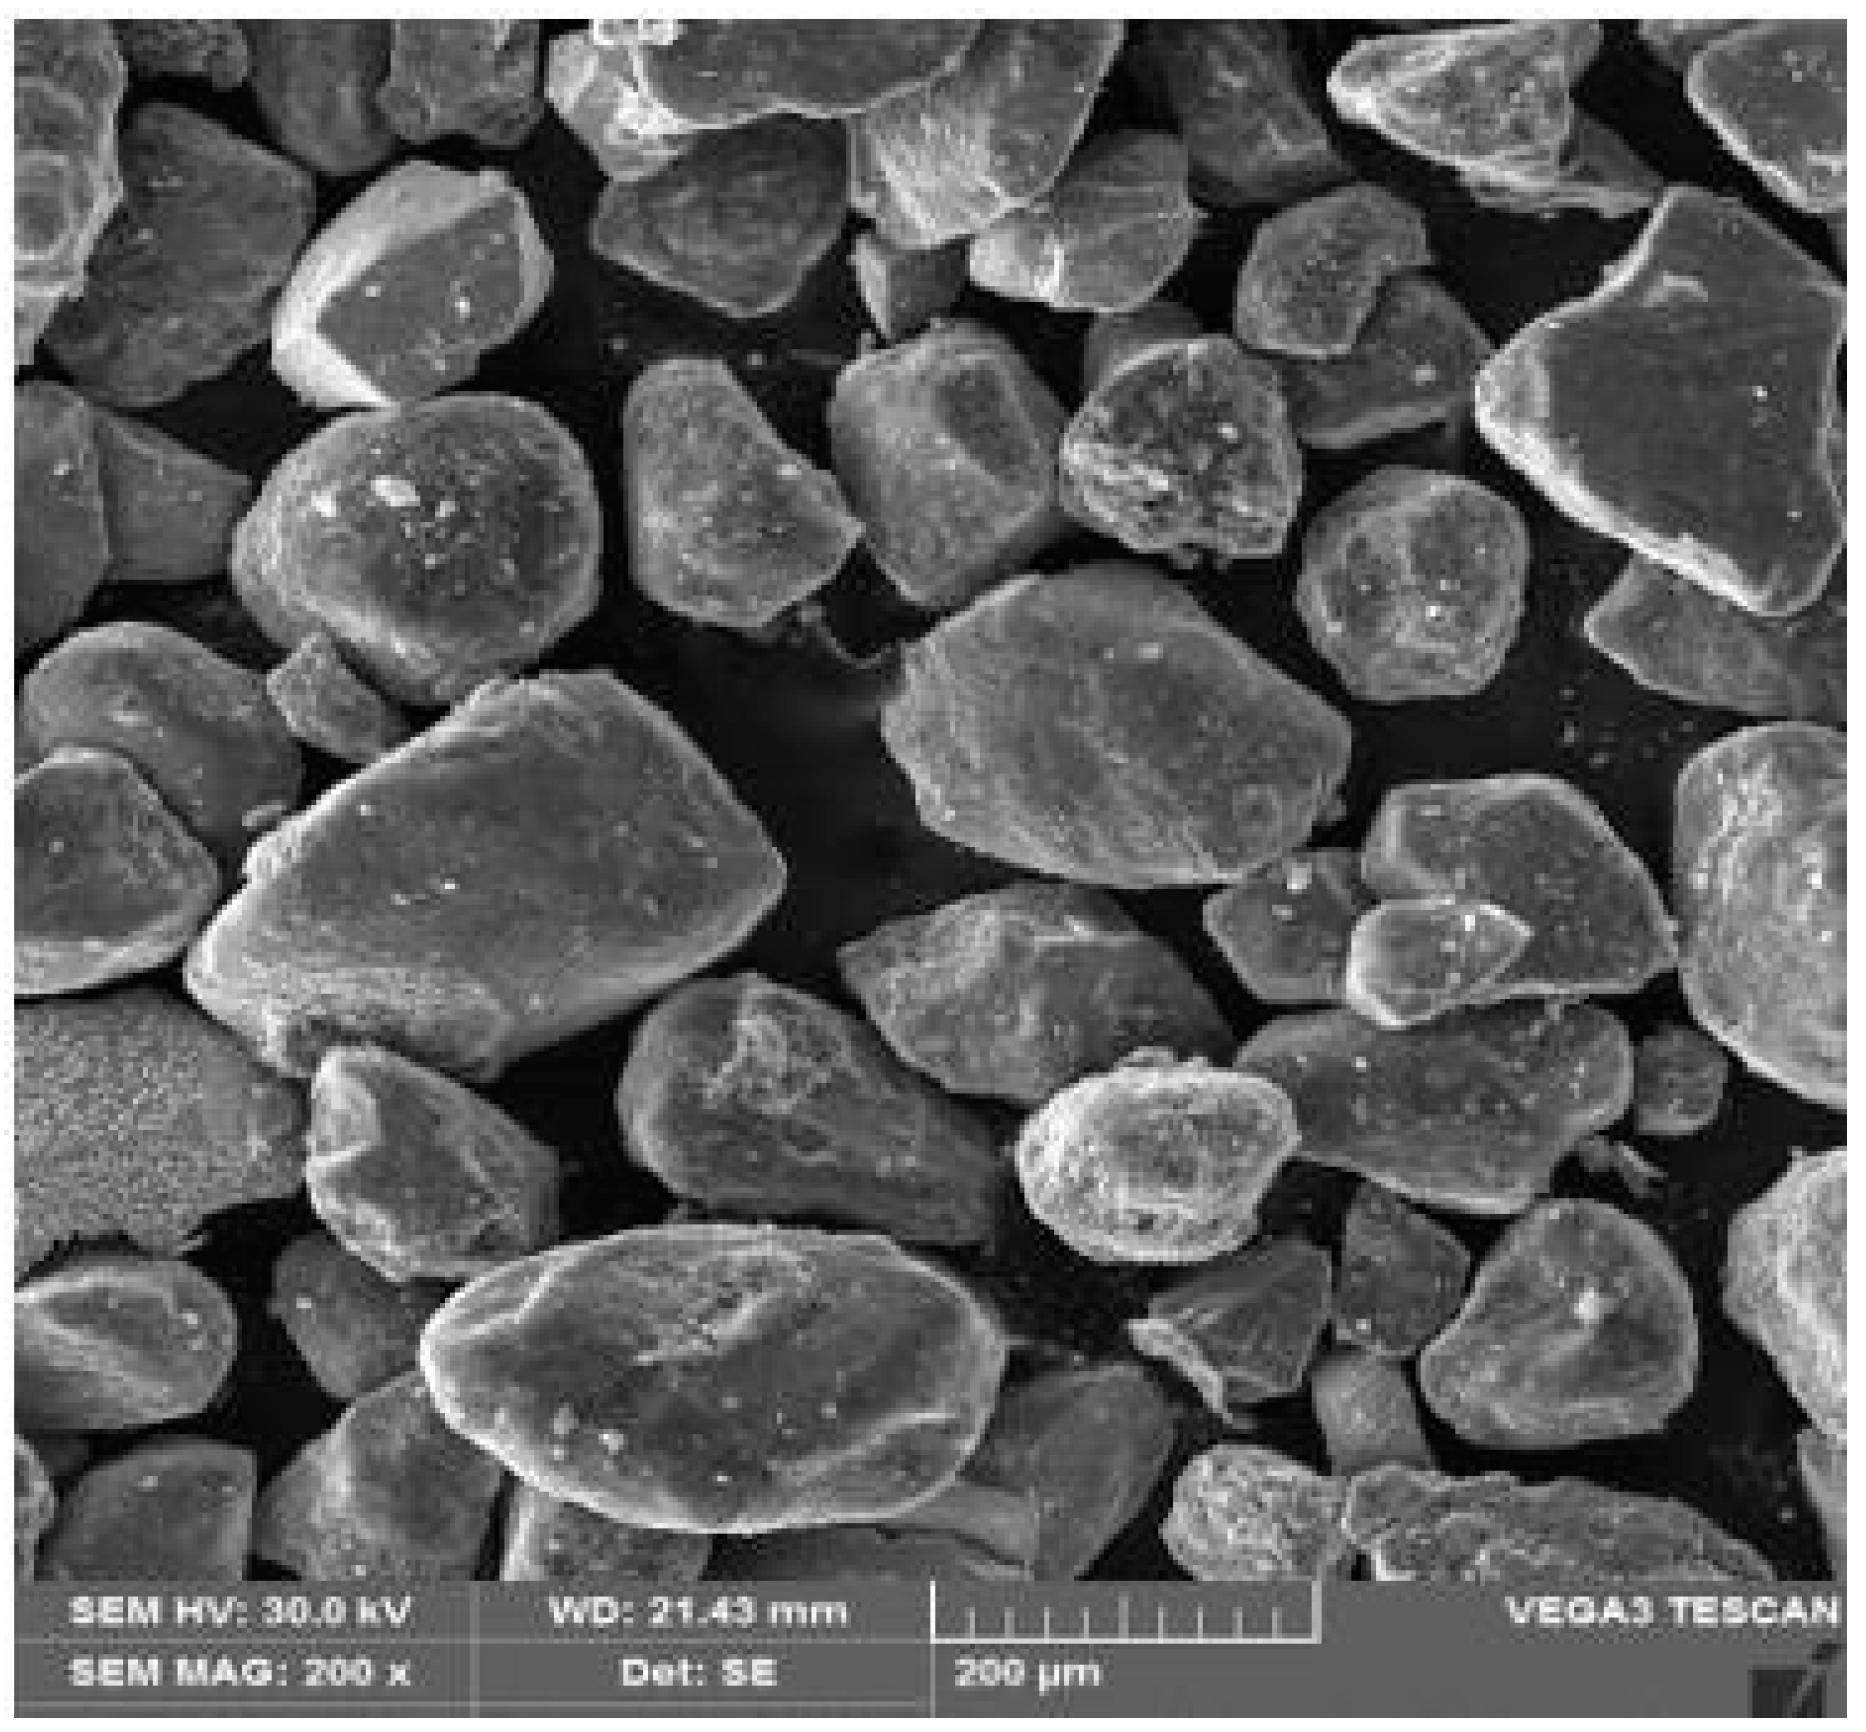
iii. Scanning Electron Microscopy (SEM). Imaging was utilized to take pictures of the grains magnified at several levels. Images of the two clay-bonded and three chemically bonded sands used in this study represent WFS01 to WFS05. The grain sample images, which were taken at 100× and 200× magnification, are presented in Figure 8, Figure 9, Figure 10, Figure 11, Figure 12, Figure 13, Figure 14, Figure 15, Figure 16, Figure 17 and Figure 18.
All the magnification results served a dissimilar purpose. The images taken at 100× magnification (WFS01 to WFS05) were envisioned to determine the grain sizes.
There are four shapes which are identifiable for WFS grains: compound, angular, round, and sub-angular shape [18]. The present study revealed that the size and shape of the WFS varied from 311 µm to 973 µm. The dissimilarity may be ascribed to the particle gradation variation, fine content, grain shapes, and sand mineralogy. The results of the SEM grain size distribution are consistent with the sieve analysis and the fineness modulus of the WFS. The waste sand streams (WFS01, WFS02, and WFS03) were relatively uniform with most of the sizes ranging between 0.600 mm and 0.150 mm [21,52].
The images taken at 200× magnification was used to quantify characteristics such as angularity, form, and texture of the different grains. The SEM results showed features related to morphological, mineralogical, and chemical characteristics of the grains, which constituted the WFS. Morphologically, angular grains with apparently compact surfaces and attached smaller particles with some discontinuities were observed in all samples when SEM with the electron backscattering diffraction technique was used. The results showed likely deposits of metallic elements that were melted and casted in molds made of sands. It was apparent that the sea coal/bentonite coating was disturbed. It is also likely that the coating was disturbed due to the sand grain abrasion during the recovery of the sands and breaking of molds. This probably occurred as a result of dehydroxylation and dehydration of the clays, while the sea coal underwent the thermal decomposition process. Other organic additives and sea coal underwent thermal decomposition within the molds, resulting in volatile compound formation [66]. Dehydroxylation and dehydration of bentonite are endothermic processes and correspond to a loss of mass [67]. Organic remains could exist in WFS as a result of organic binder usage, although most organic binder portions are shaken away or burned in the molding processes [21].
The key elements identified from both samples were silicon, potassium, titanium, magnesium, iron, and calcium. The results are consistent with the XRD analysis of WFS.
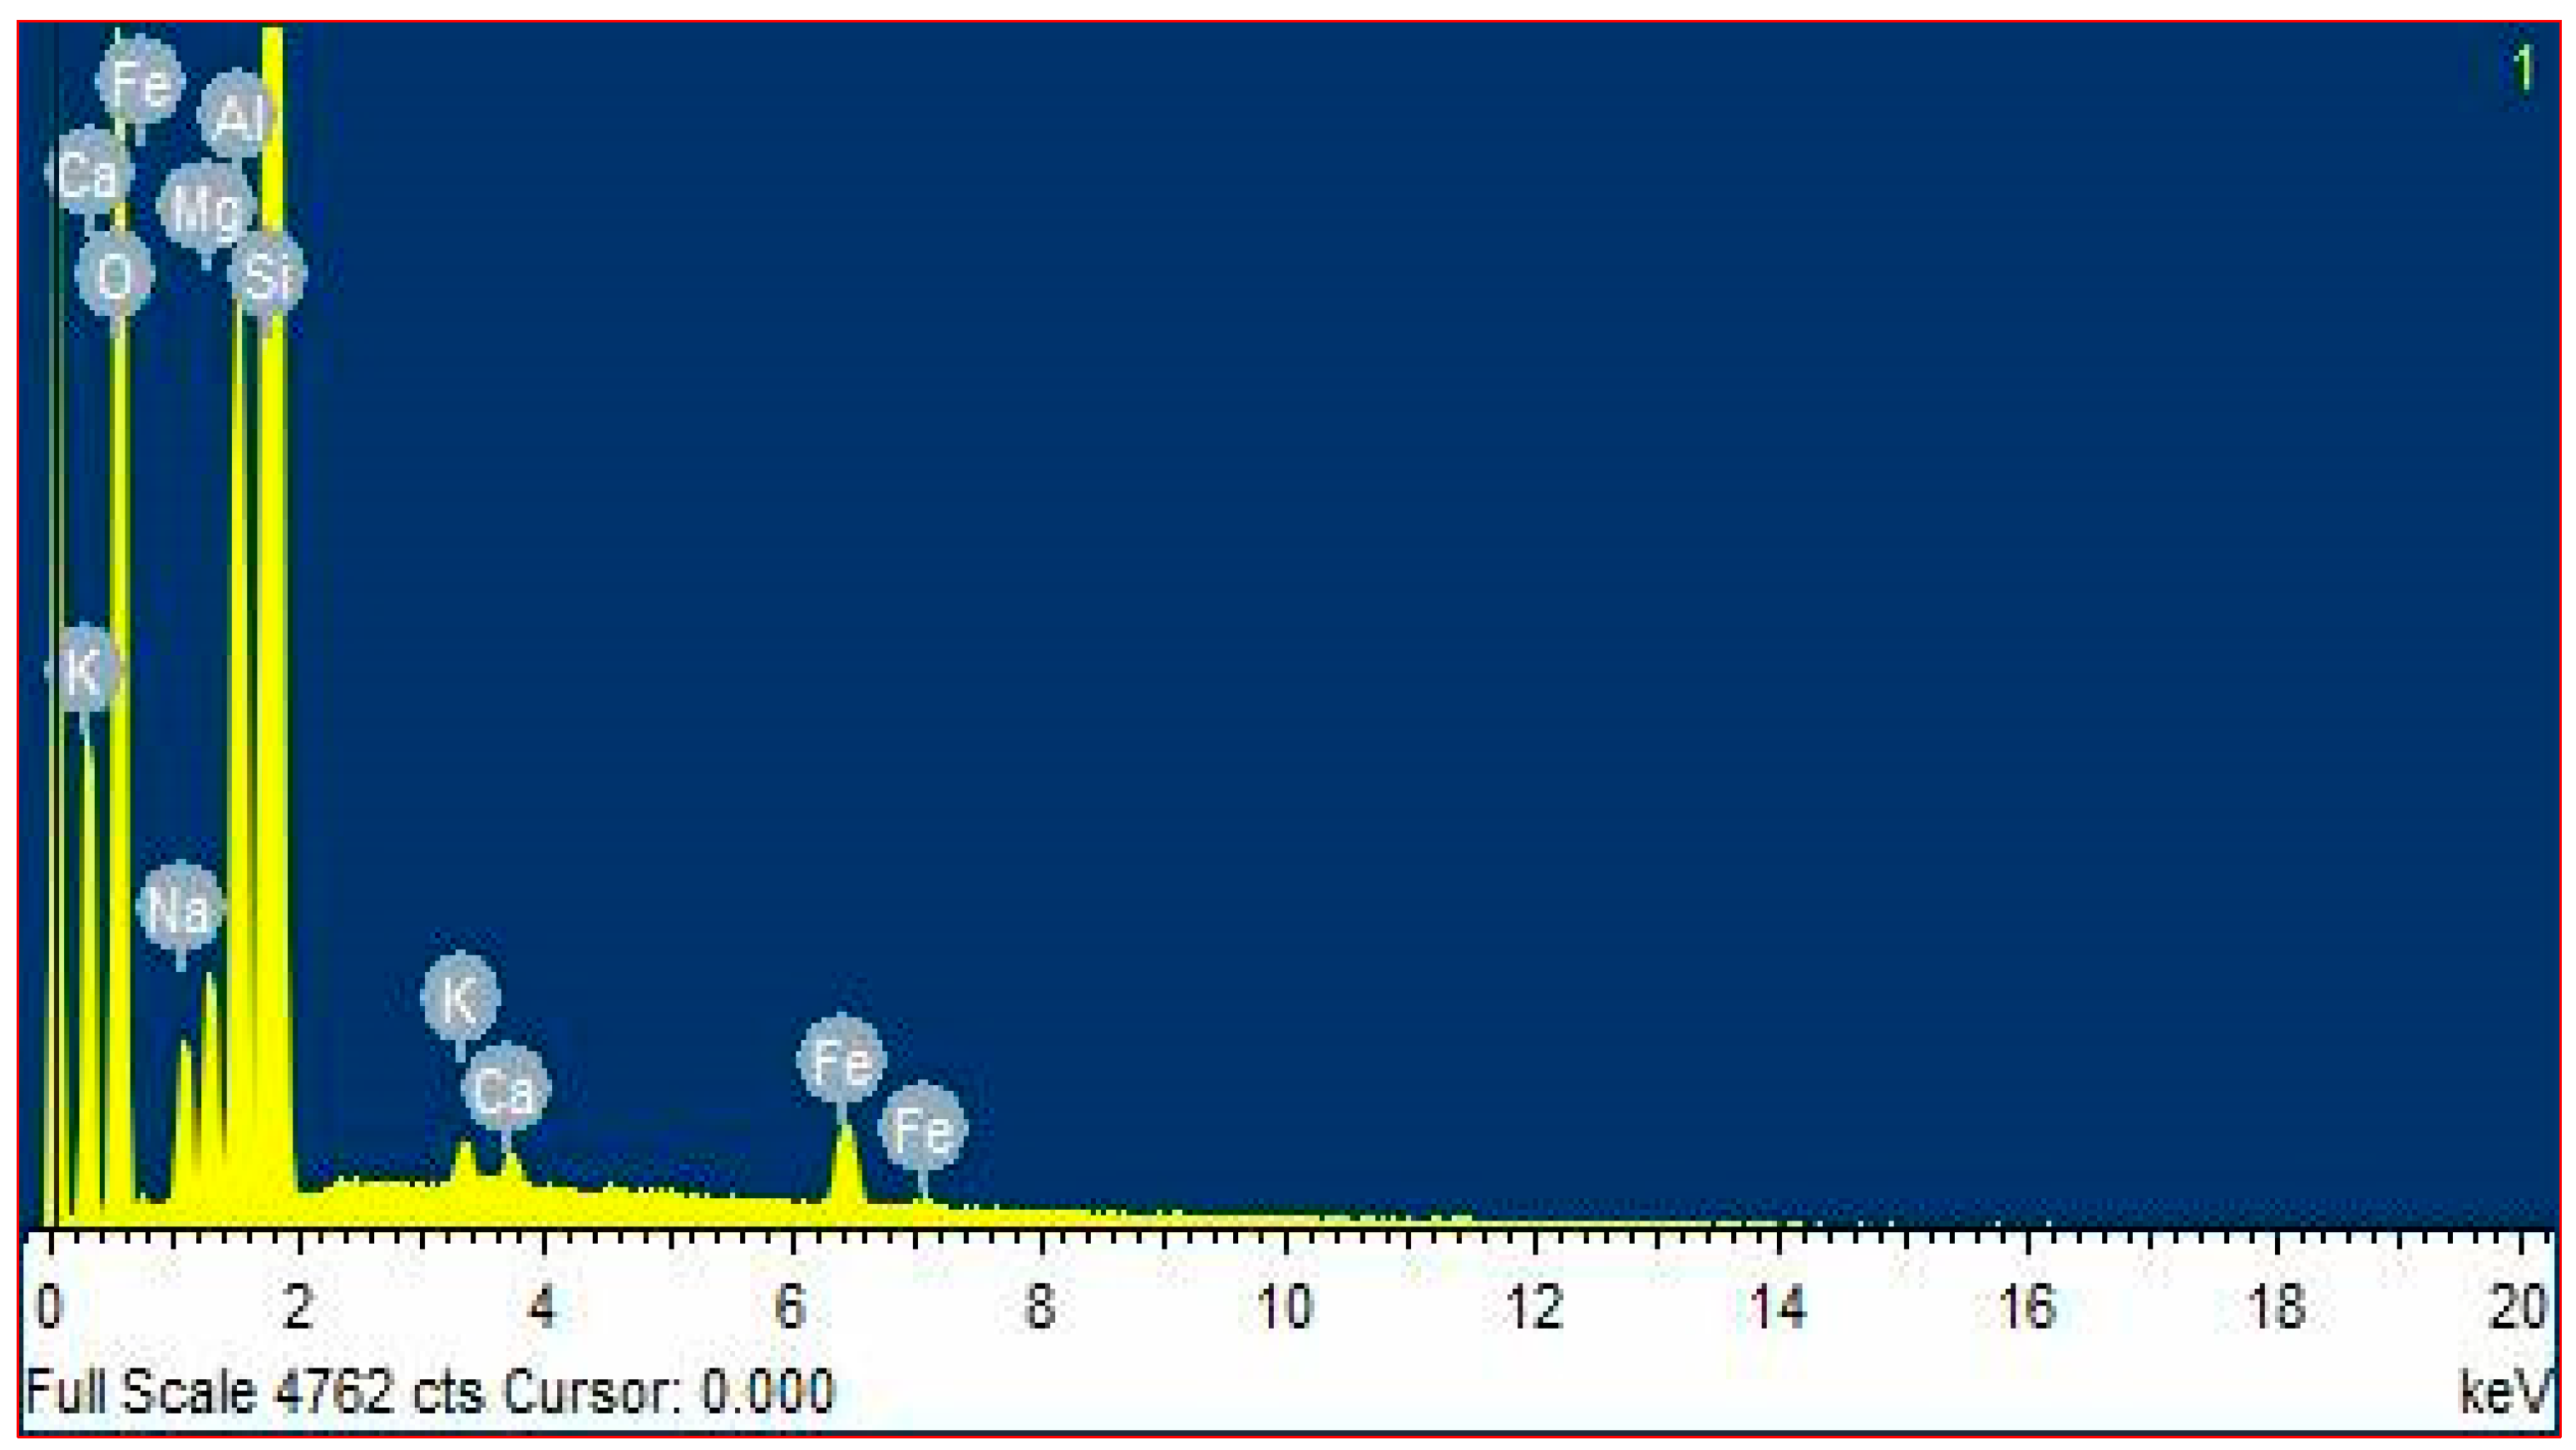
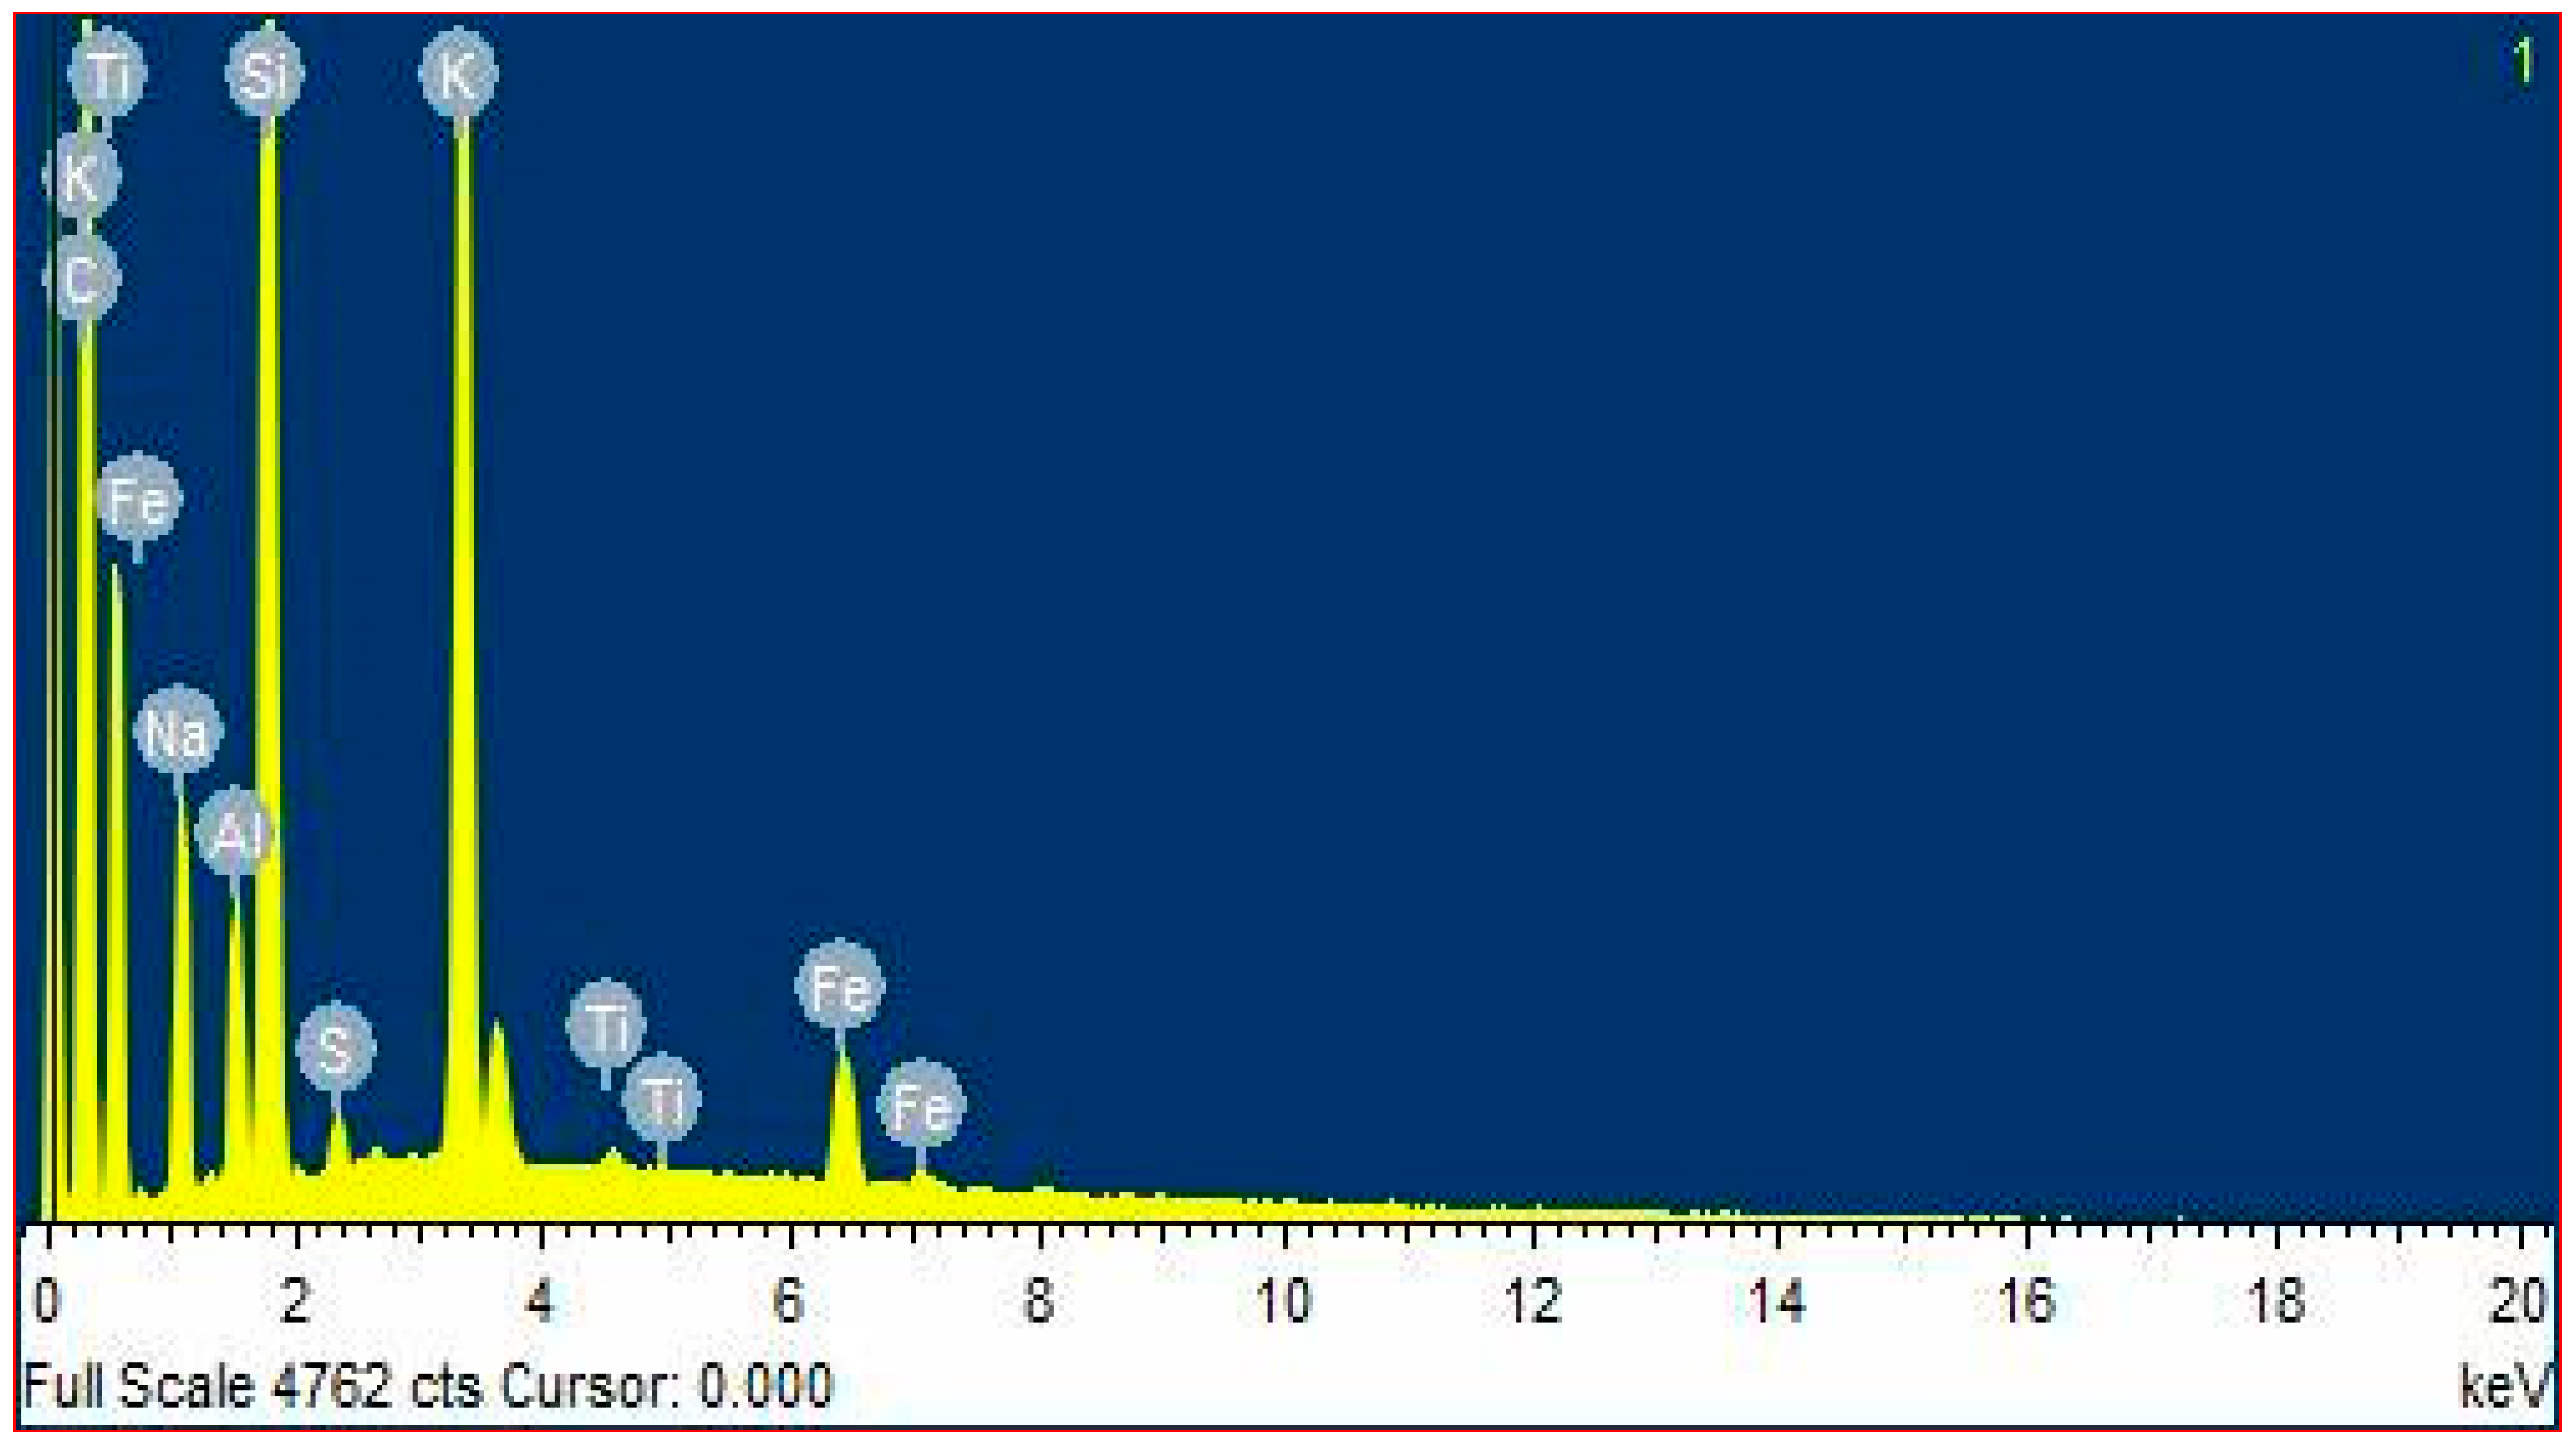
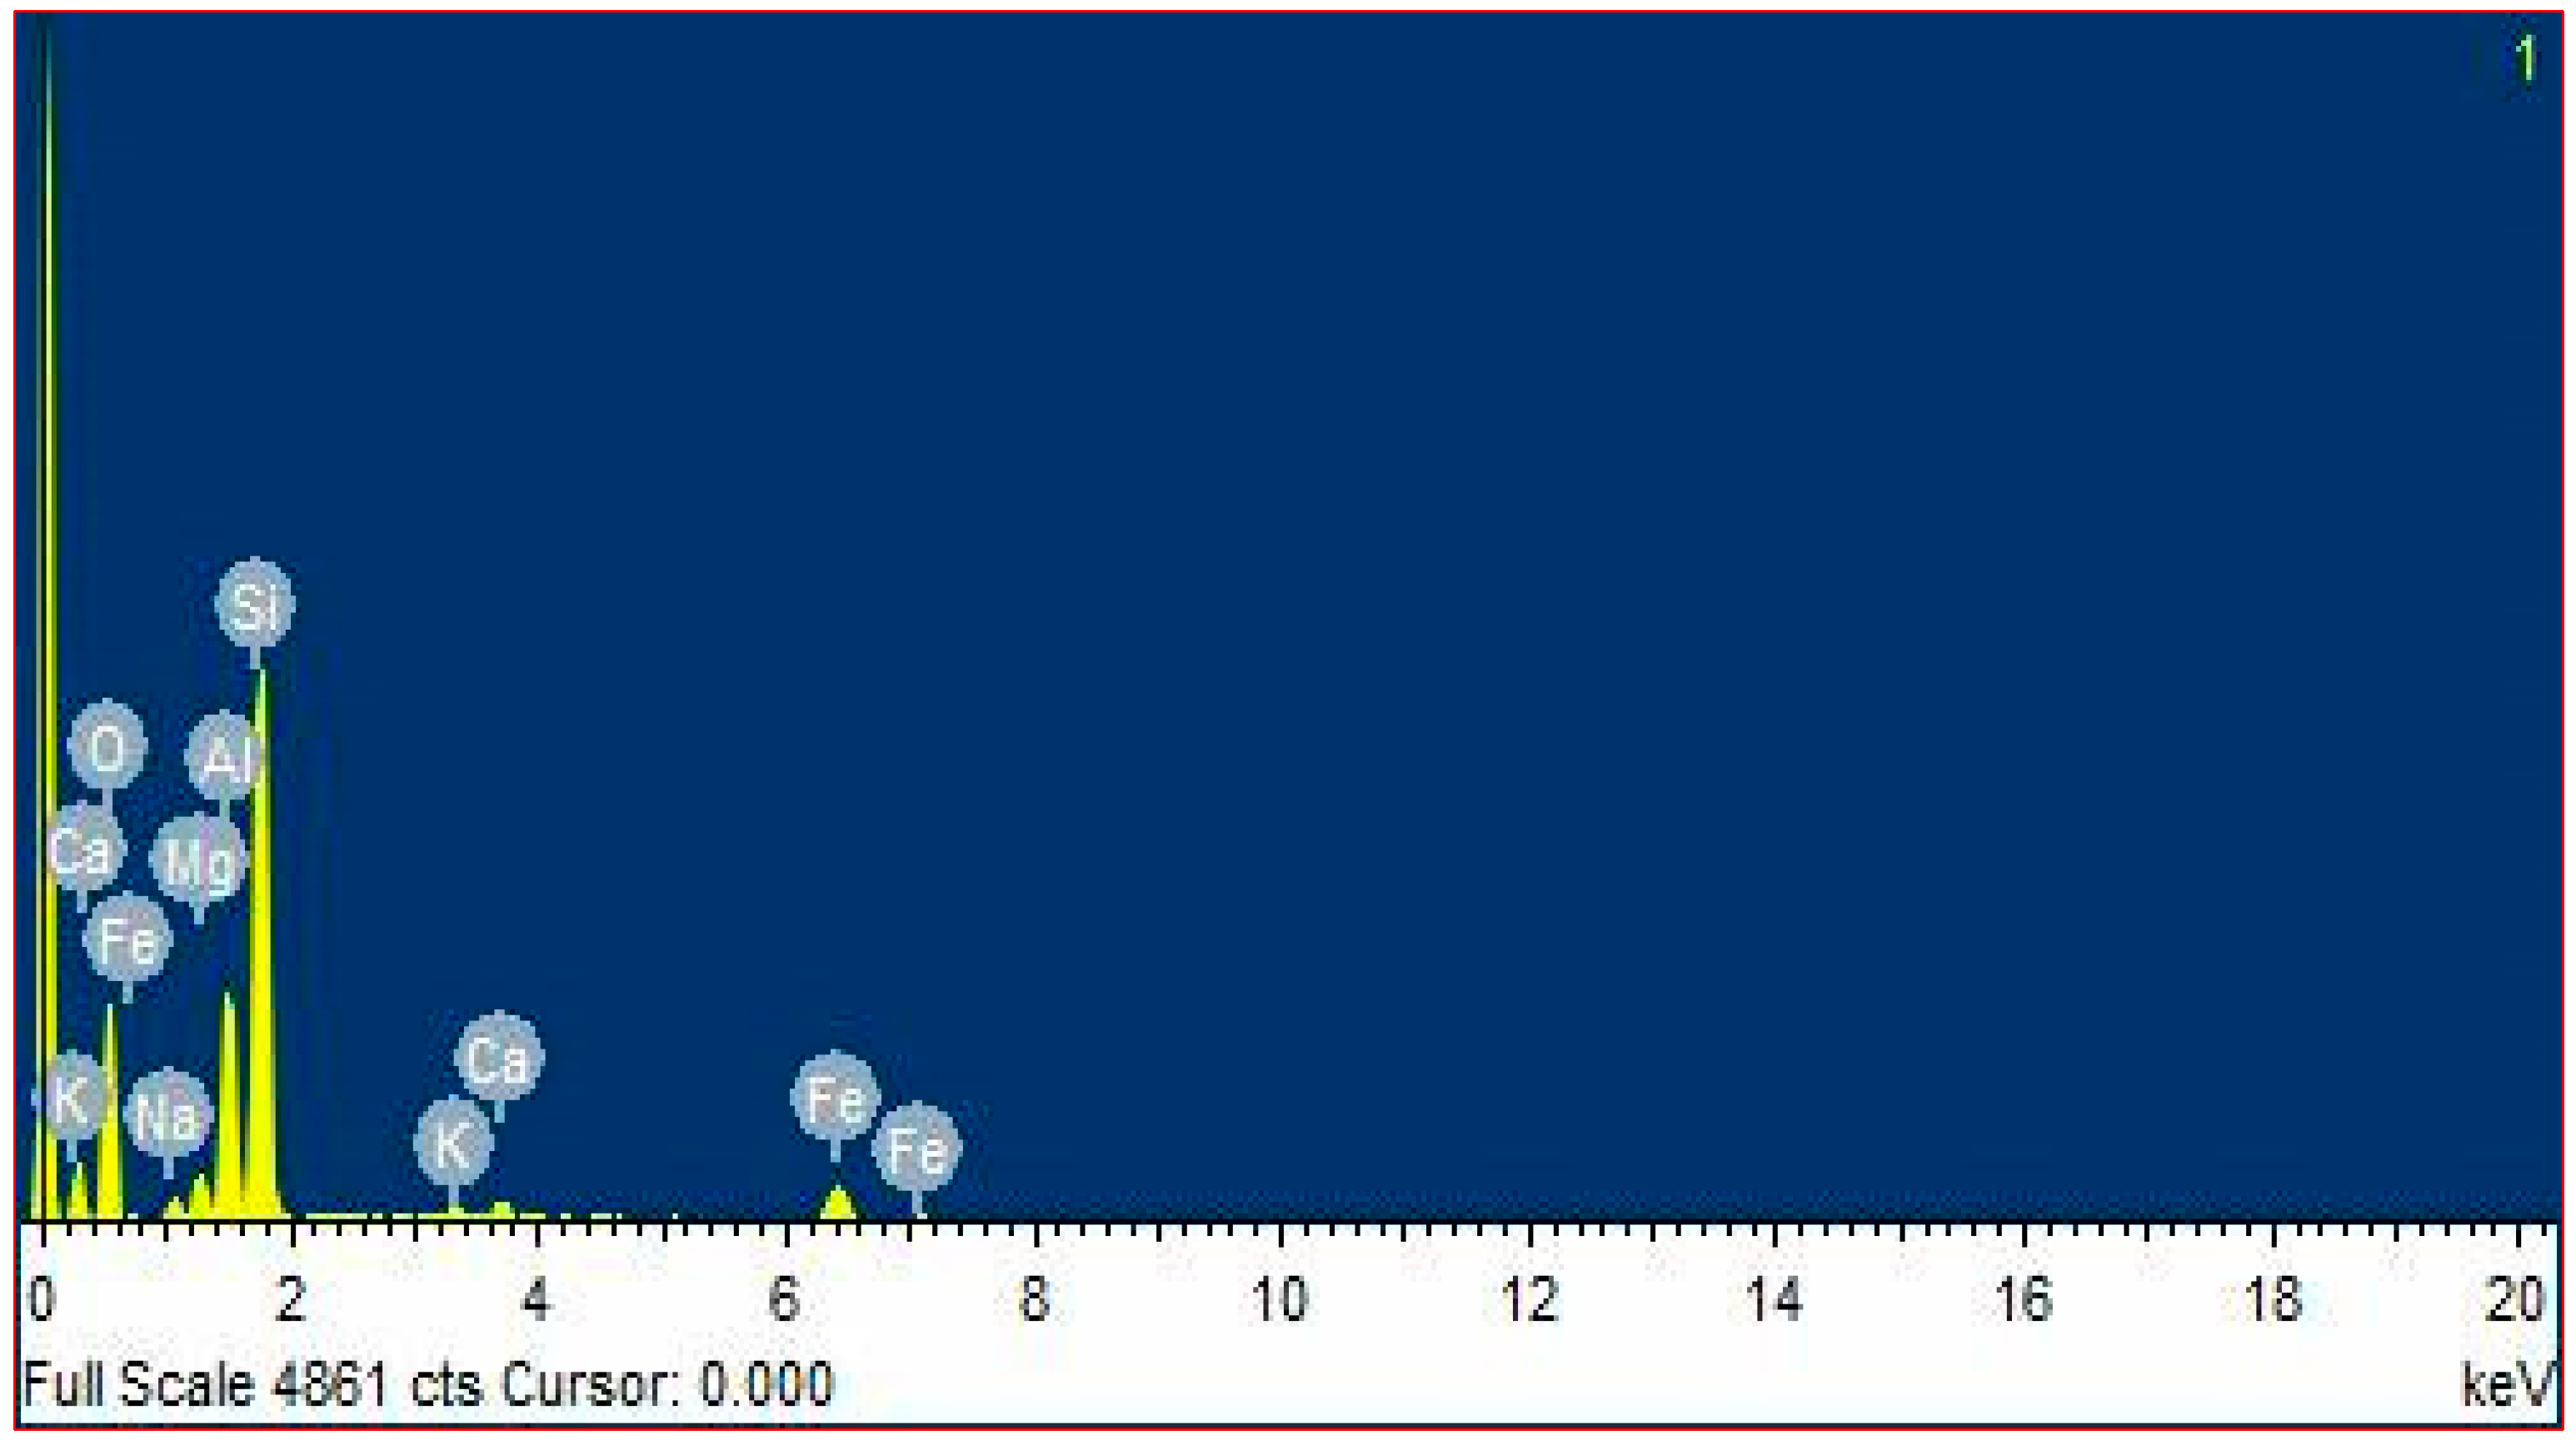
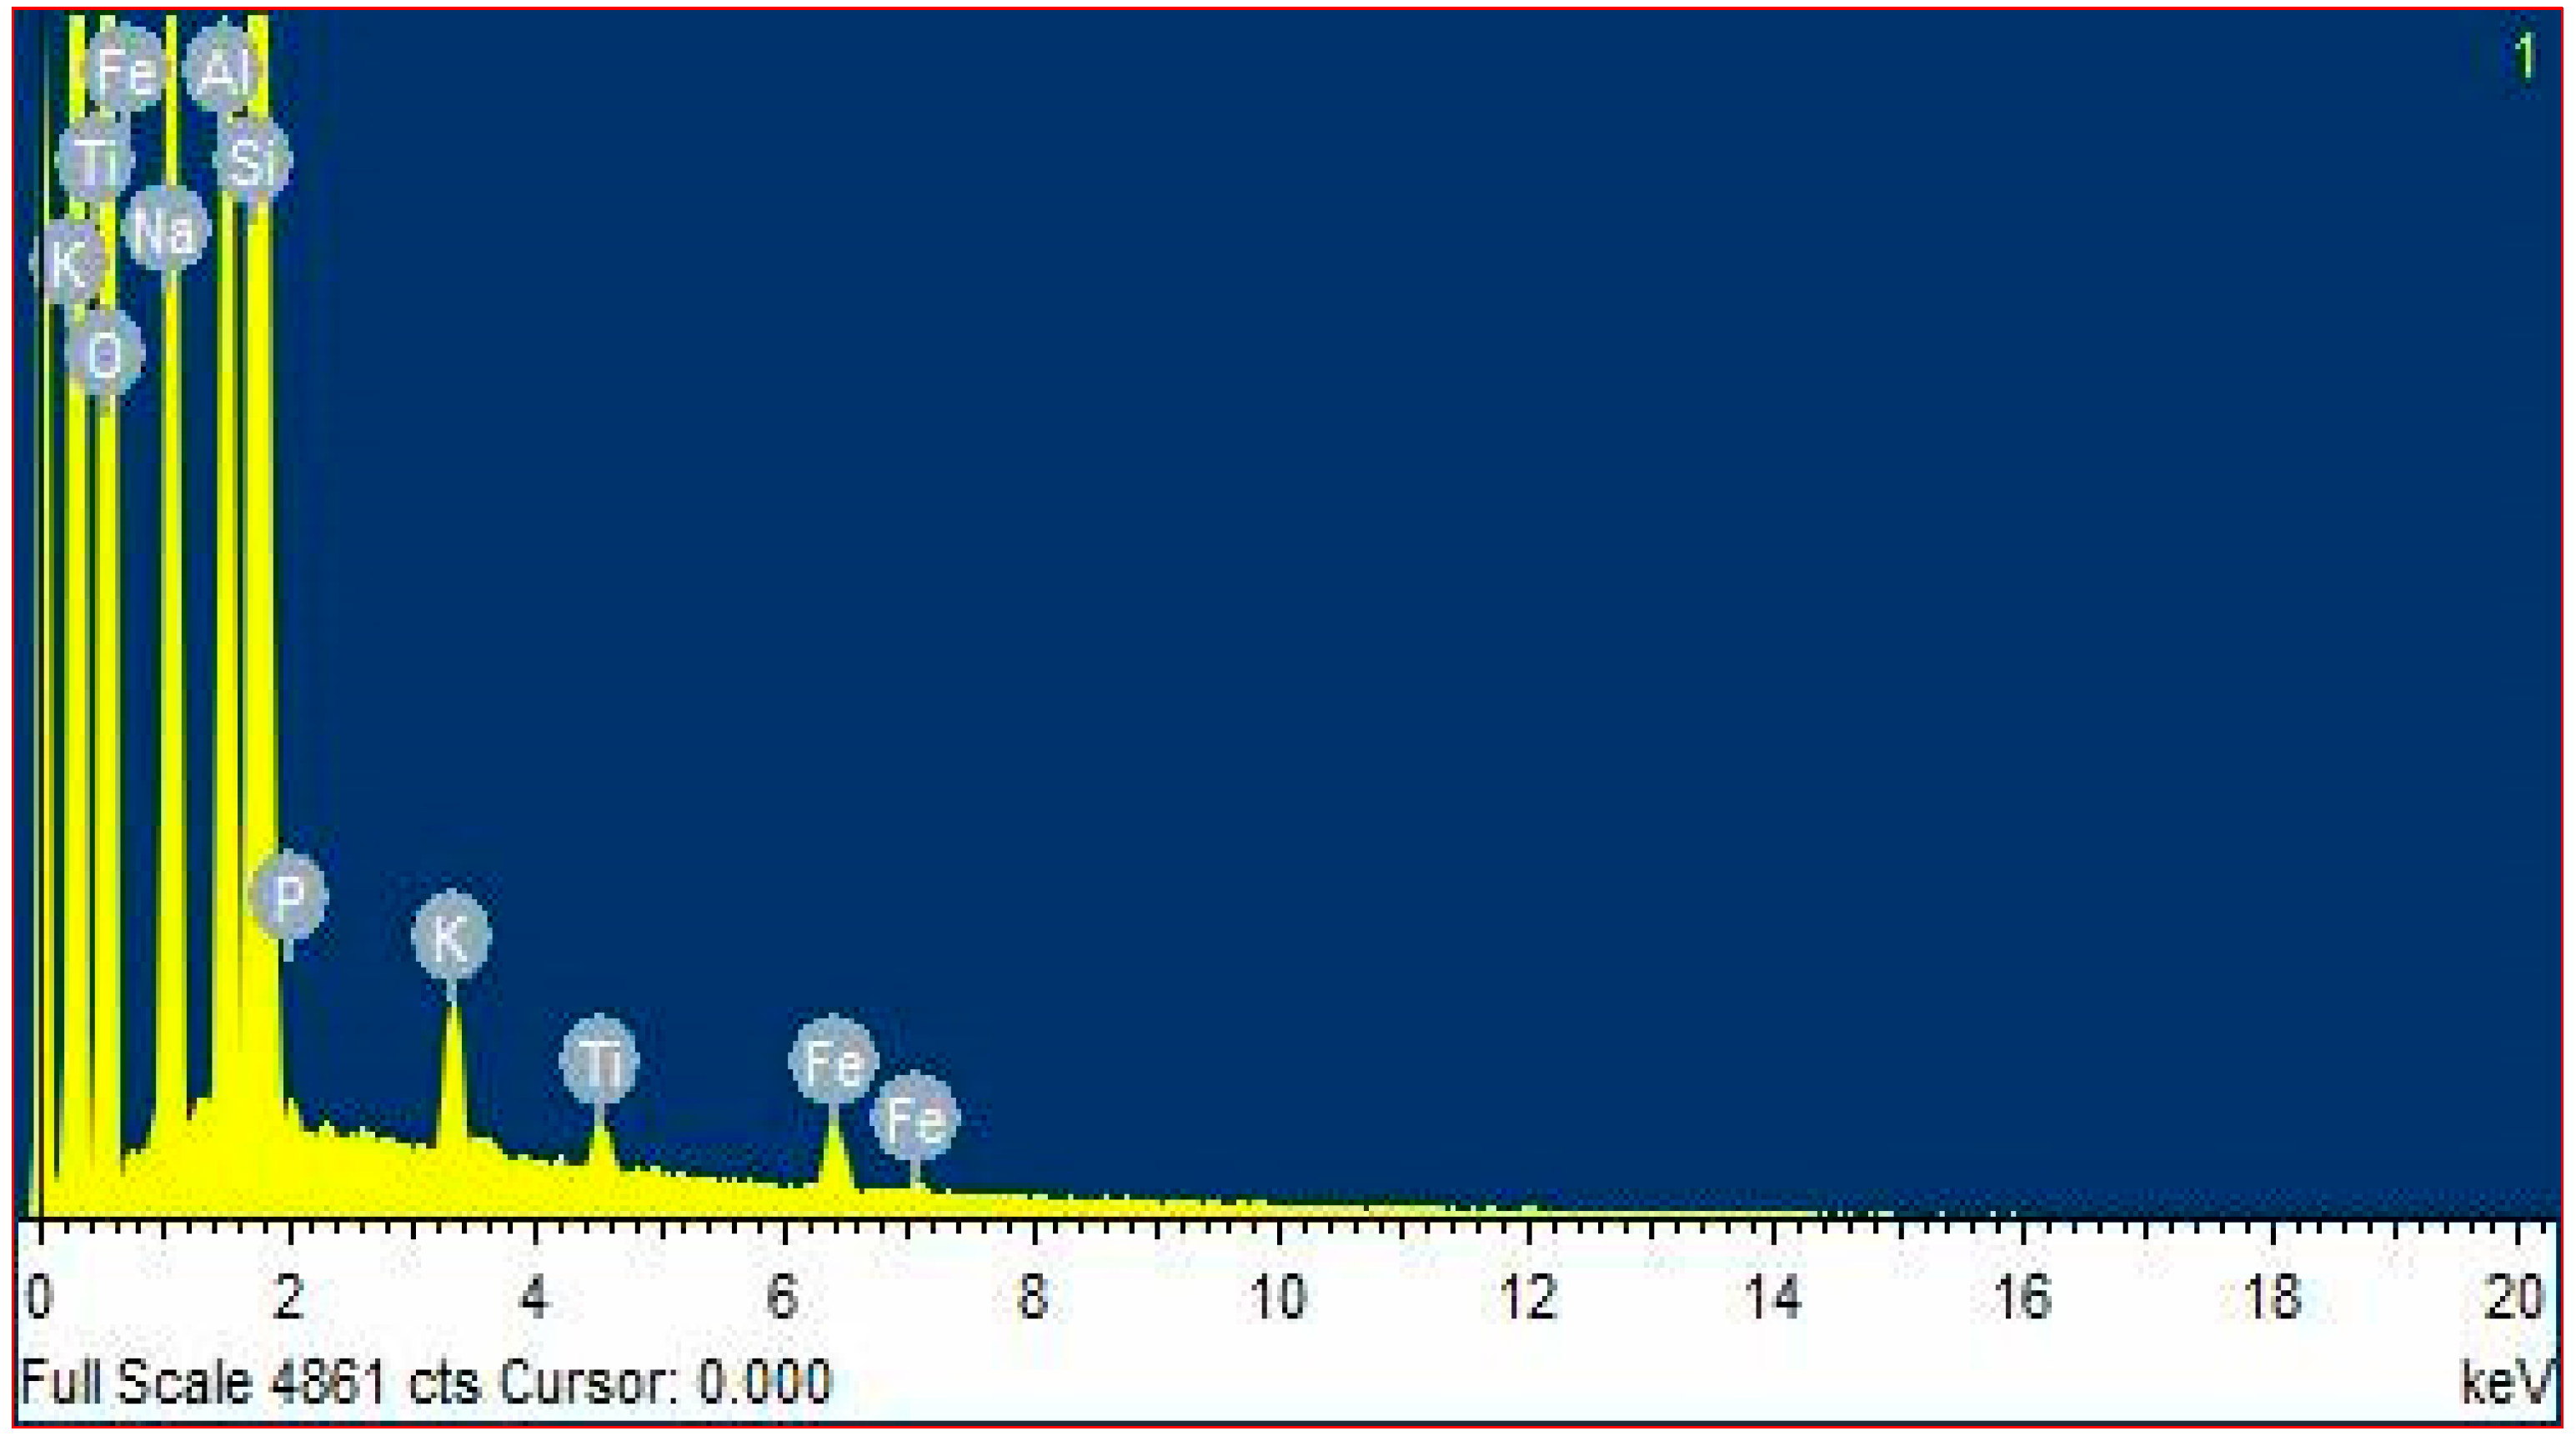
iv. Energy-Dispersive X-ray Spectra (EDS). The spectra obtained from qualitative chemical analysis of all the samples (WFS01 to WFS05) are presented in Figure 19, Figure 20, Figure 21, Figure 22 and Figure 23. For mineralogy and specific morphology, the presence of rounded grains showed a silica component of quartz in the spectrograms, with deposits which were formed during the production of alloys in the foundry. The results obtained by EDS highlight the high contents of silica, potassium, titanium, iron, magnesium, and calcium, with a high oxygen content in lieu of their oxide forms. The results of the EDS correlated with the XRD records, where the greatest protuberant peaks were silica (SiO2), aluminum (Al2O3), and hematite (Fe2O3).
v. pH. These results are vital in the assessment of sand compatibility with applied resins. In general chemistry, the pH scale indicates whether a substance is an alkali or an acid and to what degree. The pH of an alkali is between 14 and 7, while the pH of an acid is less than 7. The pH results highlighted that both types of WFS used in this study possessed a specified pH level of strong alkalinity and pose no threat to the natural environment; hence, they were not contaminated with sea salts.
The clay-bonded sand (samples WFS01 and WFS03) and chemically bonded sand (samples WFS02, WFS04, and WFS05) showed variation in their results as presented in Table 18. The clay-bonded sands, exhibited relatively lower pH values of 8.88 and 8.78, compared to the chemically bonded WFS, which exhibited pH values ranging from 9.89 to 9.34. The slightly lower pH values of the clay-bonded sands might be due to the acidic cation (binder) presence and type of metal cast, as noted in the SEM/EDS analysis. The results are in agreement with a past investigation report, whereby waste sand was not corrosive when compared to the local South Africa pH regulations [68]. Due to the presence of phenols, some WFS could be corrosive to metal [23]. This raised concerns that the infiltration of precipitation over built-up stocks could assemble leachable segments, resulting in the discharge of phenol into surface water supplies or ground water supplies. Previous investigations [68,69] revealed that WFS pH varied from 4 to 12, depending solely on the type of binder and cast metal. A pH value ranging from 6.7 to 10.2 was observed for 39 WFS samples from steel, iron, and aluminum, which were analyzed for their chemical and physical properties [18]. The results of the pH of the five WFS samples are presented in Table 18.
4. Conclusions
The five WFS samples, comprising two green sands and three chemically bonded sands, were analyzed physically and chemically with a view to assess their suitability for use in concrete. The results of the study show that the two types of WFS display different values of physical and chemical properties. The physical and chemical properties of the chemically bonded WFS are closely related to those of natural sand (fine aggregate) for concrete use.
The physical results of the five WFS analyzed indicated that both green sand samples (WFS01 and WFS03) were confirmed to contain a relatively high clay/silt content of up to 13% and 26%, due to the inclusion of bentonite utilized for casting processes. According to Table 10 and Figure 2 and Figure 6, the chemically bonded sample (WFS05) comprised unsuitable grading, as it contained unacceptably high fine content and may not be blended with other fine aggregates. Samples WFS02 and WFS04 displayed acceptable grading results as a fine aggregate replacement for concrete use. In addition, the Cu values of all the samples were above the acceptable range, while the Cc values of the chemically bonded samples did not comply with the relevant standard. However, the WFS included in this investigation generally met the grading limit criteria of SANS 1083: 2008 [47] and had similar SEM results. The pH values of both sand types showed that the WFS was not corrosive and harmful to health and the environment, as all recorded values were found to be within the stipulated range. A slight film coating on the grain was found in the SEM/EDS analysis, which shows that most portions of sea coal dust and binder resins were burned or shaken away during casting processes. The XRF and XRD results revealed that the WFS principally consisted of silicon oxide (silica). This provides information about the general molding process, in which the molding system (chemically bonded and green sand) and the new mineralized phases can be determined. The metallic traces might be correlated to the nature of metal cast formed at the specific molding facility.
Therefore, the WFS included in this investigation may be suitable for use as a partial or full replacement of the natural sand in concrete. However, the suitability can only be confirmed after carrying out further tests like workability, strength, and durability tests on concretes containing WFS as a partial/full replacement of fine aggregate.
In summary, processes of casting played a significant part in establishing the dissimilarity of the physical and chemical properties of the examined WFS samples. A range of casting processes are utilized in the present foundry facilities, featured primarily in the areas of refractory material prototypes, binders, metal types, binding systems, additives, mold repossession operations, and core. These factors influence the redesigning of virgin foundry sand process into WFS. Additionally, dissimilar metal molding facilities utilize varied particle sizes for foundry sands, e.g., coarser sands for steel facilities and finer sands for non-ferrous facilities. Despite the undistinguishable procedures of molding, WFS comparable in physical characteristics is formed. If this is not the case, the discarding of composites probably harmfully increased the variation in WFS physical properties.
Future studies following on the current research on WFS could look into strength and durability properties of concrete with partial/full utilization of WFS as a replacement for sand. The strength and durability properties of the prototype products in construction use require further testing to determine their applicability in various areas. These innovative applications could result in recycling of waste, putting waste to use, thereby leading to an eco-sustainable environment. Prototype products in WFS for further testing could include blocks, hollow-core blocks, interlocking paver blocks, panels, and roofing tiles, among other products used for low-cost housing and construction.
Author Contributions
Project conceptualization, A.O. and G.F.; research methodology, P.I., G.F., and A.O.; experiments and analysis, P.I., G.F., and A.O.; writing and editing, P.I., G.F., and A.O.
Funding
This research was part of the ongoing projects on “Innovative Applications of WFS in Built Environment Sector” and “Planning for Waste Management in African Cities”. The funding support received from the University of Johannesburg for the successful completion of the research work is greatly appreciated.
Acknowledgments
The authors acknowledge the WFS material support provided by the foundry industries based in Gauteng (Auto Industrial Isando Foundry, Guestro Casting Machining, Forbes Bros. Foundry, Johannesburg Foundry Sinvac, and Thomas Foundry). The support from the Metal Casting Division, South African Institute of Foundrymen, Department of Metallurgy is greatly appreciated.
Conflicts of Interest
The authors declare no conflicts of interest.
References
- Foundry Industry Recycling Starts Today (FIRST). Foundry Sand Facts for Civil Engineers; Federal Highway Administration Environmental Protection Agency: Washington, DC, USA, 2004.
- Siddique, R.; de Schutter, G.; Noumowe, A. Effect of used-foundry sand on the mechanical properties of concrete. Constr. Build. Mater. 2009, 23, 976–980. [Google Scholar] [CrossRef]
- Hunt, J. Most of SA’s Waste Is Still Going to Landfill Sites Instead of Being Recycled, Mpact Recycling Operations in Tulisa Park, Southeast of Johannesburg. 2018. Available online: https://www.businesslive.co.za/bd/companies/2018-05-18-most-of-sas-waste-is-still-goingto-landfill-sites-instead-of-being-recycled/ (accessed on 30 July 2018).
- Davies, J. The Impact of IPAP on the Foundry Industry. 2015. Available online: https://www.thedti.gov.za/parliament/2015/SAIF.pdf (accessed on 30 July 2018).
- 50th Census of World Casting Production, Global Casting Production Stagnant. 2016. Available online: http://www.foundryinfo-india.org/statistics/Census-2016-Modern-Casting.pdf (accessed on 30 July 2018).
- Department of Environmental Affairs, National Environmental Management. Waste Act, 2008 (Act No. 59 of 2008), Government Gazette, 2–92. Available online: https://www.environment.gov.za/sites/default/files/legislations/nema_amendment_act59.pdf (accessed on 27 July 2018).
- EI-Mohamadi, A. A Collective Approach towards Green Foundries in South Africa. MCTS Colloquium 2011. National Foundry Technology Network: Johannesburg, South Africa; Available online: https://www.slideshare.net/NFTN/nftn-collective-approach-towards-green-foundries-in-southafrica (accessed on 27 July 2018).
- US EPA. Examining the Environmental Effect of Spent Foundry Sand. 2015. Available online: http://www.foundrymag.com/moldscores/epa-endorses-reuse-spent-foundry-sand (accessed on 26 July 2018).
- Dungan, R. Foundry Waste Beneficial to other Industries. 2013. Available online: http://www.engineeringnews.co.za/article/foundry-waste-beneficial-to-other-industries-201304-12 (accessed on 24 July 2018).
- Deng, A. Contaminants in waste foundry sands and its leachate. Int. J. Environ. Pollut. 2009, 38, 425–443. [Google Scholar] [CrossRef]
- Siddique, R.; Kaur, G.; Rajor, A. Waste foundry sand and its leachate characteristics. Resour. Conserv. Recycl. 2010, 54, 1027–1036. [Google Scholar] [CrossRef]
- Dungan, R.S.; Dees, N.H. The characterization of total and leachable metals in foundry sands. J. Environ. Manag. 2009, 90, 539–548. [Google Scholar] [CrossRef] [PubMed]
- U.S. Environmental Protection Agency. Risk Assessment of Spent Foundry Sands in Soil-Related Applications – Evaluating Silica-based Spent Foundry Sand from Iron, Steel and Aluminium Foundries; U.S. EPA Office of Resource Conservation and Recovery Economics and Risk Assessment Staff; U.S. Department of Agriculture-Agriculture Research Service; The Ohio State University and RTI International: Washington, DC, USA, 2014.
- Mohamadi, A.E. Bricks Forum, 2nd ed.; National Foundry Technology Network, South Africa Foundry Market: Beijing, China, 2012; p. 6. [Google Scholar]
- Padmalal, D.; Maya, K.; Sreebha, S.; Sreeja, R. Environmental effects of river sand mining: A case from the river catchment of Vembanad Lake, Southwest coast of India. Environ. Geol. 2008, 54, 879–889. [Google Scholar] [CrossRef]
- Singh, G.; Mehta, K.K.; Sharma, R.C.; Chawla, K.L.; Joshi, P.K.; Yaduvanshi, N.P.S. Sand Mining or no Mining in Agriculture Fields in Haryana; Technical Report; Central Soil Salinity Research Institute: Karnal, India, 2007; pp. 1–28.
- Siddique, R.; Gurpreet, S. Utilization of waste foundry sand (WFS) in concrete manufacturing. Resour. Conserv. Recycl. 2011, 55, 885–892. [Google Scholar] [CrossRef]
- Dayton, E.A.; Whitacre, S.D.; Dungan, R.S.; Basta, N.T. Characterization of physical and chemical properties of spent foundry sands pertinent to beneficial use in manufactured soils. Plant Soil 2010, 329, 27–33. [Google Scholar] [CrossRef]
- Carey, P.R.; Sturtz, G. Sand binder systems part IV-urethane binders. Found. Manag. Technol. 1995, 123, 25–29. [Google Scholar]
- Deng, A.; Tikalsky, P.J. Geotechnical leaching properties of flowable fill incorporating waste foundry sand. Waste Manag. 2008, 28, 2161–2170. [Google Scholar] [CrossRef]
- American Foundry Men’s Society. Alternative Utilization of Foundry Waste Sand; Final Report (Phase I); American Foundrymen Society Inc. for Illinois Department of Commerce and Community Affairs: Des Plaines, IL, USA, 1991. [Google Scholar]
- Johnson, C.K. Phenols in Foundry Waste Sand Modern Casting; American Foundrymen’s Society: Schaumburg, IL, USA, 1981. [Google Scholar]
- MNR. Mineral Aggregate Conservation Reuse and Recycling; Report for Aggregate and Petroleum Resources Section, Ontario Ministry of Natural Resources; John Emery Geotechnical Engineering Limited: Toronto, Canada, 1992. [Google Scholar]
- MOEE. Spent Foundry Sand—Alternative Uses Study; Report for Ontario Ministry of the Environment and Energy and the Canadian Foundry Association; John Emery Geotechnical Engineering Limited: Toronto, Canada, 1993.
- Ham, R.K.; Boyle, W.C.; Engroff, E.C.; Fero, R.L. Determining the Presence of Organic Compounds in Foundry Waste Leachates, Modern Casting; American Foundrymen’s Society: Schaumburg, IL, USA, 1989. [Google Scholar]
- Ontario Ministry of Transportation. Resistance of fine Aggregate to Degradation by Abrasion in the Micro-Deval Apparatus; LS-619; Ontario Ministry of Transportation: Toronto, ON, Canada, 1996.
- AASHTO. Standard Method of Test for Soundness of Aggregate by Use of Sodium Sulphate or Magnesium Sulphate, 14th ed.; AASHTO Designation: T104, Part II Tests; AASHTO: North Capitol Street, WA, USA, 1986. [Google Scholar]
- Javed, S.; Lovell, C.W. Use of Foundry Sand in Highway Construction; Department of Civil Engineering, Purdue University: West Lafayette, IN, USA, 1994. [Google Scholar]
- Pereira, F.; Nunes, A.; Segadães, A.; Labrincha, J. Refractory Formulations Made of Different Wastes and Natural Sub-Products. Key Eng. Mater. 2004, 264–268, 1743–1746. [Google Scholar] [CrossRef]
- Alonso-Santurde, R.; Andrés, A.; Viguri, J.R.; Raimondo, M.; Guarini, G.; Zanelli, C.; Dondi, M. Technological behaviour and recycling potential of spent foundry sands in clay bricks. J. Environ. Manag. 2011, 92, 994–1002. [Google Scholar] [CrossRef] [PubMed]
- Siddique, R.; Aggarwal, Y.; Aggarwal, P.; Kadri, E.H.; Bennacer, R. Strength, durability, and micro-structural properties of concrete made with used-foundry sand (UFS). Constr. Build. Mater. 2011, 25, 1916–1925. [Google Scholar] [CrossRef]
- Guney, Y.; Sari, Y.D.; Yalcin, M.; Tuncan, A.; Donmez, S. Re-usage of waste foundry sand in high-strength concrete. Waste Manag. 2010, 30, 1705–1713. [Google Scholar] [CrossRef]
- Guney, Y.; Aydilek, A.; Demirken, M. Geoenviromental behavior of foundry sand amended mixtures for highway sub base. Waste Manag. 2010, 26, 932–945. [Google Scholar] [CrossRef]
- Kleven, J.; Edil, T.; Benson, C. Evaluation of excess foundry system sands for use as sub-base material. Transp. Res. Rec. 2000, 1714, 40–48. [Google Scholar] [CrossRef]
- Siddique, R.; Noumowe, A. Utilization of spent foundry sand in controlled low-strength materials and concrete. Resour. Conserv. Recycl. 2008, 53, 27–35. [Google Scholar] [CrossRef]
- Naik, T.; Kraus, R.; Chun, Y.; Ramme, W.S.S. Properties of field manufactured cast concrete products utilizing recycled materials. J. Mater. Civ. Eng. 2003, 15, 400–407. [Google Scholar] [CrossRef]
- Dungan, S.R.; Kukier, U.; Lee, B. Blending foundry sands with soil: Effect on de hydrogenase activity. Sci. Total Environ. 2006, 357, 221–230. [Google Scholar] [CrossRef]
- Braham, A. The Use of Blended Recycled Foundry Sand in Hot Mix Asphalt; Interim Report; University of Wisconsin-Madison, Asphalt Research Group: Madison, WI, USA, 2002. [Google Scholar]
- Bakis, R.; Koyuncu, H.; Demirbas, A. An investigation of waste foundry sand in asphalt concrete mixtures. Waste Manag. Res. 2006, 24, 269–274. [Google Scholar] [CrossRef]
- Pereira, F.; Hotza, D.; Segadães, A.; Labrincha, J. Ceramic formulations prepared with industrial wastes and natural sub-products. Ceram. Int. 2006, 32, 173–179. [Google Scholar] [CrossRef]
- Rhee, S.; Lee, W. Characteristics of Spent Foundry Sand—Loess Mixture as Ceramic Support Materials. Mater. Sci. Forum 2006, 510–511, 378–381. [Google Scholar] [CrossRef]
- South Africa National Standard (SANS). 201:2008, Sieve Analysis, Fines Content and Dust Content of Aggregates; South African Bureau Standards Division: Pretoria, South Africa, 2008. [Google Scholar]
- TMH1: Standard Methods of Testing Road Construction Materials. 1986. Available online: https://www.worldcat.org/title/standard-methods-of-testing-road-construction-materials/oclc/15517642 (accessed on 2 January 2019).
- South Africa National Standard (SANS). 3001-GR20:2010, Civil Engineering Test Methods Part GR20: Determination of the Moisture Content by Oven-Drying; South African Bureau Standards Division: Pretoria, South Africa, 2010. [Google Scholar]
- South Africa National Standard (SANS). 5845:2006, Bulk Densities and Voids Content of Aggregates; South African Bureau Standards Division: Pretoria, South Africa, 2006. [Google Scholar]
- South Africa National Standard (SANS). 3001-AG23:2014, Civil Engineering Test Methods Part AG23: Particle and Relative Densities of Aggregates; South African Bureau Standards Division: Pretoria, South Africa, 2014. [Google Scholar]
- South Africa National Standard (SANS). 1083:2017, Aggregates from Natural Sources—Aggregates for Concrete; South African Bureau Standards Division: Pretoria, South Africa, 2017. [Google Scholar]
- ASTM D7348-13:2008, Standard Test Methods for Loss on Ignition (LOI) of Solid Combustion Residues. In Annual Book of ASTM Standards: USA; ASTM International: Philadelphia, PA, USA, 2008.
- USEPA. Soil and Waste pH, in Test Methods for Evaluating pH in Aqueous, Soil/Sediment, Solid and Waste Samples. Method 9045D; 2004. Available online: https://www.epa.gov/sites/production/files/2015-12/documents/9045d.pdf (accessed on 30 July 2018).
- IS 383, Specifications for Coarse and Fine Aggregates from Natural Sources for Concrete; Bureau of Indian Standards: New Delhi, India, 1970.
- Alexander, M.; Mindess, S. Aggregates in Concrete; Taylor and Francis: New York, NY, USA, 2005; p. 439. [Google Scholar]
- Basar, H.M.; Aksoy, N.D. The effect of waste foundry sand (WFS) as partial replacement of sand on the mechanical, leaching and micro-structural characteristics of ready-mixed concrete. Constr. Build. Mater. 2012, 35, 508–515. [Google Scholar] [CrossRef]
- Kleven, J.R.; Edil, T.B.; Benson, C.H. Evaluation of Excess Foundry System Sands for Use as Sub Base Material, Transportation Research Record 1714; Transportation Research Board: Washington, DC, USA, 2000; pp. 40–48. [Google Scholar]
- Naik, T.R.; Singh, S.S.; Ramme, W.B. Performance and leaching assessment of flowable slurry. J. Environ. Eng. 2001, 127, 359–368. [Google Scholar] [CrossRef]
- Abichou, T.; Edil, T.B.; Benson, C.H.; Bahia, H. Beneficial use of foundry by-products in highway construction. Geotech. Eng. Transp. Proj. 2004, 126, 715–722. [Google Scholar]
- ASTM D2487-06. Standard Practice for Classification of Soils for Engineering Purposes, Unified Soil Classification System; ASTM International: West Conshohocken, PA, USA, 2006.
- ASTM C 33; Standard Specification for Concrete Aggregates; American Society for Testing and Materials: Philadelphia, PA, USA, 2003.
- Winkler, E.S.; Bol’shakov, A.A. Characterization of Foundry Sand Waste; Chelsea Centre for Recycling and Economic Development University of Massachusetts: Chelsea, MA, USA, 2000. [Google Scholar]
- American Concrete Institute Committee 221. ‘Guide for Use of Normal Weight and Heavyweight Aggregates in Concrete’, ACI 221R-96 (Re-Approved 2001); American Concrete Institute Manual of Concrete Practice, American Concrete Institute: Farmington Hills, MI, USA, 2002. [Google Scholar]
- ASTM C 29:1997 Test Method for Bulk Density (“Unit Weight”) and Voids in; America Society for Testing and Materials: Philadelphia, PA, USA, 1997.
- Singh, G. Strength and Durability Studies of Concrete Containing Waste Foundry Sand. Ph.D. Thesis, Thapar University, Patiala, India, 2012; pp. 1–153. [Google Scholar]
- Siddique, R. Utilization of industrial by-products in concrete. Procedia Eng. 2014, 95, 335–347. [Google Scholar] [CrossRef]
- ASTM C 128. Standard Test Method for Specific Gravity and Absorption of Fine Aggregate; American Society for Testing and Materials: Philadelphia, PA, USA, 2001.
- Iloh, P.; Fanourakis, G.C.; Ogra, A. Characterisation of five different South African waste foundry sands to determine their suitability for use in concrete. In Proceedings of the 2017 9th International Conference on Advances in Science, Engineering, Technology & Waste Management (ASETMW-17), Parys, South Africa, 27–28 November 2017. [Google Scholar]
- Dash, M.K.; Patro, S.K.; Rath, A.K. Sustainable use of industrial-waste as partial replacement of fine aggregate for preparation of concrete—A review. Int. J. Sustain. Built. Environ. 2016, 5, 484–516. [Google Scholar] [CrossRef]
- Dungan, R.S.; Reeves, J.B., III. Pyrolysis of carbonaceous foundry sand additives: Seacoal and gilsonite. Thermochim. Acta 2007, 460, 60–66. [Google Scholar] [CrossRef]
- Holtzer, M.; Bobrowski, A.; Zymankowska-Kumon, S. Temperature influence on structural changes of foundry bentonites. J. Mol. Struct. 2011, 1004, 102–108. [Google Scholar] [CrossRef]
- Nyembwe, J.K.; Makhatha, M.E.; Madzivhandila, T.; Nyembwe, K.D. Characterization of South African waste foundry molding sand: Metallic contaminants. In Proceedings of the 2nd International Conference on Mining, Material and Metallurgical Engineering; Barcelona, Spain, 20–21 July 2015, 2015; Available online: http://hdl.handle.net/10210/14414 (accessed on 10 September 2018).
- Deng, A.; Hung, Y.T. Reuse of foundry sand as construction material. In Handbook of Environmental and Waste Management; Hung, Y., Wang, L.K., Shammas, N.K., Eds.; World Scientific Publishing Co. Pte. Ltd.: Singapore, 2014; pp. 491–524. [Google Scholar]
Figure 1.
Gradation curves of sieve and hydrometer analysis of waste foundry sand (WFS; WFS01 to WFS05).
Figure 1.
Gradation curves of sieve and hydrometer analysis of waste foundry sand (WFS; WFS01 to WFS05).

Figure 2.
Gradation curve of WFS01.

Figure 3.
Gradation curve of WFS02.

Figure 4.
Gradation curve of WFS03.

Figure 5.
Gradation curve of WFS04.

Figure 6.
Gradation curve of WFS05.

Figure 7.
X-ray diffractogram analyses of samples WFS01–WFS05.

Figure 8.
SEM image of sample WFS01 taken at 100× magnification.

Figure 9.
SEM image of sample WFS01 taken at 200× magnification.

Figure 10.
SEM image of sample WFS02 taken at 100× magnification.

Figure 11.
SEM image of sample WFS02 taken at 200× magnification.

Figure 12.
SEM image of sample WFS03 taken at 100× magnification.

Figure 13.
SEM image of sample WFS03 taken at 200× magnification.

Figure 14.
SEM image of sample WFS04 taken at 50× magnification.

Figure 15.
SEM image of sample WFS04 taken at 100× magnification.

Figure 16.
SEM image of sample WFS04 taken at 200× magnification.

Figure 17.
SEM image of sample WFS05 taken at 100× magnification.

Figure 18.
SEM image of sample WFS05 taken at 200× magnification.

Figure 19.
Energy-dispersive X-ray spectrum of sample WFS01.

| Elemental Composition Ratio | Na K (Na2) | Mg K (MgO) | Al K (Al2O3) | Si K (SiO2) | K K (K2O) | Ca K (CaO) | Fe K (FeO) | O | Total |
|---|---|---|---|---|---|---|---|---|---|
| Weight (%) | 1.91 | 1.66 | 5.16 | 38.65 | 0.28 | 0.25 | 1.20 | 1.20 | 100 |
The peak of iron is distinctive, followed by the aluminum, calcium, magnesium, and silicon peaks.
Figure 20.
Energy-dispersive X-ray spectrum of sample WFS02.

| Elemental Composition Ratio | C K (CO2) | Na K (Na2O) | Al K (Al2O3) | Si K (SiO2) | S K (SO3) | K K (K2O) | Ti K (TiO2) | Fe K (FeO) | O | Total |
|---|---|---|---|---|---|---|---|---|---|---|
| Weight (%) | 25.09 | 1.2 | 0.33 | 1.79 | 0.05 | 1.18 | 0.03 | 0.33 | 70.1 | 100 |
The peak of silicon is distinctive, followed by the titanium, potassium, sodium, and iron peaks.
Figure 21.
Energy-dispersive X-ray spectrum of sample WFS03.

| Elemental Composition Ratio | Na K (Na2) | Mg K (MgO) | Al K (Al2O3) | Si K (SiO2) | K K (K2O) | Ca K (CaO) | Fe K (FeO) | O | Total |
|---|---|---|---|---|---|---|---|---|---|
| Weight (%) | 2.16 | 2.68 | 11.05 | 30.32 | 0.53 | 0.99 | 3.80 | 48.48 | 100 |
The peak of silicon is distinctive, followed by the aluminum, calcium, magnesium, and iron peaks.
Figure 22.
Energy-dispersive X-ray spectrum of sample WFS04.

| Elemental Composition Ratio | Na K (Na2) | Al K (Al2O3) | Si K (SiO2) | P K (P2O) | K K (K2O) | Ti K (TiO2) | Fe K (FeO) | O | Total |
|---|---|---|---|---|---|---|---|---|---|
| Weight (%) | 15.29 | 4.74 | 31.76 | 0.25 | 0.65 | 0.27 | 0.55 | 46.50 | 100 |
The peak of aluminum is distinctive, followed by the iron, sodium, titanium, and potassium peaks.
Figure 23.
Energy-dispersive X-ray spectrum of sample WFS05.

| Elemental Composition Ratio | Na K (Na2) | Mg K (MgO) | Al K (Al2O3) | Si K (SiO2) | K K (K2O) | Ti K (TiO2) | Cr K (Cr2O3) | Fe K (FeO) | O | Total |
|---|---|---|---|---|---|---|---|---|---|---|
| Weight (%) | 6.19 | 0.92 | 3.65 | 21.20 | 25.17 | 0.67 | 0.92 | 3.97 | 37.37 | 100 |
The peak of potassium is distinctive, followed by the silicon, potassium, aluminum, and sodium peaks.

Table 1.
Foundries and their sample references.
| Foundries | Sample Reference |
|---|---|
| Isando Foundry | WFS01 |
| Forbes Bros. Founders | WFS02 |
| Guestro Casting and Machining | WFS03 |
| Johannesburg Foundry—rebranded as Sinvac casting | WFS04 |
| Thomas Foundry | WFS05 |
Table 2.
X-ray fluorescence (XRF) measurement conditions. CBO—cross-beam optics.
| X-ray | 40 kV, 30 mA | Scan Speed/Duration Time | 2.0000°/min. |
|---|---|---|---|
| Goniometer | - | Step width | 0.0100° |
| Attachment | - | Scan axis | 2 theta/ theta |
| Filter | K-beta filter | Scan range | 5.0000°–90.0000° |
| CBO selection slit | - | Incident slit | 2/3° |
| Diffracted beam mono. | - | Length limiting slit | - |
| Detector | Scintillation counter | Receiving slit #1 | Open |
| Scan mode | Continuous | Receiving slit #2 | 0.60 mm |
Energy source: copper; wavelength λ = 1.54; scanning range 5–90°.
Table 3.
Particle size distribution results of percentages passing (WFS01–WFS05). SANS—South African National Standard; WFS—waste foundry sand.
Table 3.
Particle size distribution results of percentages passing (WFS01–WFS05). SANS—South African National Standard; WFS—waste foundry sand.
| Total Mass: 125 g | ||||||
|---|---|---|---|---|---|---|
| Sieve Size (mm) | WFS01 (%) | WFS02 (%) | WFS03 (%) | WFS04 (%) | WFS05 (%) | SANS * |
| 4.750 | 100 | 100 | 100 | 100 | 100 | 90–100 |
| 2.000 | 100 | 100 | 100 | 99 | 100 | - |
| 1.180 | 100 | 100 | 99 | 98 | 100 | - |
| 0.600 | 98 | 97 | 94 | 49 | 100 | - |
| 0.425 | 92 | 87 | 87 | 20 | 100 | - |
| 0.300 | 71 | 64 | 73 | 10 | 99 | - |
| 0.150 | 21 | 12 | 42 | 4 | 52 | 5–25 |
| 0.075 | 13 | 3 | 26 | 2 | 11 | - |
| 0.050 | 10 | 2 | 21 | 2 | 7 | - |
| 0.040 | 8 | 2 | 15 | 1 | 4 | - |
| 0.026 | 8 | 2 | 10 | 1 | 3 | - |
| 0.015 | 7 | 2 | 8 | 1 | 3 | - |
| 0.010 | 6 | 2 | 8 | 1 | 3 | - |
| 0.0074 | 5 | 1 | 6 | 1 | 2 | - |
| 0.0036 | 4 | 0 | 4 | 1 | 1 | - |
| 0.0015 | 3 | 0 | 3 | 0 | 0 | - |
WFS01, WFS03—green sand; WFS02, WFS04, WFS05—chemically bonded sand; * SANS grading limit.
Table 4.
Particle size distribution (sieve and hydrometer analysis) of WFS01. FM—fineness modulus.
| Total Sample Mass: 125 g | ||||||
|---|---|---|---|---|---|---|
| Sieve Size (mm) | Mass of Sample Retained | % of Sample Retained | Cumulative % of Sample | % of Sample Passing | Reported % Passing | |
| 9.5 | 0 | 0 | 0 | 100 | 100 | |
| 4.75 | 0 | 0 | 0 | 100 | 100 | |
| 2 | 0 | 0 | 0 | 100 | 100 | |
| 1.18 | 0 | 0 | 0 | 100 | 100 | |
| 0.6 | 1.89 | 1.51 | 1.51 | 98.49 | 98 | |
| 0.425 | 8.59 | 6.87 | 8.38 | 91.62 | 92 | |
| 0.3 | 25.25 | 20.2 | 28.58 | 71.42 | 71 | |
| 0.15 | 62.51 | 50.01 | 78.59 | 21.41 | 21 | |
| 0.075 | 9.86 | 7.89 | 86.48 | 12.64 | 13 | |
| Pan | 0 | - | - | - | - | |
| Total | 108.1 | - | 203.54 | - | - | |
| FM | 1.2 | - | - | - | - | |
| Hydrometer Readings | ||||||
| Time | mm | R1 | TC | RC | Cr | % Passing |
| 18 s | 0.075 | 6.5 | 21 °C | 0.4 | 6.9 | 13 |
| 40 s | 0.05 | 5 | 21 °C | 0.4 | 5.4 | 9.9 |
| 2 min | 0.04 | 4 | 21 °C | 0.4 | 4.4 | 7.9 |
| 5 min | 0.026 | 3.8 | 21 °C | 0.4 | 4.2 | 7.7 |
| 15 min | 0.015 | 3.4 | 21 °C | 0.4 | 3.8 | 7 |
| 30 min | 0.01 | 3.1 | 21 °C | 0.4 | 3.5 | 6.4 |
| 60 min | 0.0074 | 2.5 | 20.5 °C | 0.2 | 2.7 | 5 |
| 4 h | 0.0036 | 2 | 19.5 °C | −0.2 | 1.8 | 3.3 |
| 24 h | 0.0015 | 1.5 | 19 °C | −0.4 | 1.1 | 3.2 |
R1 = Corrected hydrometer reading; TC = Room temperature; RC = Composite correction; Cr = Corrected reading
Table 5.
Particle size distribution (sieve and hydrometer analysis) of WFS02.
| Total Sample Mass: 125 g | ||||||
|---|---|---|---|---|---|---|
| Sieve Size (mm) | Mass of Sample Retained | % of Sample Retained | Cumulative % of Sample | % of Sample Passing | Reported % Passing | |
| 9.5 | 0 | 0 | 0 | 100 | 100 | |
| 4.75 | 0 | 0 | 0 | 100 | 100 | |
| 2 | 0 | 0 | 0 | 100 | 100 | |
| 1.18 | 0 | 0 | 0 | 100 | 100 | |
| 0.6 | 4.3 | 3.44 | 3.44 | 96.56 | 97 | |
| 0.425 | 11.61 | 9.29 | 12.73 | 87.27 | 87 | |
| 0.3 | 28.78 | 23.02 | 35.75 | 64.25 | 64 | |
| 0.15 | 65.87 | 52.7 | 88.45 | 11.5 | 12 | |
| 0.075 | 11.19 | 8.95 | 97.4 | 2.6 | 3 | |
| Pan | 0.22 | - | - | - | - | |
| Total | 121.75 | - | 237.77 | - | - | |
| FM | 1.4 | - | - | - | - | |
| Hydrometer Readings | ||||||
| Time | mm | R1 | TC | RC | Cr | % Passing |
| 18 s | 0.075 | 1 | 21 °C | 0.4 | 1.4 | 3 |
| 40 s | 0.05 | 0.9 | 21 °C | 0.4 | 1.3 | 2.3 |
| 2 min | 0.04 | 0.8 | 21 °C | 0.4 | 1.2 | 2.1 |
| 5 min | 0.026 | 0.7 | 21 °C | 0.4 | 1.1 | 1.9 |
| 15 min | 0.015 | 0.6 | 21 °C | 0.4 | 1 | 1.8 |
| 30 min | 0.01 | 0.5 | 21 °C | 0.4 | 0.9 | 1.6 |
| 60 min | 0.0074 | 0.4 | 20.5 °C | 0.2 | 0.6 | 1.1 |
| 4 h | 0.0036 | 0.4 | 19.5 °C | −0.2 | 0.2 | 0.4 |
| 24 h | 0.0015 | 0.4 | 19 °C | −0.4 | 0 | 0 |
Table 6.
Particle size distribution (sieve and hydrometer analysis) of WFS03.
| Sieve Size (mm) | Mass of Sample Retained | % of Sample Retained | Cumulative % of Sample | % of Sample Passing | Reported % Passing | |
|---|---|---|---|---|---|---|
| 9.5 | 0 | 0 | 0 | 100 | 100 | |
| 4.75 | 0 | 0 | 0 | 100 | 100 | |
| 2 | 0 | 0 | 0 | 100 | 100 | |
| 1.18 | 0.96 | 0.77 | 0.77 | 99.23 | 99 | |
| 0.6 | 7.13 | 5.7 | 6.47 | 93.53 | 94 | |
| 0.425 | 8.7 | 6.96 | 13.43 | 86.57 | 87 | |
| 0.3 | 15.92 | 12.74 | 26.17 | 73 | 73 | |
| 0.15 | 39.82 | 31.86 | 58.03 | 41.97 | 42 | |
| 0.075 | 20.52 | 16.42 | 74.45 | 25.55 | 26 | |
| Pan | 0.47 | - | - | - | - | |
| Total | 93.5 | - | 179.32 | - | - | |
| FM | 1 | - | - | - | - | |
| Hydrometer Readings | ||||||
| Time | mm | R1 | TC | RC | Cr | % Passing |
| 18 s | 0.075 | 14.3 | 21 °C | 0.4 | 14.7 | 26 |
| 40 s | 0.05 | 11.5 | 21 °C | 0.4 | 11.9 | 21.5 |
| 2 min | 0.04 | 8 | 21 °C | 0.4 | 8.4 | 15.7 |
| 5 min | 0.026 | 5.5 | 21 °C | 0.4 | 5.9 | 10.3 |
| 15 min | 0.015 | 4.5 | 21 °C | 0.4 | 4.9 | 8.8 |
| 30 min | 0.01 | 4.3 | 21 °C | 0.4 | 4.7 | 8.2 |
| 60 min | 0.0074 | 3.5 | 20.5 °C | 0.2 | 3.7 | 6.6 |
| 4 h | 0.0036 | 2.5 | 19.5 °C | −0.2 | 2.3 | 4.1 |
| 24 h | 0.0015 | 1 | 19.1 °C | −0.3 | 0.7 | 3.7 |
Table 7.
Particle size distribution (sieve and hydrometer analysis) of WFS04.
| Total Sample Mass: 125 g | ||||||
|---|---|---|---|---|---|---|
| Sieve Size (mm) | Mass of Sample Retained | % of Sample Retained | Cumulative % of Sample | % of Sample Passing | Reported % Passing | |
| 9.5 | 0 | 0 | 0 | 100 | 100 | |
| 4.75 | 0 | 0 | 0 | 100 | 100 | |
| 2 | 0.99 | 0.79 | 0.79 | 99.21 | 99 | |
| 1.18 | 1.16 | 1.29 | 2.08 | 97.97 | 98 | |
| 0.6 | 60.9 | 48.72 | 50.8 | 49.2 | 49 | |
| 0.425 | 37.11 | 29.69 | 80.49 | 19.51 | 20 | |
| 0.3 | 11.71 | 9.37 | 89.86 | 10.14 | 10 | |
| 0.15 | 7.98 | 6.38 | 96.24 | 3.76 | 4 | |
| 0.075 | 1.84 | 1.47 | 97.71 | 2.29 | 2 | |
| Pan | 0 | - | - | - | - | |
| Total | 122.14 | - | 417.97 | - | - | |
| FM | 3.2 | - | - | - | - | |
| Hydrometer Readings | ||||||
| Time | mm | R1 | TC | RC | Cr | % Passing |
| 18 s | 0.075 | 5.4 | 21 °C | 0.4 | 5.8 | 2 |
| 40 s | 0.05 | 4 | 21 °C | 0.4 | 4.4 | 1.7 |
| 2 min | 0.04 | 3 | 21 °C | 0.4 | 3.4 | 1.3 |
| 5 min | 0.026 | 2.8 | 21 °C | 0.4 | 3.2 | 1.3 |
| 15 min | 0.015 | 2.6 | 21 °C | 0.4 | 3 | 1.2 |
| 30 min | 0.01 | 2.4 | 21 °C | 0.4 | 2.8 | 1.1 |
| 60 min | 0.0074 | 2.1 | 20.5 °C | 0.2 | 2.5 | 1 |
| 4 h | 0.0036 | 1.7 | 19.5 °C | −0.2 | 1.5 | 0.6 |
| 24 h | 0.0015 | 1.5 | 19 °C | −0.4 | 1.1 | 0.4 |
Table 8.
Particle size distribution (sieve and hydrometer analysis) of WFS05.
| Total Sample Mass: 125 g | ||||||
|---|---|---|---|---|---|---|
| Sieve Size (mm) | Mass of Sample Retained | % of Sample Retained | Cumulative % of Sample | % of Sample Passing | Reported % Passing | |
| 9.5 | 0 | 0 | 0 | 100 | 100 | |
| 4.75 | 0 | 0 | 0 | 100 | 100 | |
| 2 | 0 | 0 | 0 | 100 | 100 | |
| 1.18 | 0 | 0 | 0 | 100 | 100 | |
| 0.6 | 0 | 0 | 0 | 100 | 100 | |
| 0.425 | 0.11 | 0.09 | 0.09 | 99.91 | 100 | |
| 0.3 | 1.18 | 0.94 | 1.03 | 98.97 | 99 | |
| 0.15 | 58.44 | 46.75 | 47.78 | 52.22 | 52 | |
| 0.075 | 59.7 | 47.76 | 95.54 | 10.79 | 11 | |
| Pan | 0.74 | - | - | - | - | |
| Total | 120.17 | - | 144.44 | - | - | |
| FM | 0.5 | - | - | - | - | |
| Hydrometer Readings | ||||||
| Time | mm | R1 | TC | RC | Cr | % Passing |
| 18 s | 0.075 | 5 | 21 °C | 0.4 | 5.4 | 11 |
| 40 s | 0.050 | 3 | 21 °C | 0.4 | 3.4 | 6.8 |
| 2 min | 0.040 | 1.6 | 21 °C | 0.4 | 2 | 4 |
| 5 min | 0.026 | 1.3 | 21 °C | 0.4 | 1.7 | 3.4 |
| 15 min | 0.015 | 1.1 | 21 °C | 0.4 | 1.5 | 3 |
| 30 min | 0.010 | 0.9 | 21 °C | 0.4 | 1.3 | 2.6 |
| 60 min | 0.0074 | 0.7 | 20.5 °C | 0.2 | 0.9 | 1.8 |
| 4 h | 0.0036 | 0.6 | 19.5 °C | -0.2 | 0.4 | 0.8 |
| 24 h | 0.0015 | 0.5 | 19 °C | -0.4 | 0.1 | 0.2 |
Table 9.
Gradation evaluation of WFS.
| Samples | Types | D10 | D30 | D60 | Cu | Cc |
|---|---|---|---|---|---|---|
| Gradation Quantiles | ||||||
| WFS01 | Green sand | 0.055 | 0.18 | 0.29 | 5.27 | 2.03 |
| WFS02 | Chemically bonded sand | 0.150 | 0.20 | 0.30 | 2.00 | 0.89 |
| WFS03 | Green sand | 0.028 | 0.10 | 0.22 | 7.87 | 1.66 |
| WFS04 | Chemically bonded sand | 0.300 | 0.50 | 0.70 | 2.33 | 1.20 |
| WFS05 | Chemically bonded sand | 0.08 | 0.11 | 0.18 | 2.25 | 0.84 |
Table 10.
Physical properties of WFS samples.
| Samples | P1 | P2 | P3 | P4 | P5 | P6 | P7 |
|---|---|---|---|---|---|---|---|
| WFS01 | 0.4 | 1247 | 2.5 | 1.2 | 13 | 8.88 | 13 |
| WFS02 | 8.3 | 1387 | 2.6 | 1.4 | 0 | 9.34 | 3 |
| WFS03 | 1.9 | 1165 | 2.3 | 1.0 | 10 | 8.87 | 26 |
| WFS04 | 0.5 | 1221 | 2.6 | 3.2 | 0 | 9.89 | 2 |
| WFS05 | 0.2 | 1437 | 2.8 | 0.5 | 0 | 9.52 | 4 |
P1—moisture content, SANS 3001 GR20 (0.1–10.1); P2—uncompacted (loose) bulk density, SANS 5856:2006 (1120–1760) for lightweight aggregate; P3—specific gravity, American Concrete Institute (2.30–2.90) ASTM C 128 (AASHTO T84) (2.4 and 2.9); P4—fineness modulus, SANS 1083:2008 (1.2–3.5); P5—clay content, SANS 1083:2017 (2%); P6—pH United States Environmental Protection Agency (USEPA) Method 9045D (soil and waste), alkalinity > 7; P7—WFS finer than 75 μm (%).
Table 11.
Moisture content of WFS (WFS01–WFS05).
| Samples | WFS01 | WFS02 | WFS03 | WFS04 | WFS05 |
|---|---|---|---|---|---|
| Weight of sample before drying (W1) (g) | 50 | 50 | 50 | 50 | 50 |
| Weight of pan (D1) (g) | 421.15 | 424.18 | 421.94 | 422.22 | 424.14 |
| 1st weight of pan + sample after drying (C1) (g) | 470.93 | 470.05 | 470.90 | 471.81 | 474.08 |
| 2nd weight of pan + sample after drying (C2) (g) | 470.96 | 470.04 | 471.06 | 472.11 | 474.01 |
| Mean (1st and 2nd), (C3) (g) | 470.95 | 470.05 | 470.98 | 471.96 | 474.05 |
| Weight of actual sample after drying (C3 − D1) = W2 (g) | 49.8 | 45.87 | 49.04 | 49.74 | 49.91 |
| Moisture (%) = | 0.4 | 8.3 | 1.92 | 0.52 | 0.18 |
Table 12.
Uncompacted bulk density of WFS (WFS01–WFS05).
| Samples | WFS01 | WFS02 | WFS03 | WFS04 | WFS05 |
|---|---|---|---|---|---|
| Mass of container (kg) | 6.432 | 6.432 | 6.432 | 6.432 | 6.432 |
| Mass of container + sample (kg) | 9.849 | 10.233 | 9.624 | 9.777 | 10.370 |
| Vol. of the container (V) (m3) | 0.00274 | 0.00274 | 0.00274 | 0.00274 | 0.00274 |
| Mass of sample (M) | 3.417 | 3.801 | 3.192 | 3.345 | 3.938 |
| ρ = M/V (kg/m3) | 1247 | 1387 | 1165 | 1221 | 1437 |
Table 13.
Specific gravity of WFS (WFS01–WFS03). RD—relative density.
| Pycnometer | (WFS01) | (WFS02) | (WFS03) | |||
|---|---|---|---|---|---|---|
| S 1 | S 2 | S 1 | S 2 | S 1 | S 2 | |
| Mass of pycnometer (a) (g) | 39.64 | 43.75 | 43.52 | 40.25 | 39.64 | 40.27 |
| Mass of pycnometer + sample (b) (g) | 63.44 | 66.55 | 64.31 | 66.60 | 64.72 | 60.47 |
| Mass of pycnometer + sample + water (c) (g) | 153.87 | 158.46 | 157.96 | 155.99 | 153.79 | 151.27 |
| Mass of pycnometer + water (d) (g) | 139.70 | 144.90 | 145.09 | 139.71 | 139.68 | 139.86 |
| Mass of sample (b − a) (g) | 23.80 | 22.8 | 20.79 | 26.35 | 25.08 | 20.2 |
| Mass of water (d − a) (g) | 100.06 | 101.15 | 101.57 | 99.46 | 100.4 | 99.59 |
| Mass of water to fill pycnometer sample (c − b) (g) | 90.43 | 91.91 | 93.65 | 89.39 | 89.07 | 90.8 |
| Mass of water displaced by soil (d − a) − (c − b) (g) | 9.63 | 9.24 | 7.92 | 10.07 | 11.33 | 8.79 |
| Temperature of water (°C) | 21.00 | 21 | 19 | 19 | 19 | 19 |
| RD of water (f) (g) | 0.998 | 0.998 | 0.998 | 0.998 | 0.998 | 0.998 |
| RD of sample (f) × (b − a)/(d − a) − (c − b) (g) | 2.47 | 2.46 | 2.62 | 2.61 | 2.21 | 2.29 |
| Average Specific Gravity (Gs) @ 19 °C (%) | 2.46 | 2.62 | 2.25 | |||
Table 14.
Specific gravity of WFS (WFS04 and WFS05).
| Pycnometer | (WFS04) | (WFS05) | ||
|---|---|---|---|---|
| S 1 | S 2 | S 1 | S 2 | |
| Mass of pycnometer (a) (g) | 43.76 | 40.37 | 31.09 | 34.08 |
| Mass of pycnometer + sample (b) (g) | 69.90 | 67.85 | 49.71 | 54.84 |
| Mass of pycnometer + sample + water (c) (g) | 160.94 | 157.88 | 95.38 | 97.58 |
| Mass of pycnometer + water (d) (g) | 144.94 | 140.87 | 83.42 | 84.30 |
| Mass of sample (b − a) (g) | 26.14 | 27.48 | 18.62 | 20.76 |
| Mass of water (d − a) (g) | 101.18 | 100.5 | 52.33 | 50.22 |
| Mass of water to fill pycnometer sample (c − b) (g) | 91.04 | 90.03 | 45.67 | 42.72 |
| Mass of water displaced by soil (d − a) − (c − b) (g) | 10.14 | 10.47 | 6.66 | 7.5 |
| Temperature of water (°C) | 19 | 19 | 19 | 19 |
| RD of water (f) (g) | 0.998 | 0.998 | 0.998 | 0.998 |
| RD of sample (f) × (b − a)/(d − a) − (c − b) (g) | 2.57 | 2.62 | 2.79 | 2.76 |
| Average Specific Gravity (Gs) @ 19 °C (%) | 2.60 | 2.78 | ||
Table 15.
Loss on ignition (LOI) of WFS [(WFS01–WFS03).
| Samples | (WFS01) | (WFS02) | (WFS03) | |||
|---|---|---|---|---|---|---|
| S 1 | S 2 | S 1 | S 2 | S 1 | S 2 | |
| Weight of empty crucible (A) | 24.56 | 20.53 | 31.96 | 29.31 | 26.64 | 28.67 |
| Weight of sample | 10.02 | 10.01 | 10.02 | 10.03 | 10.02 | 10.01 |
| Weight of empty crucible + sample before firing (B) | 34.58 | 30.54 | 41.98 | 39.34 | 36.66 | 38.68 |
| Weight of empty crucible + sample after firing (C) | 34.10 | 30.06 | 41.64 | 39.00 | 35.11 | 37.11 |
| 4.80 | 4.80 | 3.39 | 3.39 | 15.47 | 15.68 | |
| Mean LOI | 4.80 | 3.39 | 15.58 | |||
Table 16.
LOI of WFS (WFS04–WFS05).
| Samples | (WFS04) | (WFS05) | ||
|---|---|---|---|---|
| S 1 | S 2 | S 1 | S 2 | |
| Weight of empty crucible (A) | 21.48 | 29.95 | 31.62 | 23.23 |
| Weight of sample | 10.02 | 10.03 | 10.04 | 10.05 |
| Weight of empty crucible + sample before firing (B) | 31.50 | 39.98 | 41.66 | 33.28 |
| Weight of empty crucible + sample after firing (C) | 31.06 | 39.55 | 41.27 | 32.89 |
| 4.39 | 4.3 | 3.88 | 3.88 | |
| Mean LOI | 4.35 | 3.88 | ||
Table 17.
X-ray fluorescence (XRF) chemical composition of the WFS samples.
| Contents | WFS01 | WFS02 | WFS03 | WFS04 | WFS05 | Requirement a |
|---|---|---|---|---|---|---|
| SiO2 | 82.68 | 88.82 | 73.00 | 89.32 | 68.93 | 87.91 |
| Al2O3 | 8.10 | 3.22 | 11.90 | 2.01 | 6.23 | 4.70 |
| Fe2O3 | 3.54 | 2.82 | 6.33 | 3.26 | 8.31 | 0.94 |
| CaO | - | - | 1.92 | - | - | 0.14 (min) |
| MgO | 1.48 | - | 2.16 | - | - | 0.30 |
| SO3 | - | - | 1.26 | - | - | 0.09 |
| Na2O | - | 1.03 | 1.36 | 2.87 | - | 0.19 |
| K2O | 1.15 | 2.53 | - | - | 3.18 | 0.25 |
| TiO2 | - | - | - | - | - | 0.15 |
| Mn2O3 | - | - | - | - | - | 0.02 |
| SrO | - | - | - | - | - | 0.03 |
| Cr2O3 | - | - | - | - | 3.30 | - |
| LOI | 4.8 | 3.39 | 15.58 | 4.35 | 3.88 | 5.15 (max) |
a Requirements for oxide mass (%) as per American form foundry men’s society (1991); green sand—WFS01 and WFS03; chemically bonded sand—WFS02, WFS04, and WFS05.
Table 18.
pH values.
| Samples | Sample (WFS01) | Sample (WFS02) | Sample (WFS03) | Sample (WFS04) | Sample (WFS05) |
|---|---|---|---|---|---|
| pH | 8.88 | 9.34 | 8.78 | 9.89 | 9.52 |
© 2019 by the authors. Licensee MDPI, Basel, Switzerland. This article is an open access article distributed under the terms and conditions of the Creative Commons Attribution (CC BY) license (http://creativecommons.org/licenses/by/4.0/).
Share and Cite
MDPI and ACS Style
Iloh, P.; Fanourakis, G.; Ogra, A. Evaluation of Physical and Chemical Properties of South African Waste Foundry Sand (WFS) for Concrete Use. Sustainability 2019, 11, 193. https://doi.org/10.3390/su11010193
AMA Style
Iloh P, Fanourakis G, Ogra A. Evaluation of Physical and Chemical Properties of South African Waste Foundry Sand (WFS) for Concrete Use. Sustainability. 2019; 11(1):193. https://doi.org/10.3390/su11010193
Chicago/Turabian StyleIloh, Patrick, George Fanourakis, and Aurobindo Ogra. 2019. "Evaluation of Physical and Chemical Properties of South African Waste Foundry Sand (WFS) for Concrete Use" Sustainability 11, no. 1: 193. https://doi.org/10.3390/su11010193
Note that from the first issue of 2016, this journal uses article numbers instead of page numbers. See further details here.