Analysis of CO2 Emissions in China’s Manufacturing Industry Based on Extended Logarithmic Mean Division Index Decomposition


School of Geographical Science, Northeast Normal University, Changchun 130024, China
*
Author to whom correspondence should be addressed.
Sustainability 2019, 11(1), 226; https://doi.org/10.3390/su11010226
Submission received: 19 November 2018
/
Revised: 20 December 2018
/
Accepted: 28 December 2018
/
Published: 4 January 2019
(This article belongs to the Special Issue Climate Change and Sustainable Development Policy)
Abstract
:China is the world’s largest emitter of CO2. As the largest sector of China’s fossil energy consumption and carbon emissions, manufacturing plays an important role in achieving emission reduction targets in China. Using the extended logarithmic mean division index (LMDI) decomposition model, this paper decomposed the factors that affect the CO2 emissions of China’s manufacturing industry into eight effects. The results show the following: (1) China’s manufacturing CO2 emissions increased from 1.91 billion tons in 1995 to 6.25 billion tons in 2015, with an average annual growth rate of 6%. Ferrous metal smelting and rolling were the largest sources of carbon dioxide emissions, followed by chemical raw materials and products and then non-metallic minerals. (2) During the research period, the industrial activity effects were the most important factor leading to increased CO2 emissions in manufacturing and energy intensity was the most important factor in promoting the reduction of CO2 emissions from manufacturing. The investment intensity was the second most influential factor leading to the increase in China’s manufacturing CO2 emissions after the industrial scale and this even exceeded the industrial activity effect in some time periods (2000–2005). R&D efficiency and R&D intensity were shown to have significant roles in reducing CO2 emissions in China’s manufacturing industry. The input of R&D innovation factors is an effective way to achieve emission reductions in China’s manufacturing industry. (3) There were differences in the driving factors of CO2 emissions in the manufacturing industry in different periods that were closely related to the international and domestic economic development environment and the relevant policies of the Chinese government regarding energy conservation and emission reduction. (4) Sub-sector research found that the factors that affect the reduction of CO2 emissions in various industries appear to be differentiated. This paper has important policy significance to allow the Chinese government to implement effective energy-saving and emission reduction measures and to reduce CO2 emissions from the manufacturing industry.
1. Introduction
Global warming has become one of the biggest environmental issues currently facing mankind. Among the six greenhouse gases, carbon dioxide (CO2) contributes the most to the greenhouse effect and accounted for approximately 78% of total greenhouse gas emissions from fossil fuel combustion and industrialization from 1970 to 2010 [1]. It has become a common aspiration of all countries to reduce greenhouse gas emissions, such as CO2 and realize a low-carbon circular economy. Since the reform and opening-up of the Chinese economy, rapid growth has occurred. In 2010, China’s total GDP exceeded Japan’s for the first time and China became the world’s second largest economy after the United States. China consumed much fossil energy and generated a great deal of greenhouse gases, such as CO2, during the process of China’s rapid urbanization and industrialization. China’s total CO2 emissions surpassed that of the United States in 2007 and China became the world’s largest carbon dioxide emitter [2]. As a responsible large country, the Chinese government announced the approval of the Kyoto Protocol in 2002. At the Copenhagen Conference in 2009, the Chinese government, adhering to the basic framework of the United Nations Framework Convention on Climate Change (UNFCCC) and the Kyoto Protocol, proposed a target of reducing carbon dioxide emissions from GDP by 40–45% by 2020 compared with 2005 and included it in the long-term plan for national economic and social development as a binding target. In 2016, the Chinese NPC Standing Committee authorized China to join the "Paris Agreement on Climate Change"; the Chinese government has promised that its carbon emissions will peak by 2030 and that the unit Gross Domestic Product (GDP) amount of carbon dioxide emissions will be reduced by 60–65% compared with 2005. Therefore, the Chinese government also formulated a series of energy conservation and emission reduction policies to undertake emission reduction as a responsibility and duty [3,4,5,6].
The manufacturing industry is the engine of China’s industrialization and the main body of the national economy; its output value was 87.90% of China’s national economy in 2015. The manufacturing industry also has high energy consumption and CO2 emissions. From 1995 to 2015, the CO2 emissions of China’s manufacturing industry increased by approximately 220.77% and accounted for 58.27% of the total CO2 emissions of China. In 2015, the State Council issued “Made in China 2025,” which put forward the grand goal of stepping into the ranks of manufacturing powers by 2025 and reaching the middle level of world manufacturing power by 2035. The rapid development of manufacturing industries will inevitably lead to the increase of carbon dioxide emissions. Therefore, it is of great theoretical and practical significance to explore the factors that influence CO2 emissions in China’s manufacturing industry and the driving factors of CO2 emissions in different sectors of the manufacturing industry to reduce CO2 emissions, develop a low-carbon economy and the realize green sustainable development of manufacturing as soon as possible.
2. Literature Review
This paper studies the influencing factors of carbon dioxide emissions in China’s manufacturing industry and explores the specific driving effects of factors that affect carbon emissions by using the extended LMDI decomposition model. The literature review thus includes two aspects: a literature review of the factors that affect energy consumption and carbon emissions and a literature review related to the factors that affect carbon emissions during manufacturing.
2.1. Energy Consumption and Factors that Affect Carbon Emissions
The structural decomposition analysis (SDA) and index decomposition analysis (IDA) are two main analysis methods that determine the factors related to energy consumption and carbon dioxide emissions. SDA is based on the input-output model. Rose and Casler [7] reviewed SDA’s theoretical basis and main features. By decomposing the changes in carbon dioxide emissions in China, Su and Ang [8] analyzed and compared the four SDA methods and provided guidance for the selection of methods. The Laspeyres exponential decomposition method and the logarithmic mean division index (LMDI) decomposition method are the two most commonly used IDA methods. The traditional Laspeyres method has the problem that high residuals cannot be explained in the decomposition of the carbon emissions history, especially in long-term multivariate analyses. Albrecht et al. [9] used the Shapley decomposition technique to study carbon dioxide emissions in four Organization for Economic Co-operation and Development (OECD) countries, which made it possible to decompose without surplus. Ang et al. [10] considered the logarithmic mean splitting index method as the preferred method by comparing various exponential decomposition methods. On the basis of previous research, Ang [11] provided practical guidance for the LMDI decomposition method. However, LMDI decomposition still has the problem of how to deal with negative values in the data set. Ang [12] provided a strategy and criteria to deal with negative values that eliminates the deficiency of the only LMDI decomposition method in practical applications. The improved LMDI method has been widely used in existing decomposition systems because of its practicability and accuracy.
In recent years, domestic and foreign scholars have used the LMDI decomposition model in many empirical studies of the influencing factors of energy consumption and carbon emissions. Sheinbaum et al. [13] conducted an LMDI decomposition analysis of energy use and carbon dioxide emission changes in the Mexican steel industry from 1970 to 2006 and found that industrial activities contributed to a significant increase in primary energy consumption; energy structure and energy efficiency played important roles in reducing energy consumption and carbon dioxide emissions. Olanrewaju [14], Román et al. [15] and Zhang et al. [16] used the LMDI decomposition method to decompose related energy and CO2 emissions in South Africa, Colombia and China and found that economic activities were the main reason for the growth of CO2 emissions. Ma et al. [17] put forward an LMDI decomposition method based on the Sankey diagram of energy and carbon dioxide distribution and analyzed the influencing factors of China’s energy CO2 emissions. It was found that the growth of per capita GDP was the main factor that promoted the growth of CO2 emissions. The reduction in energy intensity and the improvement of energy supply efficiency slowed the growth of CO2 emissions. Xu et al. [18] obtained the same conclusion by analyzing the decomposition of the factors that affect energy consumption at different stages and industries in China. Some scholars also used the LMDI decomposition method to decompose energy-related carbon emissions in different regions of China, most through dividing the influencing factors into economic activities, energy intensity, energy efficiency, industrial structure and so on [19,20,21,22]. It was found that current economic activities and energy intensity are the main driving factors of energy-related carbon emissions. Economic activities play a decisive role in increasing energy-related carbon emissions, whereas energy intensity is the main factor that restrains them.
Industry is China’s largest carbon emissions sector and scholars have done much work on the decomposition of industrial energy-related carbon emissions. Chen et al. [23] analyzed the carbon dioxide emissions of energy-related industries in China from 1985 to 2007 by using the LMDI method and found that the per capita GDP is the largest positive driving factor for the growth of industrial CO2 emissions and that energy intensity could significantly reduce the CO2 emissions of energy-related industries in China. Liu et al. [24] also found that industrial activities and energy intensity have been the main reasons for changes in carbon emissions in China’s industrial sector, whereas the effects of thermoelectric emission factors, fuel transfer and energy structure transfer have played only secondary roles. Xie et al. [25] decomposed the influencing factors of carbon dioxide emissions from China’s oil refining and coking industries into five factors: emission coefficient, energy structure, energy intensity, industrial activity and industrial scale. The study found that industrial activity was the main driving force for CO2 emissions growth, followed by industrial scale and energy intensity. Lin et al. [26] decomposed and analyzed the changes of energy-related CO2 in China’s textile industry and found that industrial activities and energy intensity were the main determinants of carbon dioxide emissions. Zhang et al. [27] used LMDI decomposition method to explore the main driving factors of China’s coal chemical industry’s carbon dioxide emissions. The study found that economic growth and energy intensity are the main factors leading to the increase of carbon dioxide emissions and the industrial structure is the main factor for carbon dioxide reduction. Du et al. [28] studied the driving factors of China’s high-energy-intensive industries and energy-related carbon dioxide emission changes by using the LMDI decomposition method. The study found that the expansion of industrial scale was the leading force explaining CO2 emissions change in China’s high-energy-intensive industries. Energy intensity was the main factor driving the decline of CO2 emissions. The impact of energy structure and industrial structure on CO2 emissions was relatively small.
The drivers of industrial carbon emissions in the different provinces of China have also attracted widespread attention from scholars. Zhao et al. [29] performed an empirical analysis of the influencing factors of Shanghai’s industrial carbon emissions by using the LMDI method and found that industrial output is the main driving force of Shanghai’s industrial carbon emissions and that the decline in energy intensity and the adjustment of energy and industrial structure are the main determinants that need to be targeted to reduce Shanghai’s industrial carbon emissions. Deng et al. [30] used the structural decomposition analysis-logarithmic mean splitting index (SDA-LMDI) model to analyze the driving factors of energy-related CO2 emissions in Yunnan Province, one of China’s underdeveloped provinces. The results showed that the rapid growth of high-carbon product exports in metal processing and the power sector are the main factors that lead to carbon dioxide emissions. Based on the log-average splitting index decomposition method of extended Kaya identities, Wu et al. [31] analyzed the changes in industrial carbon dioxide emissions in 39 industrial sectors in Northeastern Inner Mongolia from 2003 to 2012. It was found that the growth effect and population effect were the key driving forces of carbon dioxide emissions in industrial sectors in Inner Mongolia and that energy intensity efficiency was a major factor in the reduction of carbon dioxide emissions. In addition, the LMDI decomposition method has also been widely used in the analysis of carbon emission influencing factors in transportation, electric power, housing and other fields [32,33,34,35].
2.2. Factors that Affect Manufacturing Carbon Emissions
In manufacturing carbon-related research, Akbostancı [36] used the LMDI decomposition method to decompose the changes in CO2 emissions in the Turkish manufacturing industry and found that the changes in total industrial activity and energy intensity were the main factors for CO2 changes during the study period. Kim [37] and Jeong [38] used the LMDI decomposition method to decompose the influential factors of energy consumption and greenhouse gas emissions in the Korean manufacturing industry. It was found that structural effects and intensity effects play major roles in reducing energy consumption and greenhouse gas emissions and that the structural effect is greater than the intensity effect. Hammond et al. [39] divided the UK manufacturing industry into the energy-intensive (EI) subsector and the nonenergy-intensive (NEI) subsector and used the LMDI decomposition methods to classify influencing factors into output scale, industrial structure, energy intensity, fuel mix and electricity emission factor; they found that the decline in energy intensity was the main factor in the reduction of carbon emissions. In addition, on the basis of the Disia index method, Ang and Pandiyan [40] used two common methods to decompose the factors that affect CO2 emission changes into energy intensity effects, energy structure effects, CO2 emission factor effects and industrial structure effects. Schipper [41] used Adaptive-Weighting-Divisia decomposition to analyze the CO2 emissions of the manufacturing sector in 13 International Energy Agency countries in 1994 and decomposed the factors that affect CO2 emissions into energy intensity, industrial structure, energy structure and economic output. The results showed that the energy intensity and output scale effect are the main factors that lead to different CO2 emission changes in manufacturing industries.
In the research on carbon emissions from China’s manufacturing industry, many scholars have used the LMDI decomposition method to decompose the factors that affect China’s manufacturing CO2 emissions into emission factor effects, energy intensity effects, energy structure effects, industrial structure effects and industrial activity effects (Ren et al. [42], Xue [43], Wang et al. [44], Wang et al. [45]). Ren et al. [42] found that a decrease in energy intensity leads to a significant reduction in CO2 emissions, whereas the impacts of emission factors, industrial structure and energy structure on CO2 emissions are relatively small. Xue [43] and Wang et al. [44] found that industrial activity expansion is the main reason for the increase in CO2 emissions in China’s manufacturing industry. Wang et al. [45] found that, in addition to industrial activity, industrial structure adjustment is an important factor for China’s manufacturing industry to reduce the rate of carbon emissions. Ma et al. [46] decomposed China’s manufacturing industry into three categories—high, medium and low energy consumption—and used the LMDI decomposition method to decompose the energy-related carbon emission factors that affect the manufacturing industry. It was found that the added value of the manufacturing industry is the most important positive driver of carbon emission change and that energy intensity is the most important negative driver. Chen et al. [47] divided the change point and cycle of carbon dioxide in China’s manufacturing industry from 1985 to 2010 by using the gray relational analysis method. Xu et al. [48] found that the driving factors of carbon emissions in China’s manufacturing industry have strong periodic characteristics and that output effect and energy intensity are the main factors. From the perspective of structure and efficiency share, Pan et al. [49] explored the changes in the carbon intensity of China’s manufacturing industry and found that the decline in carbon intensity was caused by efficiency. Li et al. [50] used STIRPAT model to examine the impact of rationalization and upgrading of manufacturing structure on carbon emissions in China from the perspective of natural resource dependence from 2003 to 2014. The results shown that rationalization and upgrading of manufacturing structure will help to curb carbon dioxide emissions, which is limited by a region’s dependence on natural resources.
The existing research on energy consumption and carbon emissions generally focuses on traditional factors such as emission factors, energy structure, energy intensity, industrial structure and economic activities and there is a consensus that economic activity is the most important factor leading to increased carbon emissions. The decline in energy intensity is an important factor in the reduction of carbon emissions. Normally, the standard coal equivalent of fossil energy combustion will not change significantly in a short period of time except for electricity [51]. Under other unchanged conditions, a decrease in energy intensity is associated with an improvement in energy efficiency, which is conducive to the reduction of carbon emissions. As economic growth has difficulty getting rid of its dependence on fossil energy combustion, the expansion of the output scale will inevitably lead to an increase in carbon emissions [52]. Chen et al. [53] found that China’s coal-based energy structure and consumption structure have little potential to reduce carbon emissions and carbon intensity by adjusting the energy structure in the short term. Some scholars have found that fixed asset investment has an important impact on China’s carbon emissions, in addition to traditional economic factors. Dong et al. [54] pointed out that although most studies have confirmed that economic scale expansion is the primary factor related to China’s carbon emissions, economic scale expansion is the result of a combination of factors, such as fixed asset investment and fixed asset investment is a necessary condition and basic driving force for economic expansion. Shao et al. [52] found that in the process of China’s rapid urbanization, a large fixed asset investment was applied to infrastructure construction, resulting in a large amount of fossil energy consumption and an increase in carbon emissions, resulting in China’s economy into a low sustainable development mode of “industrial investment-economic growth-energy consumption-carbon emission.” Wang et al. [55] used the expanded STIRPAT model to analyze the time series of the main driving factors of carbon emissions of energy consumption in Guangdong province from 1990 to 2014 and found that in addition to economic growth, fixed asset investment was the most important factor for carbon emission growth. Wang and Wang [56] used the extended STIRPAT model to analyze the main driving factors of Xinjiang’s energy consumption carbon emissions in 1952–2014. It was found that in 2001–2014, fixed asset investment and economic growth were the main contributors to carbon emission growth and carbon intensity was the most important contributor to the curbing of carbon emissions growth. Shao et al. [52] used the generalized split index method (GDIM) to analyze the driving factors of the evolution of carbon emissions in China’s manufacturing industry from 1995 to 2014. The study found that investment scale was the main factor that led to the increase in carbon emissions and investment intensity and output intensity are the key factors to the reduction in carbon emissions.
In addition, some scholars have found that intangible capital, such as innovation, information and communication technology, plays an important role in energy intensity and carbon emissions. Yang and Shi [57] analyzed the relationship between intangible capital (including computerized information, innovative property (R&D), brand equity and organization capital) and departmental energy intensity based on the data sets of 40 economies in the World Input and Output Database. It was found that intangible capital plays an important role in reducing the energy intensity of the sector. Herrerias et al. [58] found that R&D expenditure and innovation activities are the main reasons for the decline in China’s energy intensity. Based on the STIRPAT model, Ding et al. [59] studied the factors influencing China’s manufacturing carbon emissions and found that population and wealth have positive effects on China’s manufacturing carbon emissions, whereas technical factors have negative effects. Li et al. [60] constructed a model of the factors influencing carbon dioxide emissions in China through the panel data model and analyzed the impacts of energy consumption intensity, energy consumption structure and technological innovation on China’s total carbon dioxide emissions in 2005–2010. The results showed that an improvement in China’s energy consumption structure and investment in technological innovation could reduce the carbon emissions brought about by economic growth to a large extent.
Given the above, fixed asset investment and innovation factors appear to have important impacts on carbon emissions, while the existing concerns on the impact of manufacturing carbon emissions are obviously insufficient. Therefore, a large amount of empirical research needs to be supplemented. Compared with the existing literature, the contributions and main innovations of this research are mainly reflected by the following aspects. Firstly, the time span of the data sample in this paper is 1995–2015, which is longer than the existing research time span, providing more detailed information on the historical trend of CO2 emission change in China’s manufacturing industry. Secondly, the research period is divided into four stages, the “Ninth Five-Year Plan,” the “Tenth Five-Year Plan,” the “Eleventh Five-Year Plan” and the “Twelfth Five-Year Plan,” to better reflect the driving mechanism of CO2 emission changes in the manufacturing industry in different stages of planned economy. Third, based on traditional factors (emission factors, energy structure, energy intensity, industrial structure and economic activities), this paper incorporates fixed asset investment and innovation input factors (R&D efficiency, R&D intensity and investment intensity). Therefore, on the one hand, the LMDI decomposition model is expanded and on the other hand, the impacts of fixed asset investment and innovation investment on China’s manufacturing carbon emissions are discussed, which helps to provide a policy reference for emission reductions from the source.
3. Method and Data Source
3.1. CO2 Emissions Accounting of Manufacturing Sector
This paper estimates carbon emissions from the manufacturing sector with reference to the calculation methods and parameters of carbon emissions published by the IPCC (2006) and the relevant parameters published by the Chinese authorities:
where C represents the total CO2 emissions of the manufacturing industry and i represents the type of energy. To ensure the accuracy of the estimation results, this paper fully considers 18 fossil energy sources, including raw coal, clean coal, other coal washing, coke, coke oven gas, other gases, other coking products, crude oil, gasoline, kerosene, diesel, fuel oil, liquefied petroleum gas, refinery dry gas, other petroleum products, natural gas, heat and electricity. Ei is the consumption of i-type fuel after conversion to the standard coal equivalent and the fuel units are 104 tons or billion cubic meters. Data are from the China Energy Statistics Yearbook (1996–2017). CLVi × CCVi × CORi × 44/12 is the CO2 emission coefficient, CLVi is the average low calorific value and the data were taken from the China Energy Statistical Yearbook (2016). CCVi is the carbon emission factor and the data were derived from the 2006 IPCC Guidelines for National Greenhouse Gas Inventories. The molecular weight of CO2 is 44/12, CORi is the carbon oxidation rate and the data were taken from the guidelines for the preparation of China’s provincial greenhouse gas inventory. The reference for the calculation of CO2 emission coefficient of electricity is [42] and the data were taken from the China Electricity Statistical Yearbook (2016). The calculation process is shown in Table 1.
3.2. Decomposition Analysis Model of CO2 Emissions of the Manufacturing Sector
To decompose and analyze the changes in CO2 emissions in China’s manufacturing industry, this study combined the national industry classification standards released in 2017 (GB/T4754-2017) and the China Energy Statistical Yearbook to divide the manufacturing sector. According to the existing research division method [42], the Chinese manufacturing industry is divided into 15 sectors: food and tobacco, textile and leather, wood and wood products, paper and printing, petroleum processing and coking, chemical raw materials and products, pharmaceutical manufacturing, chemical fiber, rubber and plastics, non-metallic minerals, ferrous metals smelting and rolling, non-ferrous metal smelting and rolling, metal products, mechanical and electronic equipment and other manufacturing.
The CO2 emissions can be expressed as an extended Kaya identity, which is a useful tool to decompose total carbon emissions. It is shown as follows (Equation (2)):
where i = 1, 2, 3, …, 15 represents the 15 industry sectors of the manufacturing industry and j = 1, 2, 3, …, 18 represents 18 kinds of energy. The meanings of the other symbols are shown in Table 2.
The extended LMDI additive method was used to decompose the changes in CO2 emissions from China’s manufacturing industry in 0–t years into eight factors: the emission factor effect (ΔEC), the energy structure effect (ΔES), the energy intensity effect (ΔEI), the R&D efficiency effect (ΔRE), the R&D intensity effect (ΔRI), the investment intensity effect (ΔII), the industry structure effect (ΔYS) and the industrial activity effect (ΔY). ΔEC, ΔES, ΔEI, ΔYS, ΔY are five common driving factors of the CO2 emission factors influencing manufacturing industries; the driving factors of CO2 emission changes in manufacturing industries have mainly been studied from the macroeconomic perspective. The specific meanings of the five effects are as follows: (i) the emission factor effect (ΔEC) reflects changes in the average emission factor of energy use; (ii) the energy structure effect (ΔES) reflects changes in the relative shares of energy forms in total energy consumption; (iii) the energy intensity effect (ΔEI) reflects changes in the ratio of manufacturing energy consumption to its produced value added; (iv) the industry structure effect (ΔYS); and (v) the industrial activity effect (ΔY). Based on relevant research results [61], this paper introduces three microeconomic elements—the R&D efficiency effect, the R&D intensity effect and the investment intensity effect—to explore the impact of fixed asset investment and the R&D activities of various sectors of the manufacturing industry on the changes of CO2 emissions of the manufacturing industry. Among these effects, the R&D efficiency effect (ΔRE) reflects the conversion efficiency of R&D expenditure on the output. Under the same conditions, the greater the value of R&D is, the greater the output of R&D expenditure conversion is. The R&D intensity effect (ΔRI) reflects the innovation intensity and technical content of each manufacturing sector (sub-sector); The investment intensity effect (ΔII) reflects the intensity of expansion of reproduction in various manufacturing sectors. Under the same conditions, the greater the investment intensity is, the stronger the ability of each sector to expand reproduction is [52].
Therefore, the sum of manufacturing CO2 emissions for each effect is equal to the total change in manufacturing CO2 emissions:
The expression of each effect in Equation (3) is as follows:
3.3. Data Sources and Processing
The research period used in this paper was from 1995 to 2015. The data of energy consumption of different industries in China’s manufacturing industry were from the China Energy Statistics Yearbook (1996–2016) and the data of added value of different industries in China’s manufacturing industry from 1995–2007 were from the China Statistical Yearbook (1996–2008). Since 2009, the National Bureau of Statistics of China has not published industrial added value data but does publish their annual, quarterly and monthly growth rates. Therefore, the data of 2009–2015 were calculated from the annual growth rates. The annual growth rate of manufacturing added value was derived from the official website of the National Bureau of Statistics [62]. The fixed assets investment data and the GDP of China’s manufacturing industry were from the China Statistical Yearbook (1996–2016) and R&D research funds were from the China Science and Technology Statistical Yearbook (1996–2016). To ensure the comparability of data, value added, R&D research funding, fixed asset investment and gross domestic product were all reduced to constant prices in 2000.
4. Results and Analysis
4.1. Carbon Dioxide Emissions from China’s Manufacturing Industry
Figure 1 shows the trend of CO2 emissions and growth rates in China’s manufacturing industry. From 1995 to 2015, the total CO2 emissions in China’s manufacturing industry showed an upward trend year by year, by more than 3 times from 1.91 billion tons in 1995 to 6.125 billion tons in 2015. From the point of view of growth rate change, the growth rate of CO2 emissions was negative and the growth speed of CO2 emissions slowed in 1997–1999, mainly due to the impact of the Asian financial crisis in 1997, which resulted in the temporary reduction of China’s manufacturing production. The growth rate of CO2 reached a peak of 22.72% in 2004 and then continued to decline. It was not until 2008 that CO2 emissions began to rebound. Affected by the global economic crisis in 2008, the Chinese government put forward a plan to invest 4 trillion yuan to boost domestic demand, a large part of which was used for infrastructure construction, such as railways, highways and airports, which greatly stimulated the development of manufacturing industries, such as metal products, non-ferrous metals and the calendaring industry and further increased the rate of CO2 emissions.
In 2012, the State Council issued the 12th Five-Year Plan for Energy Conservation and Emission Reduction, which proposed that by 2015 the energy consumption of China’s GDP of 10,000 yuan will be reduced to 0.869 tons of standard coal, which is 16% lower than the 1.034 tons of standard coal in 2010 and that a series of emission reduction targets, such as the energy conservation of 670 million tons of standard coal, will be achieved during the 12th Five-Year Plan. It also strengthened the regulation of the scale of investment and development in key industries, such as steel, cement, paper making and printing, which will gradually slow down the CO2 emissions rate and eventually stabilize it.
The changes in CO2 emissions in different sectors of China’s manufacturing industry have been significantly different. As shown in Figure 2, the three sectors of ferrous metals—smelting and rolling, chemical raw materials and products and non-metallic minerals had the largest CO2 emissions, accounting for 64.62% of the total emissions. Compared with 1995, the three CO2 emissions sectors increased by 322.93%, 210.62% and 165.45% in 2015, respectively. The proportions of CO2 emissions from petroleum processing and coking, mechanical and electronic equipment and non-ferrous metal smelting and rolling were 6.47%, 6.06% and 5.70%, respectively. The CO2 emissions increased by 273.68%, 176.13% and 593.84% in the same period. The above six sectors accounted for 82.85% of the total emissions of the manufacturing sector, which is the focus for reducing that sector’s CO2 emissions. In addition, although the proportion of CO2 emissions from rubber and plastics was only 1.56%, it also increased by 671.78%, which was the largest increase in CO2 emissions from the manufacturing sector. The proportions and changes of CO2 emissions in other manufacturing sectors were relatively small.
4.2. Decomposition Results in the Manufacturing Sector
Table 3 presents the decomposition results of CO2 emission changes in the manufacturing sector from 1995 to 2015. Changes in CO2 emissions were mainly affected by industry activity, investment intensity, energy intensity, R&D efficiency and R&D intensity. A detailed analysis follows.
The decomposition results show that in 1995–2015, CO2 emissions from China’s manufacturing industry increased by about 4121.7 million tons (see the last row of Table 4). Among them, the positive driving factors of CO2 emission growth in the manufacturing industry included the energy structure, investment intensity and industrial activity, with cumulative contributions of 433.3 million tons, 3387.3 million tons and 9694.3 million tons, respectively. Industrial activity was the most important positive driving factor, with a contribution rate of 42.32%. This shows that the economic growth of the manufacturing industry in China has played a significant role in promoting CO2 emissions. Investment intensity was the second largest driving factor after industrial activity, with a contribution rate of 14.79%. To some extent, this shows that fixed asset investment, as the basic driving force of economic expansion, is a non-negligible factor that leads to the increase of carbon emissions in China’s manufacturing industry. The energy structure led to an increase of 433.3 million tons of CO2 emissions. Except 1996–1997, 1999–2000 and 2003–2004, the increase in CO2 emissions in the measured period played a role in promotion, which is related to the long-term single energy consumption structure dominated by coal in China. Emission factors, energy intensity, R&D efficiency, R&D intensity and industrial structure were the negative driving factors of CO2 emission growth in China’s manufacturing industry in the same period, with cumulative contribution rates of 349 million tons, 5.363 billion tons, 2.148 billion tons, 1.239 billion tons and 293.6 million tons respectively. Energy intensity was the most important negative driving factor with a contribution rate of 23.41%. The R&D efficiency and intensity came next, with a total contribution rate of 14.79%—this played an important role in reducing CO2 emissions of China’s manufacturing industry. Although the impacts of industrial structure and emission factors on CO2 emissions of manufacturing industry were relatively small, they both contributed to the reduction of CO2 emissions, contributing 1.51% and 1.28% respectively. This was mainly related to the adjustment of industrial structure and the improvement of electric power in China.
Figure 3 shows the changes in CO2 and the contribution rate of each decomposition factor. According to the changing characteristics of CO2 emissions from manufacturing, the changes can be decomposed into four stages: the first stage is 1996–2004; the second stage is 2004–2008; the third stage is 2008–2011; and the fourth stage is 2011–2015. In the first stage, besides 1995–1996 and 2000–2001, CO2 emissions from manufacturing industry showed a significant increasing trend. Among them, the industrial activity effect and investment intensity effect played important roles in promoting CO2 emissions. After 2000, the investment intensity effect exceeded the industrial activity effect and became the most important factor to promote the increase of CO2 emissions from the manufacturing industry. At the same time, the role of energy intensity in reducing carbon emissions in manufacturing industry gradually weakened, while the role of R&D intensity gradually strengthened. In the second stage, the CO2 emissions of the manufacturing industry showed a significant decreasing trend and the industrial activity effect still played the most important role in increasing the carbon emissions of the manufacturing industry. In the third stage (2008–2011), the CO2 emissions of the manufacturing industry showed an increasing trend year by year and reached the peak of the whole research period in 2011. The activity effect and investment intensity effect were the dominant factors for the increase in carbon emissions and R&D efficiency was the main factor involved in reducing carbon emissions. In the fourth stage, the CO2 emissions of the manufacturing industry showed a significant decreasing trend. In addition to the industrial activity effect, the R&D intensity effect was the most important factor in the increase in carbon emissions of manufacturing industry in this period. The energy intensity and R&D efficiency were still the main reasons to reduce carbon emissions. This shows that the R&D intensity effect has two sides. If the R&D intensity of manufacturing sectors is increased to improve the production structure and production capacity, the output will be increased and the corresponding carbon emissions will also increase. On the contrary, if the R&D intensity of manufacturing sectors is increased to improve emission reduction equipment, it will be conducive to reducing carbon emissions.
4.2.1. Five Conventional Factors
Figure 4 depicts the decomposition results of the five traditional factors. From 1995 to 2015, there were significant differences in the characteristics of the five effect changes. Specifically, the industrial activity effect played a positive role. The overall change can be divided into three periods: 1995–2007, 2007–2013 and 2013–2015. In 1995 and 2007, the role of the industrial activity effect continued to increase, reaching its peak in 2007 and contributing 971.4 million tons to the increase in manufacturing carbon emissions. During 2007–2013, the industrial activity effect showed a sharp decline and then stabilized. In 2008, China’s manufacturing industry activity effect showed a short-term retrogression compared with in 2007 and the CO2 emissions caused by the industrial activity effect also showed a significant decline, mainly due to the impact of the global financial crisis in 2008, resulting in insufficient domestic demand and the decline of export trade in China’s manufacturing industry [39]. From 2013 to 2015, the role of industrial activity effect showed a steady downward trend, which was related to the elimination of backward capacity and other related policies [3,4,5].
Except for 2000 and 2011, the energy intensity effect played an important role in reducing CO2 emissions at other stages but with significant volatility characteristics. It was positive in 1999–2000 and 2010–2011 and the rest of the period was negative. The effect of energy intensity on reducing carbon emissions in manufacturing generally decreased at first and then increased. Especially after 2008, the effect of energy intensity on reducing carbon emissions in manufacturing gradually increased. The main reason for this was that after 2008, the state promoted the energy conservation and emission reduction work of key energy-consuming industries such as steel, nonferrous metals, chemicals and building materials [63], which improved the energy efficiency and enabled sub-sector energy. The intensity increased significantly, which played an important role in reducing CO2 emissions from manufacturing. The industrial structure effect played a small role before 2007 and had a stable change trend. After 2007, it was characterized by positive and negative fluctuations, indicating that the effect of China’s manufacturing industry structure adjustment on carbon emissions is not prominent. The effects of emission factor effects and energy structure effects were weak.
4.2.2. Three Novel Factors
Figure 5 depicts the decomposition results for the three newly added elements. Between 1995 and 2015, three effects had a major impact on China’s manufacturing carbon emissions. Among them, the investment intensity effect played a positive role in general and reached its maximum in 2002–2003. In 2000–2004, the investment intensity effect exceeded the industrial activity effect and became the most important factor leading to the increase in manufacturing carbon emissions (see Figure 3). However, after 2013, the direction of investment intensity effect changed, which has become an important factor in reducing carbon emissions in China’s manufacturing industry. The effects of the R&D efficiency effect and R&D intensity effect on carbon emissions in China’s manufacturing industry can be divided into two stages with 2005 as the node. From 1995 to 2005, R&D efficiency and R&D intensity showed significant volatility. From 2005 to 2015, R&D intensity played a positive role, while R&D efficiency played a negative role. In 2007–2008, the R&D intensity effect and the investment intensity effect and industrial activity effect together became the important factors to promote the increase of carbon emissions in China’s manufacturing industry, while R&D efficiency became the most important factor to reduce emissions in the manufacturing industry (see Figure 3). This is mainly related to the 2008 financial crisis. In response to the financial crisis, China has increased its investment in industrial innovation funds and focused on transforming low-end industries to improve output efficiency, resulting in a short-term decline in manufacturing carbon emissions.
In 2010–2012, the R&D efficiency effects remained the most important factor in reducing manufacturing emissions. After 2012, the R&D efficiency effects gradually weakened and energy intensity once again became a major factor in reducing manufacturing emissions (see Figure 3). Through the analysis of the three new elements, we found that the investment in the industrial enterprises and the direction of R&D are constantly changing due to the changes in the international economic environment and the intervention of relevant national policies at different stages, which has a significant impact on the changes in carbon emissions in the manufacturing industry. Therefore, the impact of investment and R&D behavior must be considered when examining the drivers of manufacturing carbon emissions.
4.3. Decomposition Results in Different Periods
The five-year plan for China’s national economic and social development is an important part of the national economic plan. It mainly plans the major national construction projects, the distribution of productive forces and the important proportion of the national economy and it also sets goals and directions for the prospects for national economic development. Moreover, it is important for both reviewing the historical context of China’s economic development and predicting future economic development. To this end and according to the five-year plan of the national economy, this paper divides the research phase into the four stages of 1995–2000, 2000–2005, 2005–2010 and 2010–2015 that correspond to the time periods of the “Ninth Five-Year Plan,” the “Tenth Five-Year Plan,” the “Eleventh Five-Year Plan” and the “Twelfth Five-Year Plan” of national economic development, respectively. The decomposition results, the growth rate of CO2 emissions and the contribution rates of each decomposition factor are shown in Table 4 and Figure 6.
During 1995–2000, the total CO2 emissions in the Chinese manufacturing sector increased by 156,900 tons. During the period of the “Ninth Five-Year Plan,” China experienced the Asian financial crisis and the development of the manufacturing sector was greatly affected. Although the industrial activity effect was still the main factor that influenced CO2 emissions, its contribution was significantly lower than at any other time stage, which resulted in an increase of 992 million tons of CO2 emissions. At the same time, R&D intensity was also an important factor that contributed to the increase in CO2 emissions during this period by 856 million tons. Energy intensity consumption significantly declined during this period. Energy intensity became the main factor for the reduction of CO2 emissions and resulted in a reduction of 840 million tons. Investment intensity and R&D efficiency were the second- and third-largest factors in reducing CO2 emissions and resulted reductions of CO2 emissions of 581 million tons and 275 million tons, respectively. Fixed asset investment and innovation factors are important factors in manufacturing carbon emissions after industrial activity and energy intensity.
Between 2000 and 2005, CO2 emissions in the Chinese manufacturing sector increased by 1.895 billion tons. This period (“Tenth Five-Year Plan”) saw the rapid growth of the Chinese economy and a gradual increase in investment intensity, as well as a further increase of the added value of the manufacturing sector. Investment intensity, which is the most important factor that affects CO2 emissions, led to an increase in CO2 emissions of 3.338 billion tons. The importance of industrial activity significantly increased compared with the previous period and resulted in an increase in CO2 emissions of 2.398 billion tons. R&D intensity became the most important factor in the reduction of CO2 emissions during this period and resulted in a decrease in CO2 emissions of 2.891 billion tons. At the same time, the energy intensity reduced CO2 emissions by 619 million tons and the R&D efficiency reduced CO2 emissions by 447 million tons. Unlike the Ninth Five-Year Plan period, fixed asset investment and innovation factors became the dominant factors of carbon emissions in the manufacturing industry in this period.
During 2005–2010, CO2 emissions from the Chinese manufacturing sector increased by 1.531 billion tons. During the “Eleventh Five-Year Plan” period, the Chinese economy, especially the export-oriented economy, suffered considerable impact due to the US subprime mortgage crisis in 2008. At the same time, due to the “four trillion economic stimulus plan,” the manufacturing sector rapidly developed and industrial activity became the main factor for the growth of CO2 emissions. However, due to the “package plan” issued by the central government to deal with the financial crisis, the independent innovation capacities of companies were strengthened. Additionally, the energy structure and industrial structure adjustment accelerated, which led to energy intensity and R&D intensity becoming the main factors for reducing CO2 emissions—by 1.941 billion tons and 1.641 billion tons, respectively. Moreover, during this period, the central government insisted that energy conservation and emission reduction should be regarded as important points for expanding domestic demand and maintaining economic growth. This led to a significant decline in the growth rate of CO2 emissions from the manufacturing sector—from 40% in the “Tenth Five-Year” period to less than 10%. During the Twelfth Five-Year Plan period, China increased its R&D investment in energy science and technology and shifted its R&D focus to breaking through key technologies such as energy saving, low carbon, energy storage and intelligence. At the same time, China focused on eliminating a number of backward production capacities with backward technology, poor product quality, high security risks and serious environmental pollution and increased investment in strategic emerging industries characterized by “high efficiency, cleanliness and low carbon” [64]. A series of policies and measures of our country have made obvious changes in the orientation of innovation and production. Therefore, compared with other periods, the role of innovation factors in energy saving and emission reduction of the manufacturing industry was very prominent in this period, while the role of fixed assets investment in increasing carbon emissions of manufacturing industry was relatively weak.
During 2010—2015, Chinese CO2 manufacturing sector emissions increased by 799 million tons. The “Twelfth Five-Year Plan” period saw global economic recovery and rapid economic development in China. Due to a series of energy conservation and emissions reduction policies implemented by the Chinese government [4,5,6,65,66], the growth rate of CO2 emissions significantly slowed. During this period, industrial activity remained the most important factor in the increase in CO2 emissions, followed closely in importance by R&D intensity. Industrial activity increased CO2 emissions by 2.684 billion tons and R&D intensity increased CO2 emissions by 2.430 billion tons. Unlike in other time periods, R&D efficiency became the most important factor in reducing CO2 emissions and resulted in a reduction in CO2 emissions of 2.732 billion tons. This shows that the pace of transformation of manufacturing enterprises (especially polluting industries) accelerated via a series of innovative resource inputs that resulted in a significant reduction in CO2 emissions. At the same time, energy intensity remains an important factor in inhibiting the growth of CO2 emissions and has resulted in a reduction in CO2 emissions of 1.835 billion tons.
4.4. Decomposition Results in Different Sectors
To explore the factors influencing CO2 emissions in different departments of the Chinese manufacturing sector, extended LMDI additive decomposition analysis was used to decompose CO2 emissions from each departments of the manufacturing sector. The results are shown in Table 5 and Figure 7.
The results show that there were differences in the dominant factors that led to changes in CO2 emissions in sub-sectors of manufacturing. Supplementary Tables S1–S8 give the results of eight decomposition effects of rolling base years in various industries. Except for metal products, the effect of industrial activity was the most important factor that led to the increase in CO2 emissions, especially in ferrous metal smelting and rolling, chemical raw materials and products and non-metallic minerals. Except for ferrous metal smelting and rolling, the effect of investment intensity was the second largest factor that led to the increase in CO2 emissions. It accounted for a very high proportion in the three industry sectors of non-metallic minerals, textiles and leather and mechanical and electronic equipment. Among the factors that affected the reduction of CO2 emissions, industry sector differentiation emerged. The most important factor leading to the reduction of CO2 emissions in petroleum processing and coking, non-ferrous metal smelting and rolling, rubber and plastics and metal products was R&D efficiency, whereas in other industry sectors, the factor was energy intensity. In particular, the second important factor that led to the reduction of CO2 emissions in petroleum processing and coking was the industrial structure, which indicates that petroleum processing and coking has achieved industrial transformation and upgrade through the input of a series of innovative factors and industrial restructuring, which has resulted in a gradual reduction in total CO2 emissions. Therefore, we should control the proportion of fixed asset investment in non-metallic mineral products and the textile and leather industries and focus on strengthening the investment of R&D funds in petroleum processing and coking, rubber and plastics products, non-ferrous metal smelting and metal products to improve the production technology of enterprises, which has an important impact on improving the overall carbon emission level of China’s manufacturing industry.
In the LMDI decomposition analysis of CO2 emissions in various industry sectors, the effect of the energy structure was relatively weak. Table 6 shows the changes in energy consumption structure of six major manufacturing industry sectors: ferrous metal smelting and rolling, chemical raw materials and products, non-metallic minerals, petroleum processing and coking, mechanical and electronic equipment and non-ferrous metal smelting and rolling. In 1995, the energy consumption of various industry sectors was dominated by coal and oil. The non-metallic minerals and ferrous metal smelting and rolling accounted for more than 90% of coal and oil consumption and other industry sectors were also above 65%. By 2015, the differentiation of industry sectors was relatively obvious. Ferrous metal smelting and rolling produced the greatest CO2 emissions. The proportions of coal and electricity were 87.40% and 10.15%, respectively. Compared with 1995, the proportions of coal and electricity were slightly higher. The main energy consumption was still mainly based on the consumption of coal and the energy structure remained single. For non-metallic minerals, the proportion of coal decreased from 85.58% in 1995 to 74.58% in 2015 and the proportion of electricity increased from 6.47% to 13.04% at the same time. The proportion of CO2 emissions also showed a downward tendency year by year. The proportion of coal in the non-ferrous metal smelting and rolling dropped significantly, from 53.5% in 1995 to 21.36% in 2015. At the same time, the proportion of electricity increased by more than two times, from 31.58% to 65.01%. However, the proportion of CO2 emissions increased during the same period.
Note that except for non-ferrous metal smelting and rolling and mechanical and electronic equipment, the energy consumption structure of the other four major sectors did not change much, which means that coal and oil consumption remained the most important factors. This situation shows that the overall energy consumption structure of the Chinese manufacturing sector has not greatly changed. The manufacturing sector still relies on the consumption of fossil fuels, such as coal and oil and the task of energy structure adjustment remains very arduous. Coal consumption in the non-ferrous metal smelting and rolling industry has sharply fallen and its proportion of power resource consumption has sharply risen. However, carbon dioxide emissions have shown an upward trend, mainly because Chinese power generation still relies on fossil fuels such as coal and other fossil energy sources. According to statistics, the proportion of thermal power generation in 2015 was 73.71% and the indirect CO2 emissions caused by power consumption were thus huge.
5. Discussion
Based on the research results, in this part, we focus on a comparative analysis of the existing manufacturing CO2 emission factors and decomposition methods. We summarize the shortcomings of this study and the future development directions and propose measures to promote China’s manufacturing CO2 emissions reduction.
5.1. Comparison of Factors that Affect CO2 Emissions
The results show that the industrial activity effect is the main factor that promotes the increase of CO2 emissions and the energy intensity effect is the main factor that inhibits an increase in CO2 emissions, which is consistent with most previous studies [43,44,46,48]. Economic development is the core of China’s reform and opening-up in the past 40 years. The manufacturing industry is one of the most important sectors of China’s economic development. In 2010, China’s manufacturing industry accounted for 19.8% of the world’s manufacturing output, slightly more than the 19.4% of the United States and became the largest manufacturing output country in the world [67]. The proportion of the manufacturing industry in the national economy increased from 23.83% in 1995 to 30.54% in 2015 and its contribution to China’s aggregate economic activity was further strengthened. With the rapid progress of urbanization and industrialization in China, the increasing demand for various types of manufacturing products has led to a continuous increase in CO2 emissions (Figure 8). In 1995–2015, the Chinese government introduced a series of energy-saving and emission reduction policies that reduced the energy intensity from 4.23 tons of standard coal/10,000 yuan in 1995 to 0.90 tons of standard coal/10,000 yuan in 2015 (Figure 9), especially in the period 2005–2010. During the 11th Five-Year Plan period, China’s manufacturing strategy focused on controlling the development of high-energy industries, speeding up the elimination of enterprises with backward production capacity, promoting enterprises to actively adjust their product structure, accelerating the transformation of energy-saving technologies and reducing energy consumption. It has also been proposed that by the end of the “Eleventh Five-Year Plan” period, the energy consumption per 10,000 yuan of GDP (calculated according to 2005 prices) will drop to the development target of 0.98 tons of standard coal. The energy intensity of China’s manufacturing industry has greatly declined, from 2.03 tons of standard coal/10,000 yuan in 2005 to 1.24 tons of standard coal/10,000 yuan in 2010. Therefore, reducing the energy intensity of energy-intensive industries will help to reduce CO2 emissions.
Compared with the previous LMDI decomposition study on the factors that affect CO2 emissions in the manufacturing industry, this paper introduced three micro-factors: R&D efficiency, R&D intensity and investment intensity. It was found that investment and R&D factor inputs have important impacts on CO2 emissions in manufacturing. Between 1995 and 2015, investment intensity was the second factor driving the increase in CO2 emissions after industrial activity. Wang et al. [55] and Wang and Wang [56] also found that in addition to the scale of the industry, fixed asset investment is the most important factor in the growth of carbon emissions. Shao et al. [52] pointed out that fixed asset investment has a dual effect on carbon emissions. If investment is used to upgrade energy-saving and emission-reducing equipment, it will be conducive to reducing carbon emissions, whereas enterprise investment will increase carbon emissions with the goal of expanding production. This study also found that the impact of investment intensity on carbon emissions changed at different stages, showing significant volatility. In 2000–2005, the investment intensity effect exceeded the industrial activity effect and became the dominant factor in the increase of CO2 emissions. During this period, the investment in fixed assets sharply increased, from 289.5 billion yuan in 2000 to 1850.3 billion yuan in 2005 and the proportion of investment in fixed assets in ferrous metal smelting and rolling increased from 4.31% in 2000 to 12.21% in 2005. Fixed assets investment has dramatically increased and investment in polluting enterprises with significant CO2 emissions, such as the smelting and rolling processing industries, led to the investment intensity effect being the most important factor in the increase of CO2 emissions in the manufacturing industry during this period. In 2013–2015, the investment intensity effect once again became a factor in the reduction of carbon emissions in China’s manufacturing industry. In 2012, the state council issued the “12th Five-Year Plan” for energy conservation and emission reduction [5] and identified the main tasks for energy conservation and emission reduction in the 12th Five-Year Plan as follows: to restrain the excessive growth of high-energy-consuming and high-emission industries, to rationally control the growth rate of investment in fixed assets and the development scale of key industries, such as thermal power, steel, cement, paper, printing and dyeing and to promote the use of decarbonization technology in high-pollution and high-carbon emission sectors such as petroleum, petrochemicals and steel. As a result, the investment intensity of fixed assets in energy-consuming and high-emission industries, such as petroleum processing and coking, chemical raw materials and products manufacturing, ferrous metal smelting and rolling and non-ferrous metal smelting and rolling industries, has been significantly reduced and some fixed assets have been invested in the promotion of decarbonization technology, which has led to the investment intensity becoming a factor that contributes to the reduction of CO2 emissions. This shows that the investment direction of manufacturing enterprises has changed under the influence of national energy savings and emissions reduction policy intervention in different periods.
Existing research has found that technological advancement is one of the key factors in improving energy efficiency in China and R&D expenditure is often used as a representative of technology [45,59,68,69]. Therefore, R&D innovation can reflect the impact of technological progress on CO2 emissions to a certain extent. However, the existing CO2 emission decomposition research does not consider R&D innovation elements [52]. This study integrated R&D innovations into the LMDI decomposition model and found that, in addition to energy intensity, R&D efficiency and R&D intensity are important factors in the curbing of CO2 emissions from China’s manufacturing industry. During the period 1995–2015, the contributions of R&D efficiency and R&D intensity to the reduction of CO2 emissions in the manufacturing industry were 22.87% and 13.19%, respectively—much greater than the effects of the industrial structure and emission factors. This shows that R&D efficiency and R&D intensity are important factors for reducing CO2 emissions in China’s manufacturing industry, which is consistent with the research results of Sun [70], who found that the reduction in energy intensity caused by technological advancement is the most important factor in reducing carbon emissions in all sub-sectors of China’s manufacturing industry. Research by Yang and Shi [57] and Herrerias et al. [58] also found that R&D expenditure and innovation activities play important roles in reducing China’s energy intensity. It is worth noting that after the financial crisis in 2008, the direction of the impact of R&D intensity effects on CO2 emissions from manufacturing changed and it has become a factor in promoting the increase of CO2 emissions in manufacturing, which is related to improving production technology and increasing the production scale in China. However, R&D efficiency still plays a role in inhibiting the growth of CO2 emissions and the contribution of R&D efficiency is greater than that of R&D intensity, which indicates that manufacturing enterprises by industrial upgrading and technological innovation can not only improve productivity but can also reduce carbon emissions. Li et al. [60] also found that investment in technological innovation can reduce carbon emissions brought about by economic growth to a large extent. Fernandez et al. [68] found that the input of R&D innovation elements can not only serve as the engine of China’s economic development but also serve as the driving force for sustainable development. That is, in sustainable development, growth can be coordinated with lower carbon dioxide emissions. Therefore, R&D innovation input is an effective way to achieve emission reduction and regional sustainable development of China’s manufacturing industry.
5.2. Comparison of Methods on the Factors that Affect Carbon Emissions
From the perspective of research methods, the common methods for research on the influencing factors of energy utilization and manufacturing emissions are structural decomposition analysis (SDA), the Laspeyres decomposition method (LDM), the logarithmic mean division index (LMDI) method, vector autoregression (VAR) and the STIRPAT model, among others. This paper summarizes the characteristics of commonly used methods, as shown in Table 7. Scholars have used a variety of methods to decompose the influencing factors of energy utilization and carbon emissions, which have laid a solid foundation for future research. However, no method is perfect. Taking VAR as an example, the basic idea of this method is to construct the model by using each endogenous variable in the system as a function of the lag value of all endogenous variables in the system. The advantage is that the endogenous and exogenous variables are not distinguished in advance and that each variable is treated equally, which avoids the arbitrariness of subjective decision-making but requires variables to be stable [71]. Therefore, many stationarity tests are required. The carbon emissions and their influencing factors are usually nonstationary variables and some key factors that affect carbon emissions can be eliminated without passing the stationarity test.
In contrast, the LDMI method is more mature, more widely used and easy to conduct for comparative studies. The LMDI decomposition method has been used to analyze the factors that affect the carbon emissions of manufacturing industries in different countries such as China [16,42], Britain [39], South Korea [38] and Turkey [36]. The decomposition factors usually include five factors (the emission factor, energy structure, energy intensity, industrial structure and industrial activity) that are not sufficiently comprehensive without considering the impact of microeconomic factors such as investment and innovation activities. Another three micro-factors (efficiency, R&D intensity and investment intensity) were introduced by Shao [61] to explore the factors influencing CO2 emissions in Shanghai’s energy industry. Based on the five traditional factors, this research introduced R&D efficiency, R&D intensity and investment intensity into LMDI decomposition to analyze the factors influencing CO2 emissions from China’s manufacturing industry. It was found that R&D innovation factors and fixed asset investment have important effects on the CO2 emissions of China’s manufacturing industry. The LMDI decomposition model with R&D innovation factors and fixed asset investment can better explain the mechanisms of CO2 emissions in China’s manufacturing industry. Therefore, it can provide a reference and comparisons with relevant research and is a useful supplement to the empirical study of the decomposition of influencing factors on carbon emissions in the existing manufacturing industry.
5.3. Policy Recommendations
With the promotion of energy savings and emission reduction in China, the proportion of renewable energy is gradually improving. Due to the limitations on the length of this article, we only presented the CO2 emissions of the manufacturing industry with respect to the use of nonrenewable energy mainly based on fossil energy and the impact of renewable energy on CO2 emissions of manufacturing industry was not presented; this will be the next focus of research. Based on the research results, this paper puts forward some suggestions to promote the development of energy savings and emissions reduction in China’s manufacturing industry.
First, the results show that the industrial activity effect is the most important factor that leads to an increase in CO2 emissions in China’s manufacturing industry; however, we cannot achieve the goal of emission reduction at the expense of manufacturing economic development. Therefore, it is necessary to give priority to the energy savings and emission reduction work of CO2 emission industries, such as ferrous metal smelting and rolling, chemical raw materials and products and non-metallic minerals. By developing a series of carbon emission standards or energy saving standards, we can update the production process and reduce the intensity of energy consumption to achieve the goal of increasing energy consumption and reducing carbon emissions. Moreover, efforts should be made to develop new manufacturing industries with low energy consumption and high efficiency, promote industrial restructuring and improve the level of economic development of the manufacturing industry.
Second, technological progress is an effective way to reduce emissions in manufacturing. It was found that R&D innovation factors play an important role in reducing CO2 emissions in manufacturing. Therefore, the formulation of policies and measures should be accelerated, for example, R&D subsidies for enterprises and tax reduction and exemption to encourage enterprises with large carbon emissions to invest in R&D innovation funds, introduce energy saving and emission reduction technologies and promote the transformation and upgrade of high-energy consumption and high carbon emission industries. With the characteristics of high total energy consumption and high energy intensity, metal smelting and rolling, chemical raw materials and products and non-metallic minerals are the core sectors of carbon emission reduction in the manufacturing industry and are the largest contributors to CO2 emissions in the manufacturing industry. Starting from these typical sectors and carrying out targeted energy-saving technology and low-carbon technology research has important practical significance for energy savings and emission reduction throughout the entire manufacturing industry.
Finally, clean energy technology should be vigorously developed and the single energy consumption structure, which is mainly composed of coal, oil and other types of fossil energy, should be changed. The results of this study show that the energy structure effect has a weak effect on reducing CO2 emissions. Although the proportions of coal consumption in the manufacturing sectors of non-ferrous metal smelting and rolling and non-metallic minerals declined in the years 1995–2015 and the proportion of electric energy consumption significantly increased, the CO2 emissions did not decrease. The main reason for this is that the power energy consumption was mainly thermal power and the indirect CO2 emissions caused by thermal power generation are huge. Therefore, it is necessary to vigorously develop clean energy technologies, such as hydropower, nuclear power, wind power and solar power, to reduce the proportion of thermal power generation and to change the existing single energy consumption structure dominated by coal resources.
6. Conclusions
In this paper, the extended LMDI decomposition model was used to investigate the factors that affected China’s manufacturing CO2 emissions from 1995 to 2015. The results show that CO2 emissions from the manufacturing industry increased from 1.91 billion tons in 1995 to 6.125 billion tons in 2015, with an average annual growth rate of 6%. Ferrous metal smelting and rolling was the largest source of CO2 emissions, followed by chemical raw materials and products and then non-metallic minerals. The above three sectors accounted for nearly 65% of the total emissions of the manufacturing industry and are the most important sectors for the manufacturing industry to target to reduce emissions.
The decomposition results show that during 1995–2015, the industrial activity effect was the most important factor that led to the increase in CO2 emissions in the manufacturing industry; energy intensity was the most important factor that promoted the reduction of CO2 emissions in the manufacturing industry; and other factors, such as the energy structure and industrial structure, played relatively weak roles. The three new elements (investment intensity effect, R&D efficiency and R&D intensity) played important roles in China’s manufacturing CO2 emissions. Among them, investment intensity was the second factor that led to an increase in CO2 emissions in China’s manufacturing industry after the industrial activity effect. In some periods (2000–2005), the industrial activity effect became the most important factor in the increase of CO2 emissions. R&D efficiency and R&D intensity played significant roles in reducing CO2 emissions in China’s manufacturing industry. The input of R&D innovation factors is an effective way to achieve emission reductions in China’s manufacturing industry.
The study found that the driving factors of CO2 emissions of the manufacturing industry were different in different periods (“the Ninth Five-Year Plan,” “the Tenth Five-Year Plan,” “the Eleventh Five-Year Plan” and “the Twelfth Five-Year Plan”), which was mainly related to the changes in international and domestic economic environment at various stages and the relevant energy conservation and emission reduction policies implemented by the Chinese government. Sub-sector research found that the factors that affected the reduction of CO2 emissions in various industries appeared differentiated. R&D efficiency is the most important factor for CO2 emission reduction in petroleum processing and coking, non-ferrous metal smelting and rolling, rubber and plastics and metal products, whereas other industries are energy-intensity effective.
Supplementary Materials
The following are available online at https://www.mdpi.com/2071-1050/11/1/226/s1, Table S1: The emission factor effect of extended LMDI decomposition by industry (rolling base year). Unit:104 tons, Table S2. The energy structure effect of extended LMDI decomposition by industry (rolling base year), Table S3. The energy intensity effect of extended LMDI decomposition by industry (rolling base year), Table S4. The R&D efficiency effect of extended LMDI decomposition by industry (rolling base year), Table S5. The R&D intensity effect of extended LMDI decomposition by industry (rolling base year), Table S6. The investment intensity effect of extended LMDI decomposition by industry (rolling base year), Table S7. The industrial structure effect of extended LMDI decomposition by industry (rolling base year), Table S8. The industrial activity effect of extended LMDI decomposition by industry (rolling base year).
Author Contributions
Q.Y. designed and conceived this research; J.L. established the proposed model and wrote the paper; Y.Z. helped to build the extended LMDI approach; W.S. and Y.X. processed and analyzed the data.
Funding
The study is supported by “the National Natural Science Funds of China” (Grant Nos. 41771126 and 41571115).
Acknowledgments
The authors thank the anonymous reviewers for careful reading and many helpful suggestions to improve the presentation of this paper.
Conflicts of Interest
The authors declare no conflict of interest.
References
- Intergovernmental Panel on Climate Change (IPCC). Fifth Assessment Report, Working Group III, Summary for Policymakers. 2014. Available online: http://www.ipcc.ch/report/ar5/wg3/ (accessed on 27 October 2018).
- International Energy Agency (IEA). World Energy Outlook 2008; IEA: Paris, France, 2008. [Google Scholar]
- Notice of the State Council Issuing “Work Plan on Controlling Greenhouse Gas Emission in the Twelfth Five-Year Plan”. Available online: http://www.gov.cn/zhengce/content/2012-01/13/content_1294.htm (accessed on 17 July 2018).
- Notice of the State Council Issuing “Work Plan on Energy Saving and Emission reduction in the Twelfth Five-Year Plan”. Available online: http://www.gov.cn/zhengce/content/2012-08/12/content2728.htm (accessed on 17 July 2018).
- Notice of the General Office of the State Council Issuing “Action Plan on Energy Conservation, Emission Reduction and Low Carbon Development in 2014–2015”. Available online: http://www.gov.cn/zhengce/content/2014-05/26/content_8824.htm (accessed on 17 July 2018).
- Notice of the State Council Issuing “Integrated Work Plan on Energy Saving and Emission Reduction in the Thirteenth Five-Year Plan”. Available online: http://www.gov.cn/zhengce/content/2017-01/05/content_5156789.htm (accessed on 17 July 2018).
- Rose, A.; Casler, S. Input–Output Structural Decomposition Analysis: A Critical Appraisal. Econ. Syst. Res. 2006, 8, 33–62. [Google Scholar] [CrossRef]
- Su, B.; Ang, B.W. Structural decomposition analysis applied to energy and emissions: Some methodological developments. Energy Econ. 2012, 34, 177–188. [Google Scholar] [CrossRef]
- Albrecht, J.; François, D.; Schoors, K. A Shapley decomposition of carbon emissions without residuals. Energy Policy 2002, 30, 727–736. [Google Scholar] [CrossRef]
- Ang, B.W.; Liu, F.L.; Chew, E.P. Perfect decomposition techniques in energy and environmental analysis. Energy Policy 2003, 31, 1561–1566. [Google Scholar] [CrossRef]
- Ang, B.W. The LMDI approach to decomposition analysis: A practical guide. Energy Policy 2005, 33, 867–871. [Google Scholar] [CrossRef]
- Ang, B.W.; Liu, N. Negative-value problems of the logarithmic mean Divisia index decomposition approach. Energy Policy 2007, 35, 739–742. [Google Scholar] [CrossRef]
- Sheinbaum, C.; Ozawa, L.; Castillo, D. Using logarithmic mean Divisia index to analyze changes in energy use and carbon dioxide emissions in Mexico’s iron and steel industry. Energy Econ. 2010, 32, 1337–1344. [Google Scholar] [CrossRef]
- Olanrewaju, O.A. Energy consumption in South African industry: A decomposition analysis using the LMDI approach. Energy Environ. 2018, 29, 232–244. [Google Scholar] [CrossRef]
- Román, R.; Cansino, J.M.; Rodas, J.A. Analysis of the Main Drivers of CO2 Emissions Changes in Colombia (1990–2012) and its Political Implications. Renew. Energy 2017, 116, 402–411. [Google Scholar] [CrossRef]
- Zhang, M.; Mu, H.; Ning, Y.; Song, Y. Decomposition of energy-related CO2 emission over 1991–2006 in China. Ecol. Econ. 2009, 68, 2122–2128. [Google Scholar] [CrossRef]
- Ma, L.; Chong, C.; Zhang, X.; Liu, P.; Li, W.; Li, Z.; Ni, W. LMDI Decomposition of Energy-Related CO2 Emissions Based on Energy and CO2 Allocation Sankey Diagrams: The Method and an Application to China. Sustainability 2018, 10, 344. [Google Scholar] [CrossRef]
- Xu, S.; He, Z.; Long, R.; Hong, C. Factors that influence carbon emissions due to energy consumption based on different stages and sectors in China. J. Clean. Prod. 2016, 115, 139–148. [Google Scholar] [CrossRef]
- Wang, F.; Wang, C.; Su, Y.; Jin, L.; Wang, Y.; Zhang, X. Decomposition Analysis of Carbon Emission Factors from Energy Consumption in Guangdong Province from 1990 to 2014. Sustainability 2017, 9, 274. [Google Scholar] [CrossRef]
- Wang, Z.; Zhao, L.; Mao, G.; Wu, B. Factor Decomposition Analysis of Energy-Related CO2 Emissions in Tianjin, China. Sustainability 2015, 7, 9973–9988. [Google Scholar] [CrossRef]
- Dong, J.; Deng, C.; Wang, X.; Zhang, X. Multilevel Index Decomposition of Energy-Related Carbon Emissions and Their Decoupling from Economic Growth in Northwest China. Energies 2016, 9, 680. [Google Scholar] [CrossRef]
- Wang, W.; Kuang, Y.; Huang, N. Study on the Decomposition of Factors Affecting Energy-Related Carbon Emissions in Guangdong Province, China. Energies 2011, 4, 2249–2272. [Google Scholar] [CrossRef] [Green Version]
- Chen, L.; Yang, Z.; Chen, B. Decomposition Analysis of Energy-Related Industrial CO2 Emissions in China. Energies 2013, 6, 2319–2337. [Google Scholar] [CrossRef]
- Liu, L.; Fan, Y.; Wu, G.; We, Y. Using LMDI method to analyze the change of China’s industrial CO2 emissions from final fuel use: An empirical analysis. Energy Policy 2007, 35, 5892–5900. [Google Scholar] [CrossRef]
- Xie, X.; Shao, S.; Lin, B. Exploring the driving forces and mitigation pathways of CO2, emissions in China’s petroleum refining and coking industry: 1995–2031. Appl. Energy 2016, 184, 1004–1015. [Google Scholar] [CrossRef]
- Lin, B.; Moubarak, M. Decomposition analysis: Change of carbon dioxide emissions in the Chinese textile industry. Renew. Sustain. Energy Rev. 2013, 26, 389–396. [Google Scholar] [CrossRef]
- Zhang, L.; Shen, Q.; Wang, M.; Sun, N.; Wei, W.; Lei, Y.; Wang, Y. Driving factors and predictions of CO2 emission in China’s coal chemical industry. J. Clean. Prod. 2018, 210, 1131–1140. [Google Scholar] [CrossRef]
- Du, G.; Sun, C.; Ouyang, X.; Zhang, C. A decomposition analysis of energy-related CO2 emissions in Chinese six high-energy intensive industries. J. Clean. Prod. 2018, 184, 1102–1112. [Google Scholar] [CrossRef]
- Zhao, M.; Tan, L.; Zhang, W.; Ji, M.; Liu, Y.; Yu, L. Decomposing the influencing factors of industrial carbon emissions in Shanghai using the LMDI method. Energy 2010, 35, 2505–2510. [Google Scholar] [CrossRef]
- Deng, M.; Li, W.; Hu, Y. Decomposing Industrial Energy-Related CO2 Emissions in Yunnan Province, China: Switching to Low-Carbon Economic Growth. Energies 2016, 9, 23. [Google Scholar] [CrossRef]
- Wu, R.; Zhang, J.; Bao, Y.; Zhang, F. Decomposing the Influencing Factors of Industrial Sector Carbon Dioxide Emissions in Inner Mongolia Based on the LMDI Method. Sustainability 2016, 8, 661. [Google Scholar] [CrossRef]
- Chung, W.; Zhou, G.; Yeung, I.M.H. A study of energy efficiency of transport sector in China from 2003 to 2009. Appl. Energy 2013, 112, 1066–1077. [Google Scholar] [CrossRef]
- Xie, P.; Gao, S.; Sun, F. An analysis of the decoupling relationship between CO2 emission in power industry and GDP in China based on LMDI method. J. Clean. Prod. 2018, 211, 598–606. [Google Scholar] [CrossRef]
- Xian, Y.; Wang, K.; Shi, X.; Zhang, C.; Wei, Y. Carbon emissions intensity reduction target for China’s power industry: An efficiency and productivity perspective. J. Clean. Prod. 2018, 197, 1022–1034. [Google Scholar] [CrossRef]
- Yeo, Y.; Shim, D.; Lee, J.; Altmann, J. Driving Forces of CO2 Emissions in Emerging Countries: LMDI Decomposition Analysis on China and India’s Residential Sector. Sustainability 2015, 7, 16108–16129. [Google Scholar] [CrossRef]
- Akbostancı, E.; Tunç, G.İ.; Türüt-Aşık, S. CO2 emissions of Turkish manufacturing industry: A decomposition analysis. Appl. Energy 2011, 88, 2273–2278. [Google Scholar] [CrossRef]
- Kim, S. LMDI Decomposition Analysis of Energy Consumption in the Korean Manufacturing Sector. Sustainability 2017, 9, 202. [Google Scholar] [CrossRef]
- Jeong, K.; Kim, S. LMDI decomposition analysis of greenhouse gas emissions in the Korean manufacturing sector. Energy Policy 2013, 62, 1245–1253. [Google Scholar] [CrossRef]
- Hammond, G.P.; Norman, J.B. Decomposition analysis of energy-related carbon emissions from UK manufacturing. Energy 2012, 41, 220–227. [Google Scholar] [CrossRef] [Green Version]
- Ang, B.W.; Pandiyan, G. Decomposition of energy-induced CO2 emissions in manufacturing. Energy Econ. 1997, 19, 363–374. [Google Scholar] [CrossRef]
- Schipper, L.; Murtishaw, S. Carbon emissions from manufacturing energy use in 13 IEA countries: Long-term trends through 1995. Energy Policy 2001, 29, 667–688. [Google Scholar] [CrossRef]
- Ren, S.; Yin, H.; Chen, X. Using LMDI to analyze the decoupling of carbon dioxide emissions by China’s manufacturing industry. Environ. Dev. 2014, 9, 61–75. [Google Scholar] [CrossRef]
- Xue, Z. Analysis of estimation of CO2 emission and its index decomposition in Chinese manufacturing industry. Econ. Probl. 2011, 76–79. Available online: http://en.cnki.com.cn/Article_en/CJFDTOTAL-JJWT201103020.htm (accessed on 30 October 2018).
- Wang, X.; Ren, S.; Yuan, B.; Fu, X. Using LMDI to analyze the decoupling of carbon dioxide emissions by China’s manufacturing industry. J. Cent. South Univ. (Soc. Sci.) 2015, 21, 138–144. [Google Scholar]
- Wang, D.; Nie, R. Empirical study of Chinese manufacturing industry’s carbon emission status and its influence factors. J. Arid Land Resour. Environ. 2012, 26, 132–136. [Google Scholar]
- Ma, X.; Sun, L.; Hu, G.; Ji, J. Decomposition of China’s Manufacturing Carbon Emission Factors-Based on the Study of Internal Structure Changes in Manufacturing Industry. Modern Manag. Sci. 2016, 64–66. Available online: http://www.wanfangdata.com.cn/details/detail.do?_type=perio&id=xdglkx201610021 (accessed on 30 October 2018).
- Chen, C.; Gong, Z. The Research on the Change Points and Cycles of Carbon Dioxide Emissions of China’s Manufacturing Industry from 1985 to 2010. Forum Sci. Technol. China 2013, 1, 51–59. [Google Scholar]
- Xu, Y.; Xu, K.; Hu, Y. Driving Factors and Decoupling Effect of Carbon Emissions: Evidence from China’s Manufacturing Sector. Stat. Res. 2011, 28, 55–61. [Google Scholar]
- Pan, X.; Shu, T.; Xu, D. On the Changes in the Carbon Emission Intensity of China’s Manufacturing Industry and Its Factors Decomposition. China Popul. Resour. Environ. 2011, 21, 101–105. [Google Scholar]
- Li, Z.; Shao, S.; Shi, X.; Sun, X.; Zhang, X. Structural transformation of manufacturing, natural resource dependence, and carbon emissions reduction: Evidence of a threshold effect from China. J. Clean. Prod. 2018, 206, 920–927. [Google Scholar] [CrossRef]
- Lin, B.; Ouyang, X. Analysis of energy-related CO2 (carbon dioxide) emissions and reduction potential in the Chinese non-metallic mineral products industry. Energy 2014, 68, 688–697. [Google Scholar] [CrossRef]
- Shao, S.; Zhang, X.; Zhao, X. Empirical Decomposition and Peaking Pathway of Carbon Dioxide Emissions of China’s Manufacturing Sector-Generalized Divisia Index Method and Dynamic Scenario Analysis. China Ind. Econ. 2017, 3, 44–63. [Google Scholar]
- Chen, S.; Yan, F.; Wu, R. Capital Deepening, Productivity Promotion and CO2 Emission in China. Financ. Trade Econ. 2010, 12, 111–119. [Google Scholar]
- Dong, F.; Yang, Q.; Long, R.; Cheng, S. Factor Decomposition and Dynamic Simulation of China’s Carbon Emissions. China Popul. Resour. Environ. 2015, 25, 1–8. [Google Scholar]
- Wang, C.; Zhang, H.; Ye, Y. Multivariate Driving Factors of Energy Consumption Carbon Emissions in Guangdong Province: Based on Extended STIRPAT Model. Res. Sci. Technol. Manag. 2017, 37, 210–214. [Google Scholar]
- Wang, F.; Wang, C. Multivariate Driving Factor Analysis of Energy Consumption Carbon Emission in Xinjiang Based on Extended STIRPAT Model. Arid Reg. Geogr. 2017, 40, 441–452. [Google Scholar]
- Yang, S.; Shi, X. Intangible capital and sectoral energy intensity: Evidence from 40 economies between 1995 and 2007. Energy Policy 2018, 122, 118–128. [Google Scholar] [CrossRef]
- Herrerias, M.J.; Cuadros, A.; Luo, D. Foreign versus indigenous innovation and energy intensity: Further research across Chinese regions. Appl. Energy 2015, 162, 1374–1384. [Google Scholar] [CrossRef]
- Ding, W.; Wu, X.; Sun, N.; Wang, G.; Chao, W. Analyzing Impact Factors of Manufacturing CO2 Emission in China Based on the STIRPAT Model. J. Appl. Stat. Manag. 2012, 31, 499–506. [Google Scholar]
- Li, Z.; Xu, C.; Zhang, M. Energy Consumption Intensity, Structure, Technological Innovation and Carbon Emission in China: An Empirical Analysis Based on Panel Data Model. Friends Account. 2013, 7, 53–57. [Google Scholar]
- Shao, S.; Yang, L.; Gan, C.; Cao, J.; Geng, Y.; Guan, D. Using an extended LMDI model to explore techno-economic drivers of energy-related industrial CO2, emission changes: A case study for Shanghai (China). Renew. Sustain. Energy Rev. 2016, 55, 516–536. [Google Scholar] [CrossRef]
- National Date. Available online: http://data.stats.gov.cn/gjwz.htm (accessed on 30 October 2018).
- Notice of the General Office of the State Council Issuing “Arrangements for Energy Saving and Emission Reduction in 2008”. Available online: http://www.gov.cn/zhengce/content/2016-09/22/content5110758.htm (accessed on 14 December 2018).
- Notice of the State Council Issuing “Energy Development of the Twelfth Five-Year Plan”. Available online: http://www.nea.gov.cn/2013-01/28/c_132132808.htm (accessed on 14 December 2018).
- Notice of the General Office of the State Council Issuing “Some Opinions on Further Increasing Energy Conservation and Emission Reduction and Accelerating the Structural Adjustment of the Steel Industry”. Available online: http://www.gov.cn/zhengce/content/2010-06/17/content4864.htm (accessed on 30 October 2018).
- Notice of the State Council Issuing “Strengthening Efforts to Ensure the Realization of the Energy Saving and Emission Reduction Targets of the Eleventh Five-Year Plan”. Available online: http://www.gov.cn/zhengce/content/2010-05/05/content_4872.htm (accessed on 30 October 2018).
- ifeng.com. Available online: http://finance.ifeng.com/news/hqcj/20110314/3650190.shtml (accessed on 30 October 2018).
- Fernández, Y.F.; López, M.A.F.; Blanco, B.O. Innovation for sustainability: The impact of R&D spending on CO2, emissions. J. Clean. Prod. 2018, 172, 3459–3467. [Google Scholar]
- He, B.; Zhao, D.; Zhu, J.; Darko, A.; Gou, Z. Promoting and implementing urban sustainability in China: An integration of sustainable initiatives at different urban scales. Habitat Int. 2018, 82, 83–93. [Google Scholar] [CrossRef]
- Sun, N. Carbon Emission Reduction of Manufacturing Rely on Technical Progress. Forum Sci. Technol. China 2011, 4, 44–48. [Google Scholar]
- Li, X.; Yao, Z. Analysis of Influential Factors of Carbon Emissions for Energy Consumption in China Based on Vector Autoregression Model. Ecol. Econ. 2014, 30, 39–44. [Google Scholar]
- Xia, Y.; Chen, X.; Yang, C. Comparative Research of Two Decomposition Methods in Structural Decomposition Analysis. Oper. Res. Manag. Sci. 2010, 19, 27–33. [Google Scholar]
- Ang, B.; Zhang, F. A Survey of Index Decomposition Analysis in Energy and Environmental Studies. Energy 2000, 25, 1149–1176. [Google Scholar] [CrossRef]
- Lin, X.; Polenske, K.R. Input–Output Anatomy of China’s Energy Use Changes in the 1980s. Econ. Syst. Res. 1995, 7, 67–84. [Google Scholar] [CrossRef]
- Dietzenbacher, E.; Stage, J. Mixing oil and water? Using hybrid input-output tables in a Structural decomposition analysis. Econ. Syst. Res. 2006, 18, 85–95. [Google Scholar] [CrossRef]
- Magazzino, C. A Panel VAR Approach of the Relationship Among Economic Growth, CO2 Emissions, and Energy Use in the ASEAN-6 Countries. Int. J. Energy Econ. Policy 2014, 4, 546–553. [Google Scholar]
- Xu, B.; Lin, B. Assessing CO2, emissions in China’s iron and steel industry: A dynamic vector autoregression model. Appl. Energy 2016, 161, 375–386. [Google Scholar] [CrossRef]
- Magazzino, C. CO2 emissions, economic growth, and energy use in the Middle East countries: A panel VAR approach. Energy Sources Part B Econ. Plan. Policy 2016, 11, 960–968. [Google Scholar] [CrossRef]
- Shafiei, S.; Salim, R. Non-renewable and Renewable Energy Consumption and CO2 Emissions in OECD Countries: A Comparative Analysis. Energy Policy 2014, 66, 547–556. [Google Scholar] [CrossRef]
- Lin, S.; Wang, S.; Marinova, D.; Zhao, D. Improvement of STIRPAT Model and Its Application. Stat. Decis. 2018, 32–34. Available online: http://www.cnki.com.cn/Article/CJFDTotal-TJJC20180828008.htm (accessed on 30 October 2018).
- He, X.; Zhang, Y. Influence Factors and Environmental Kuznets Curve Relink Effect of Chinese Industry’s Carbon Dioxide Emission—Empirical Research Based on STIRPAT Model with Industrial Dynamic Panel Data. China Ind. Econ. 2012, 1, 26–35. [Google Scholar]
- Dietz, T.; Rosa, E.A. Rethinking the Environmental Impacts of Population, Affluence and Technology. Hum. Ecol. Rev. 1994, 1, 277–300. [Google Scholar]
- Vaninsky, A. Factorial Decomposition of CO2 Emissions: A Generalized Divisia Index Approach. Energy Econ. 2014, 45, 389–400. [Google Scholar] [CrossRef]
Figure 1.
Changes of CO2 emissions and growth rates in China’s manufacturing industry.

Figure 2.
Cumulative percentages of CO2 emissions from different sectors of China’s manufacturing industry.
Figure 2.
Cumulative percentages of CO2 emissions from different sectors of China’s manufacturing industry.

Figure 3.
Variation of CO2 and contribution rates of each decomposition factor.

Figure 4.
Trends of five conventional factors.

Figure 5.
Trends of three novel factors.

Figure 6.
CO2 emission growth rates and contribution rates of each decomposition factor in each period.
Figure 6.
CO2 emission growth rates and contribution rates of each decomposition factor in each period.

Figure 7.
Contribution rates of decomposition factors in various industries from 1995 to 2015.

Figure 8.
Changes in CO2 emissions and the added value of China’s manufacturing industry.

Figure 9.
Changes in the energy consumption intensity of China’s manufacturing industry.


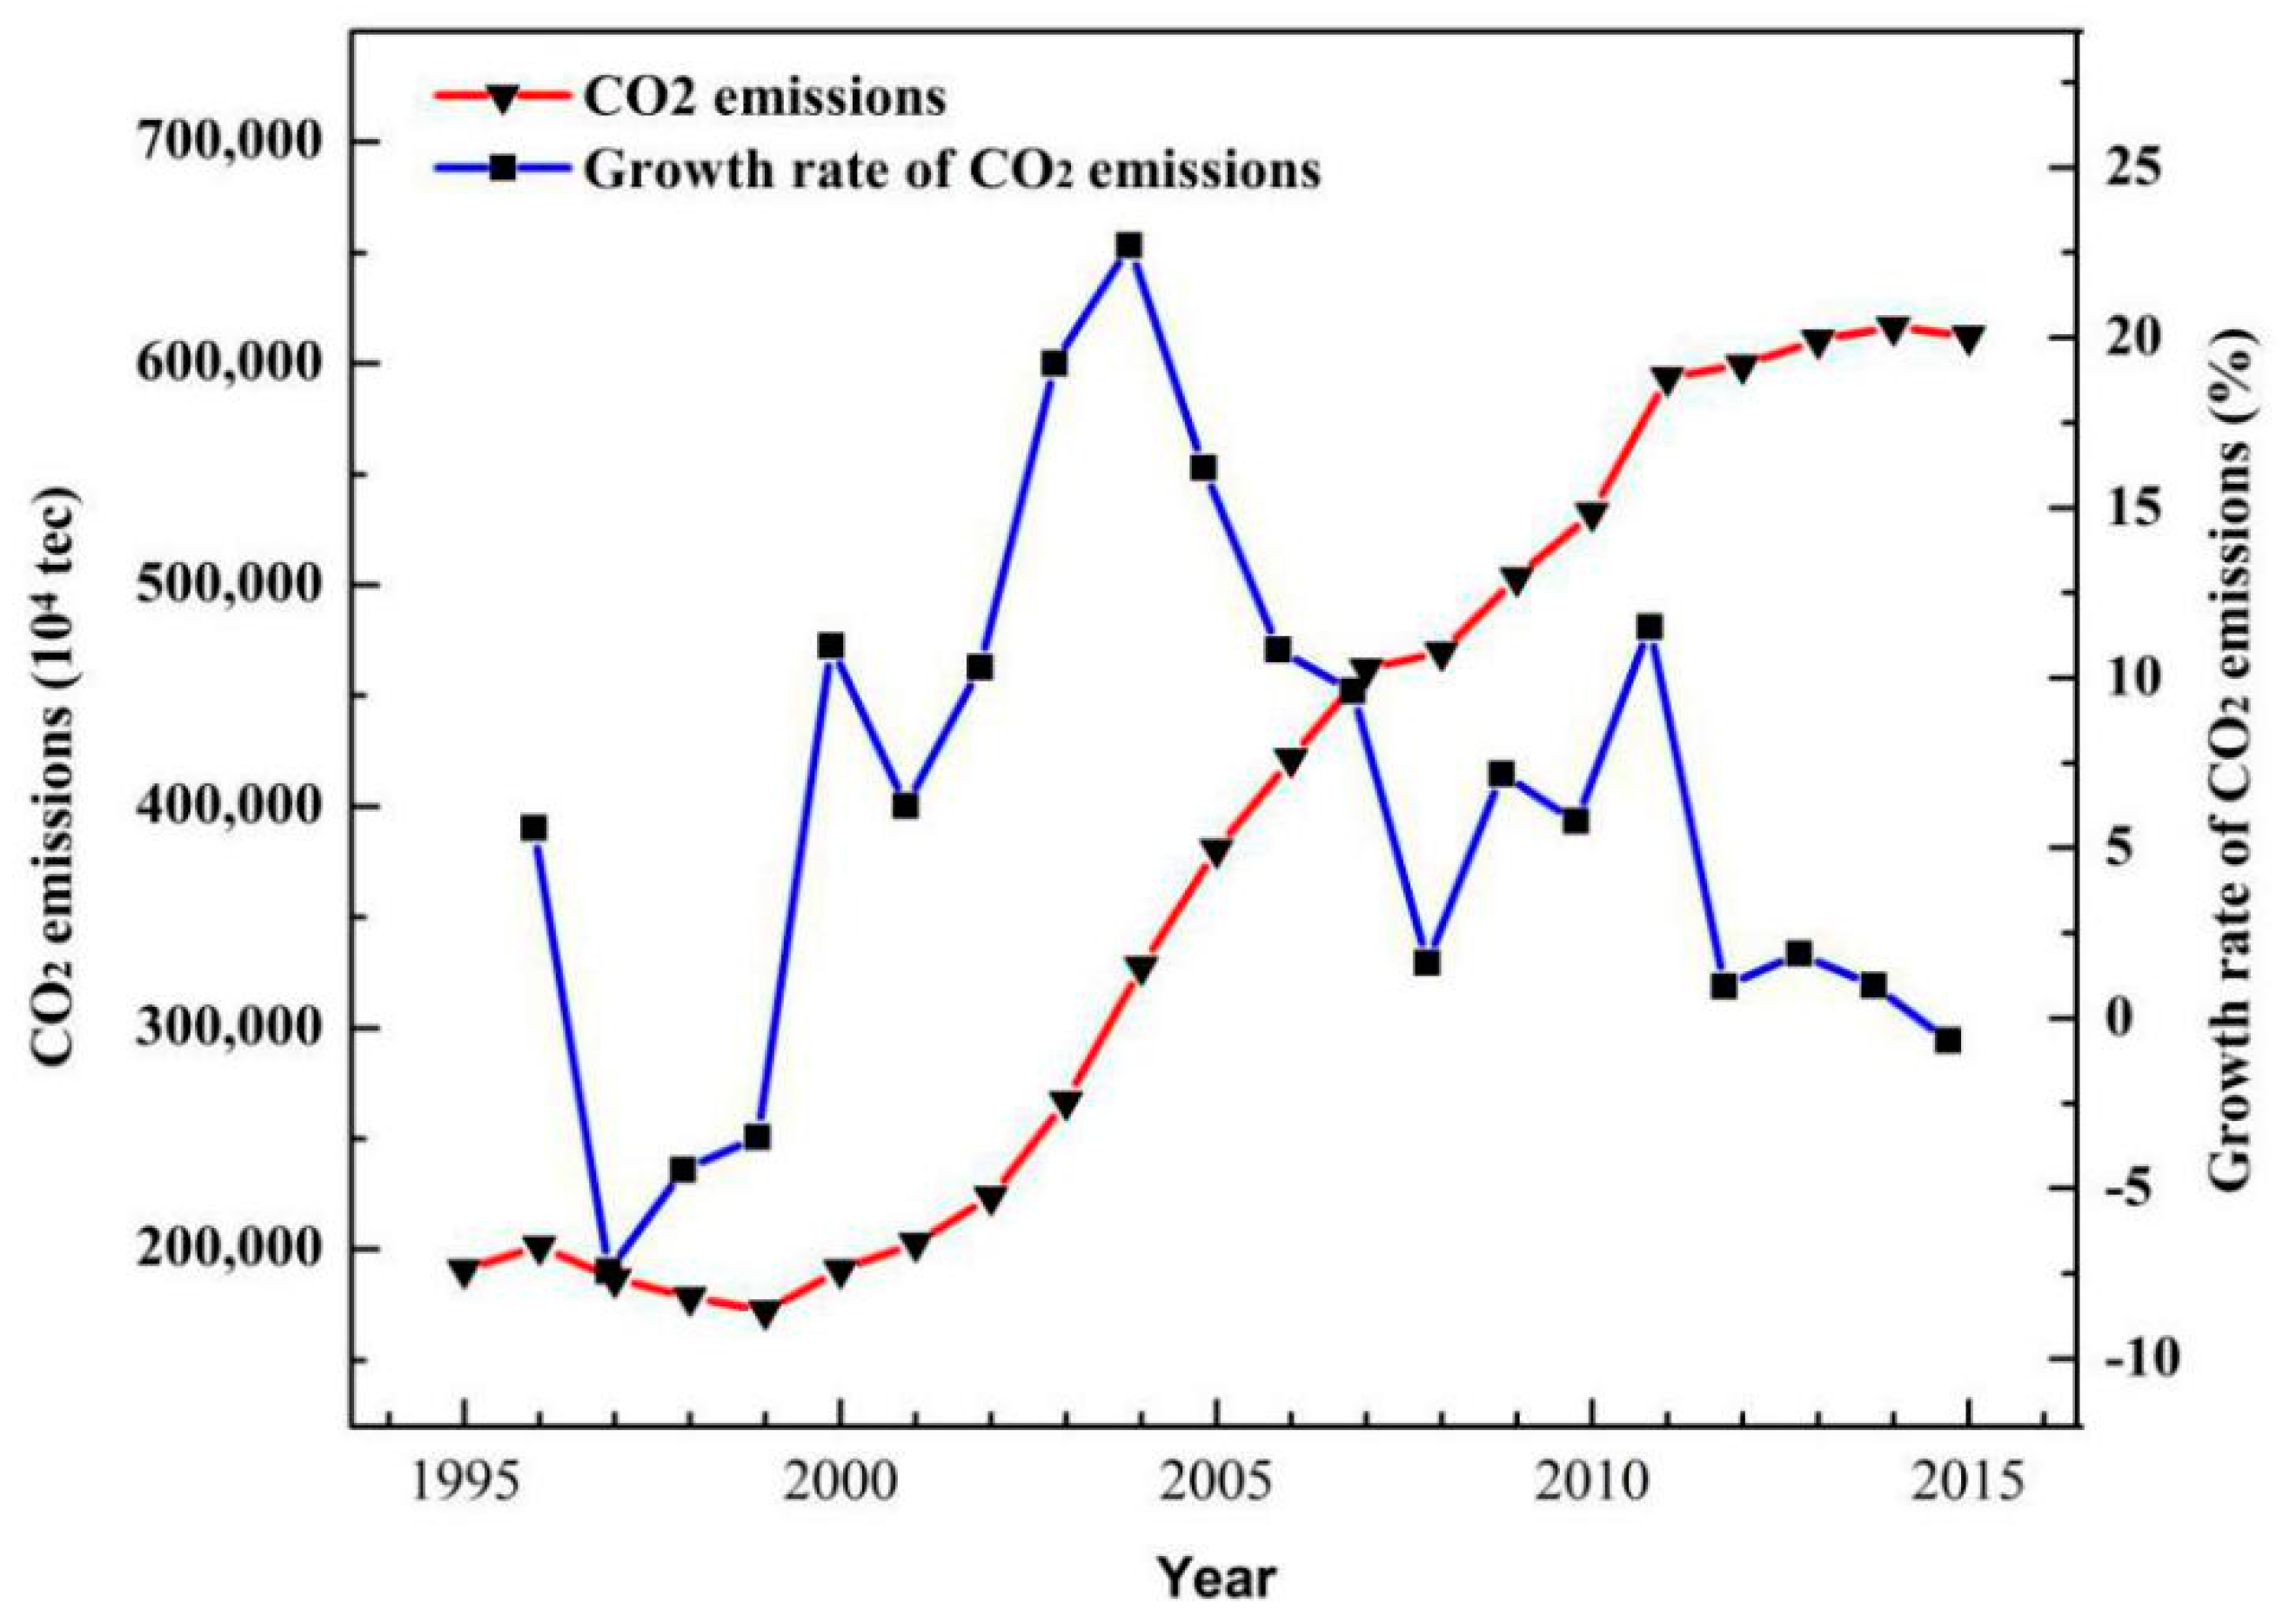
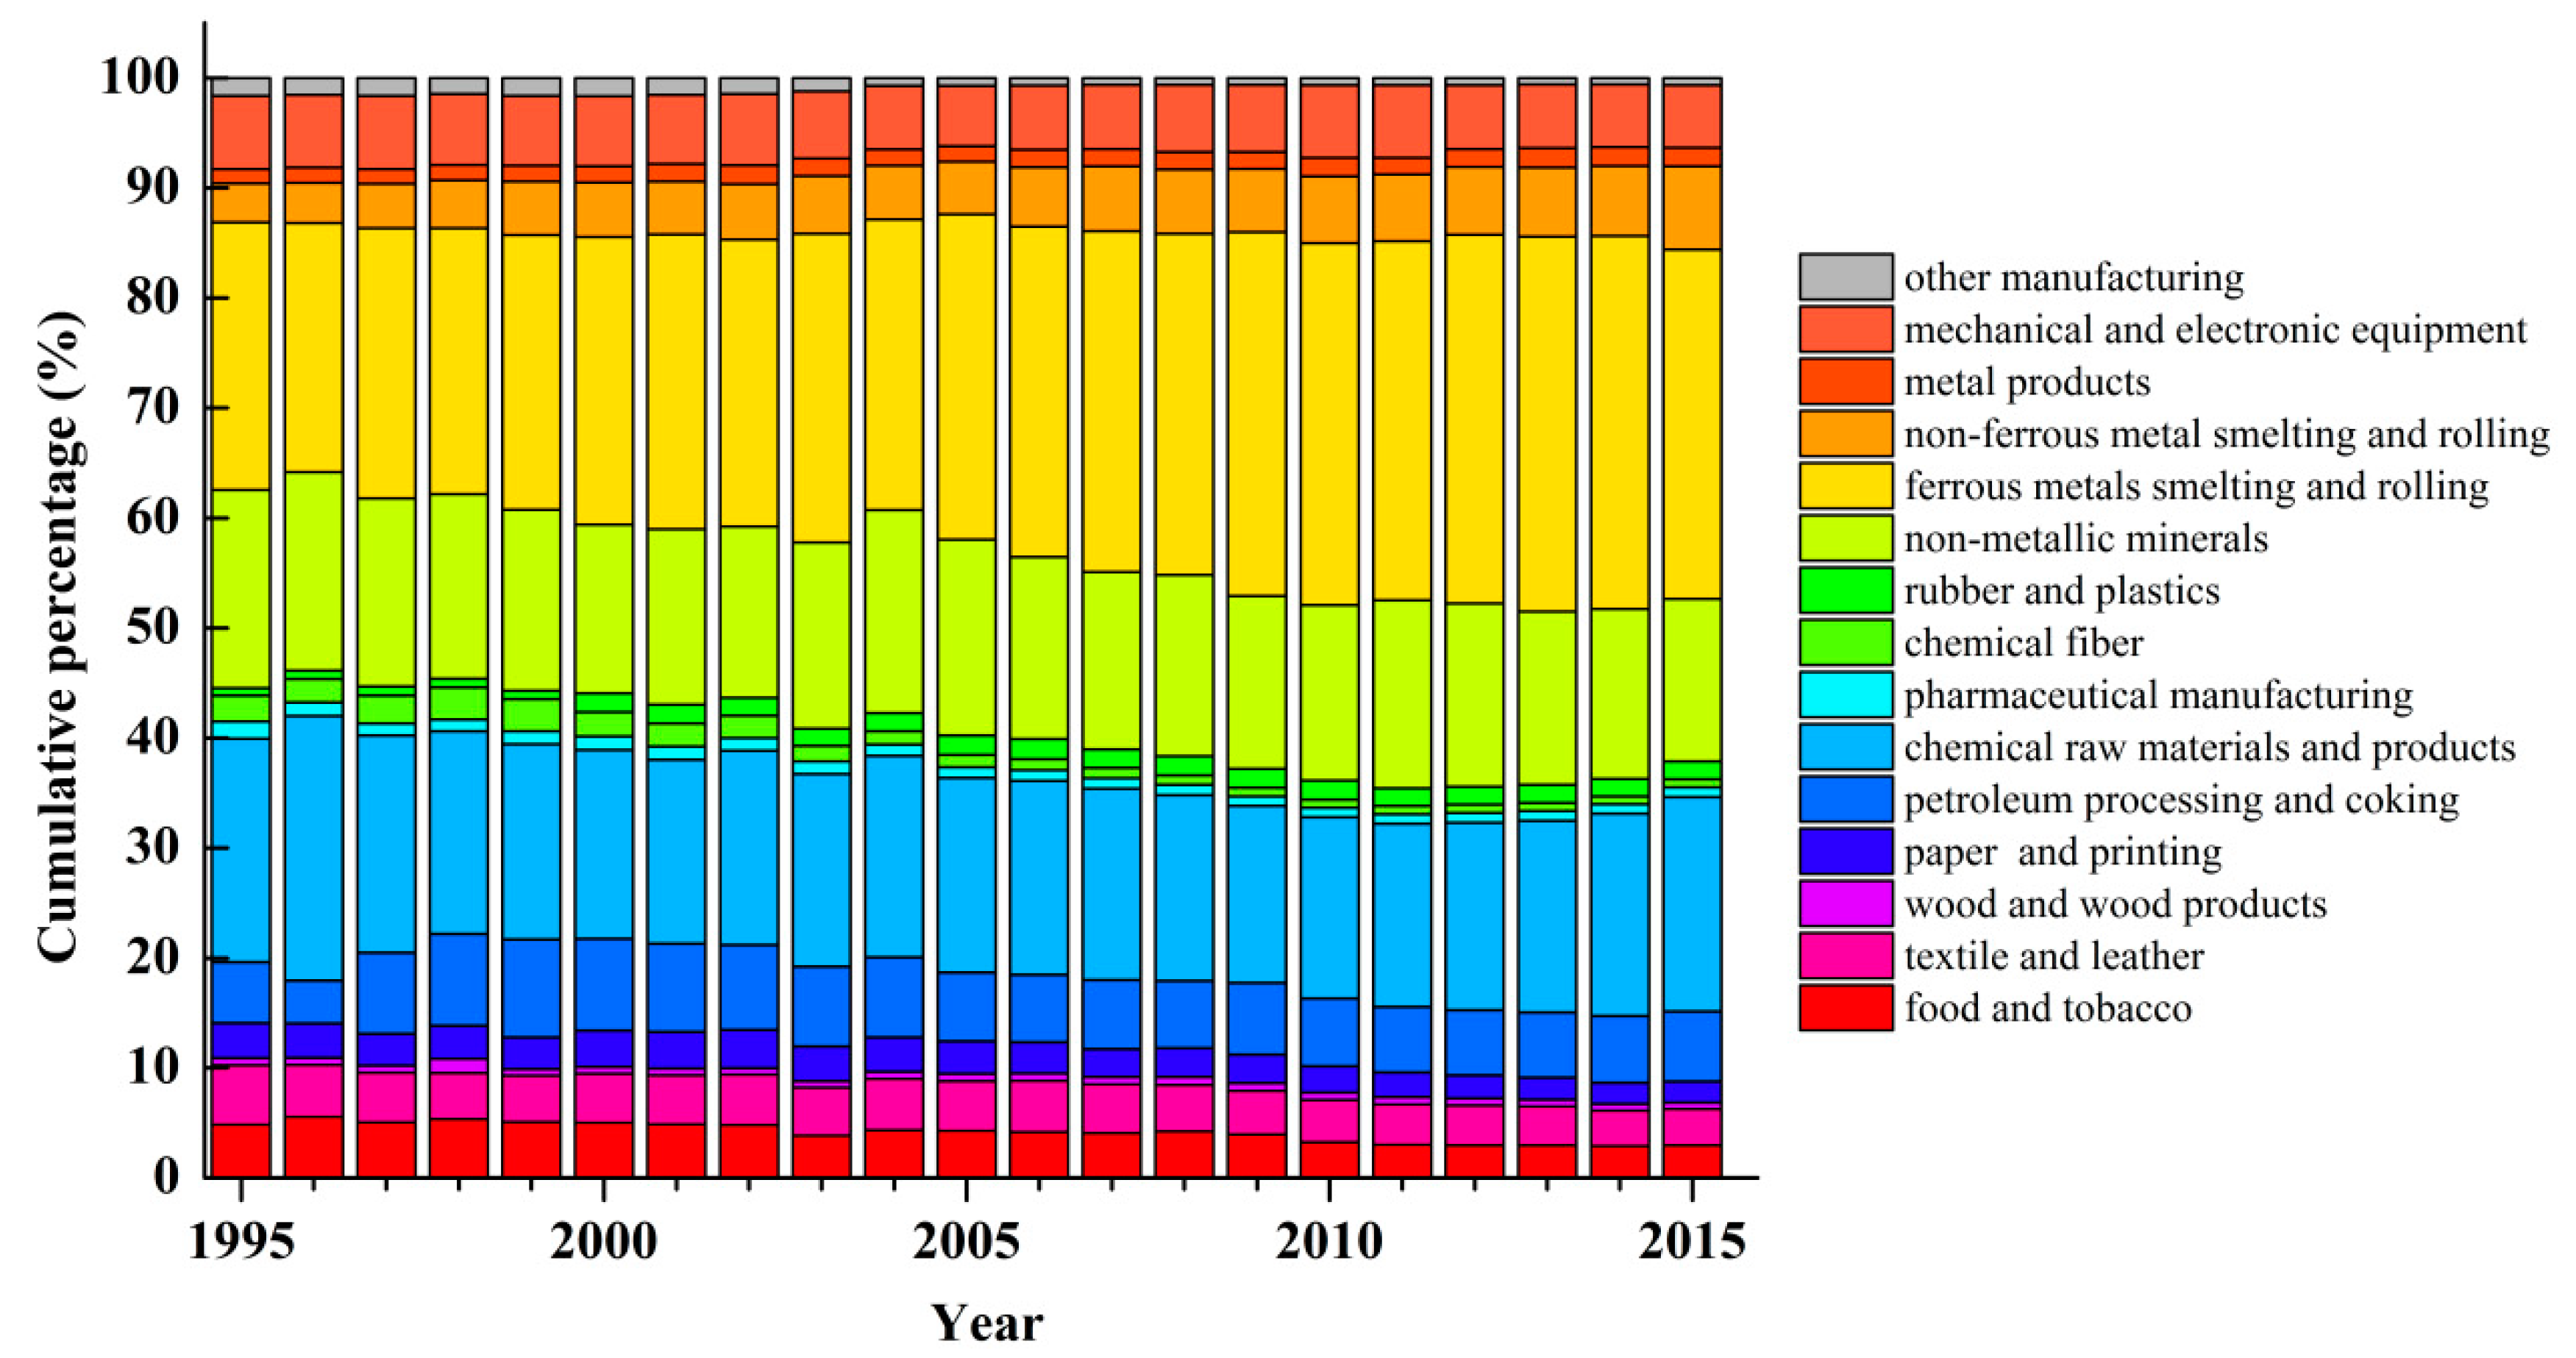
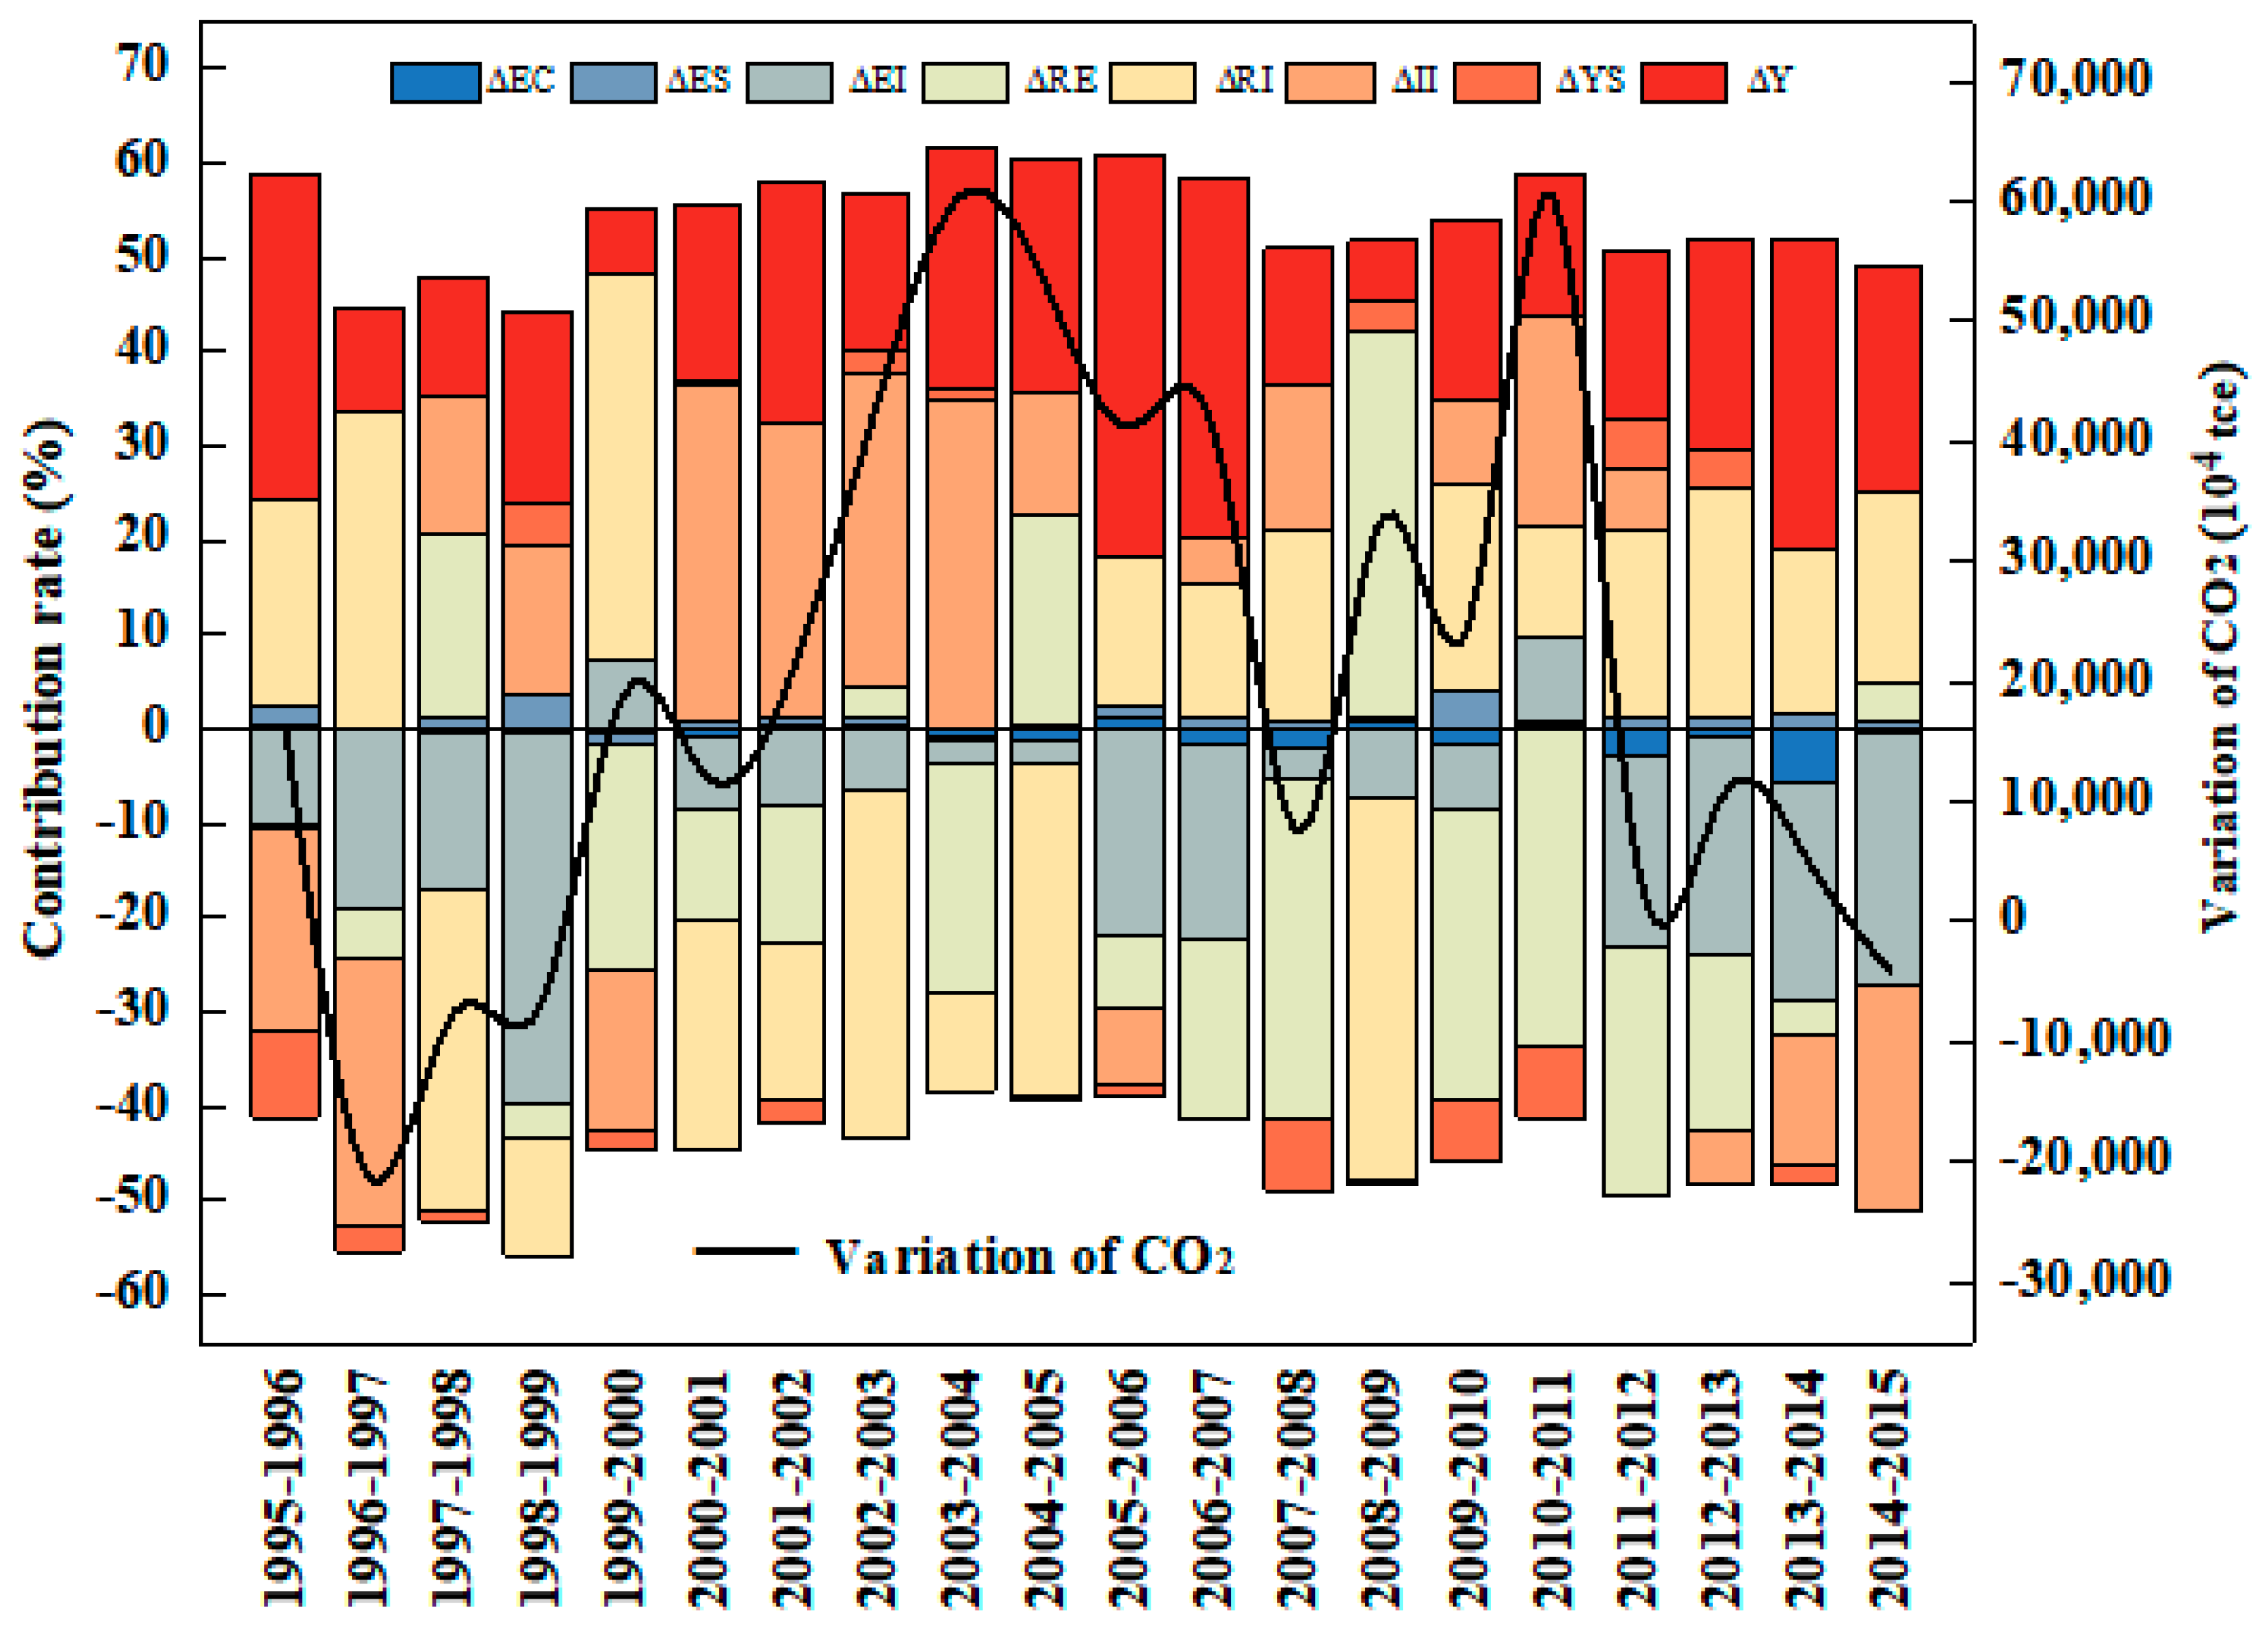
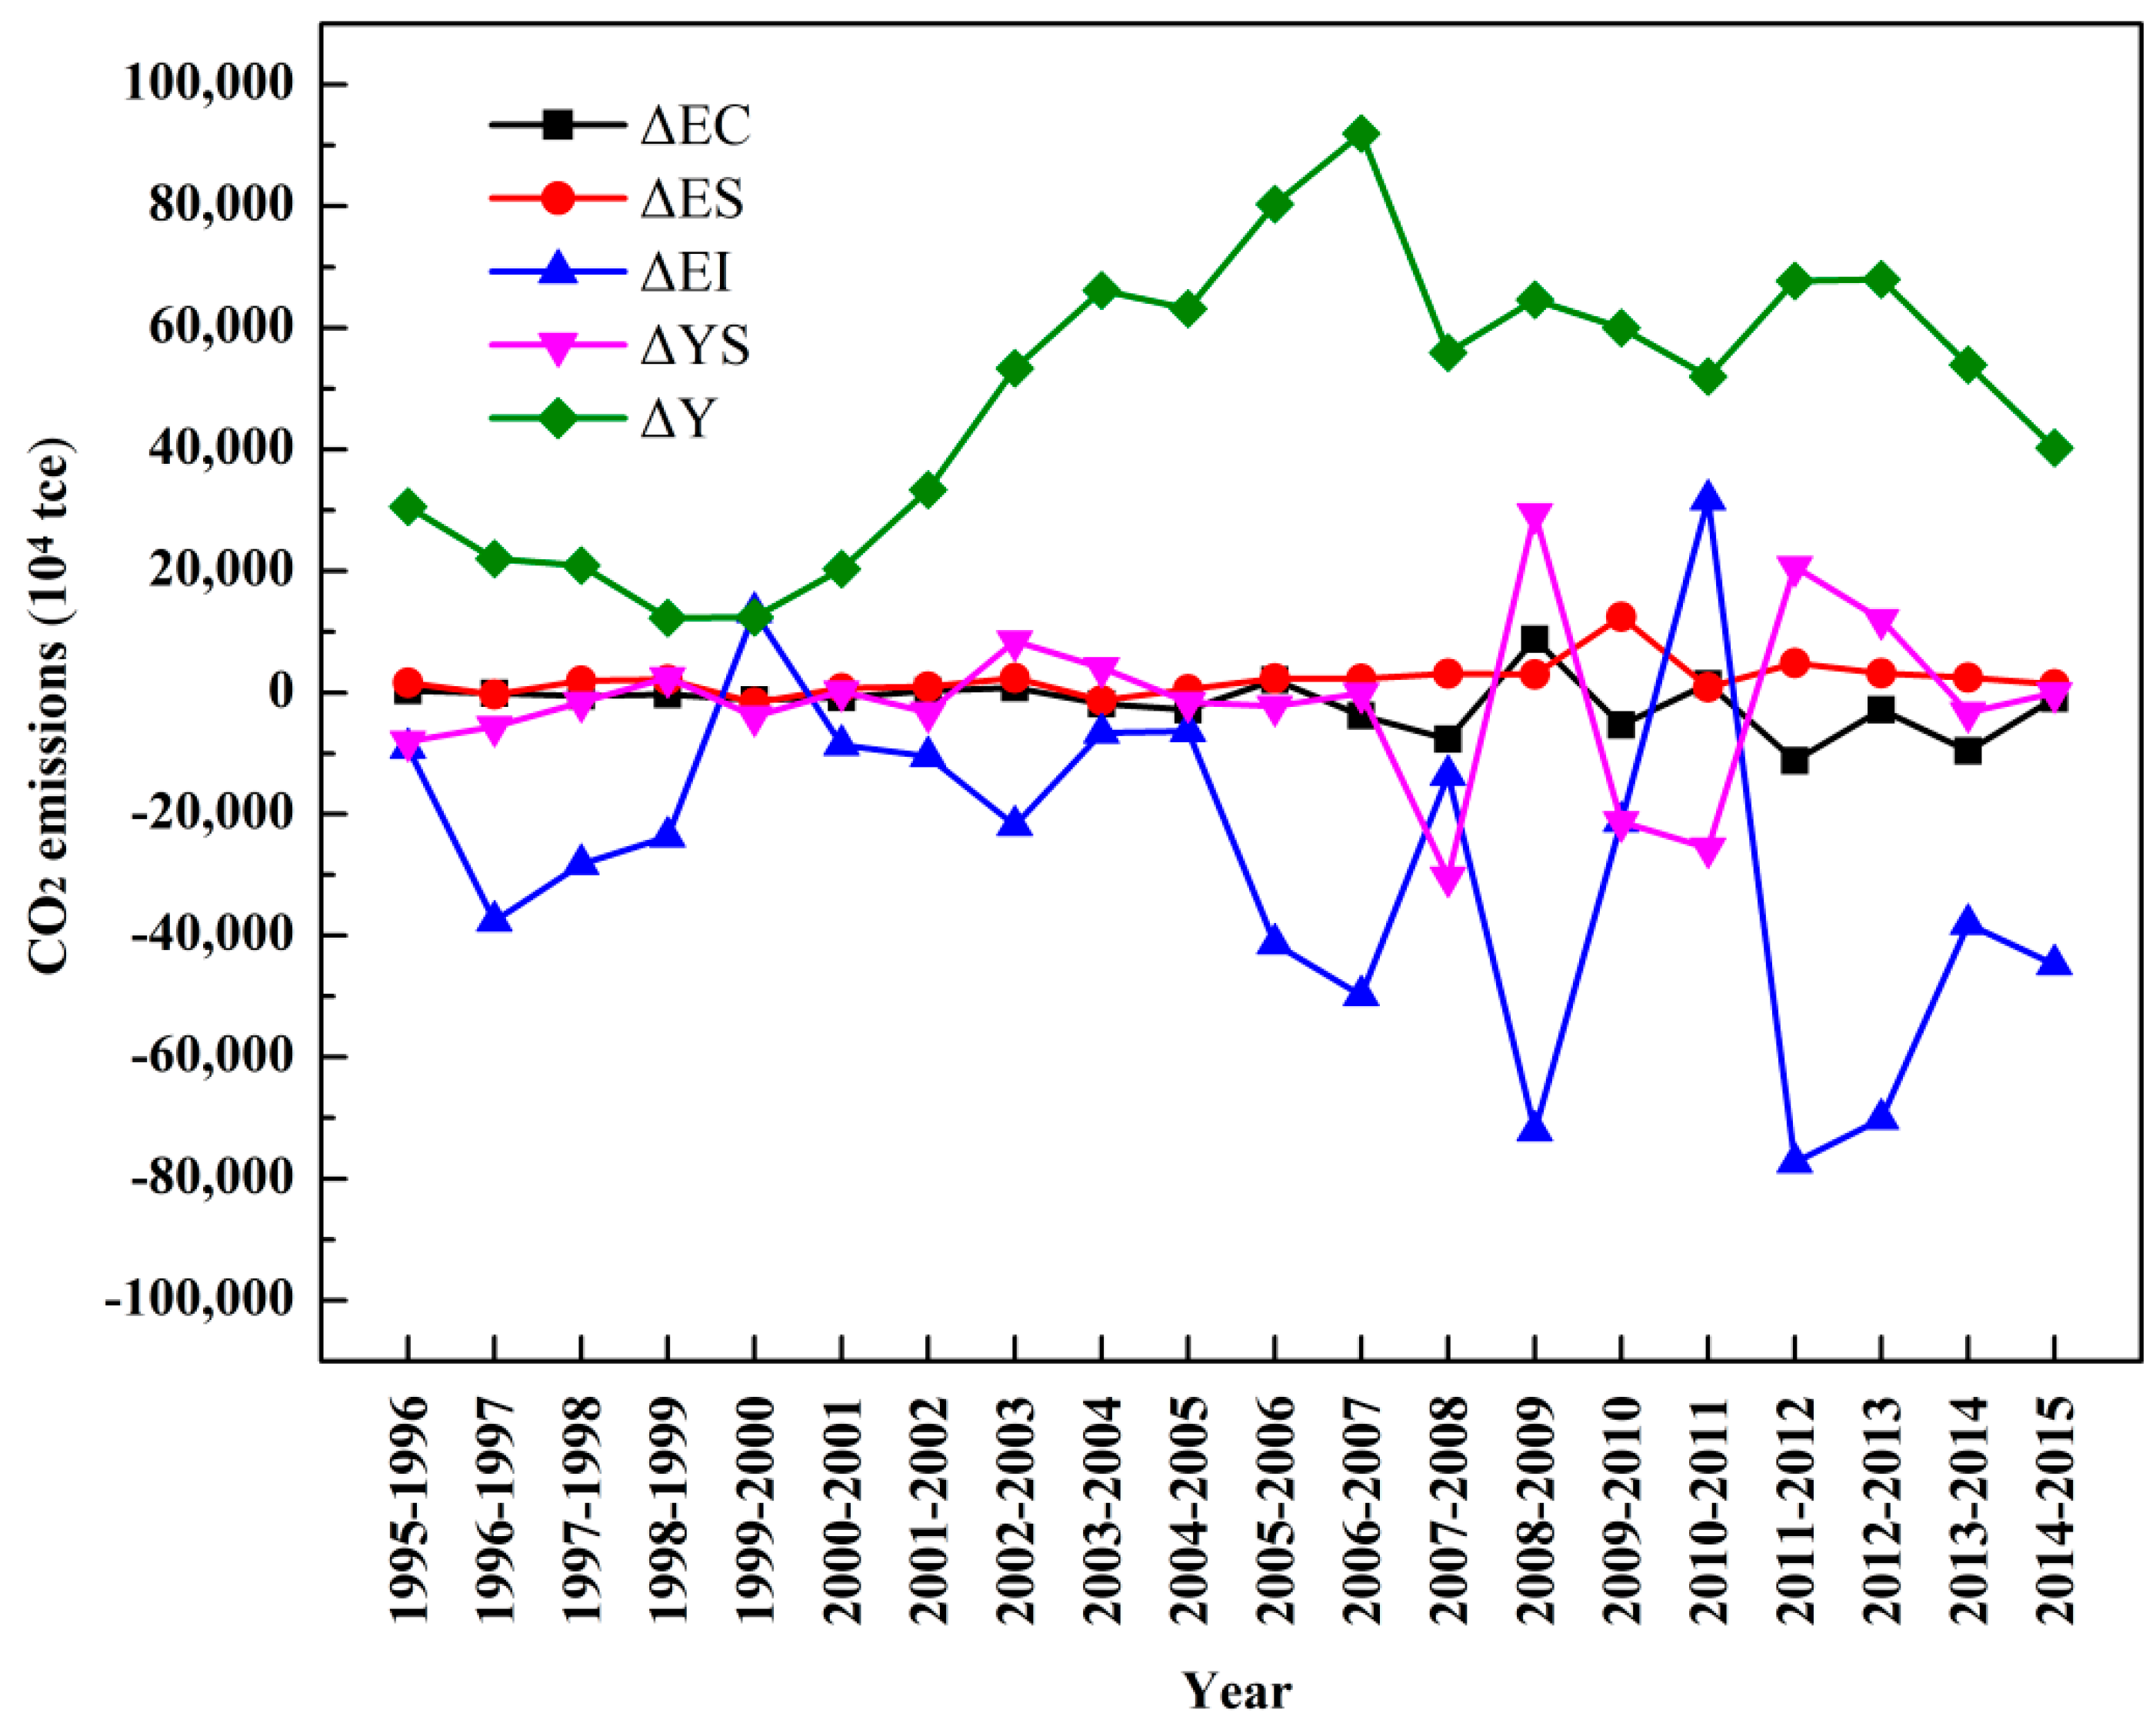
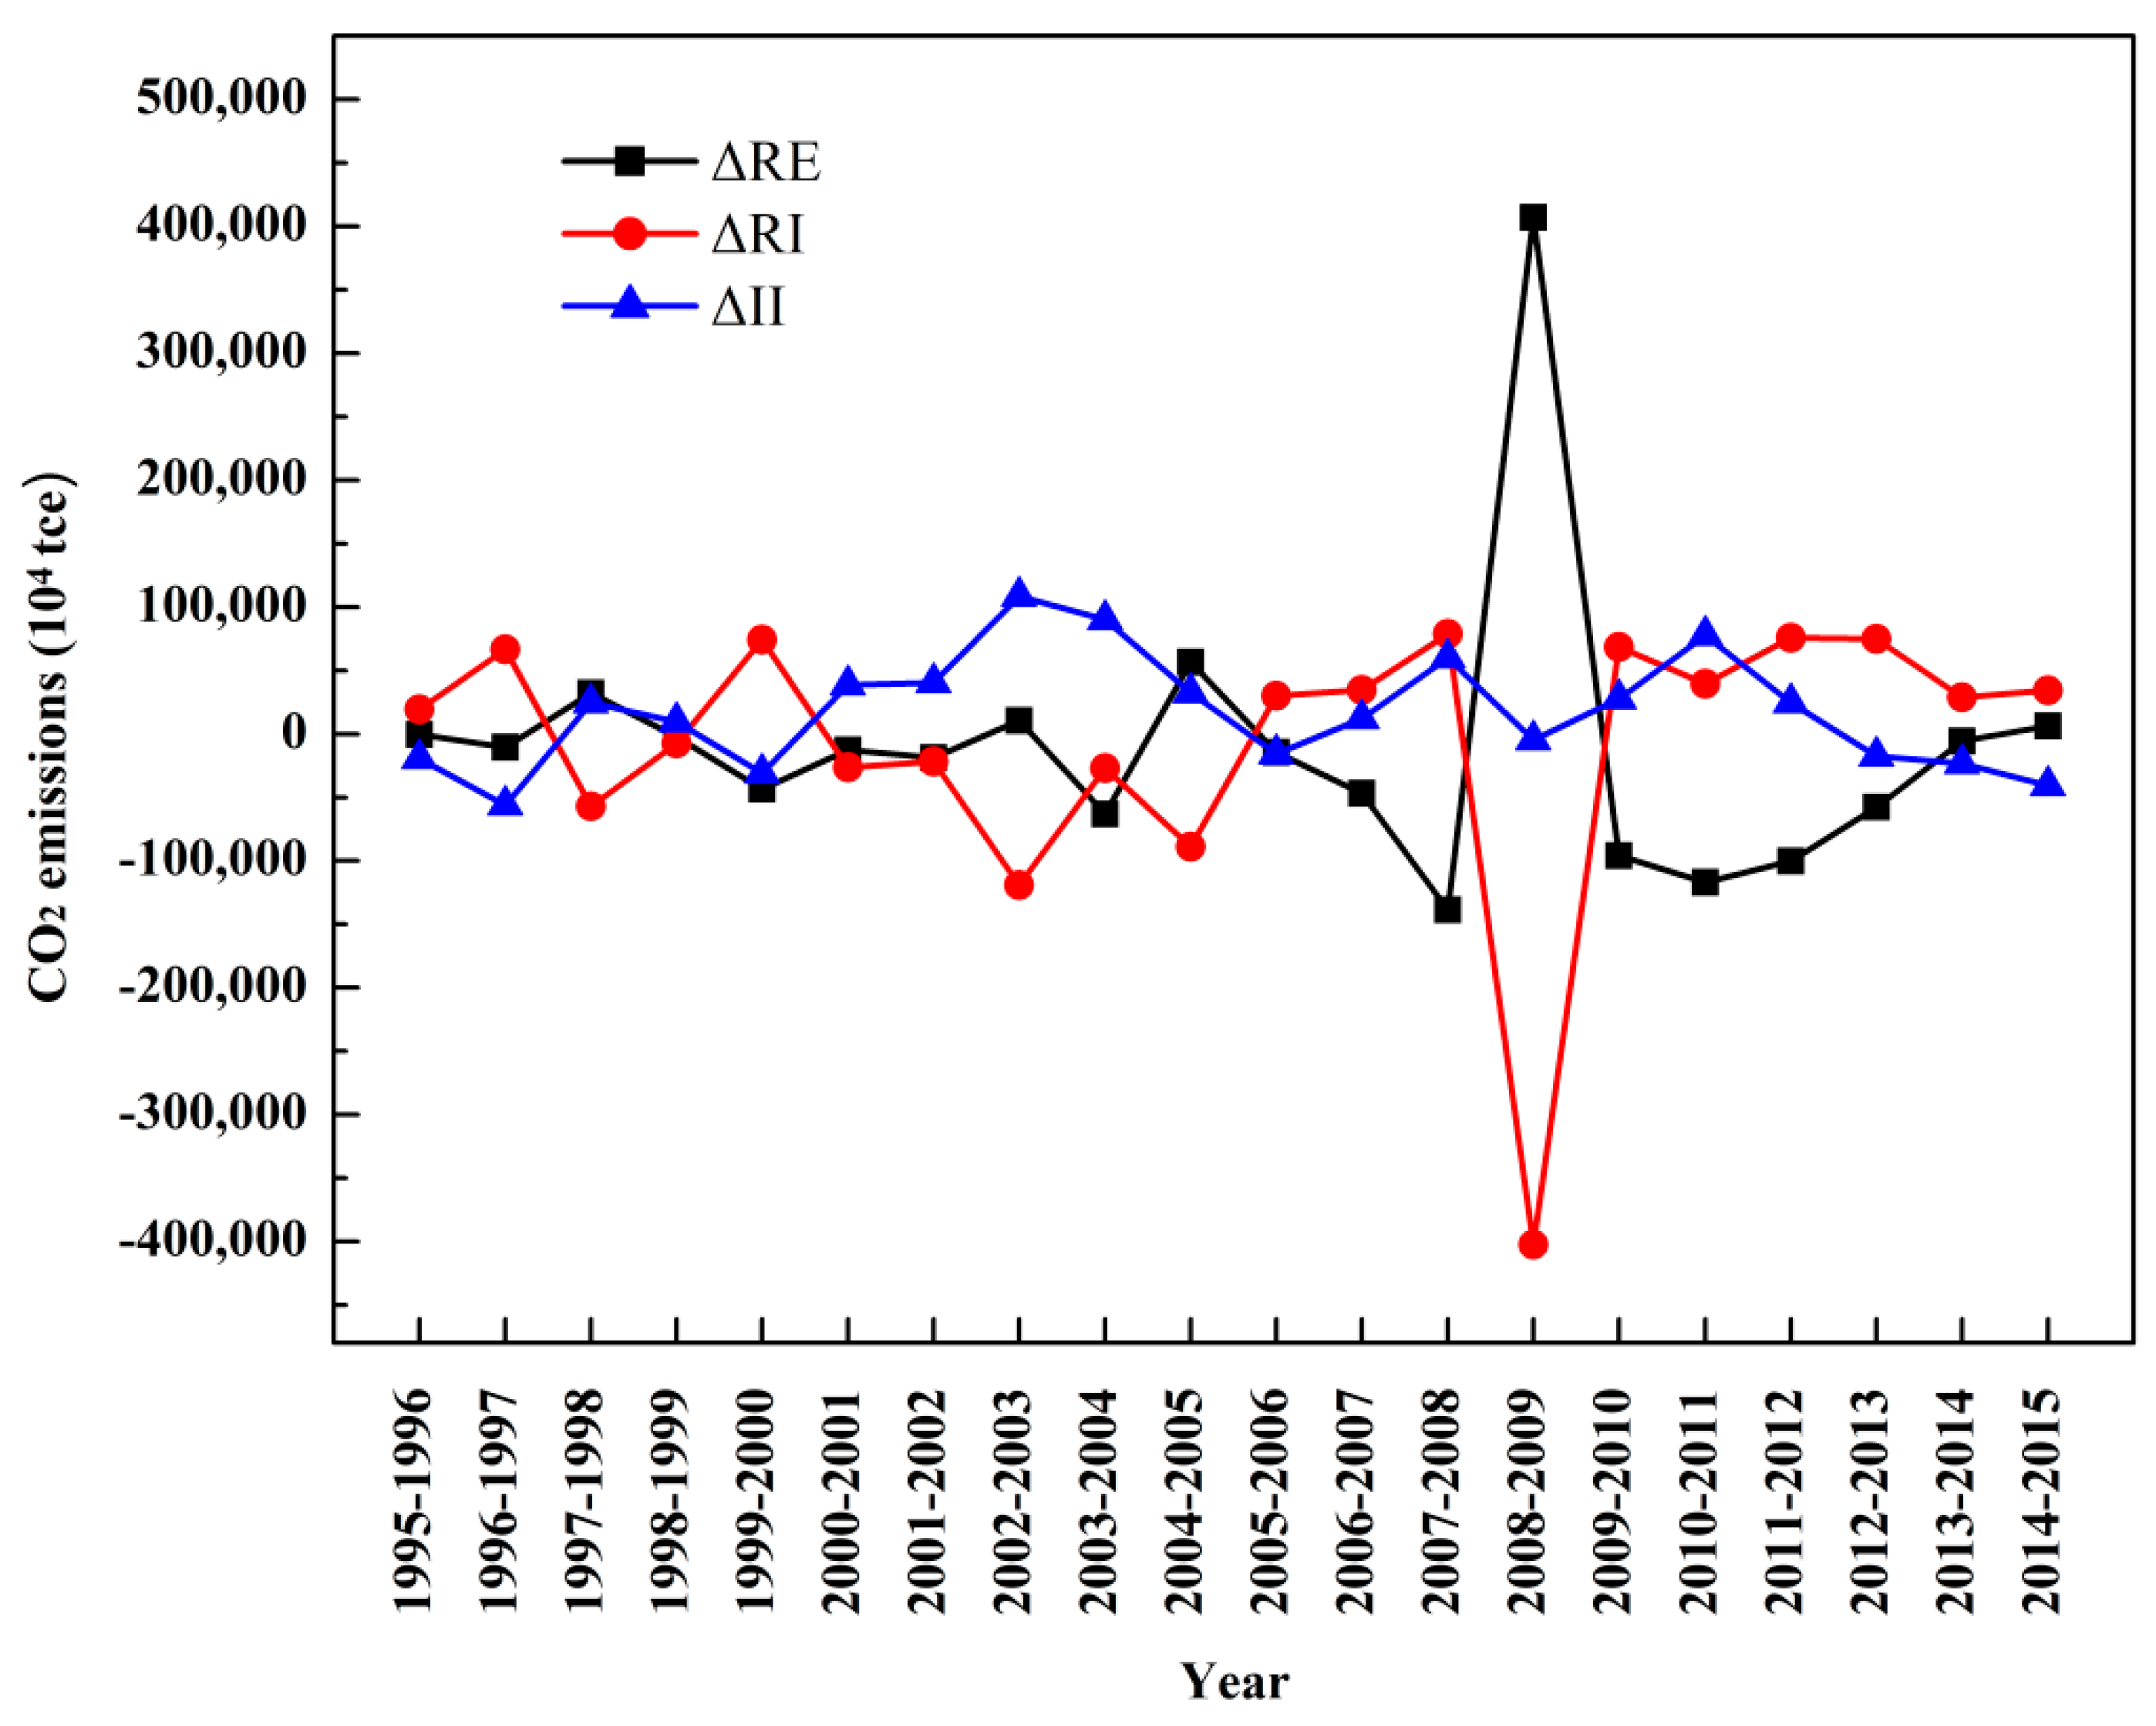
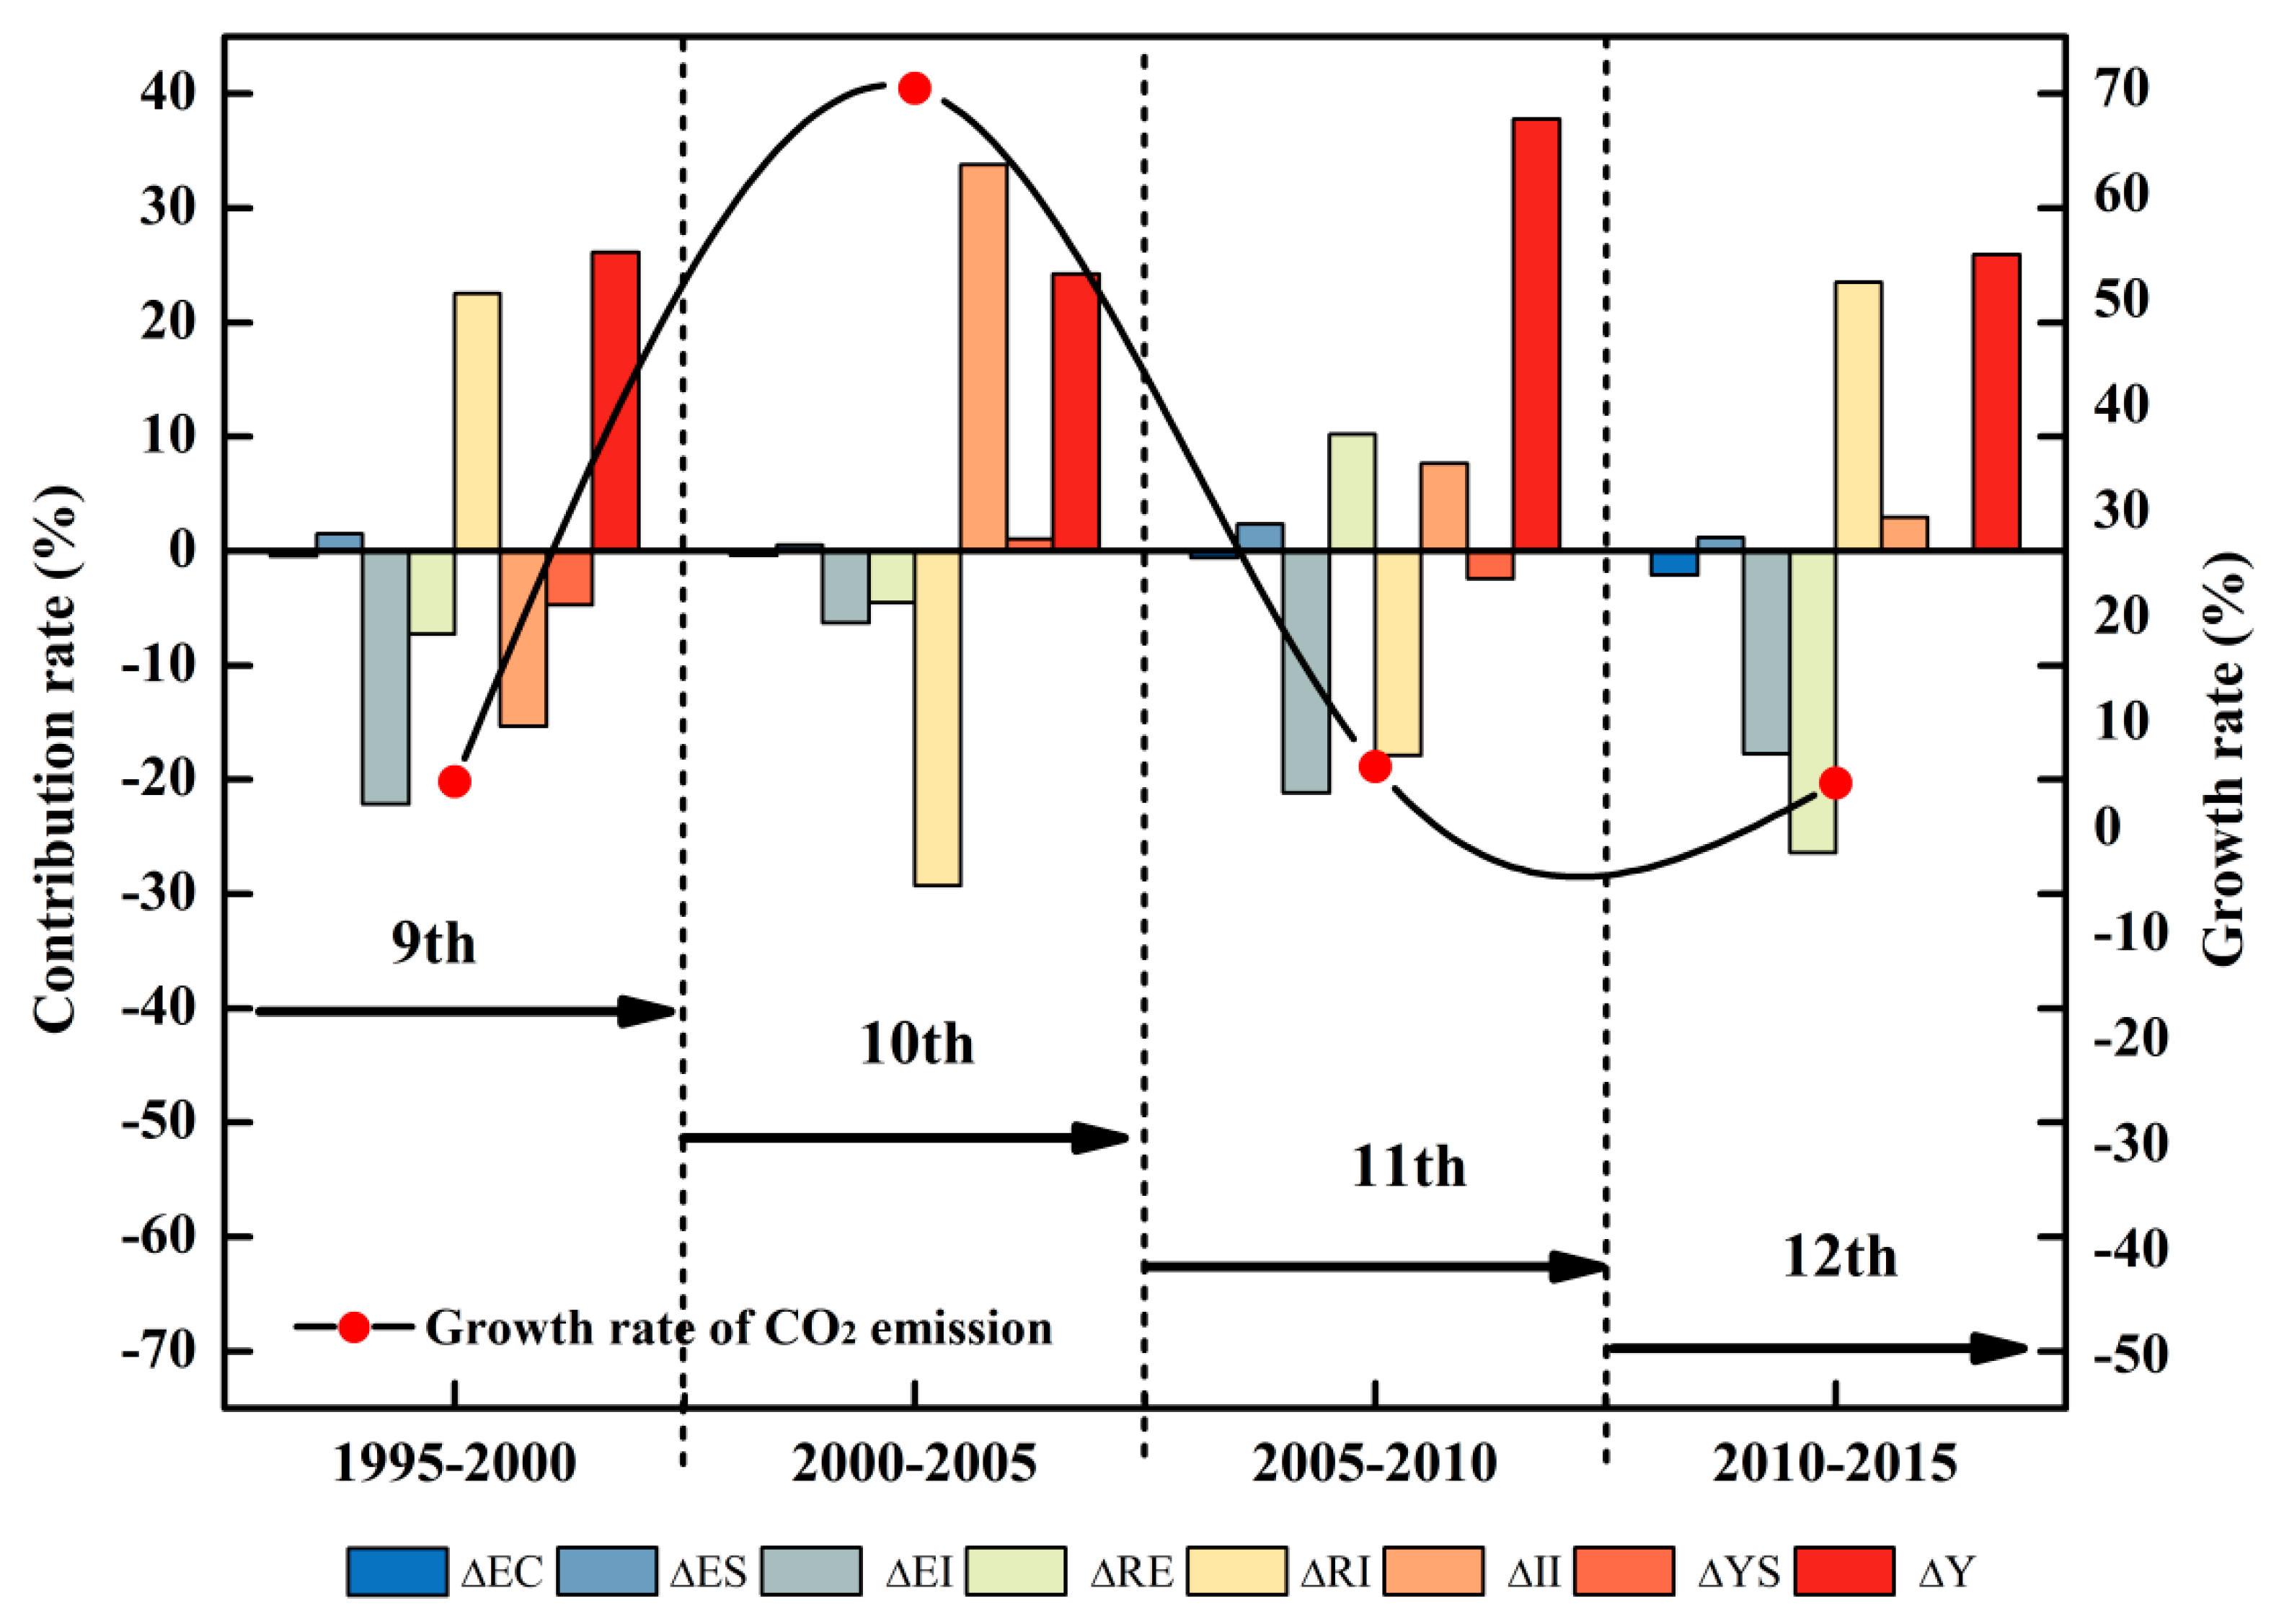
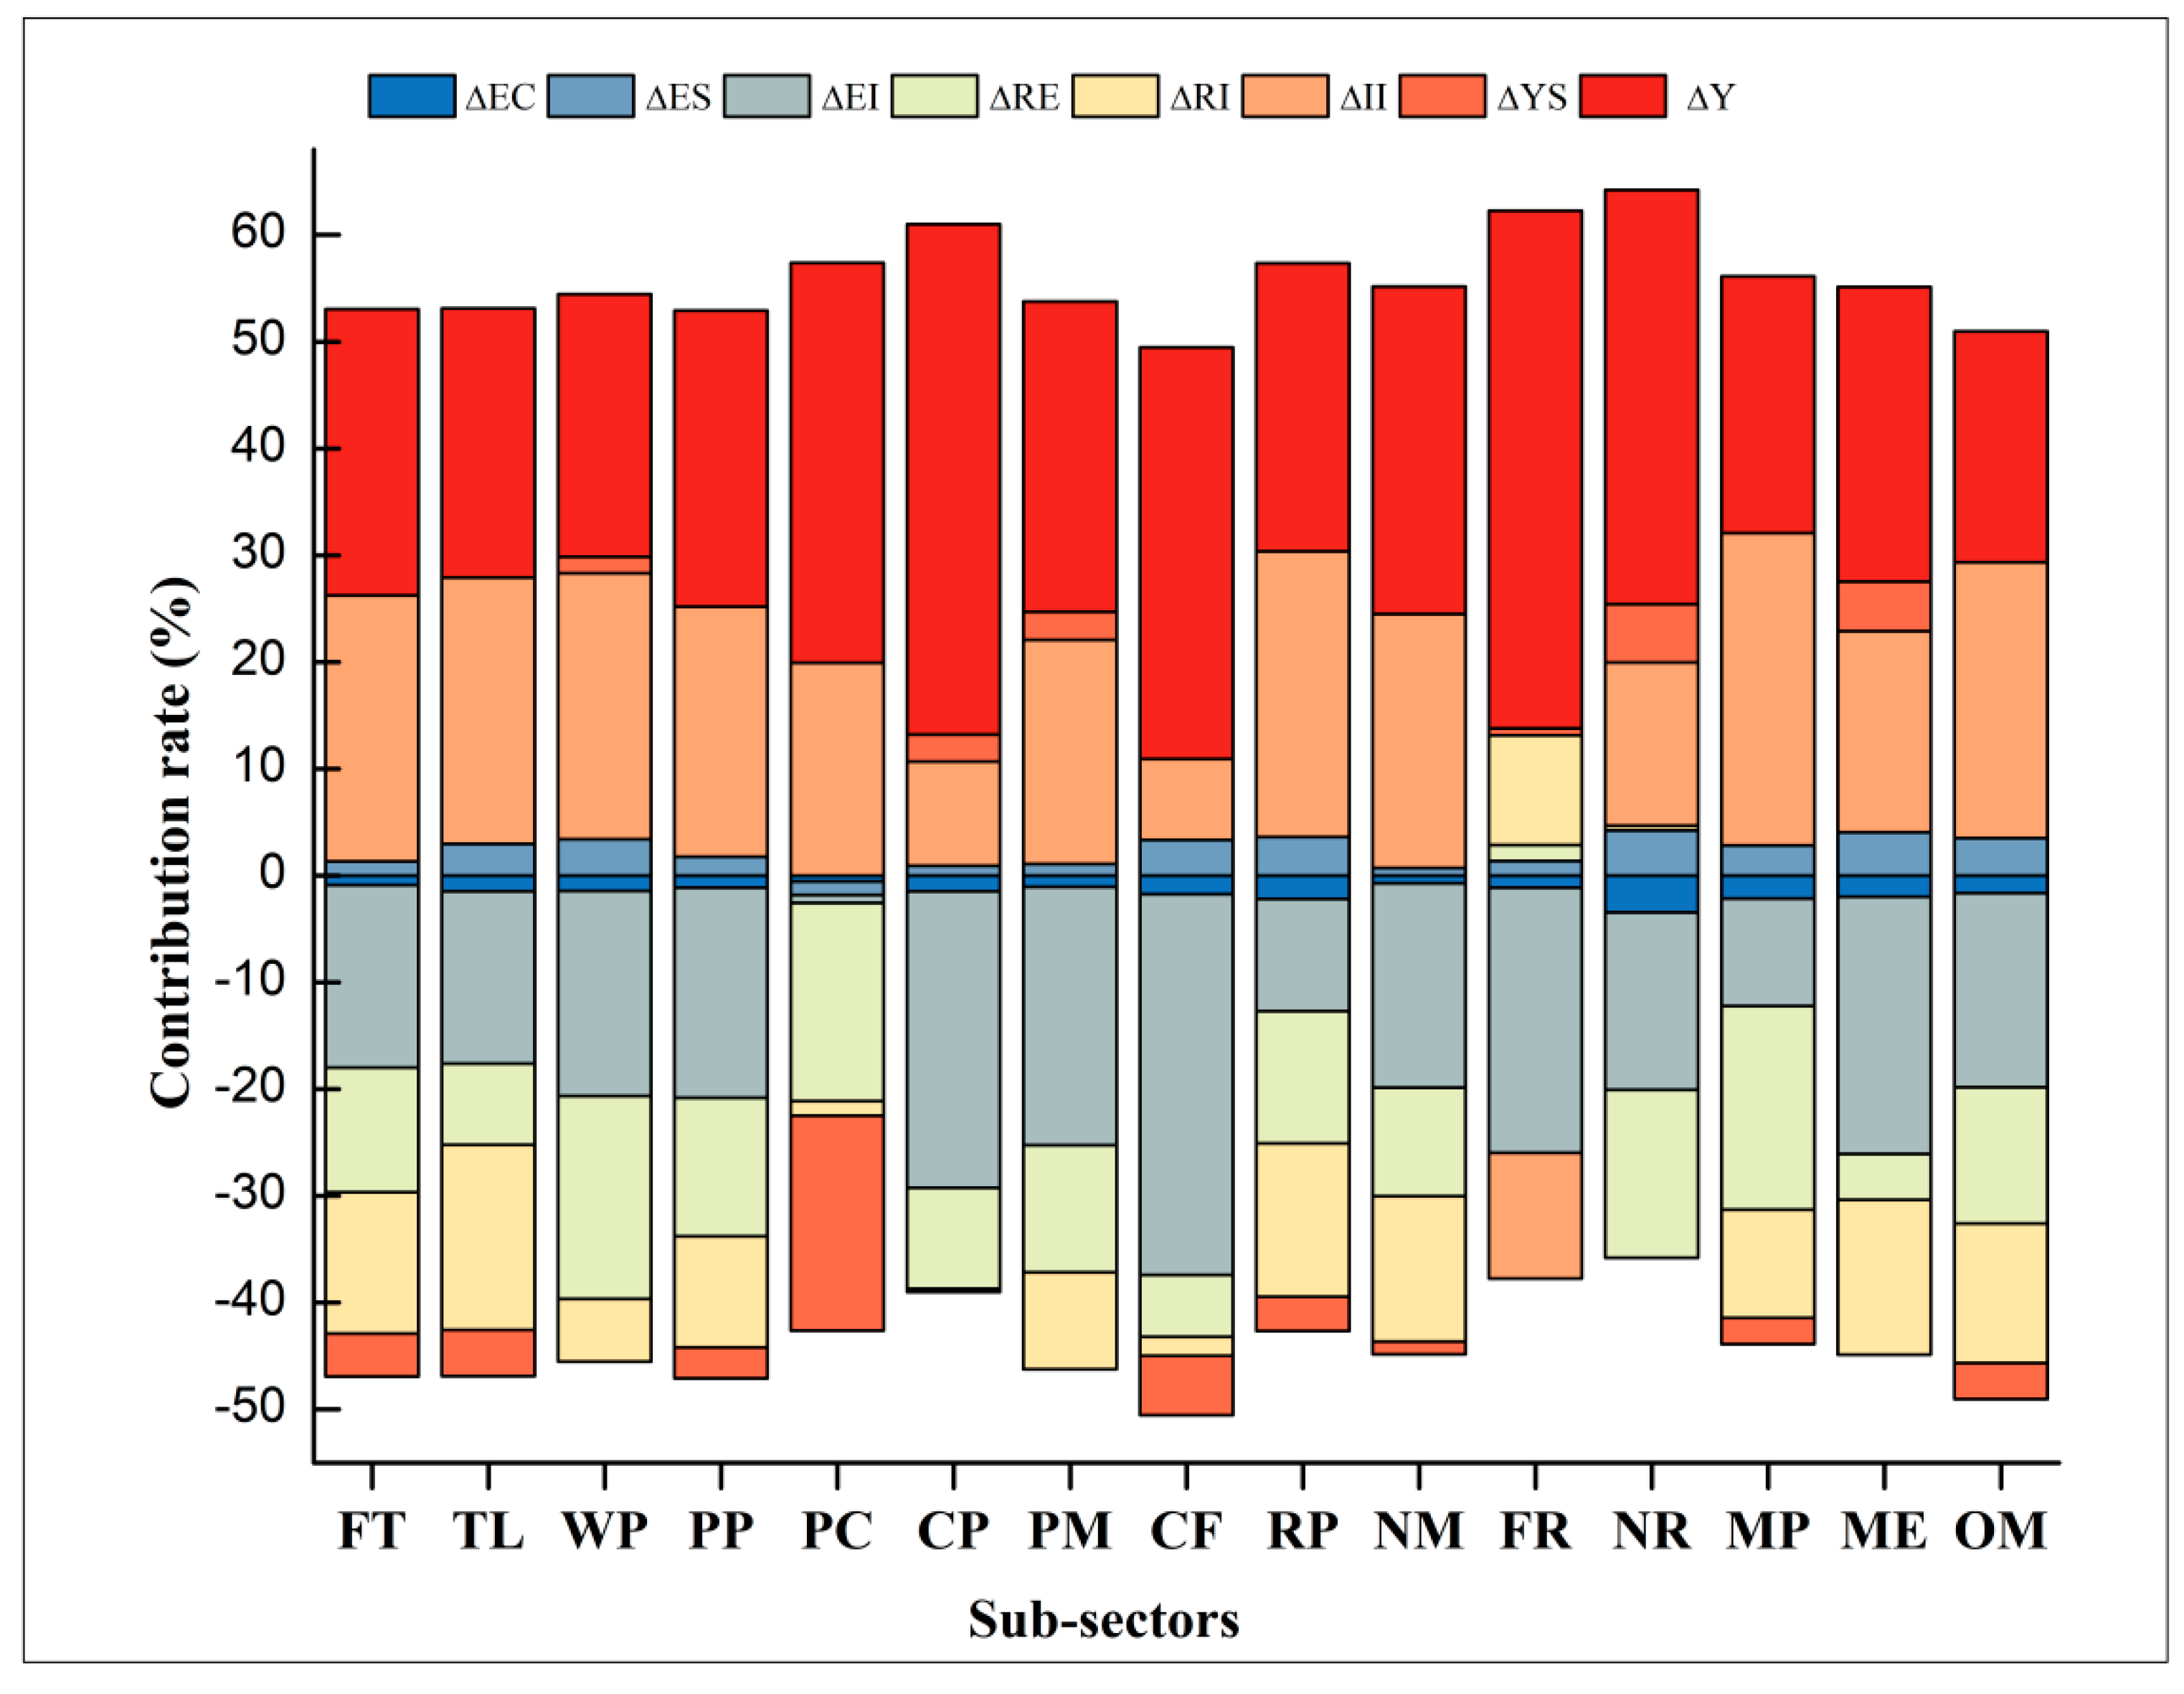
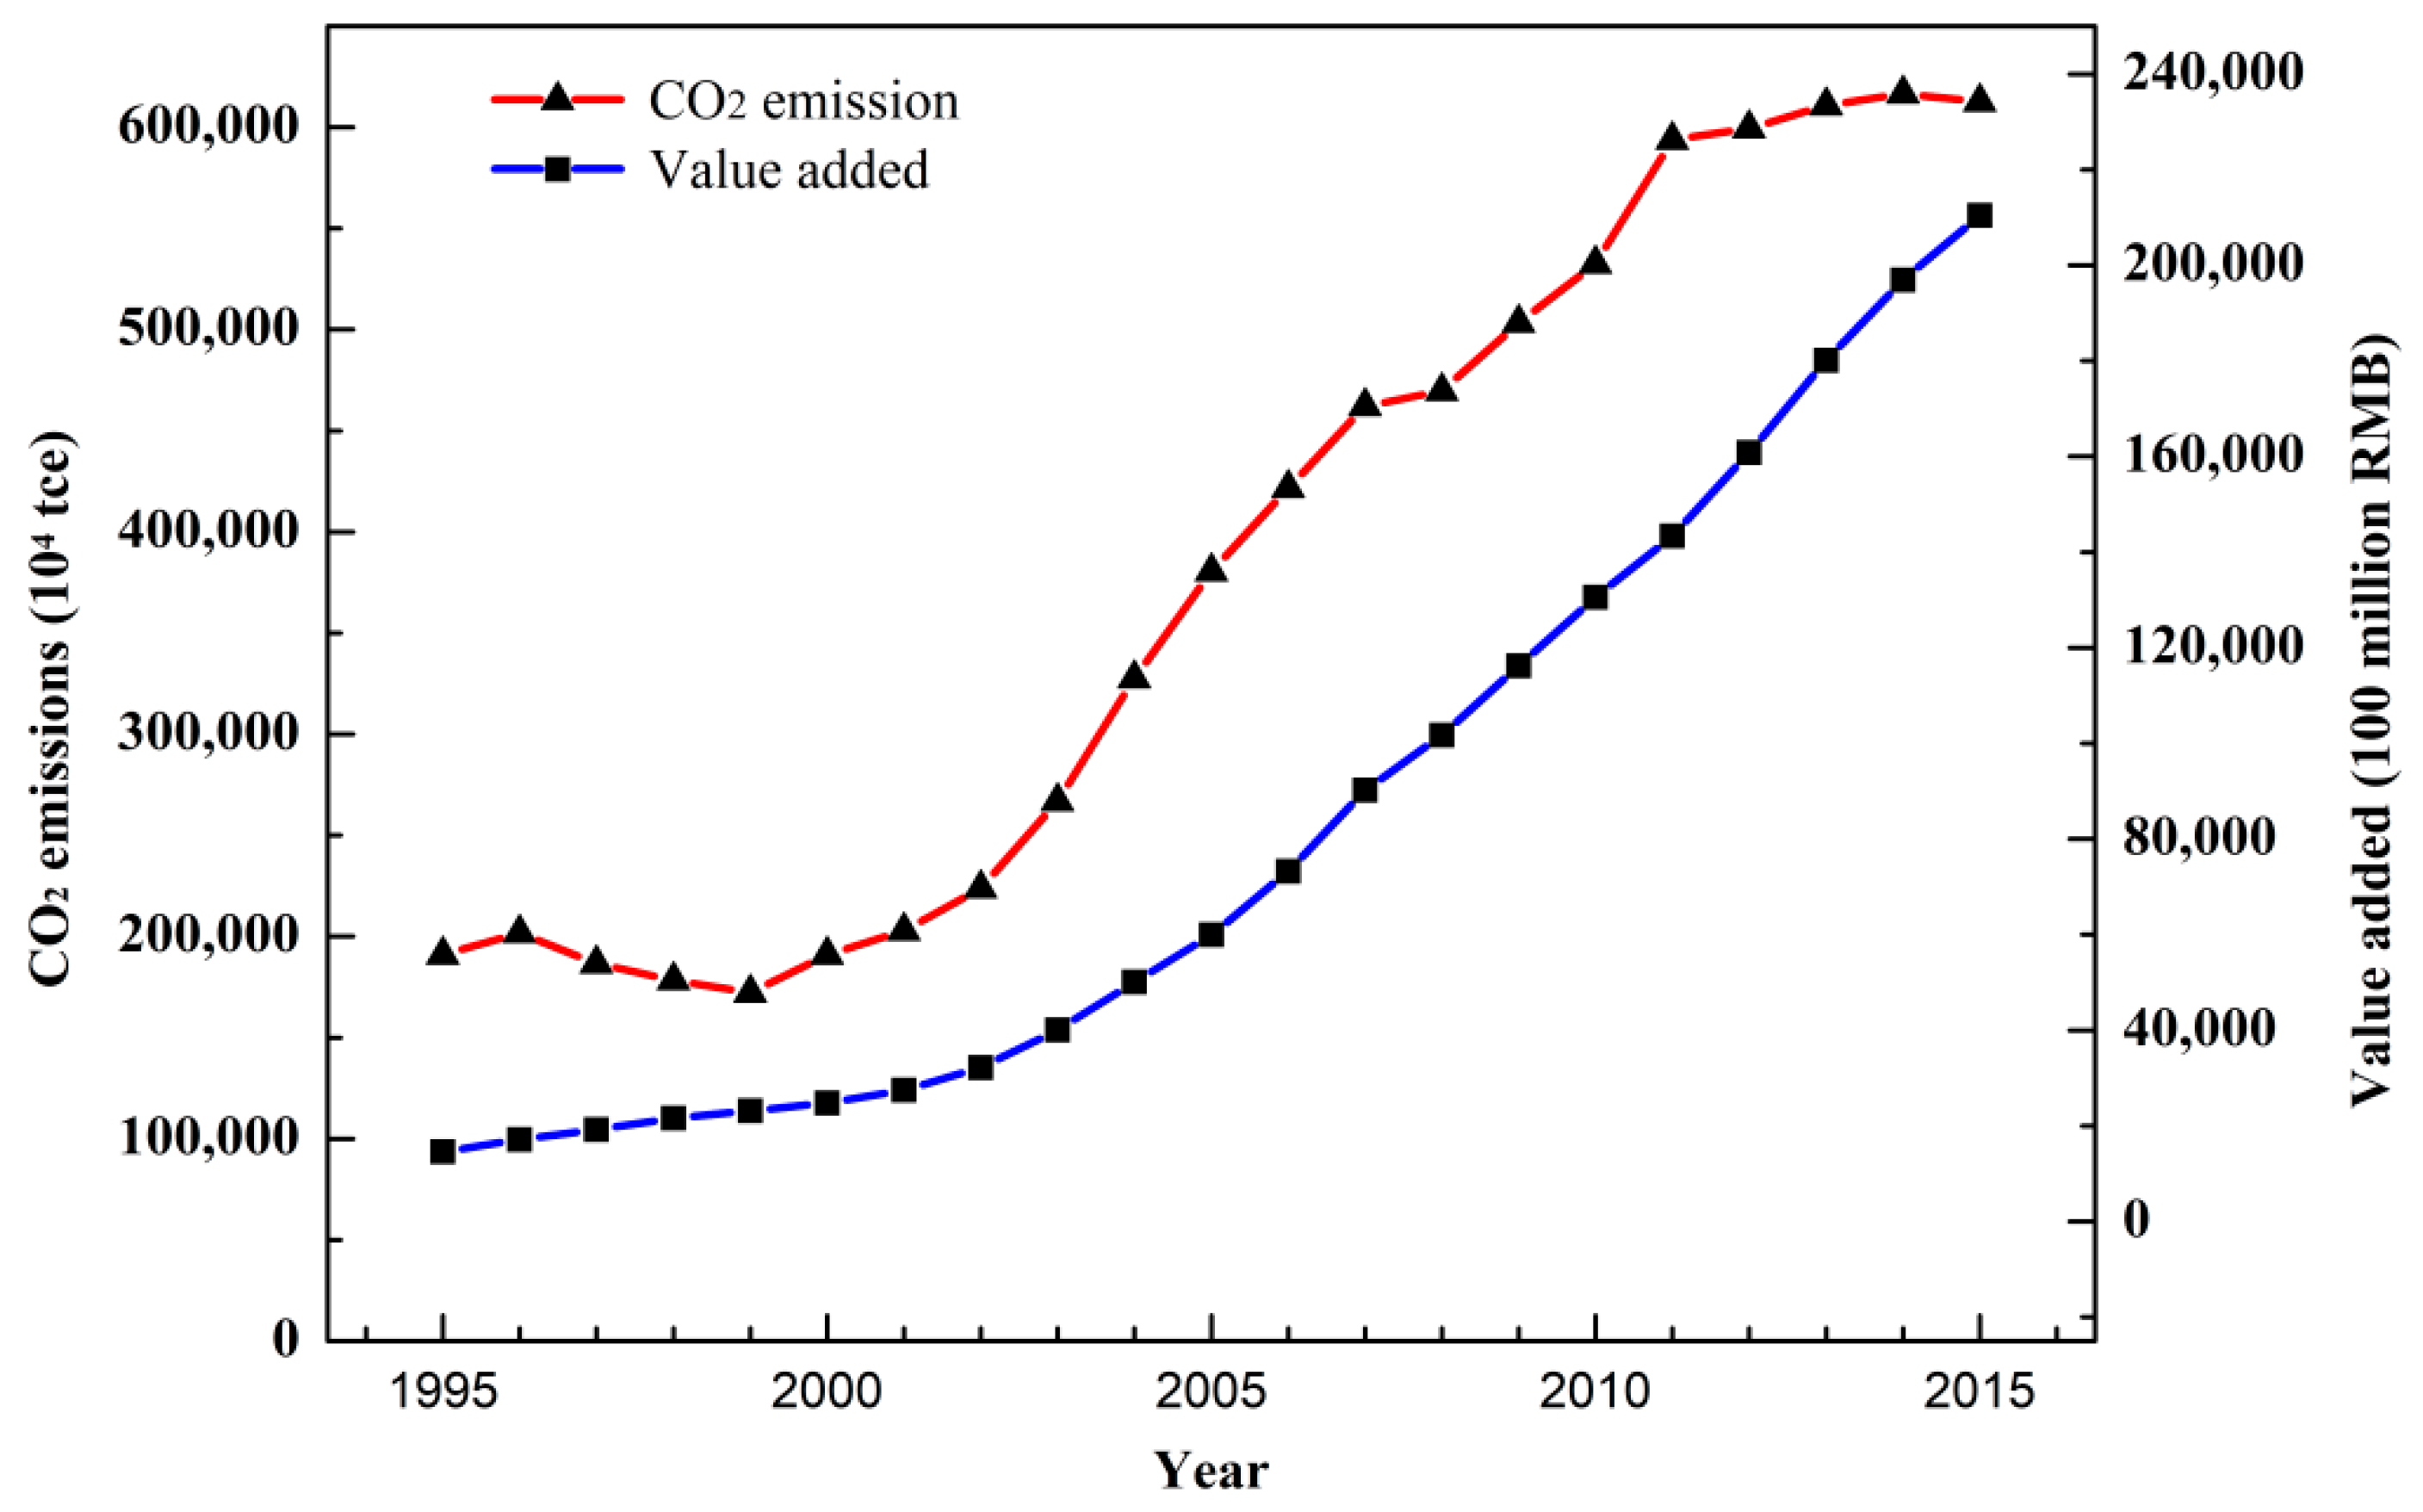
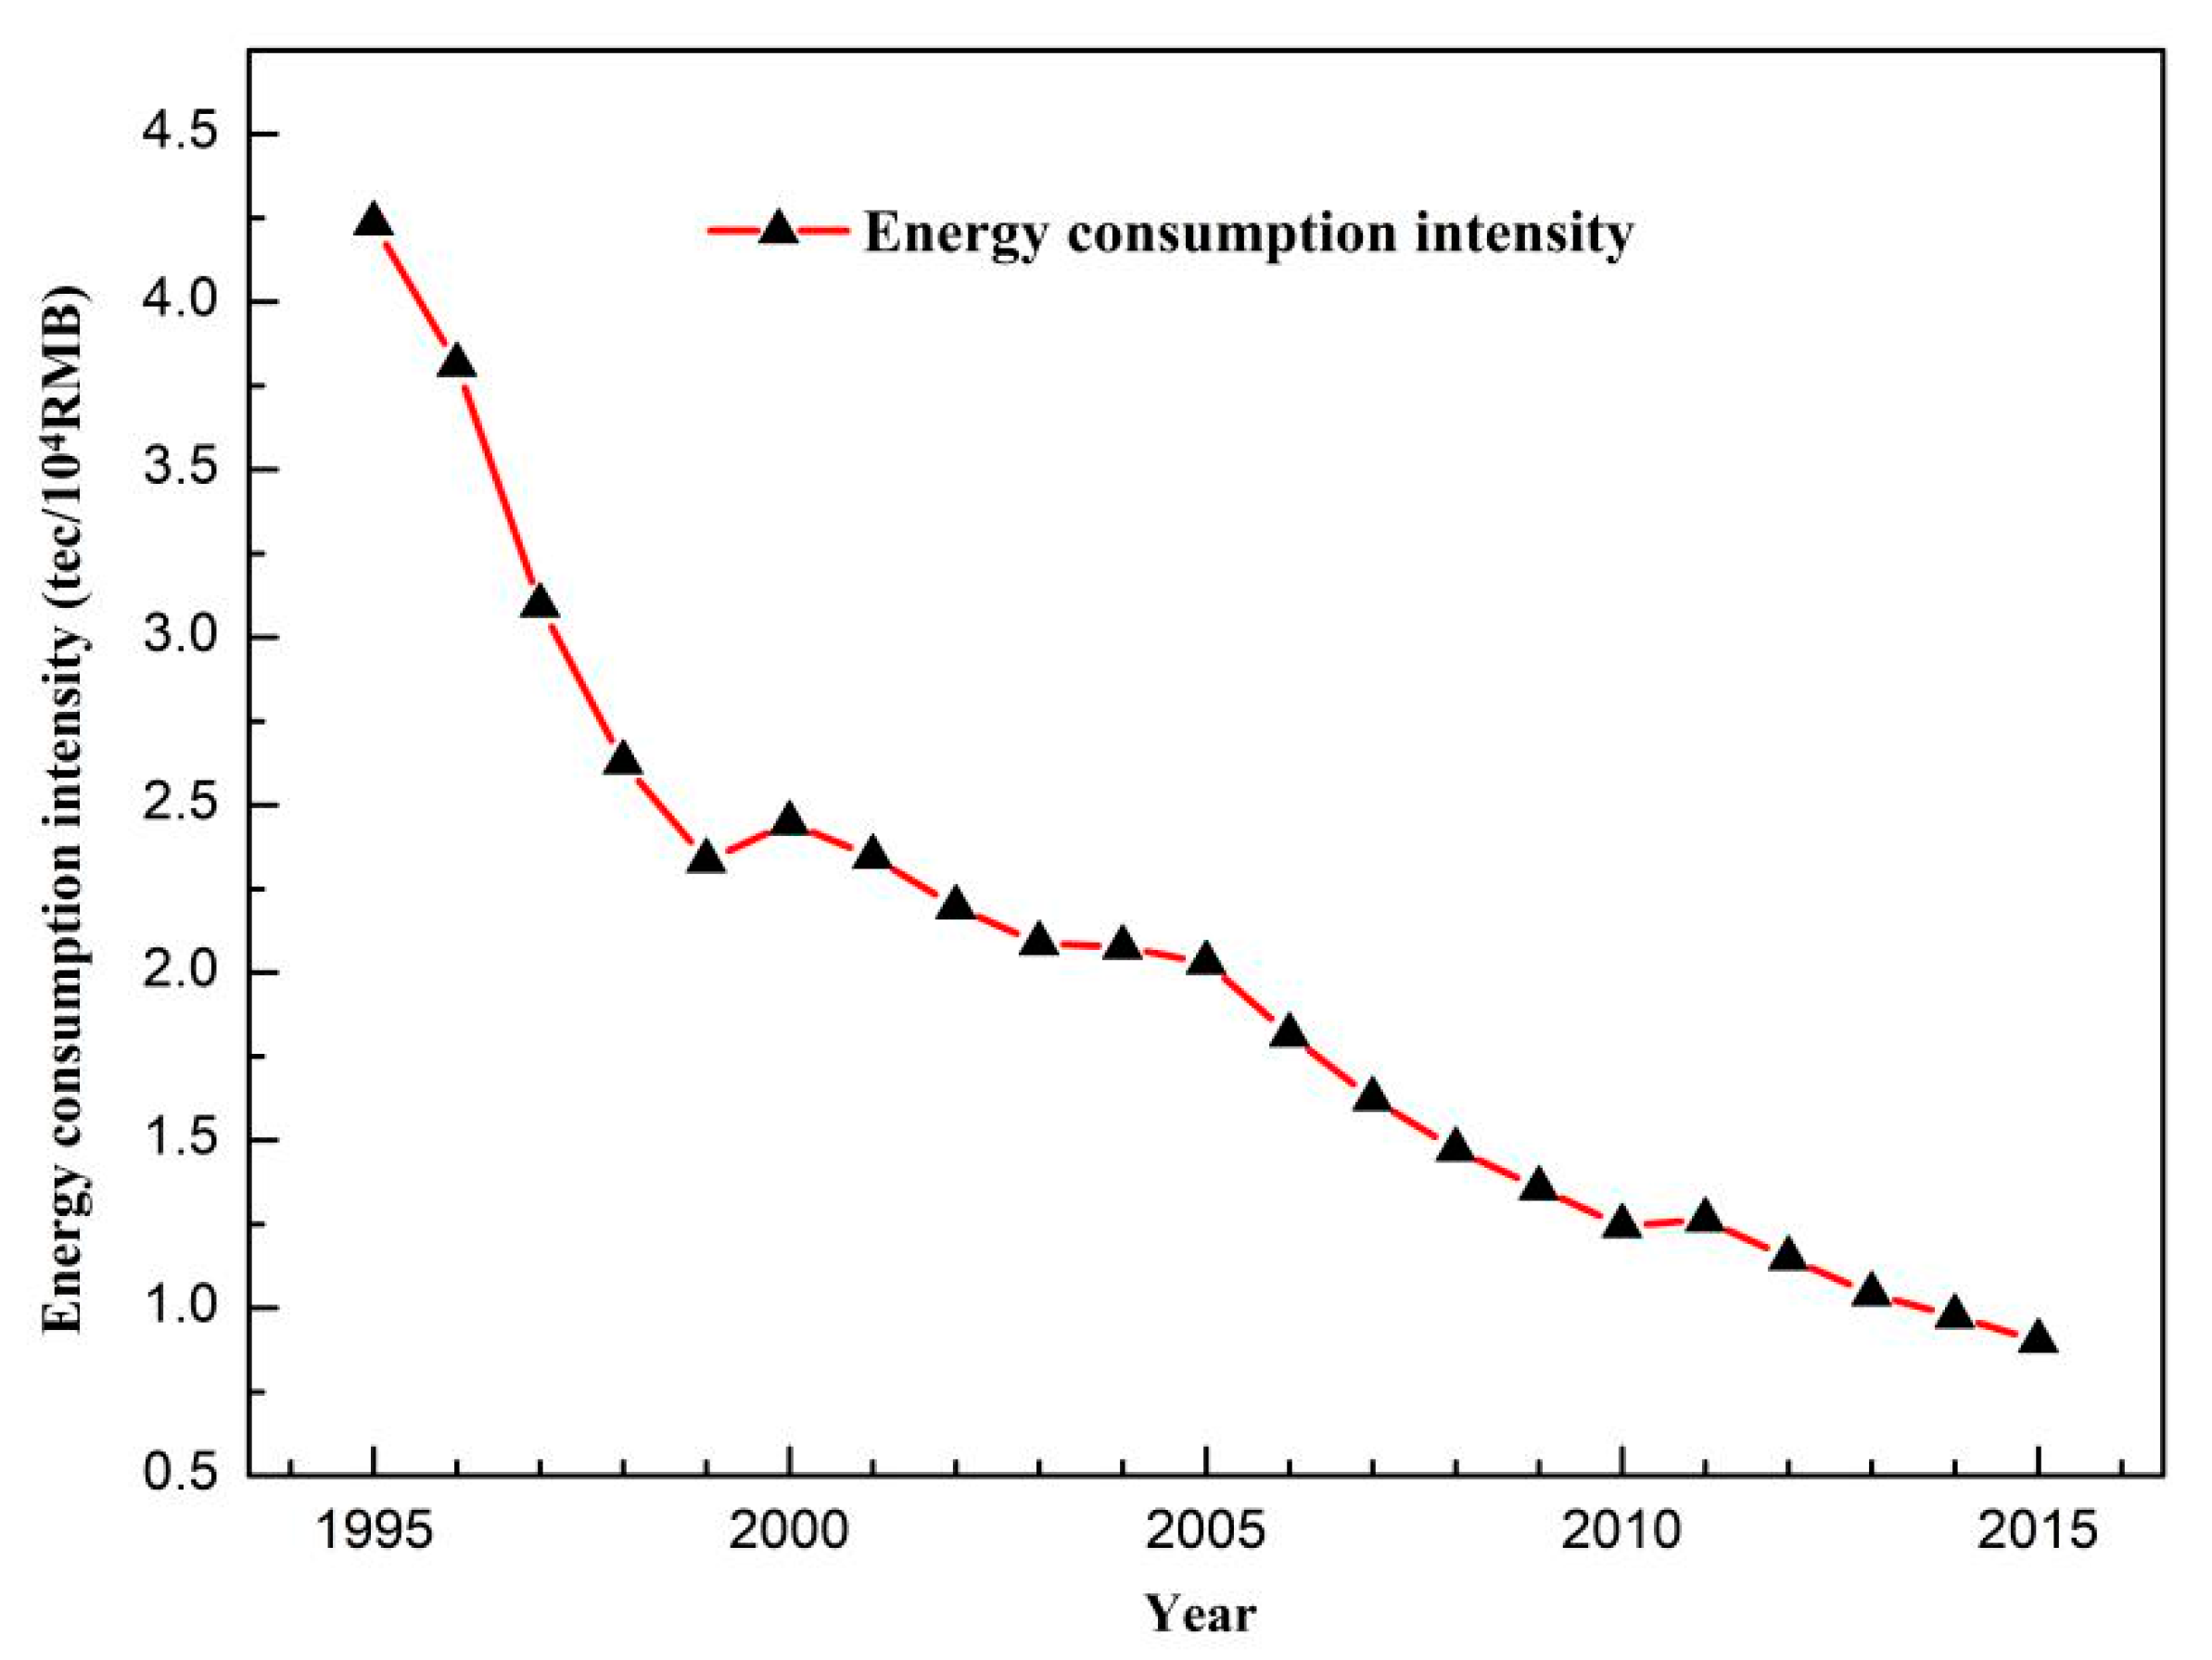
Table 1.
Average CO2 emission factors of electricity for the years 1995–2015.
| Year | Hydro Power (%) | Thermal Power (%) | Nuclear Power (%) | Wind Power (%) | Solar Energy (%) | Other (%) | Standard Coal Equivalent (kg/kWh) | Emissions Factor of Electricity (tCO2/tce) |
|---|---|---|---|---|---|---|---|---|
| 1995 | 18.54 | 80.18 | 1.28 | 0.00 | 0.00 | 0.00 | 0.379 | 6.848 |
| 1996 | 17.31 | 81.30 | 1.33 | 0.00 | 0.00 | 0.06 | 0.377 | 6.907 |
| 1997 | 17.15 | 81.57 | 1.27 | 0.00 | 0.00 | 0.01 | 0.375 | 6.894 |
| 1998 | 17.65 | 81.09 | 1.22 | 0.00 | 0.00 | 0.04 | 0.373 | 6.817 |
| 1999 | 17.27 | 81.48 | 1.20 | 0.00 | 0.00 | 0.00 | 0.369 | 6.776 |
| 2000 | 17.77 | 80.96 | 1.22 | 0.00 | 0.00 | 0.00 | 0.363 | 6.623 |
| 2001 | 17.60 | 81.17 | 1.18 | 0.00 | 0.00 | 0.00 | 0.357 | 6.531 |
| 2002 | 16.60 | 81.74 | 1.60 | 0.00 | 0.00 | 0.00 | 0.356 | 6.558 |
| 2003 | 14.77 | 82.88 | 2.30 | 0.00 | 0.00 | 0.00 | 0.355 | 6.631 |
| 2004 | 15.08 | 82.50 | 2.30 | 0.00 | 0.00 | 0.11 | 0.349 | 6.489 |
| 2005 | 15.97 | 81.54 | 2.11 | 0.00 | 0.00 | 0.37 | 0.343 | 6.303 |
| 2006 | 14.55 | 83.31 | 1.92 | 0.10 | 0.00 | 0.11 | 0.342 | 6.421 |
| 2007 | 14.44 | 83.34 | 1.93 | 0.17 | 0.00 | 0.12 | 0.332 | 6.236 |
| 2008 | 16.39 | 81.22 | 2.01 | 0.38 | 0.00 | 0.00 | 0.322 | 5.894 |
| 2009 | 15.53 | 81.81 | 1.90 | 0.75 | 0.00 | 0.00 | 0.340 | 6.269 |
| 2010 | 16.24 | 80.81 | 1.77 | 1.17 | 0.00 | 0.01 | 0.333 | 6.065 |
| 2011 | 14.12 | 82.45 | 1.84 | 1.57 | 0.01 | 0.00 | 0.329 | 6.113 |
| 2012 | 17.16 | 78.72 | 1.97 | 2.07 | 0.07 | 0.01 | 0.325 | 5.766 |
| 2013 | 16.61 | 78.58 | 2.08 | 2.57 | 0.16 | 0.01 | 0.321 | 5.685 |
| 2014 | 18.92 | 75.43 | 2.38 | 2.85 | 0.42 | 0.01 | 0.319 | 5.423 |
| 2015 | 19.39 | 73.71 | 2.99 | 3.23 | 0.69 | 0.00 | 0.325 | 5.399 |
Notes: CO2 emissions factor of electricity = (proportion of thermal electricity × standard rate of coal consumption of thermoelectricity × CO2 emissions factor of raw coal)/the coefficient of electricity to transform standard coal [42].
Table 2.
Definition of each variable in Equation (2).
| Variable | Definition | Variable | Definition |
|---|---|---|---|
| CE | Total carbon dioxide emissions | ECij | CO2 emission factor of j energy in sector i |
| CEij | j energy carbon dioxide emissions in sector i | ESij | Proportion of energy consumption in sector i |
| Eij | j energy consumption in sector i | EIi | Total energy consumption per unit of division |
| Ei | i sector energy consumption | REi | Output per unit of R&D expenditure by sector |
| Yi | i sector added value of manufacturing sector | RIi | Proportion of internal investment of R&D funds in sub-sectors as a percentage of fixed assets investment |
| Ri | i sector R&D funding internal investment | IIi | The proportion of fixed assets investment in various sectors to total manufacturing investment |
| Ii | i sector fixed asset investment | YSi | Added value of manufacturing in various sectors accounts for the proportion of total value added |
| Y | Total value added of manufacturing industry |
Table 3.
Decomposition results of CO2 emissions in China’s manufacturing sector. Unit: 104 tons.
| Year | ΔEC | ΔES | ΔEI | ΔRE | ΔRI | ΔII | ΔYS | ΔY | ΔCtot |
|---|---|---|---|---|---|---|---|---|---|
| 1995–1996 | 381 | 1647 | −9130 | −261 | 19402 | −19,142 | −8001 | 30,617 | 15,512 |
| 1996–1997 | −88 | −285 | −37,588 | −10,541 | 66,810 | −56,269 | −5545 | 22,027 | −21,479 |
| 1997–1998 | −535 | 1974 | −28,284 | 32,404 | −56,962 | 24,558 | −1580 | 20,944 | −7481 |
| 1998–1999 | −292 | 2157 | −23,778 | −2241 | −7404 | 9645 | 2486 | 12,299 | −7128 |
| 1999–2000 | −1181 | −1633 | 13,222 | −43,217 | 74,220 | −31,002 | −3906 | 12,423 | 18,925 |
| 2000–2001 | −795 | 723 | −8618 | −12,540 | −26,204 | 38,743 | 246 | 20,358 | 11,914 |
| 2001–2002 | 260 | 1011 | −10,477 | −18,809 | −21,714 | 40,523 | −3224 | 33,367 | 20,937 |
| 2002–2003 | 809 | 2403 | −21,902 | 10,738 | −119,359 | 108,621 | 8458 | 53,342 | 43,111 |
| 2003–2004 | −1841 | −1270 | −6633 | −63,277 | −26,813 | 90,090 | 4070 | 66,172 | 60,499 |
| 2004–2005 | −2799 | 571 | −6375 | 56,528 | −89,164 | 32,636 | −1597 | 63,167 | 52,966 |
| 2005–2006 | 2063 | 2350 | −41,373 | −14,517 | 30,067 | −15,550 | −2224 | 80,374 | 41,191 |
| 2006–2007 | −3767 | 2275 | −49,844 | −46,708 | 34,702 | 12,005 | −70 | 91,938 | 40,533 |
| 2007–2008 | −7651 | 3109 | −13,545 | −13,8850 | 78,917 | 59,933 | −30,397 | 55,929 | 7445 |
| 2008–2009 | 8820 | 2998 | −72,121 | 406,994 | −402,424 | −4570 | 29,399 | 64,620 | 33,715 |
| 2009–2010 | −5321 | 12,486 | −21,224 | −95,961 | 68,395 | 27,566 | −21,275 | 59,964 | 24,629 |
| 2010–2011 | 1426 | 892 | 31,749 | −117,132 | 39,578 | 77,555 | −25,632 | 51,980 | 60,414 |
| 2011–2012 | −11,155 | 4882 | −77,326 | −100,518 | 75,778 | 24,740 | 20,747 | 67,728 | 4876 |
| 2012–2013 | −2776 | 3207 | −70,141 | −57,701 | 75,094 | −17,393 | 12,012 | 67,986 | 10,289 |
| 2013–2014 | −9556 | 2454 | −38,151 | −5624 | 28,916 | −23,292 | −3263 | 53,940 | 5425 |
| 2014–2015 | −907 | 1382 | −44,795 | 6410 | 34,261 | −40,671 | −60 | 40,256 | −4124 |
| 1995–2015 | −34,904 | 43,334 | −536,334 | −214,822 | −123,905 | 338,727 | −29,357 | 969,430 | 412,169 |
Table 4.
Decomposition results of manufacturing CO2 emissions by time periods. Unit: 104 tons.
| Year | ΔEC | ΔES | ΔEI | ΔRE | ΔRI | ΔII | ΔYS | ΔY | ΔCtot |
|---|---|---|---|---|---|---|---|---|---|
| 1995–2000 | −1630 | 5655 | −83,954 | −27,517 | 85,582 | −58,066 | −17,896 | 99,158 | 1332 |
| 2000–2005 | −3745 | 5194 | −61,933 | −44,707 | −289,101 | 333,807 | 10,276 | 239,773 | 189,566 |
| 2005–2010 | −5116 | 21,550 | −194,113 | 93,764 | −164,062 | 70,298 | −22,125 | 347,330 | 147,526 |
| 2010–2015 | −21,845 | 12,412 | −183,505 | −273,220 | 242,970 | 30,250 | 1376 | 268,439 | 76,877 |
Table 5.
Results of the extended logarithmic mean division index (LMDI) additive decomposition analysis by industry (1995–2015). Unit: 104 tons.
Table 5.
Results of the extended logarithmic mean division index (LMDI) additive decomposition analysis by industry (1995–2015). Unit: 104 tons.
| ΔEC | ΔES | ΔEI | ΔRE | ΔRI | ΔII | ΔYS | ΔY | ΔCtot | |
|---|---|---|---|---|---|---|---|---|---|
| FT | −1258 | 1903 | −24,374 | −16,630 | −18,829 | 35,459 | −5771 | 38,234 | 8733 |
| TL | −2343 | 4783 | −25,975 | −12,234 | −27,884 | 40,119 | −7010 | 40,575 | 10,030 |
| WP | −375 | 897 | −5036 | −4986 | −1538 | 6524 | 409 | 6449 | 2344 |
| PP | −1057 | 1666 | −18,381 | −12,144 | −9718 | 21,862 | −2704 | 25,939 | 5462 |
| PC | −867 | −2130 | −1243 | −30,578 | −2227 | 32,805 | −33,188 | 61,768 | 24,341 |
| CP | −5282 | 3300 | −99,231 | −33,761 | −1130 | 34,891 | 9054 | 170,772 | 78,612 |
| PM | −351 | 354 | −7958 | −3929 | −2983 | 6913 | 864 | 9571 | 2480 |
| CF | −515 | 976 | −10,458 | −1706 | −525 | 2231 | −1631 | 11,311 | −317 |
| RP | −1264 | 2073 | −6022 | −7122 | −8242 | 15,364 | −1840 | 15,506 | 8453 |
| NM | −3808 | 3643 | −99,807 | −53,060 | −71,145 | 124,205 | −6136 | 160,235 | 54,127 |
| FR | −6798 | 8234 | −150,286 | 9160 | 62,077 | −71,237 | 4000 | 293,225 | 148,375 |
| NR | −4748 | 5842 | −22,901 | −21,663 | 617 | 21,046 | 7538 | 53,444 | 39,175 |
| MP | −1368 | 1794 | −6362 | −12,095 | −6420 | 18,516 | −1548 | 15,241 | 7757 |
| ME | −4245 | 8656 | −51,340 | −9192 | −30,959 | 40,150 | 9894 | 58,884 | 21,848 |
| OM | −625 | 1343 | −6959 | −4881 | −4998 | 9879 | −1289 | 8278 | 747 |
Notes: FT: food and tobacco; TL: textile and leather; WP: wood and wood products; PP: paper and printing; PC: petroleum processing and coking; CP: chemical raw materials and products; PM: pharmaceutical manufacturing; CF: chemical fiber; RP: rubber and plastics; NM: non-metallic minerals; FR: ferrous metals smelting and rolling; NR: non-ferrous metal smelting and rolling; MP: metal products; ME: mechanical and electronic equipment; OM: other manufacturing.
Table 6.
Energy structure changes in key manufacturing industry sectors (1995–2015). Units: %.
| Coal | Oil | Natural Gas | Heat | Electric Power | |
|---|---|---|---|---|---|
| 1995 | |||||
| Petroleum processing and coking | 13.45 | 61.39 | 4.83 | 15.72 | 4.60 |
| Chemical raw materials and products | 57.53 | 21.11 | 6.55 | 4.89 | 9.92 |
| Non-metallic minerals | 85.58 | 7.47 | 0.27 | 0.22 | 6.47 |
| Ferrous metal smelting and rolling | 85.37 | 4.74 | 0.31 | 2.35 | 7.23 |
| Non-ferrous metal smelting and rolling | 53.50 | 8.33 | 0.40 | 6.20 | 31.58 |
| Mechanical and electronic equipment | 63.93 | 13.70 | 1.63 | 4.26 | 16.48 |
| 2015 | |||||
| Petroleum processing and coking | 22.91 | 52.87 | 10.00 | 8.13 | 6.09 |
| Chemical raw materials and products | 46.70 | 21.63 | 8.39 | 8.39 | 14.89 |
| Non-metallic minerals | 74.58 | 8.61 | 3.65 | 0.12 | 13.04 |
| Ferrous metal smelting and rolling | 87.40 | 0.32 | 0.88 | 1.25 | 10.15 |
| Non-ferrous metal smelting and rolling | 21.36 | 3.57 | 5.25 | 4.81 | 65.01 |
| Mechanical and electronic equipment | 21.58 | 7.05 | 9.97 | 3.59 | 57.82 |
Table 7.
Comparison of common decomposition methods.
| Methods | Characteristic | Study Case |
|---|---|---|
| SDA | SDA has a prominent advantage in describing the time series variation of the factors [72] but it requires higher data and the decomposition result can only be an additive form, which is not convenient in practical analysis [73]. | [8,74,75] |
| LDM | When the number of influential factors exceeds 3, the calculation becomes too complicated. In long periods and multivariable analyses, its high residual cannot be explained. | [9] |
| LMDI | Although the selection of decomposition factors is limited, the method is simple, practical and accurate and is the most widely used. | [10,11,12] |
| VAR | The advantage is that does not distinguish endogenous and exogenous variables in advance and treat each variable equally, which can avoid subjective decision-making arbitrariness. It requires variables to be stable, whereas carbon emissions and their influential factors are usually nonstationary variables. It is necessary to carry out much stationary verification, which is usually applied to the prediction of correlated time series and the dynamic impact of random disturbance on the variable system to explain the impact of various economic shocks on the formation of economic variables [71]. | [76,77,78] |
| STIRPAT | The selection of indicators is more arbitrary and lacks necessary theoretical support. Due to the differences in the selection of indicators, it may lead to large deviations in the results of the study [79,80]. | [81,82] |
| GDIM | Proposed by Vaninsky in 2014 and adopted by a small number of scholars, GDIM is in constant improvement. | [52,83] |
© 2019 by the authors. Licensee MDPI, Basel, Switzerland. This article is an open access article distributed under the terms and conditions of the Creative Commons Attribution (CC BY) license (http://creativecommons.org/licenses/by/4.0/).
Share and Cite
MDPI and ACS Style
Liu, J.; Yang, Q.; Zhang, Y.; Sun, W.; Xu, Y. Analysis of CO2 Emissions in China’s Manufacturing Industry Based on Extended Logarithmic Mean Division Index Decomposition. Sustainability 2019, 11, 226. https://doi.org/10.3390/su11010226
AMA Style
Liu J, Yang Q, Zhang Y, Sun W, Xu Y. Analysis of CO2 Emissions in China’s Manufacturing Industry Based on Extended Logarithmic Mean Division Index Decomposition. Sustainability. 2019; 11(1):226. https://doi.org/10.3390/su11010226
Chicago/Turabian StyleLiu, Jian, Qingshan Yang, Yu Zhang, Wen Sun, and Yiming Xu. 2019. "Analysis of CO2 Emissions in China’s Manufacturing Industry Based on Extended Logarithmic Mean Division Index Decomposition" Sustainability 11, no. 1: 226. https://doi.org/10.3390/su11010226
Note that from the first issue of 2016, this journal uses article numbers instead of page numbers. See further details here.