Article

Evaluation of Building Energy and Daylight Performance of Electrochromic Glazing for Optimal Control in Three Different Climate Zones

1
Building Envelope Technology Center, Energy & Environment Business Division, Korea Conformity Laboratories (KCL), 595-10, Pyengsin 1-ro, Daesan-eup, Seosan-si 31900, Chungnam, Korea
2
Sustainable Building Research Center, Hanyang University, 55 Hanyangdaehak-ro, Sangrok-gu, Ansan-si 15588, Gyeonggi-do, Korea
*
Authors to whom correspondence should be addressed.
Sustainability 2019, 11(1), 287; https://doi.org/10.3390/su11010287
Submission received: 28 October 2018 / Revised: 18 December 2018 / Accepted: 26 December 2018 / Published: 8 January 2019
(This article belongs to the Collection Power System and Sustainability)

Abstract

:
The objective of this paper is to analyze the control conditions of the transmittance rate, and determine the conditions that are most optimal with respect to building energy and daylight performance in three climate conditions: Riyadh, Saudi Arabia (hot climate); Inchon, South Korea (hot and cold climate); and Moscow, Russia (cold climate). The analysis was based on the electrochromic glass developed by a research team. Electrochromic glass is a next generation solar control glass that can control the transmittance of the glass itself. Therefore, proper control methods are essential for rational use of this electrochromic glass. To properly control electrochromic glass, daylight performance must be considered, along with building energy (heating, cooling, and lighting). If only building energy is considered, transmittance needs to be lowered during the summer season and increased during the winter season. Controlling electrochromic glass transmittance with such a method would not improve the satisfaction of users and occupants of a building due to the resulting glare. In addition to energy reduction, the basic function of solar control glass is to prevent glare. Therefore, in this study, we develop the Energy and Daylight Performance Index (EDPI) using, to evaluate the combined building energy and daylight performance and deduce the optimal control method for electrochromic glass. In addition, optimal control conditions for the three different climatic regions were obtained. Limitations of this study were that the scope was restricted to the eastern climate region, and that the building analysis model was limited to one climate region. It is expected that the optimal control method could be used as an initial database in the development of a electrochromic glass control system.

1. Introduction

1.1. Research Background and Objective

Energy saving technologies are being actively investigated and developed in the architectural industry, and regulations concerning building energy consumption tend to be strengthened in many countries around the world. Mainly due to the fact that building envelopes are directly related to the amount of energy required for cooling, heating, and lighting, energy saving technologies have been investigated and developed in many relevant areas including insulation, airtightness, and solar radiation control.
In recent years, smart glass; whose transmittance can be controlled to adjust the amount of solar radiation entering a building, has been actively developed. Various types of smart glass products have been developed, including those with electrochromic (EC), thermochromic (TC), photochromic (PC), and polymer-dispersed liquid crystal (PDLC) coatings [1]. These smart glass products can control transmittance without the aid of shading devices such as blinds or rolling shades; instead, transmittance is easily adjusted using electric signals [2].
Each type of smart glass being developed has its particular advantages and disadvantages. Electrochromic glazing has a wide transmittance range covering the entire solar spectrum in both the clear (transparent) and colored (darkened) states, and can be driven at a low voltage of 5 V or below [3]. In addition, if electricity supply is required only when the transmittance changes, it would not be necessary to supply electricity below the desired transmittance [4]. On the other hand, the disadvantage of EC glazing is that, when the transmittance changes, EC glazing has a slow response time that conventionally exceeds 10 min [5]. Thermochromic glazing changes its transmittance according to ambient temperature [6], and photochromic glazing varies the transmittance depending on ambient brightness [7]. Both thermochromic and photochromic windows can adjust their transmittance without power supply, which is a common advantage. However, automatic transmittance adjustment operates regardless of the user’s intention, which is a disadvantage. Unlike EC glazing, PDLC glazing has a quick response time of less than 1 s, and its transmittance range does not cover the entire solar spectrum. Thus, this type of glazing is advantageous for privacy protection because it can operate in both the transparent and translucent states [8]. Unlike EC glazing, PDLC glazing needs continuous power supply to maintain a transparent state [9].
Among the above-mentioned smart glass products, EC glazing enables users to adjust transmittance over a wide range, and does not require continuous power supply to maintain its state. Therefore, EC glazing is the most promising technology to control the solar radiation entering buildings. Studies on this type of smart glass are being actively conducted, and many prototypes have been released [10].
Among EC glazing-based studies, one concerned with building energy saving showed that the application and operation of EC glazing in office buildings could reduce energy consumption by 20% [11]. Another study revealed that the appropriate application of EC glazing reduced energy consumption more than conventional glass products for buildings, and that energy consumption could be reduced by over 54% in regions with a Mediterranean climate [12]. The impact of EC glazing on thermal and visual comfort was also examined [13]. Other studies analyzed the optical properties of EC glazing to derive the optimal transmittance, according to building types and weather conditions or simulated building energy consumption and daylight performance for analysis purposes [14,15]. In addition, a recent study considered a new type of EC glazing, which can selectively control radiation in the near-infrared range, i.e., it only plays a thermal role but is not visible [16]. Photovoltaic EC glazing is also being developed. Photovoltaic panels produce power that is stored in a battery and can be used for tinting, thus no separate power supply is necessary and no energy is consumed during operation. Moreover, this type of smart EC glazing can be controlled by smartphones via a wireless IoT (Internet of Things) network, which provides users with advanced convenience compared to traditional shading devices [17]. Slow response is one of the major disadvantages of EC glazing. To solve this problem, a metallic mesh with hardly visible electrodes was applied to the electrochromic coating to enhance the speed of electric flow and accelerate the response of EC glazing [18].
EC glazing can be utilized as a solar radiation controller that easily adjusts its transmittance in response to electric signals. Accordingly, it is very important to minimize the consumption of cooling, heating, and lighting energy, and optimize indoor daylight conditions by appropriately adjusting the transmittance according to the external environment [19]. In this study, solar radiation and outdoor temperature were selected as the control variables to derive the optimal control conditions for EC glazing. We analyzed the extent to which the use of EC glazing to control transmittance, affects variations in building energy and daylight performance. The literature review presented in this section focused on previous studies that proposed optimal conditions for EC glazing control in the Korean climate [20]. Based on these data, this study attempted to derive the optimal conditions for controlling EC glazing in three climatic zones based on solar radiation and temperature control conditions.

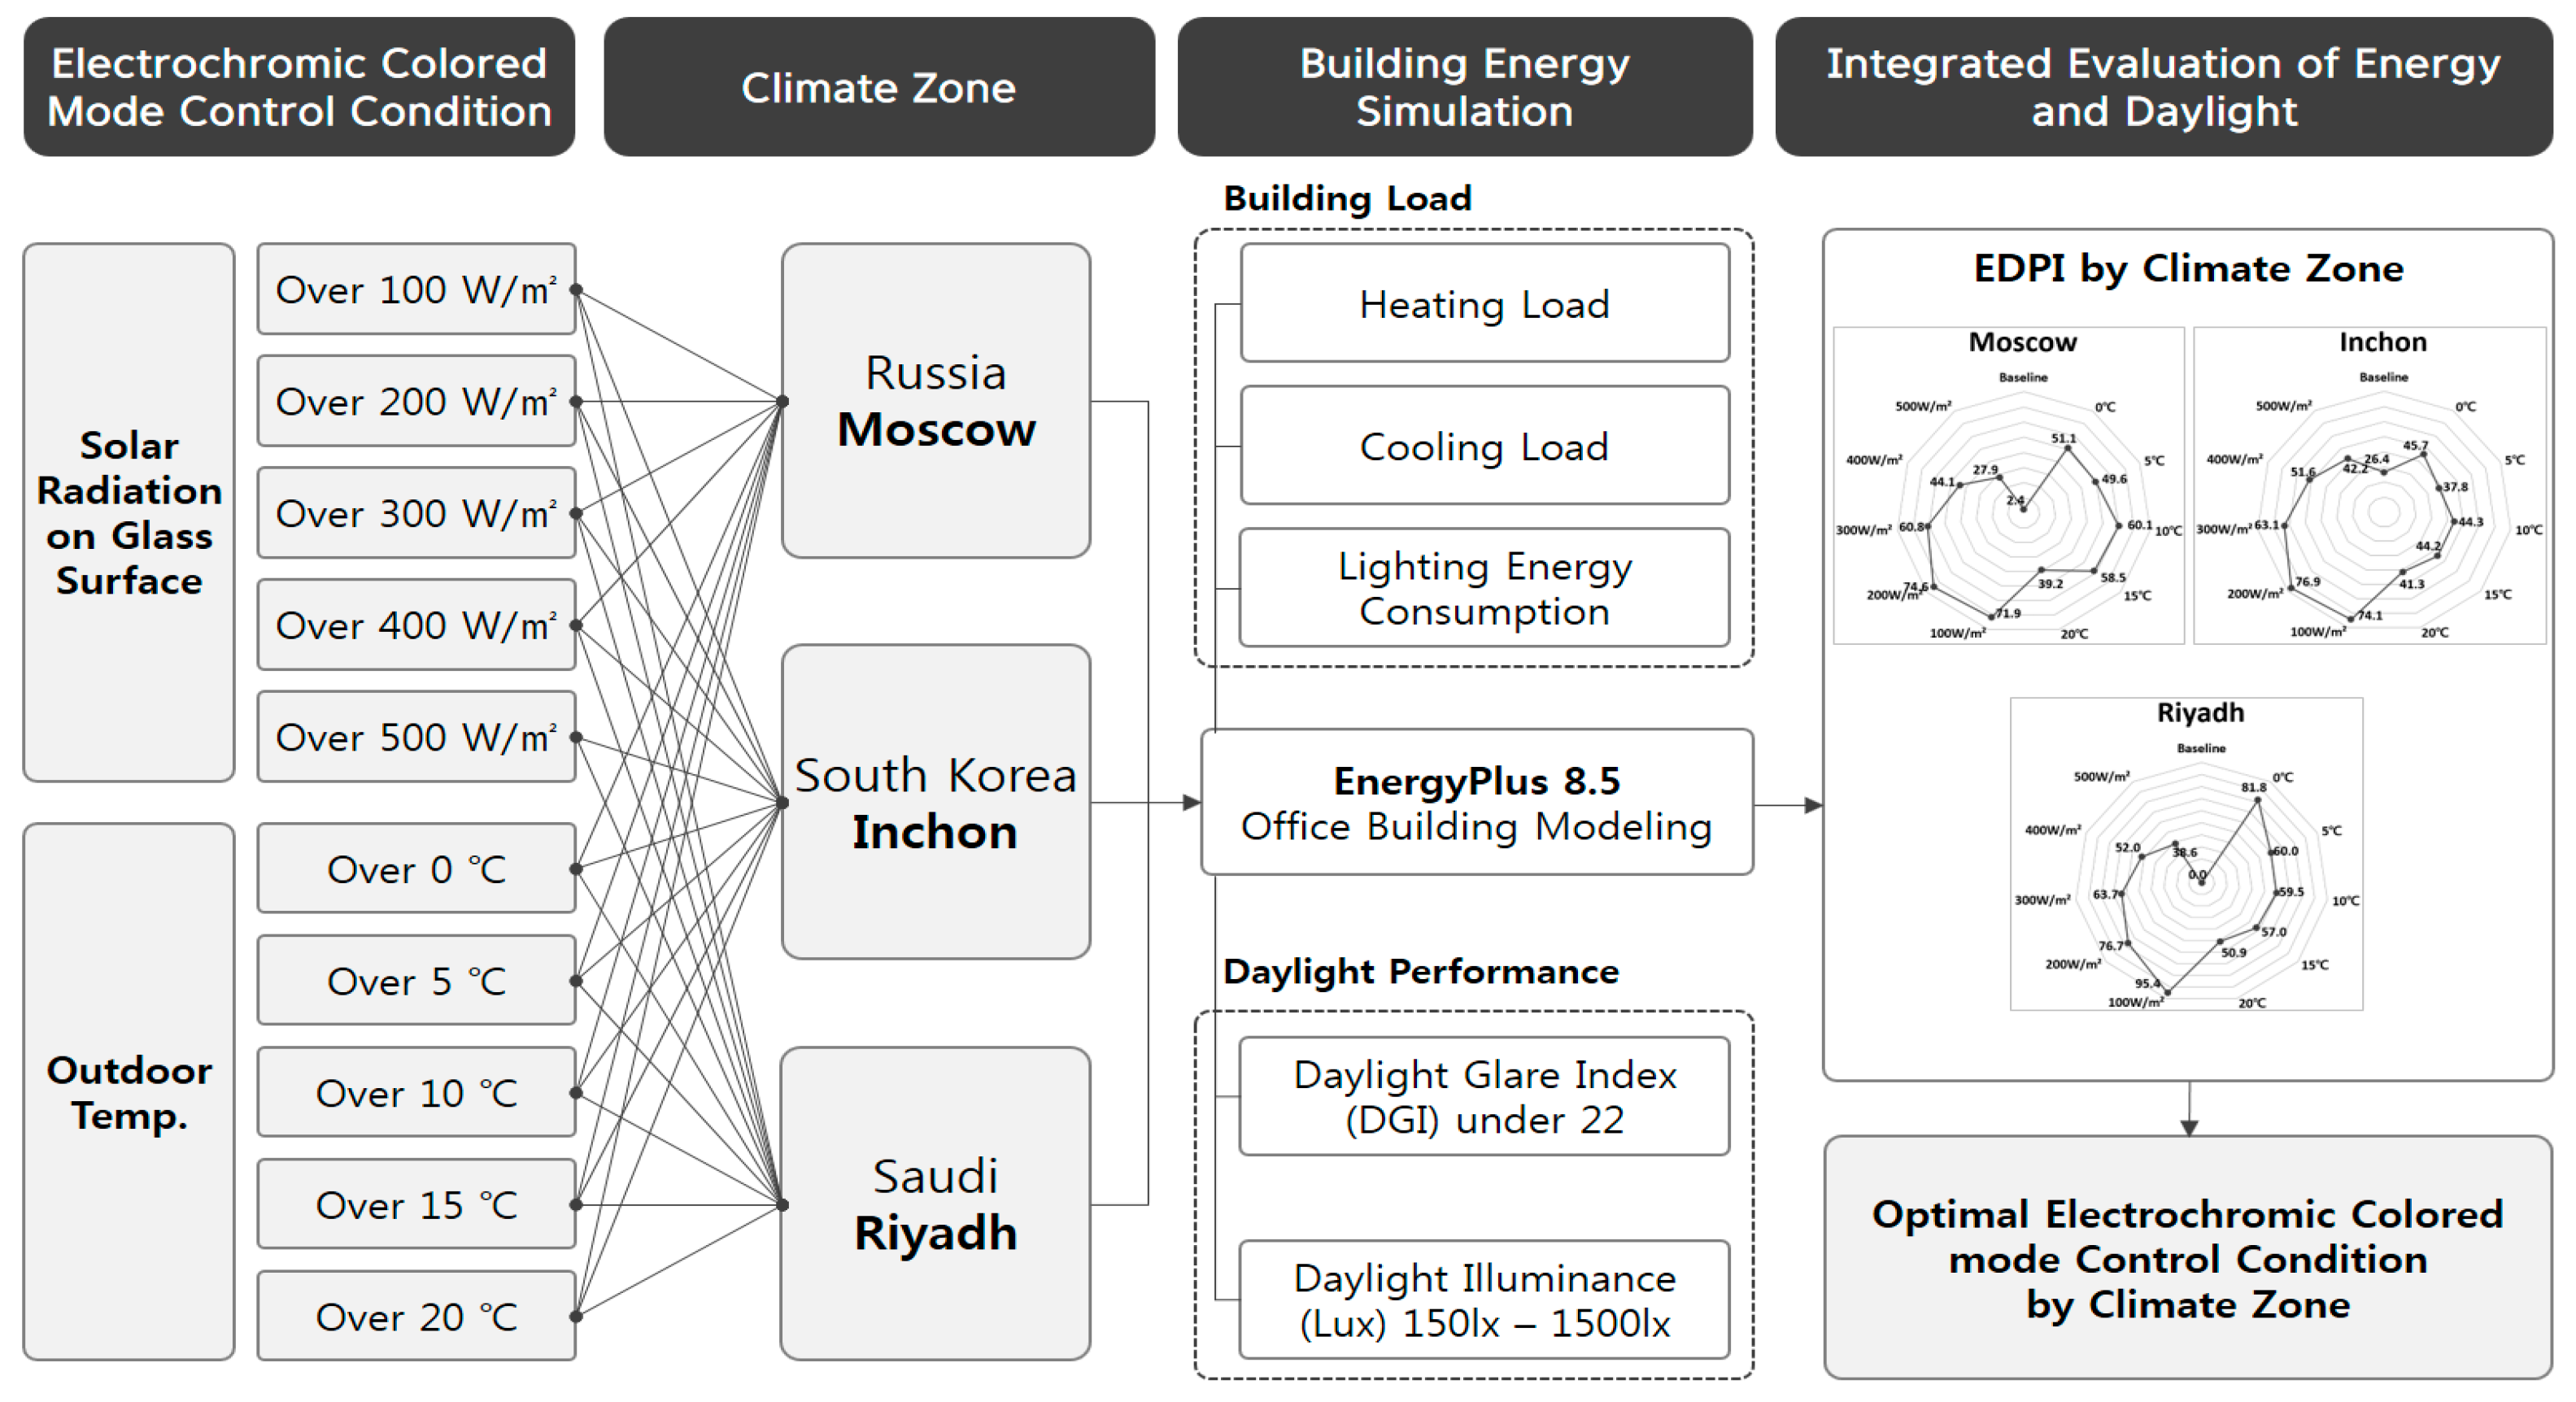
1.2. Research Method and Scope

First, the electrochromic sample developed by our team was produced at 50 × 50 mm, and the optical properties of the fabricated specimens were analyzed using a spectrometer. Analytical data were obtained using the LBNL (Lawrence Berkeley National Laboratory) Optic program to extract glass transmittance, reflectance, and absorption rate data. The transmittance and reflectance data in the multilayer glass state were derived for each kind of data extracted using LBNL’s Window 7.4 Optic program. The transmittance and reflectance data thus constructed were entered into the EnergyPlus 8.5 simulation tool, a building energy dynamic analysis program. Then, the building energy and light environmental performance of the office buildings were analyzed using the control conditions for the electrochromic glass.
During this study, it was anticipated that the optimal transmission rate control conditions for electrochromic glass vary depending on climatic conditions. Thus, three eastern climate regions were selected for performance evaluation: (1) Moscow, Russia, where the effects of winter are significant for building energy; (2) Inchon, South Korea, where the summer and winter effects are the same; and (3) Riyadh, Saudi Arabia, where the effects of summer are great. Climate data available on the EnergyPlus website were used.
The analysis was conducted by controlling the transmittance of EC glazing using the following coloring conditions: (1) 100 W/m2, (2) 200 W/m2, (3) 300 W/m2, (4) 400 W/m2, and (5) 500 W/m2 according to the solar radiation, and (6) 0 °C, (7) 5 °C, (8) 10 °C, (9) 15 °C, and (10) 20 °C according to the outdoor temperature. These two variables were selected to represent the external environment for EC glazing control to simplify the process with the aim of facilitating the commercialization of a control algorithm and hardware. These two control variables are the most closely related to the building envelope and the cooling, heating, and lighting loads. Finally, a method for achieving maximum energy reduction using the control variables, thus simplified was derived.
The total cooling, heating, and lighting loads, the annual amount of time during which the DGI (Daylight Glare Index) is below 22, and the annual amount of time during which the comfort interior illuminance (150~1500 l x) was maintained, were analyzed for each of the weather conditions according to the control conditions. Finally, an integrated analysis of the building energy and daylight performance was carried out using EDPI (Energy and Daylight Performance Index), which was developed in previous studies, to derive the optimal control conditions for each climatic region. Figure 1 illustrates the overall flow of this study.

2. Optical Properties of Electrochromic Glazing

The optical properties data used in this study were obtained by analyzing a specimen of the EC glazing developed by the authors of this study. The total spectrum data of the optical properties of EC glazing formed the results of a previous study [20]. The EC glazing that was used in this study consisted of a transparent conductive object, an electrochromic layer, an ion storage layer, and electrolytes. TEC (Transparent conductive glass, model name) 10(10 ohm) of Pilkington was used as the transparent conductive object. Coatings of WO3 (tungsten trioxide) 400 nm and NiW (nickel tungsten) 400 nm were sputtered onto the electrochromic layer and the ion storage layer, respectively. LiClO4 gel-type electrolytes were used.
A spectrum analyzer (Optizen POP spectrometer) was used to analyze the optical properties. The transmittance and reflectance in the spectral wavelength range of 0.3–2.5 μm (0.005 μm intervals) were measured by applying voltage of 2 V and −2 V for 5 min to maintain the clear and colored states. The raw transmittance and reflectance data captured by the spectrum analyzer were imported into the LBNL (Lawrence Berkeley National Laboratory) Optic 5.1 program. In this way, the average spectral data pertaining to the solar transmittance, solar reflectance, visible transmittance, and visible reflectance were derived for EC single glazing, as presented in Table 1 [21]. As seen in the Table 1, the solar transmittance (Tsol) of the EC glazing specimen could be controlled within the ranges of 48.1% and 6.5% in the clear and colored states, respectively. Visible transmittance (Tvis) proved to be adjustable within the ranges of 64.8% and 12% in the clear and colored states, respectively.
Because single glazing cannot be used for buildings, paired glass is required for heat insulation. Accordingly, the above data relating to EC single glazing were processed by the LBNL Window 7.4 program to construct the double glass used in this study. The values computed for the optical properties and heat insulation are included in Table 2 [22]. These values were used to analyze the building energy and daylight performance according to the control variables (solar radiation and outdoor temperature) for each climatic region.

3. Simulation Conditions

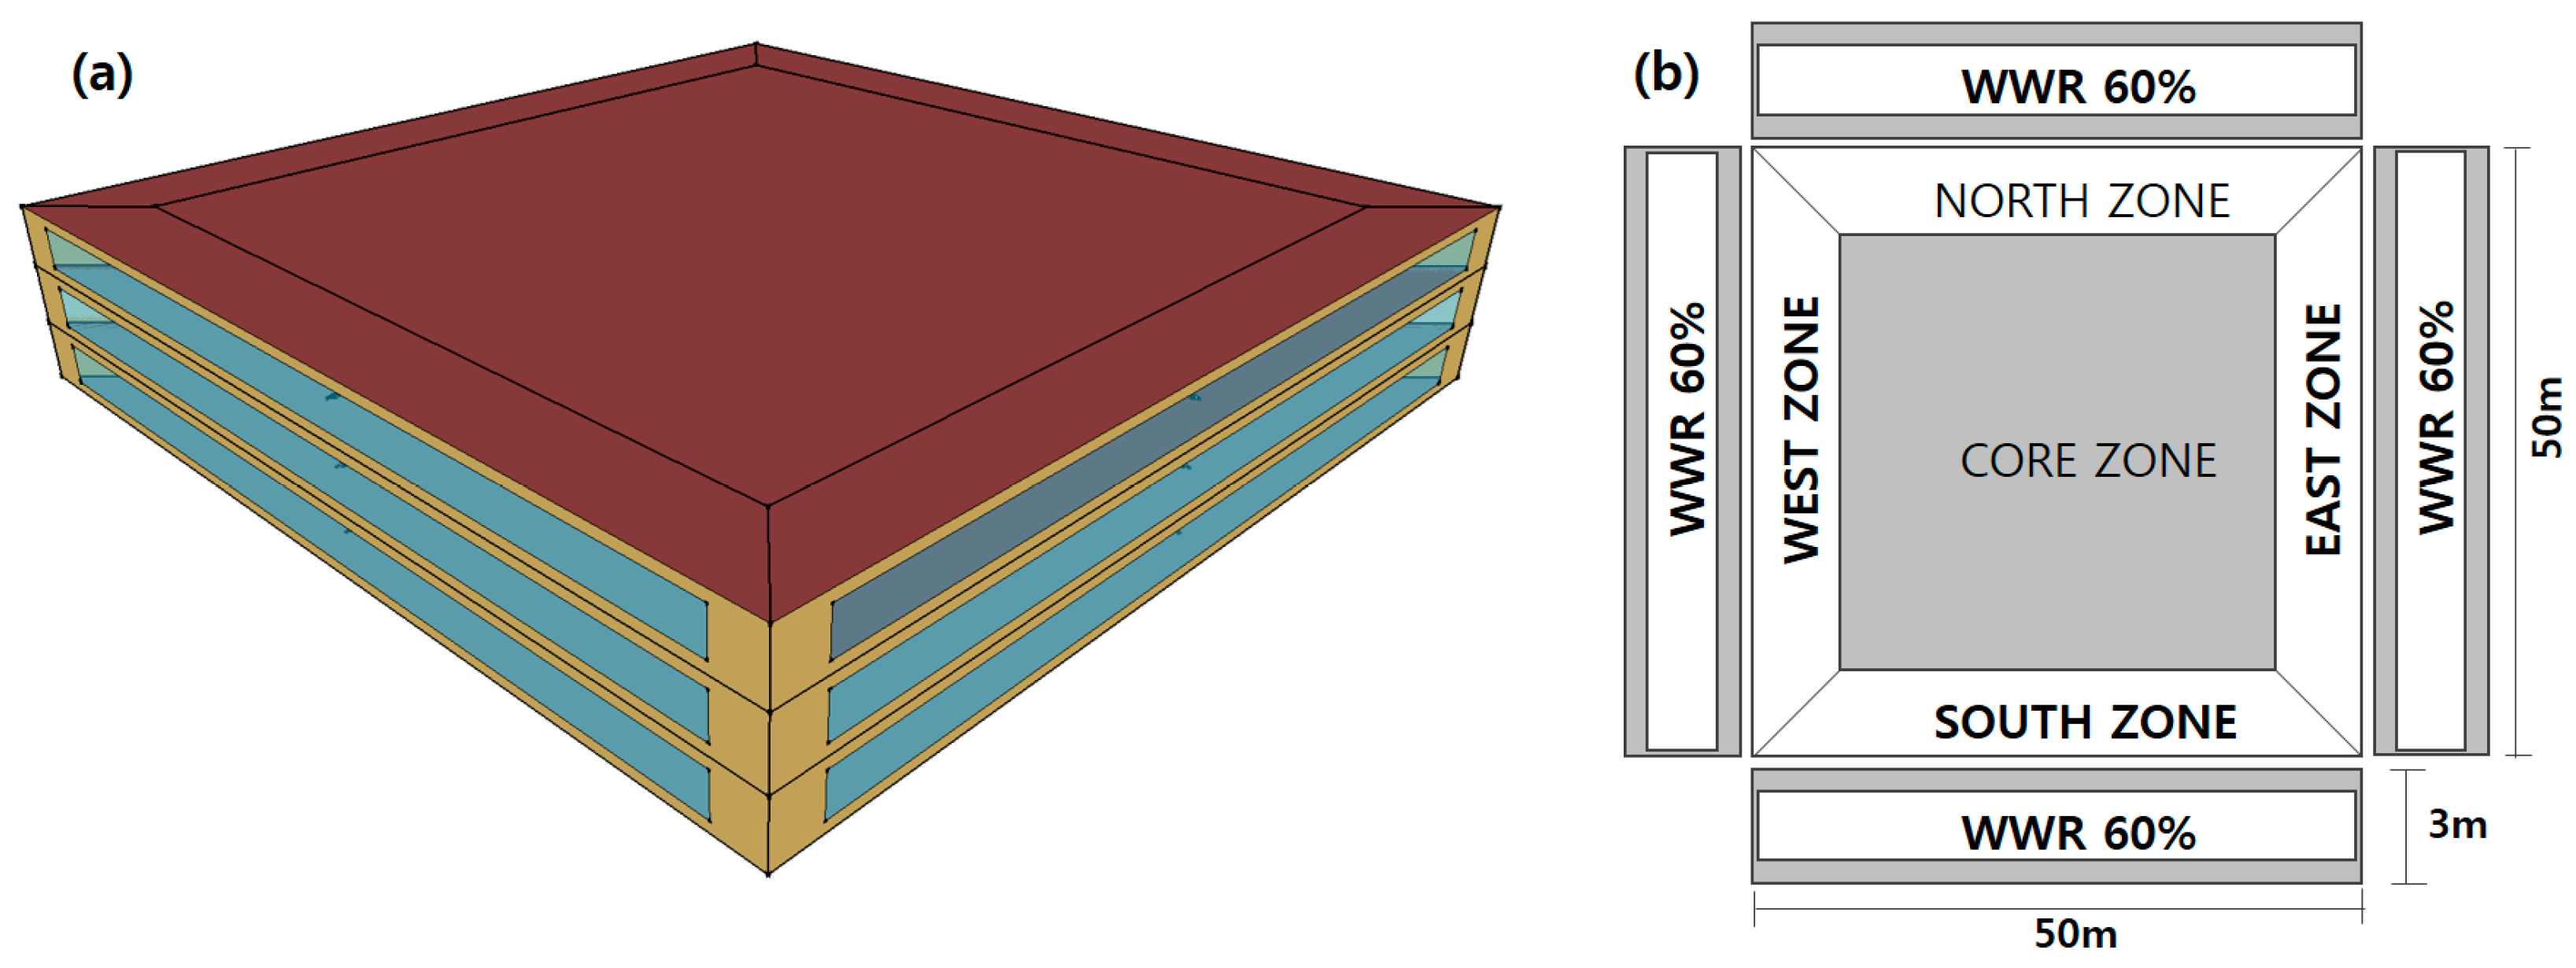
3.1. Overview of the Analytical Simulation Model

This study used EnergyPlus 8.5, which was developed by the DOE (Department of Energy) of the US government, as a building energy simulation tool [23]. Building energy and daylight performance were analyzed by varying the EC glazing control conditions. EnergyPlus provides a switchable glazing component for controlling EC glazing, calculates the transmittance, reflectance, and absorption of solar radiation, and enables a detailed analysis of the building energy.
The optical properties of a glazing system consisting of N glass layers are determined by solving the following recursion relations for T i , j , the transmittance through layers i to j; R f i , j and; R b i , j , the front and back reflectance, respectively, from layers i to j; and A j , the absorption in layer j. Here layer 1 is the outermost layer and layer N is the innermost layer. These relations account for multiple internal reflections within the glazing system. Each of the variables is a function of wavelength [24]. The recursion relation formulas for transmittance, reflection, and absorption of glass are Equations (1)–(4). Here, T indicates transmittance, R indicates reflectance, R f and R b indicate front reflectance and back reflectance, T i , j indicates transmittance through glass layers i to j, A i f , and A i b indicate front absorptance and back absorptance of layer i. These formulas were key to calculating solar radiation and building energy changes in a room in accordance with changes in electrochromic permeability. Figure 2 show the schematic of transmission, reflection, and absorption of solar radiation within a multi-layer glazing system.
T i , j = T i , j 1 T j , j 1 R j , j f R j 1 , i b
R i , j f = R i , j 1 f + T i , j 1 2 R j , j f 1 R j , j f R j 1 , i b
R j , i b = R j , j b + T j , j 2 R j 1 , i b 1 R j 1 , i b R j , j f
A i f = T 1 , j 1 ( 1 T j , j R j , j f ) 1 R j , N f R j 1 , 1 b + T 1 , j R j + 1 , N f ( 1 T j , j R j , j b ) 1 R j , N f R j 1 , 1 b
Additional advantages of EnergyPlus include the DGI (Daylight Glare Index) analysis component, which enables the analysis of glare as representing daylight performance, and a daylight sensor for analyzing interior luminance [25]. Figure 3 shows the analysis model for the simulation, which is a three-story office building. The model is divided into perimeter zones and a core zone. This study focused on analyzing the middle floor, and the southern, eastern, and western perimeter zones, which were affected by solar radiation. The analytical model was selected randomly, and the floor area was set to 50 × 50 m, the floor height was set to 3 m, and the window area ratio was set to 60% [20].
The envelope of the analysis model was constructed in accordance with the heat insulation requirements of the Building Energy Code (2016), and the electrochromic double glass derived by using the LBNL Windows tool described in Section 2, was used to represent the properties of glass. The temperatures of the analysis model were set to 20 °C and 26 °C in accordance with the indoor temperature requirements for calculating the capacities of cooling and heating systems in the Building Energy Code [26]. The Ideal Loads Air System, which is provided by EnergyPlus for analyzing Energy by excluding as much interruption caused by system variables as possible, was applied as the HVAC (Heating, ventilation, and air conditioning) system [27]. As for internal heat gain, overhead lighting contributed 10.8 W/m2, the peak occupancy was 22.3 m2/person, and an equipment contribution of 8.6 W/m2 were applied according to the standards of ASHRAE (American society of heating, refrigerating and air-conditioning engineers) Fundamentals (2009) [28]. The office schedule provided by the datasets of EnergyPlus was used as the schedule of internal heat gain contributed by the human body, lighting, and other devices. The outside airflow rate was set to 1.1 m3/m2h based on the operational rule of the Building Energy Efficiency Rating System.
In this study, in order to evaluate the lighting energy reduction performance according to the transmittance rate control for the electrochromic glass, indoor lighting was controlled to 700 l x, which is required by building laws for office buildings in Korea [29]. EnergyPlus provides a component that enables three types of dimming control: Stepwise, continuous, and continuous/off. Continuous dimming control was selected for this study. In other words, 100% lighting energy was consumed at an interior luminance of zero l x, whereas no lighting energy was consumed at 700 l x. The interior luminance was continuously controlled from zero to 700 l x. Table 3 shows the wall and glazing properties of the simulation model.

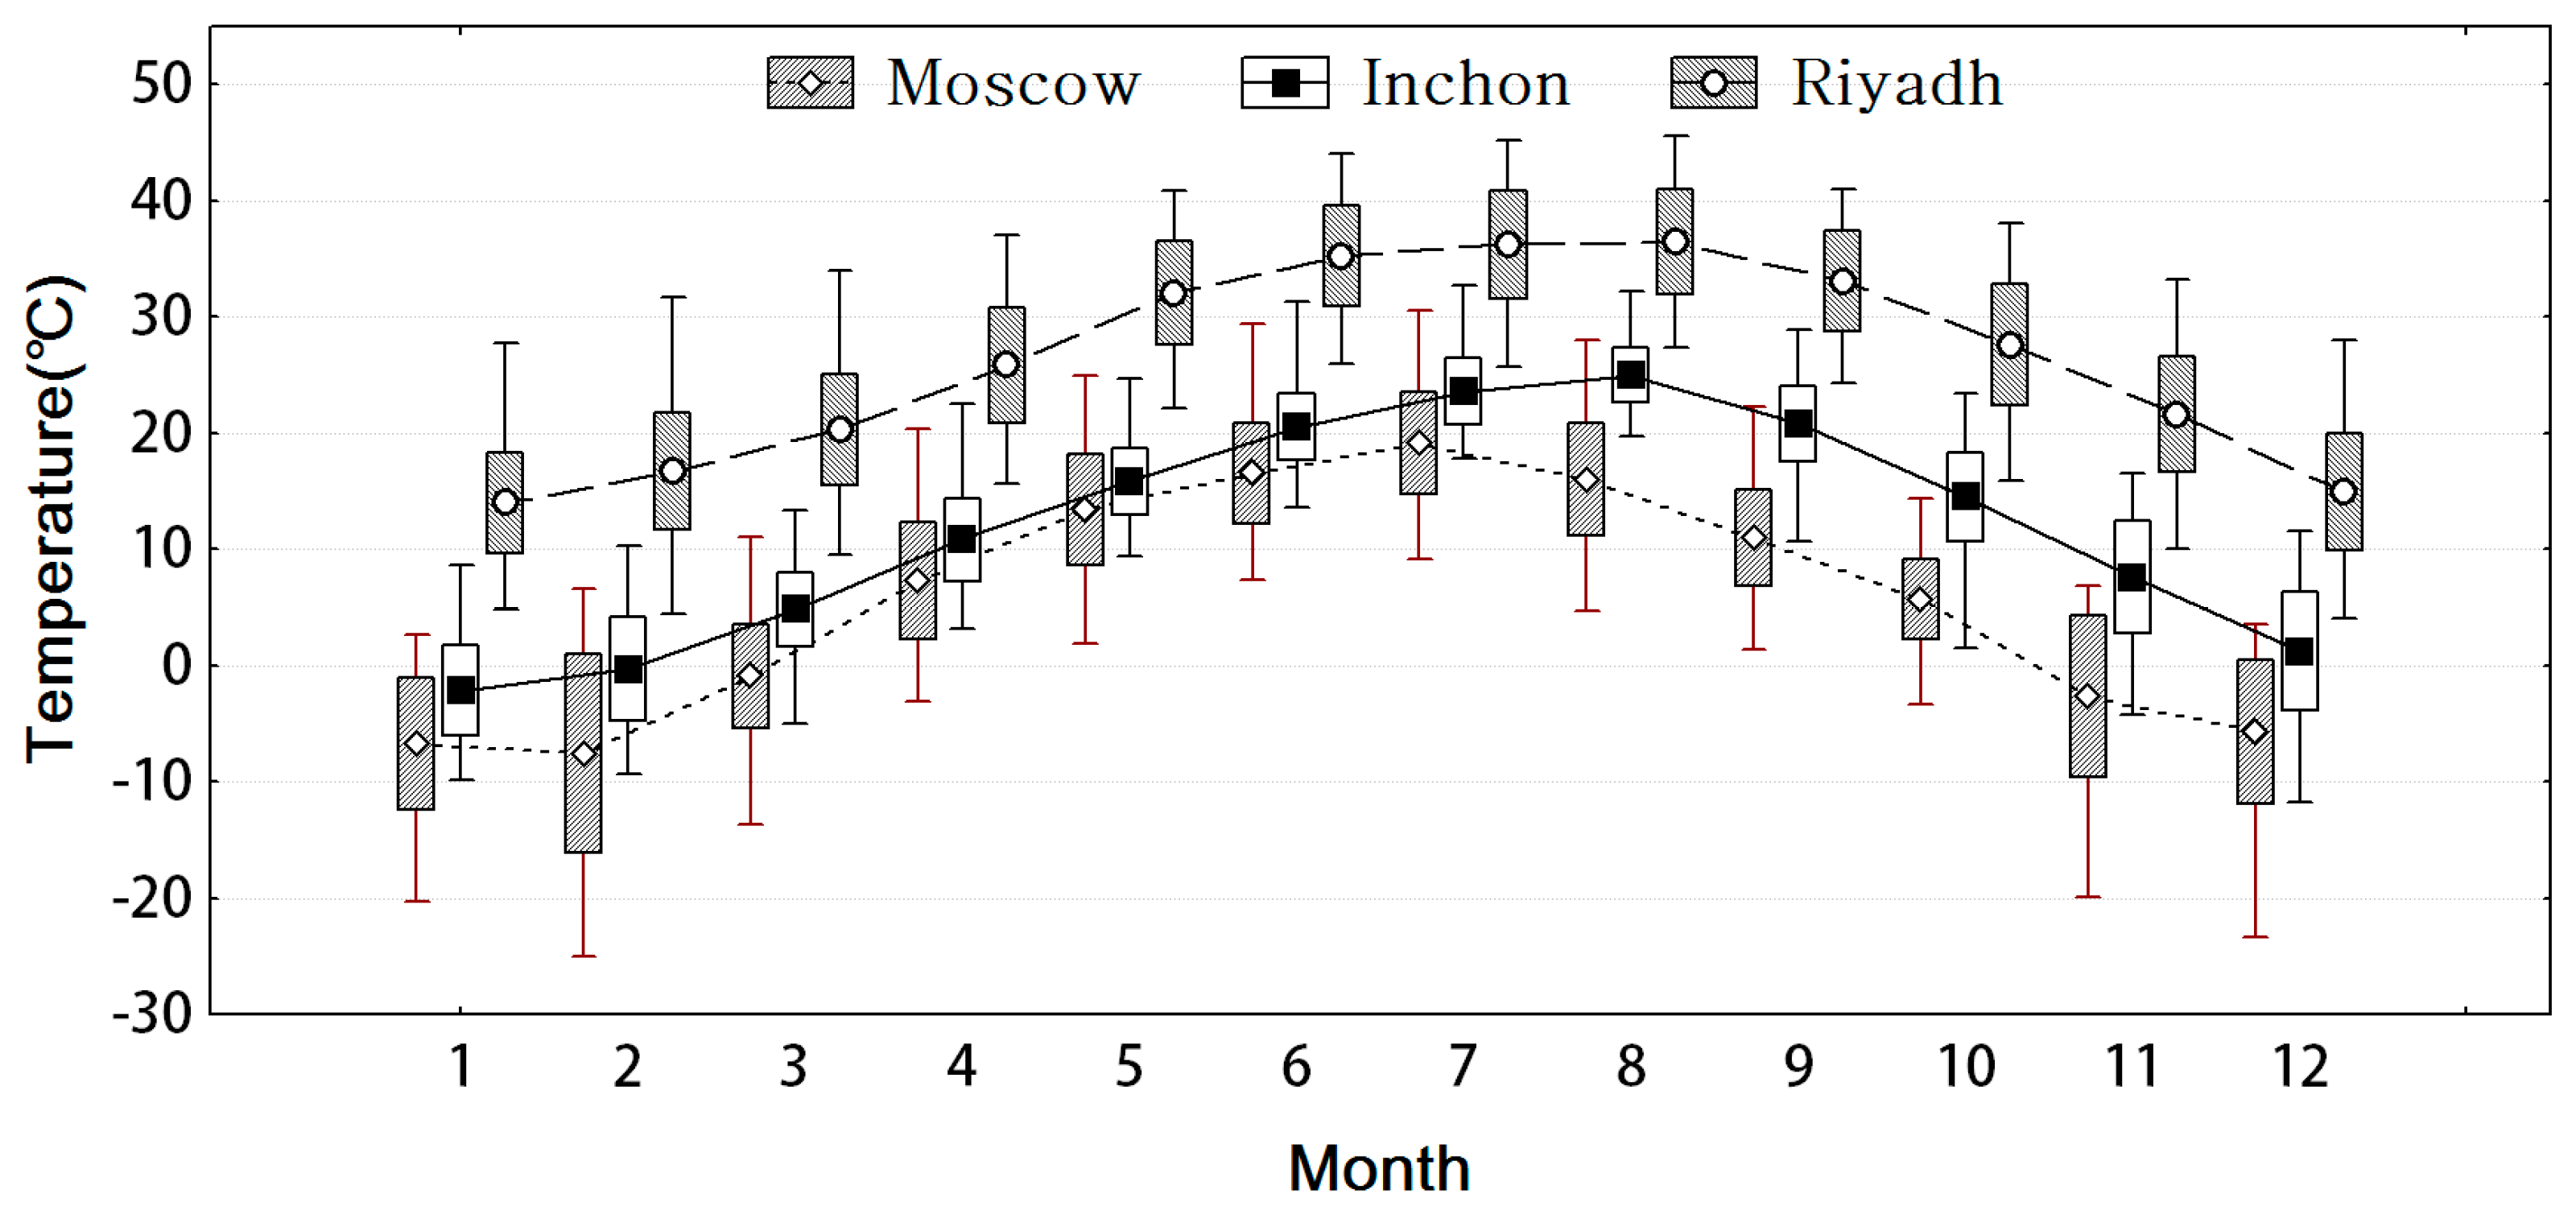
3.2. Climate Zone and Weather Data

This study used the weather data available on the EnergyPlus website [30]. The weather data pertaining to the following three cities were used as being representative of each characteristic climate zone: (1) Moscow in Russia (cold climate); (2) Inchon (also written as Incheon) in Korea (hot and cold climate); and (3) Riyadh in Saudi Arabia (hot climate).
Moscow in Russia is located in the continental climate zone. However, compared to other European cities of the same latitude, Moscow shows a larger variation in weather and has especially cold weather in the winter. Climate conditions in Inchon in Korea are dominated by cold continental anticyclone conditions during winter, hot and humid oceanic anticyclone conditions during summer. Accordingly, because Inchon has a continental climate with an annual temperature range of approximately 30 °C, both summer and winter occur in this city. Riyadh in Saudi Arabia has a desert climate. The annual mean temperature is 32–38 °C and the highest temperature is 48 °C. The climate is hot and dry. Influenced by the continental climate, after sunset in summer, evenings are cool and are often characterized by a strong northeasterly wind accompanied by airborne dust and sand.
Figure 4 is a box-plot graph showing the change in the annual outside temperature for each climate region. The midpoint of the graph represents the mean temperature, the maximum and minimum values of the boxes are the standard deviations, and the whiskers are the maximum and minimum temperatures per year. Table 4 presents the results of the analysis of the weather data from the EnergyPlus website for each climate zone. The annual highest and lowest temperatures, respectively, were 30.5 °C and −25.0 °C in Moscow, 32.6 °C and −11.7 °C in Inchon, and 45.6 °C and 4.0 °C in Riyadh. Thus, Riyadh has the highest temperature and Moscow the lowest. The mean temperature was also the highest in Riyadh, followed by Inchon and Moscow. The same ranking applied for solar radiation, that is, Riyadh, Inchon, and Moscow. Based on these characteristics of the three climatic zones, the energy and daylight performance of the EC glazing were analyzed according to the control conditions presented in Section 3.3.

3.3. Control Conditions of EC Glazing

This study attempted to derive a control method that could minimize the control variables of EC glazing and satisfy every condition regarding building energy and daylight performance. To simplify the control variables, this study restricted the range of external conditions to outdoor temperature and solar radiation.
First, EC glazing was controlled by varying the amount of solar isolation on the vertical surfaces: (1) 100 W/m2, (2) 200 W/m2, (3) 300 W/m2, (4) 400 W/m2, and (5) 500 W/m2. When each respective solar radiation value was exceeded, EC glazing darkened; otherwise, it became clear.
Second, EC glazing was controlled by varying the outdoor temperature as follows: (6) 0 °C, (7) 5 °C, (8) 10 °C, (9) 15 °C, and (10) 20 °C. In other words, EC glazing darkened when the temperature exceeded each specified temperature; otherwise, it became clear.
Ten conditions were set according to the solar radiation on the vertical surfaces and outdoor temperatures. The clear state of EC glazing was maintained as the baseline. The EnergyPlus analysis model described in Section 3.1 was utilized by applying the aforementioned ten control conditions and the energy and daylight performances were analyzed for each climate zone. The results are presented in Section 4.

4. Results and Discussion

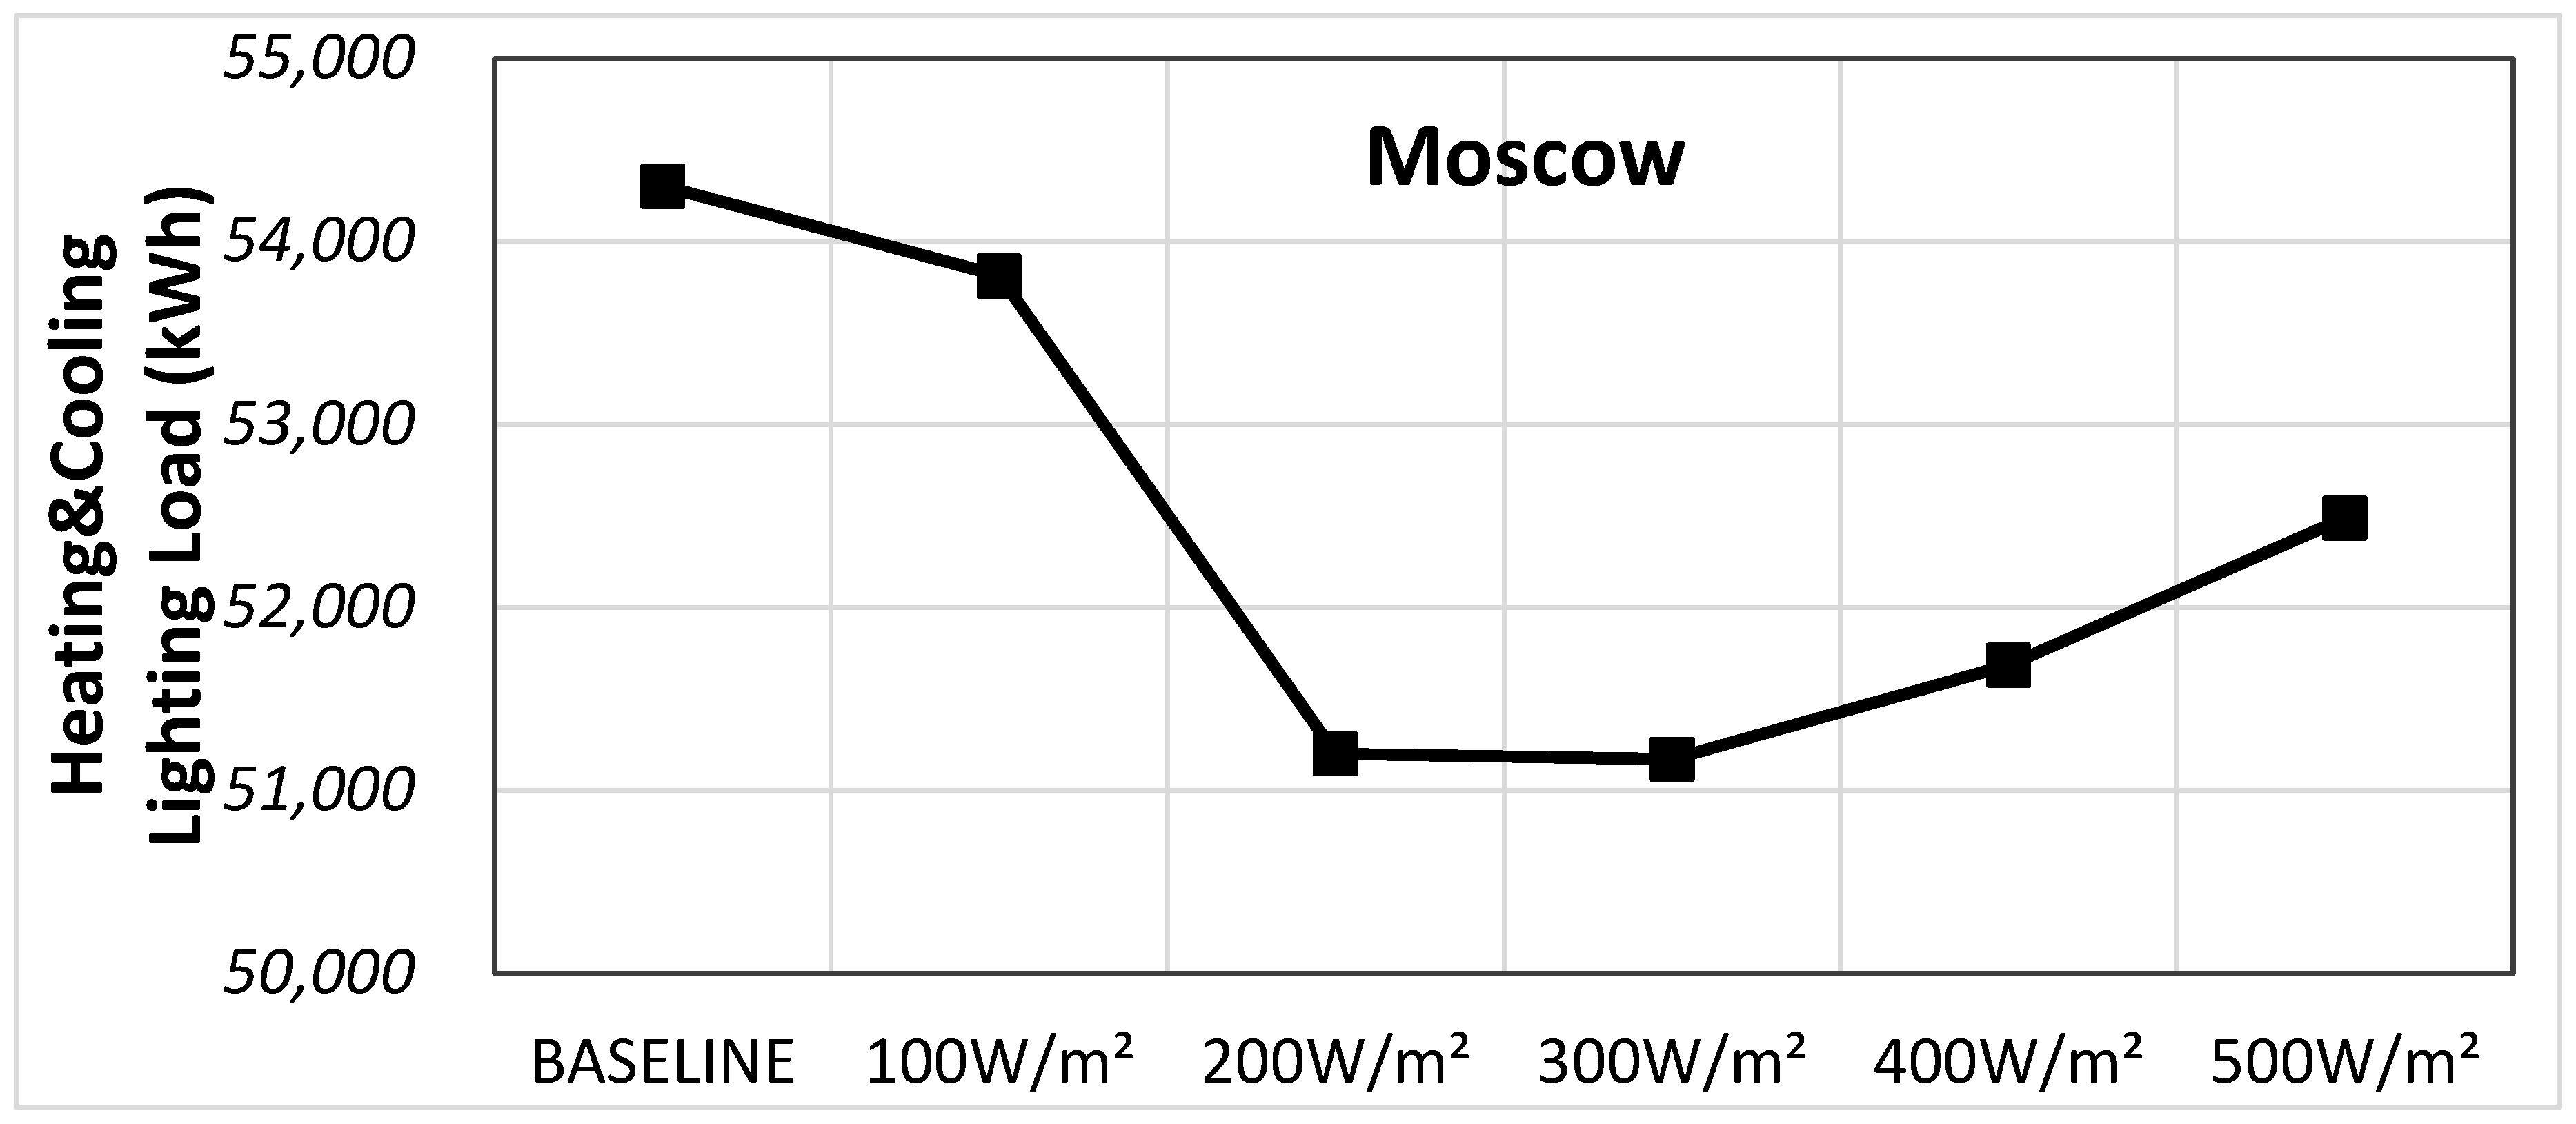
4.1. Analysis Results of Cooling, Heating, and Lighting Energies by Varying Solar Radiation

Glazing, which is the only part of a building that transmits solar radiation, is directly related to the cooling, heating, and lighting energies. As the main function of smart glass is to control the solar radiation transmitted into indoor space, solar radiation is a control variable that needs to be preferentially considered when controlling EC glazing. Accordingly, solar radiation was set as a control variable and used to obtain the results presented in this section. For each climate zone represented by Moscow in Russia, Inchon in Korea, and Riyadh in Saudi Arabia, respectively, EC glazing was controlled by varying the solar radiation to calculate the total annual cooling, heating, and lighting energies. Then, the calculation results were analyzed and compared, and the optimal control condition for solar radiation was derived for each climate zone.
Solar radiation was measured on the vertical surfaces on which EC glazing was installed. When the amount of radiation exceeded the criteria set in Section 3.3, the EC glazing was controlled to be colored. The cooling and heating energies were determined using the Ideal Loads Air System model of EnergyPlus 8.5 according to the control conditions for EC glazing. The energy necessary to achieve the set temperatures of 20 °C and 26 °C for cooling and heating, respectively, were calculated. This study applied lighting control to examine the lighting energy required to maintain a suitable interior luminance, along with the cooling and heating energies. An interior luminance of 700 l x was set as the baseline, and continuous dimming control was adopted as the lighting control method to evaluate the impact of the lighting energy for different transmittances of the EC glazing.
First, as shown in Table 5 and Figure 5, the analysis results for Moscow, Russia, revealed that when EC glazing was controlled according to the solar radiation, the annual energy was reduced under all control conditions relative to the baseline. In Moscow, among the control conditions for EC glazing, the annual energy was decreased by the smallest amount at 100 W/m2 and decreased by the largest amount at 300 W/m2. The total annual energy of Moscow was mostly affected by the difference in cooling energy, which was related to the extent to which the EC glazing was controlled. Figure 6 hows the monthly energy for Moscow. Clearly, controlling EC glazing according to the solar radiation has a larger effect on the cooling energy in summer than in winter.
Second, the analysis results for Inchon, Korea are presented in Table 6 and Figure 7 These results indicate that, except for 100 W/m2, the annual energy decreased under all the control conditions for EC glazing, with the greatest decrease at 300 W/m2. When solar radiation of 100 W/m2 was used, the annual energy increased. This was explained as follows: The small amount of solar radiation transmitted at 100 W/m2 resulted in a high heating energy during winter, as shown in Figure 8 and required the high lighting energy during summer because of the low interior luminance.
Third, as shown in Table 7 and Figure 9 the analysis results for Riyadh, Saudi Arabia, revealed that the annual energy was lower than the baseline under all control conditions for EC glazing, with the largest decrease in energy at 200 W/m2. Figure 10 shows that, unlike Moscow and Inchon, the annual energy of Riyadh decreased. This is attributable to the cooling-based weather patterns of Riyadh. In other words, the cooling energy could be considerably reduced by shading, which resulted in the observed marked decrease in the total annual energy.
An analysis of the variations in total annual energy as a result of controlling EC glazing by varying the amount of solar radiation revealed that Moscow, Inchon, and Riyadh had the smallest energy at 300 W/m2, 300 W/m2, and 200 W/m2, respectively. In particular, Riyadh showed a decrease in the annual energy of as much as 23.4% at 200 W/m2, which was the most remarkable effect. Inchon and Moscow showed decreases of 4.0% and 5.8%, respectively, in the annual energy, at 300 W/m2. Accordingly, EC glazing was especially effective in Riyadh and a similar region, both of which showed a cooling-based weather pattern. Our analysis of the results for the three cities suggested that setting the EC glazing to be colored in the range 200–300 W/m2 with respect to the total annual energy would be adequate.

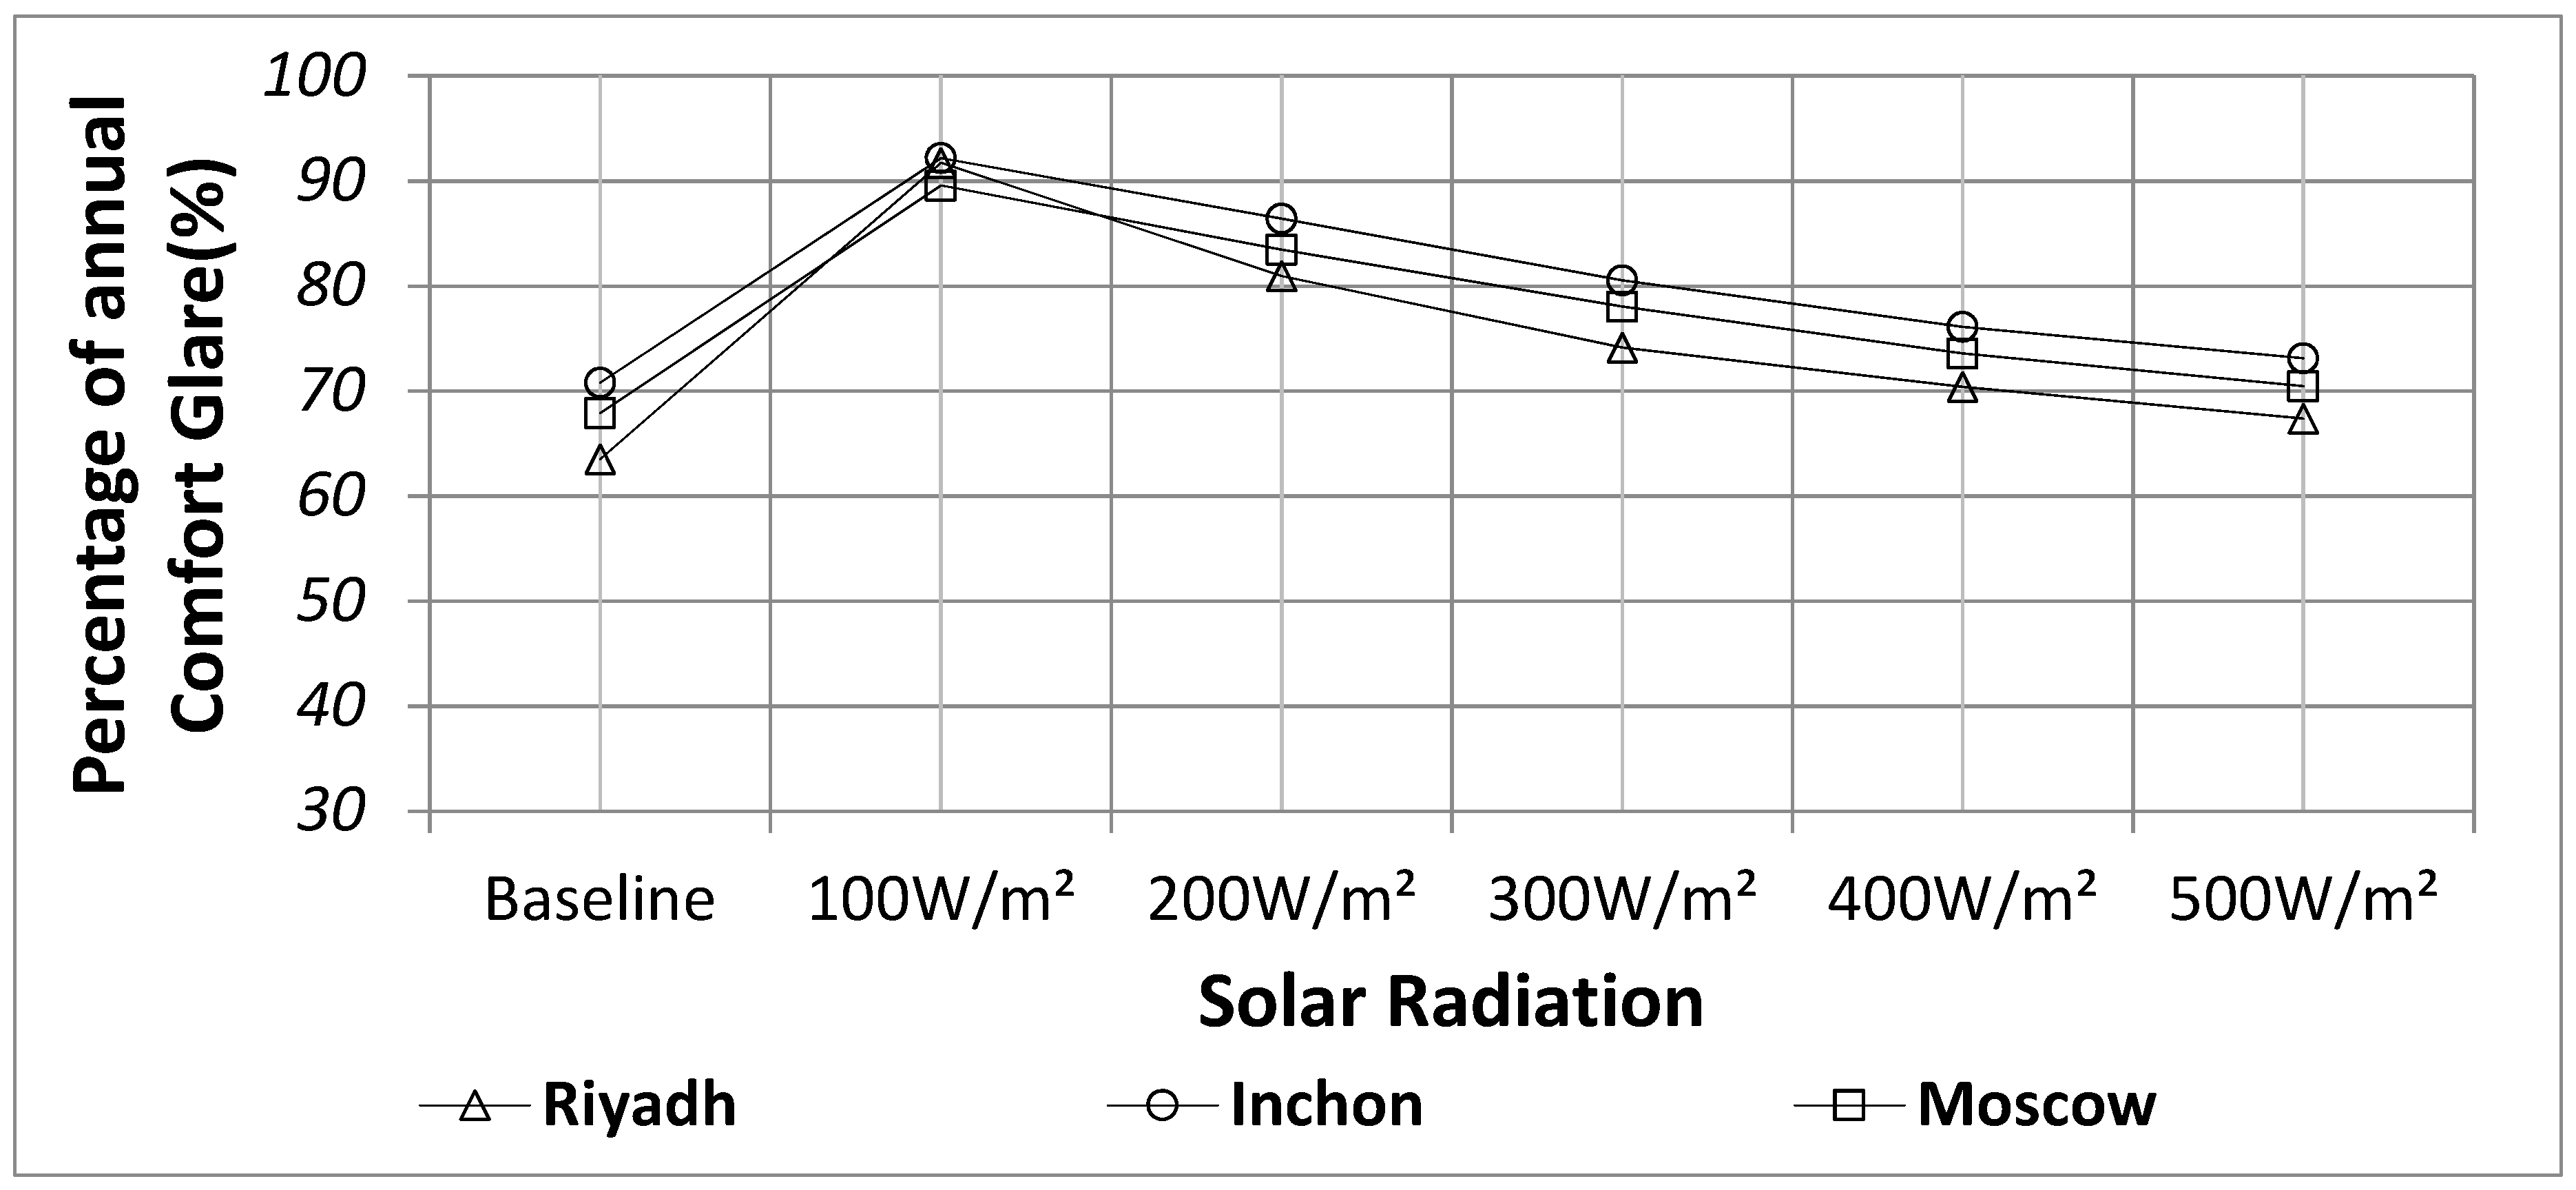
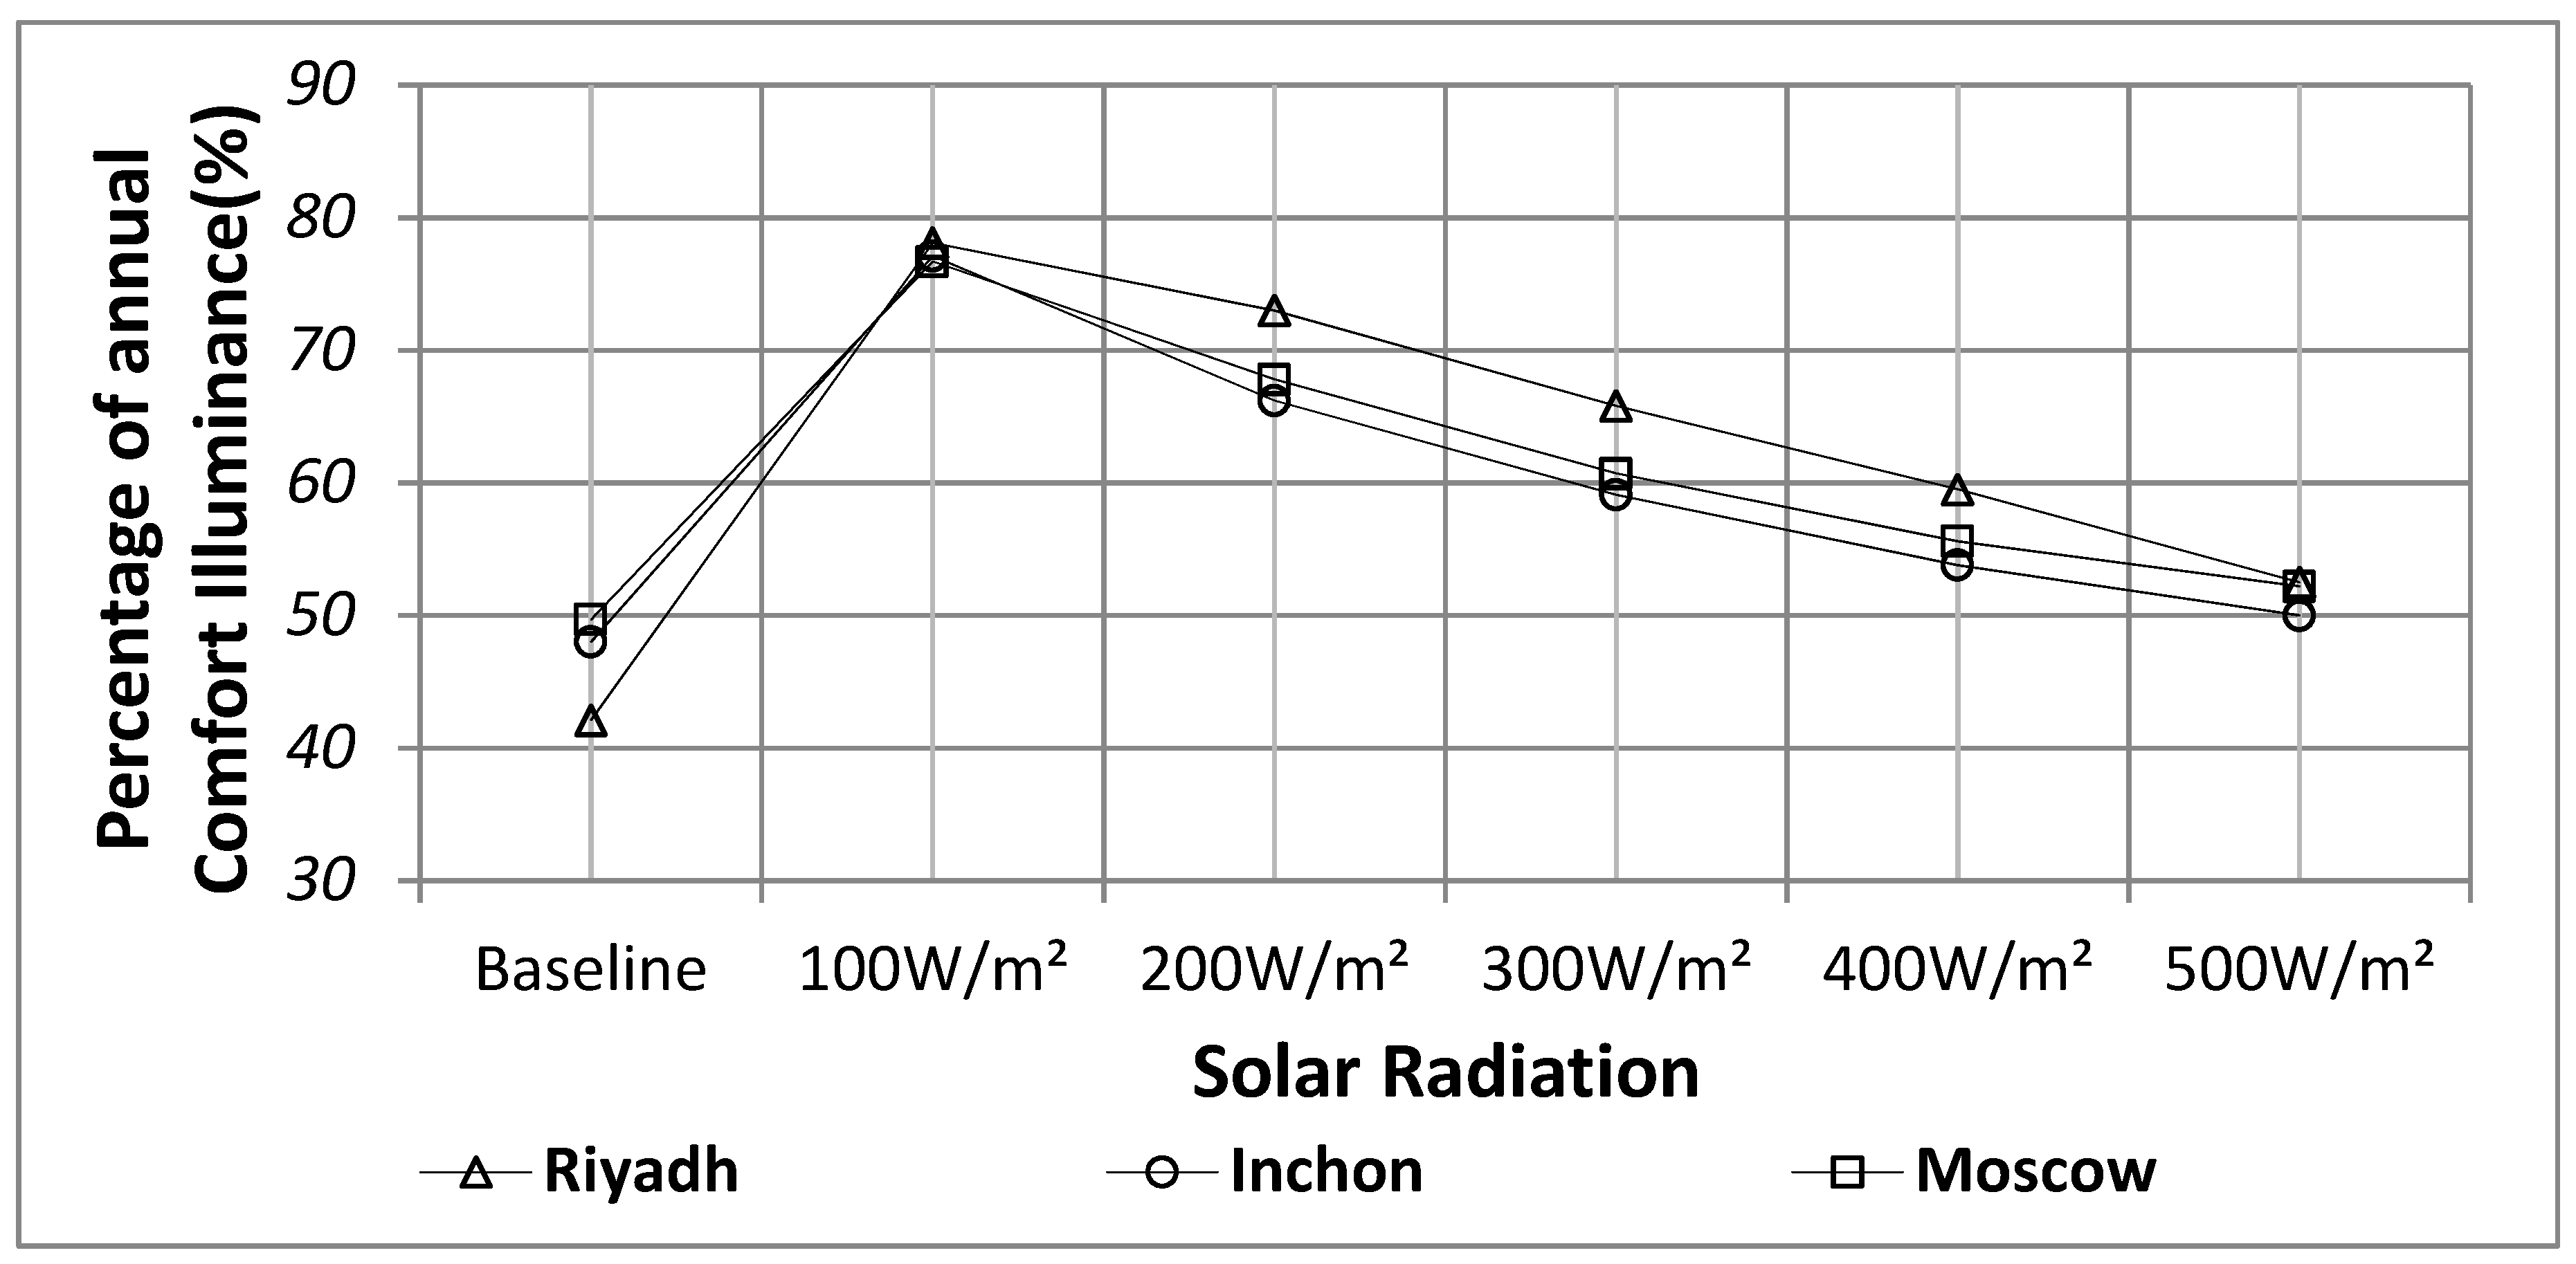
4.2. Analysis of Daylight Performance According to Solar Radiation Control

Apart from decreasing the cooling, heating, and lighting energies; the analysis of which is presented in Section 4.1, the smart glass for solar radiation control also needs to prevent glare and ensure an appropriate interior luminance from the users’ viewpoint. Therefore, the DGI related to glare and interior luminance was analyzed according to EC glazing control by performing an EnergyPlus 4.8 simulation.
DGI was proposed by Hopkinson. It is recommended that an office building has a DGI value of 22 or below [31]. DGI was investigated by analyzing the percentage of time during which the DGI value was 22 or below for the total annual time of 8760 h using the EnergyPlus 8.4 simulation tool. The appropriate luminance range of 150–1500 l x, as specified by KS (Korean Industrial Standard) A 3011 for office buildings, was adopted [32]. The percentage of time during which the appropriate interior luminance range of 150–1500 l x was satisfied for the total annual time of 8760 h was calculated. Analysis of the interior luminance excluded all forms of artificial lighting and only natural light was considered.
Table 8, Figure 11 and Figure 12 show the analysis results for DGI and interior luminance. The DGI results revealed that all the solar radiation control conditions provided excellent performance relative to the baseline. For Moscow, Inchon, and Riyadh 100 W/m2 was optimal. The higher the amount of solar radiation, the more disadvantageous the condition was with respect to DGI.
The results obtained for the interior luminance showed that, irrespective of the amount of solar radiation, EC glazing delivered excellent performance relative to the baseline. Similar to the result of DGI analysis, the optimal amount of solar radiation for Moscow, Inchon, and Riyadh was 100 W/m2.
The best performance was attained for both the DGI and interior luminance when setting the solar radiation to 100 W/m2. An examination of the 100 W/m2 with respect to the cooling, heating, and lighting energies discussed in Section 4.1, showed a smaller decrease in the energy for Moscow than under other conditions, an increase in the energy above the baseline for Inchon, and no improvement in the case of Riyadh. Accordingly, the cooling, heating, and lighting energies and the daylight performance need to be comprehensively evaluated.

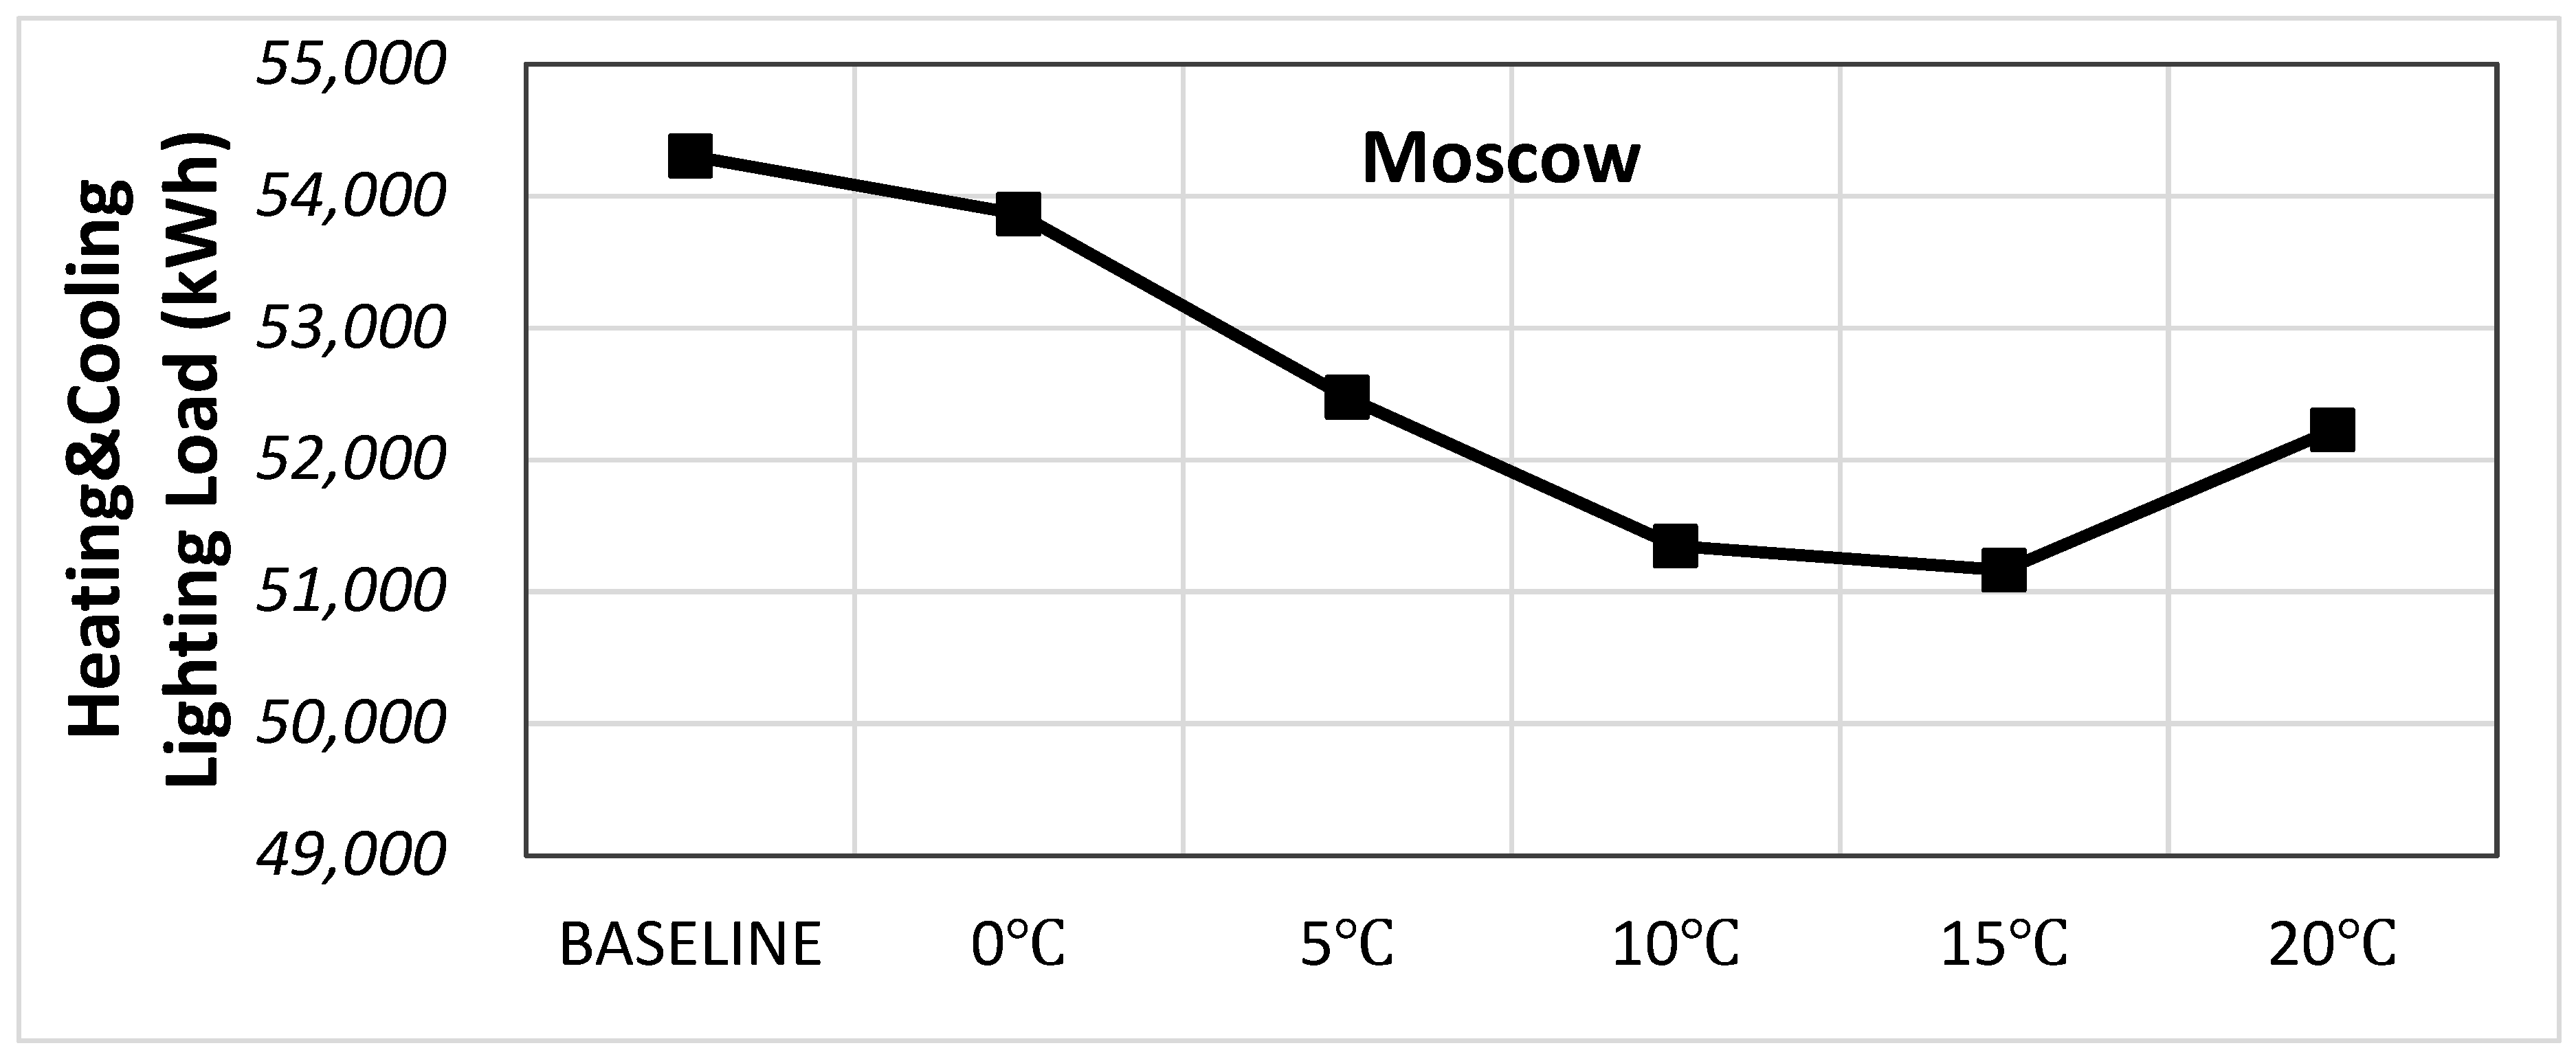
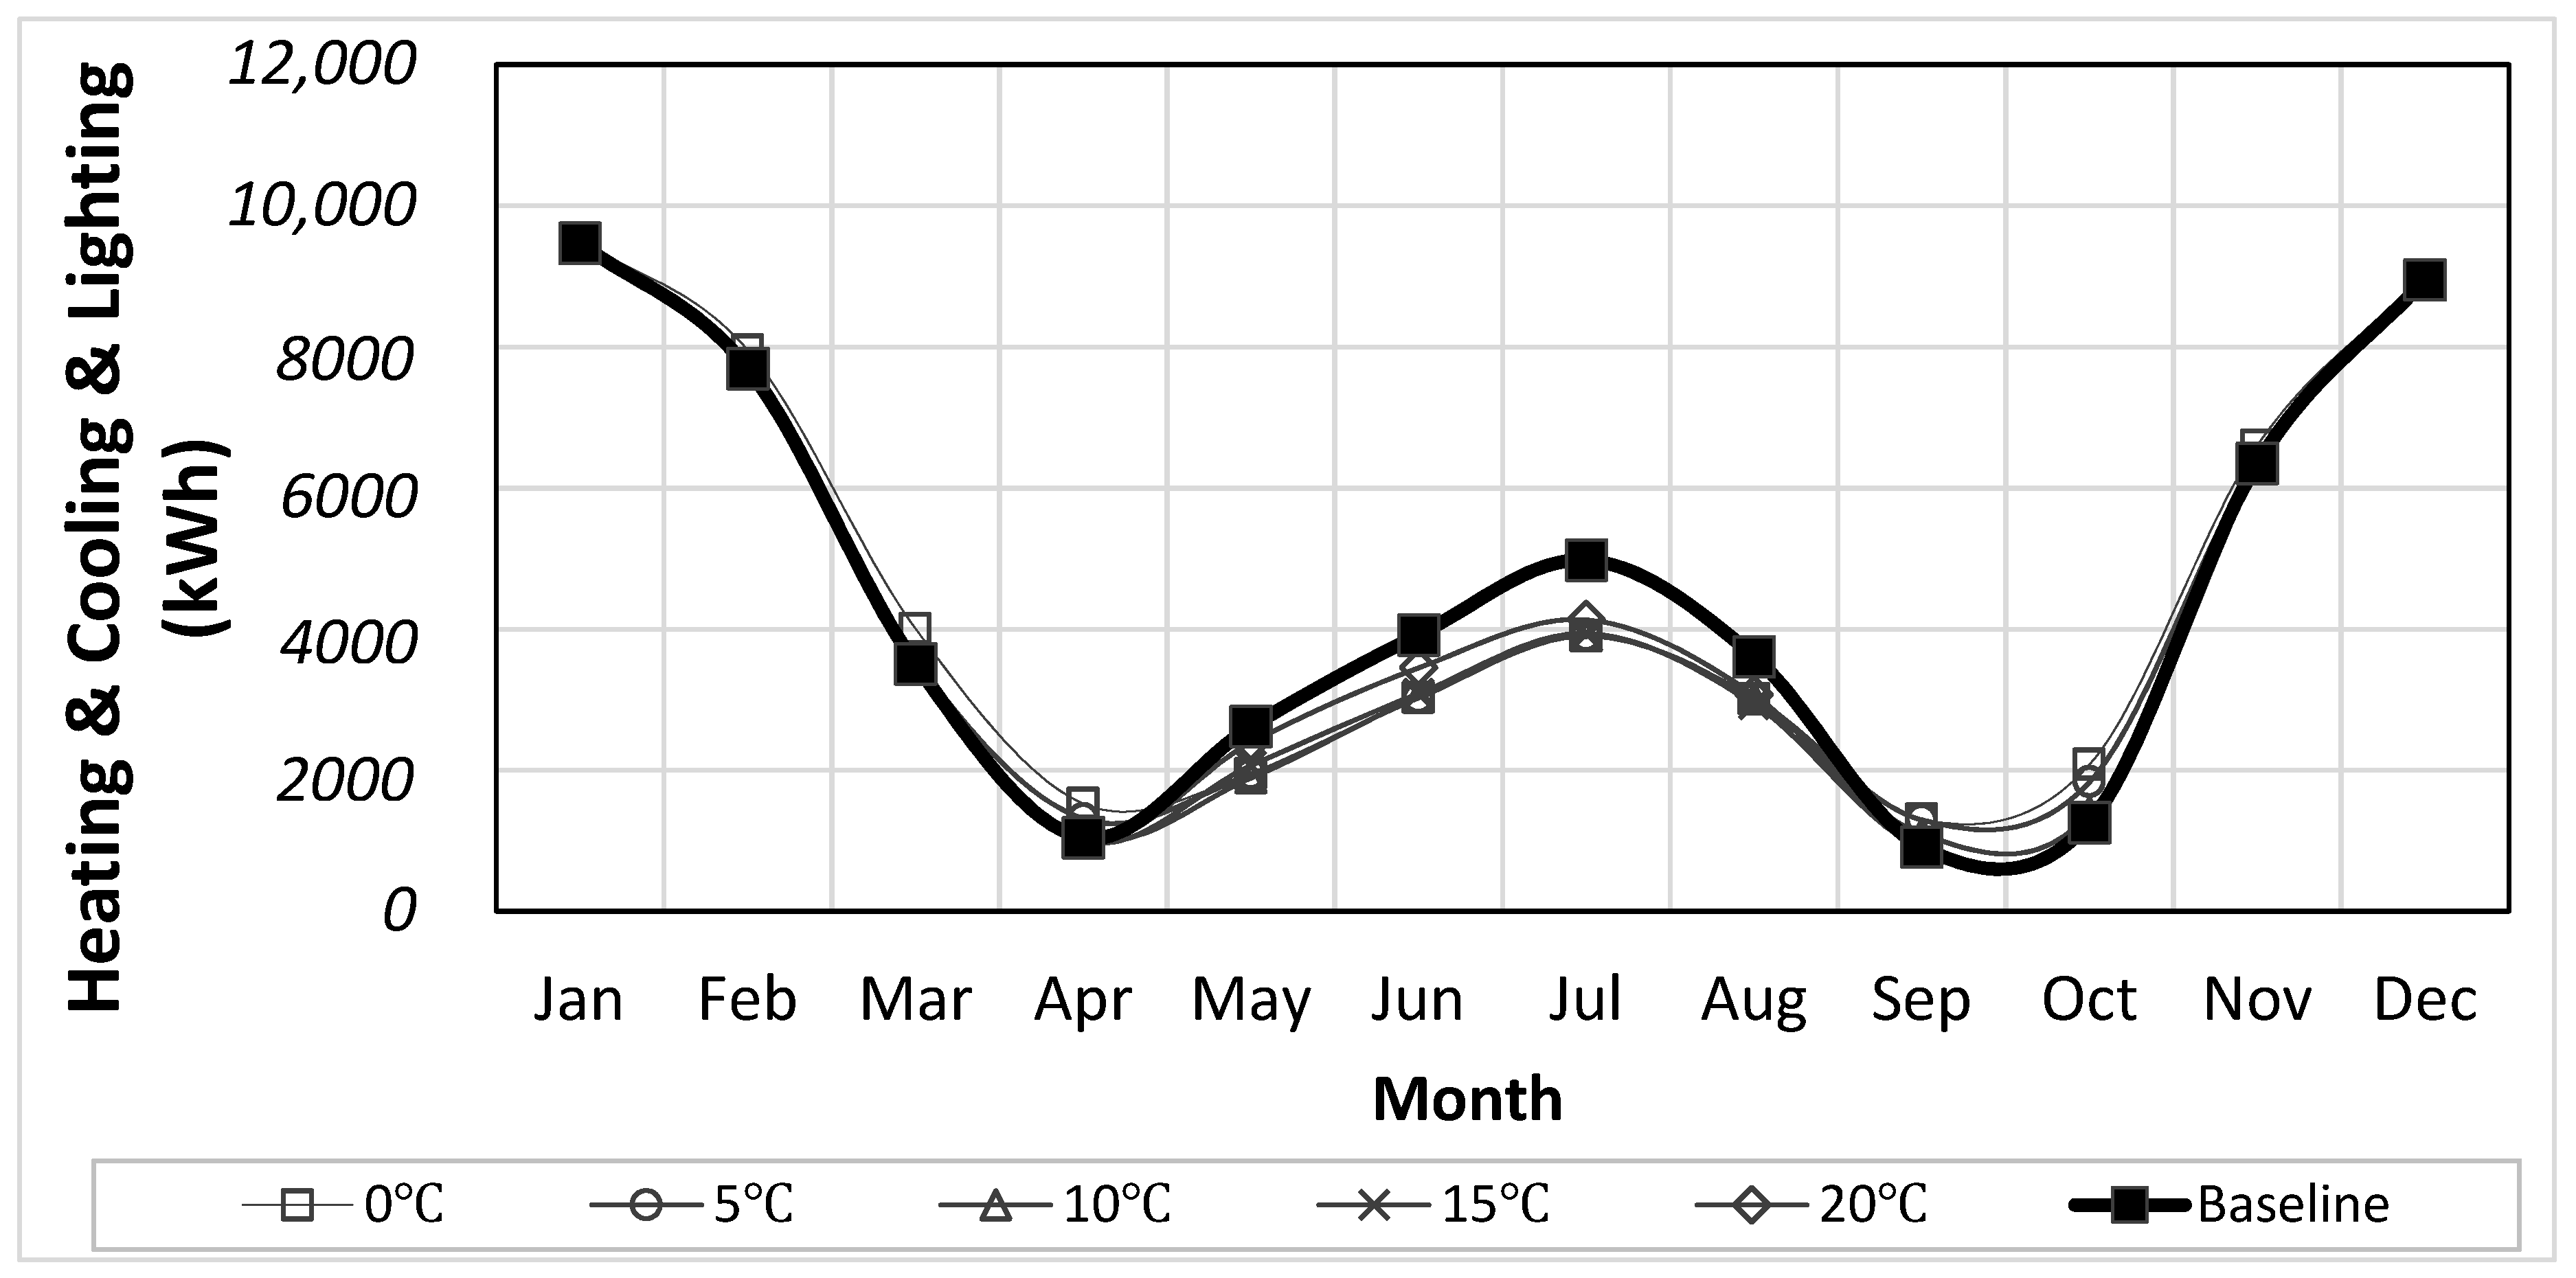
4.3. Analysis Results for Cooling, Heating and Lighting Energies According to Temperature Control

This section presents an analysis of the difference in the sum of the annual cooling, heating, and lighting energies for each climate zone, that is, Moscow, Inchon, and Riyadh. Similar to solar radiation, outdoor temperature is another representative factor that directly affects the energy building requirements. If the outdoor temperature increases, the interior cooling energy also increases. When EC glazing is colored to block solar radiation, and reduce the cooling energy, the building energy requirement is reduced. This is the goal of temperature control. However, outdoor temperature conditions under which EC glazing needs to be colored to prevent solar radiation from entering in each climate zone remain unclear. Accordingly, this study assumed five temperature conditions of 0 °C, 5 °C, 10 °C, 15 °C, and 20 °C and derived optimal control temperatures by using an exhaustive search method.
The analysis results are as follows. First, as shown in Table 9 and Figure 13 for Moscow, using the EC glazing for temperature control could reduce the annual energy under every condition relative to the baseline. Controlling the EC glazing at 0 °C resulted in the smallest decrease in the annual energy, whereas the largest decrease in the annual energy was obtained at 15 °C. Similar to solar radiation control, the total annual energy for Moscow was considerably affected by the difference in the cooling energy according to EC glazing control. Figure 14 shows the monthly energy for Moscow. Temperature control for EC glazing had a larger effect on the cooling energy, as in the case of the solar radiation control.
Second, the results of the analysis for Inchon, Korea, are provided in Table 10 and Figure 15. The annual energy increased above the baseline at 0 °C and 5 °C but decreased below the baseline at 15 °C and 20 °C. Among those temperature control conditions, the decrease in the annual energy was largest at 20 °C. On the other hand, the annual energy increased when the temperature was set to 0 °C and 5 °C. This is because the smallest amount of solar radiation was received at 0 °C and 5 °C, which increased both the heating and lighting energies. Accordingly, as shown in Figure 16, the monthly energy increased during winter. Similar energy patterns are displayed all year round both under the baseline condition and the other temperature conditions including 10 °C, 15 °C, and 20 °C. As the winter temperatures of Inchon remain below 10 °C, EC glazing always maintains the transparent state, thereby producing a similar energy to baseline. During summer, solar radiation is prevented from entering and the cooling energy is reduced, but the impact of the increase in the lighting energy is greater, which offsets the decrease in the cooling energy.
Third, the analysis results for Riyadh, Saudi Arabia, are presented in Table 11 and Figure 17. The total annual energy was lower than the baseline under every temperature condition for EC glazing. The decrease in the energy was the largest at 0 °C. Figure 18 illustrates that, unlike Moscow and Inchon, the total annual energy for Riyadh decreased. This was due to the weather patterns of Riyadh, which emphasized the need for cooling operations and thus the cooling energy was reduced by preventing solar radiation from entering, which could lower the total annual energy.
The above-mentioned results regarding temperature control for EC glazing were examined more comprehensively. This examination showed that Moscow, Inchon, and Riyadh had the smallest energy at 15 °C, 20 °C, and 0 °C, respectively. In particular, Riyadh achieved a decrease of 18.8% in the annual energy at 0 °C, which was the best performance. Annual energy for Inchon decreased by 1.2% at 20 °C, whereas for Moscow the energy decreased by 5.8% at 15 °C. Using the solar radiation condition for which the best performance was obtained in Section 4.1, the percentage by which the annual energy decreased was 23.4% for Moscow, 4.0% for Inchon, and 5.8% for Riyadh. Thus, solar radiation control for EC glazing was more effective than temperature control for reducing the cooling, heating, and lighting energies in all the target cities except Riyadh.

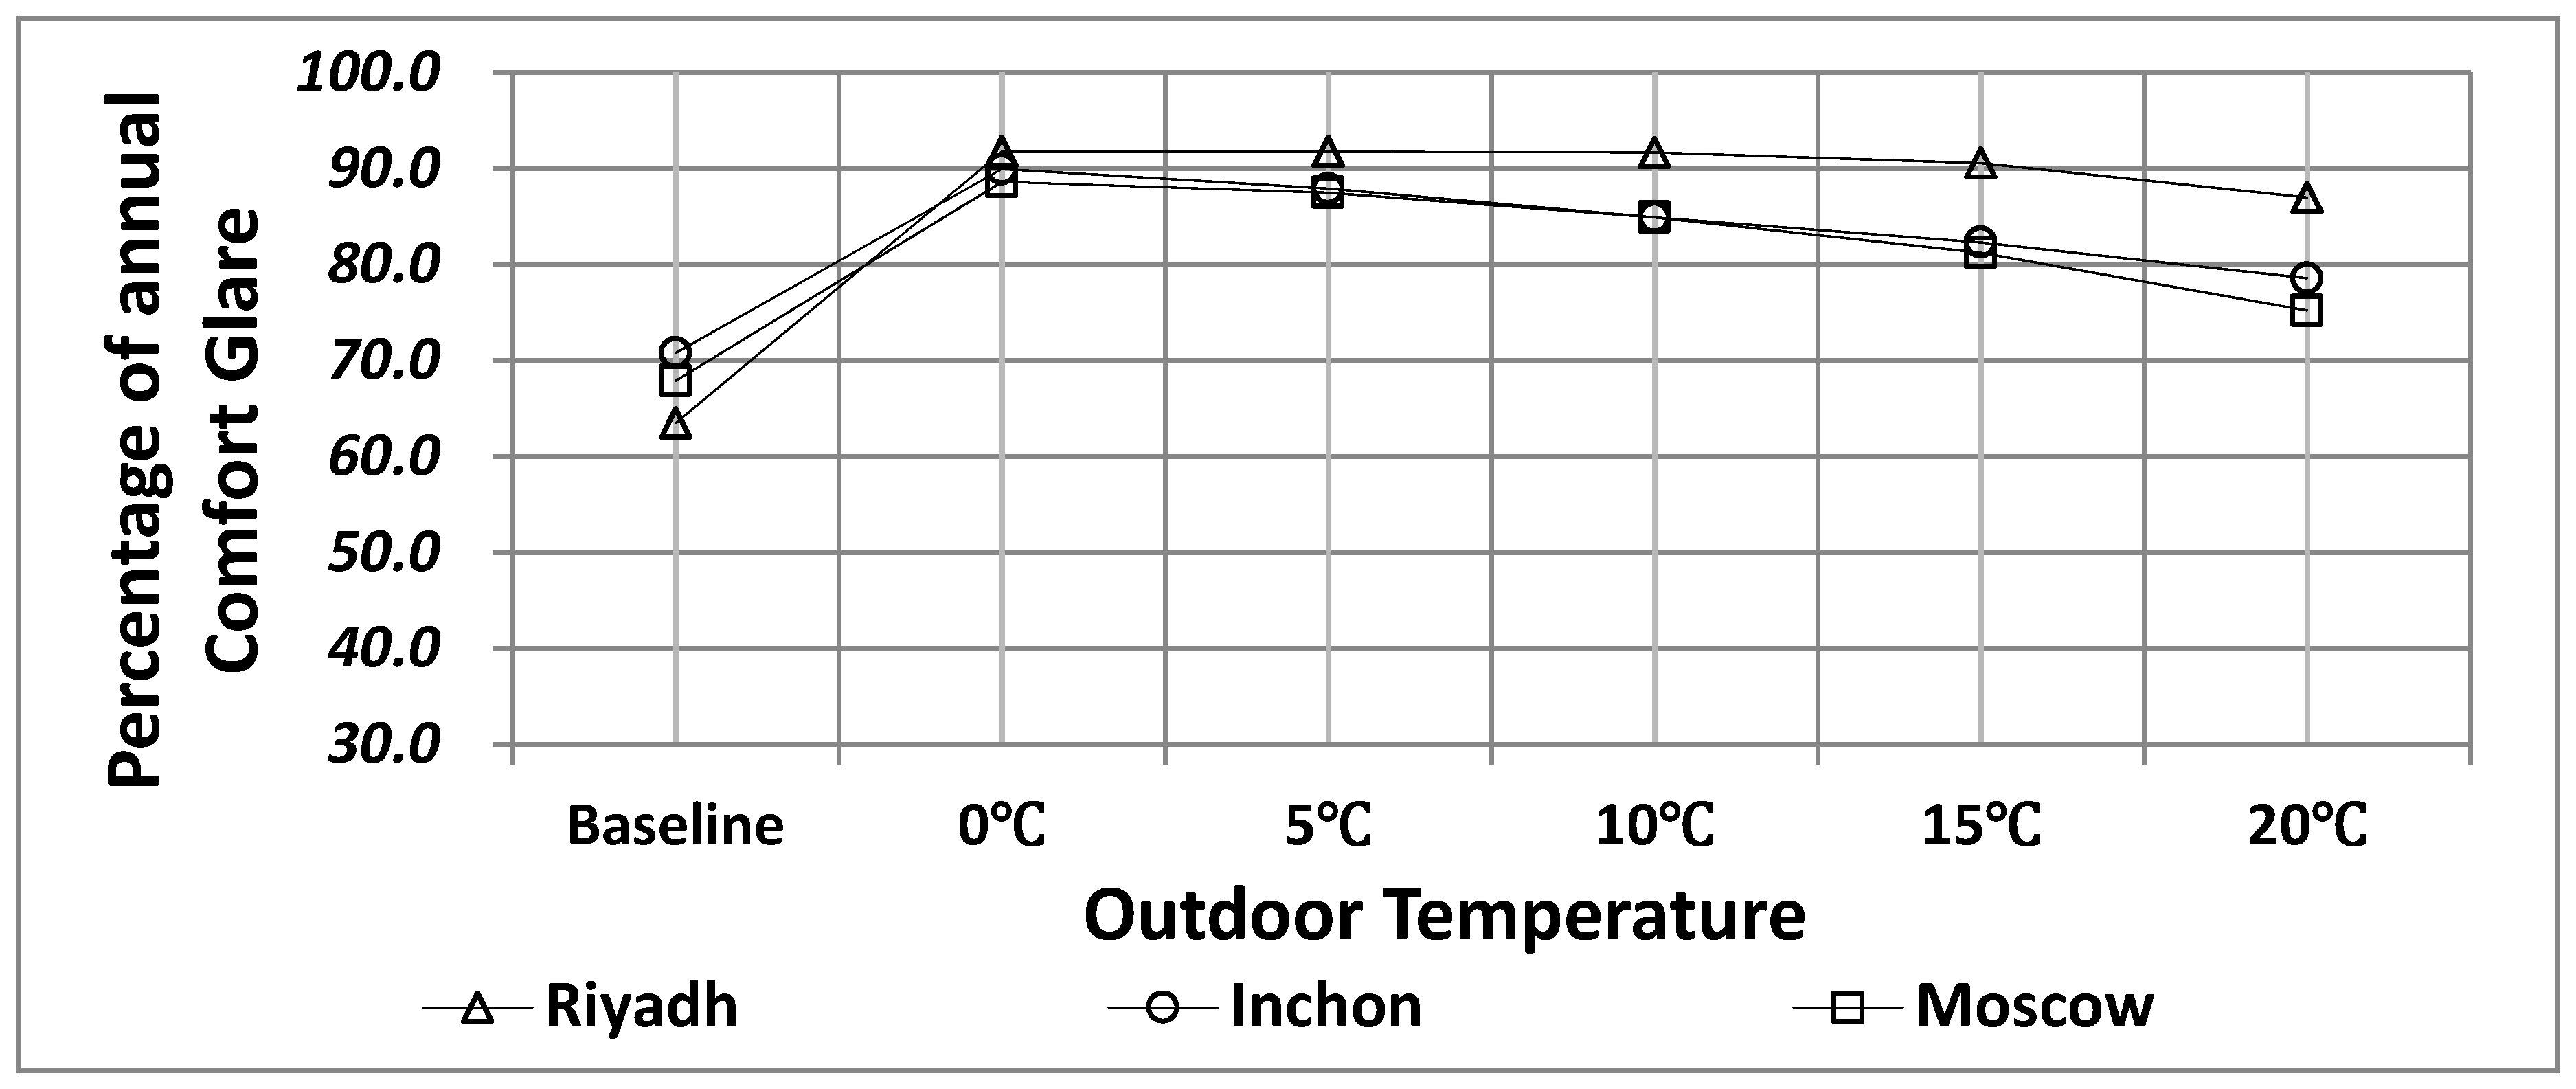
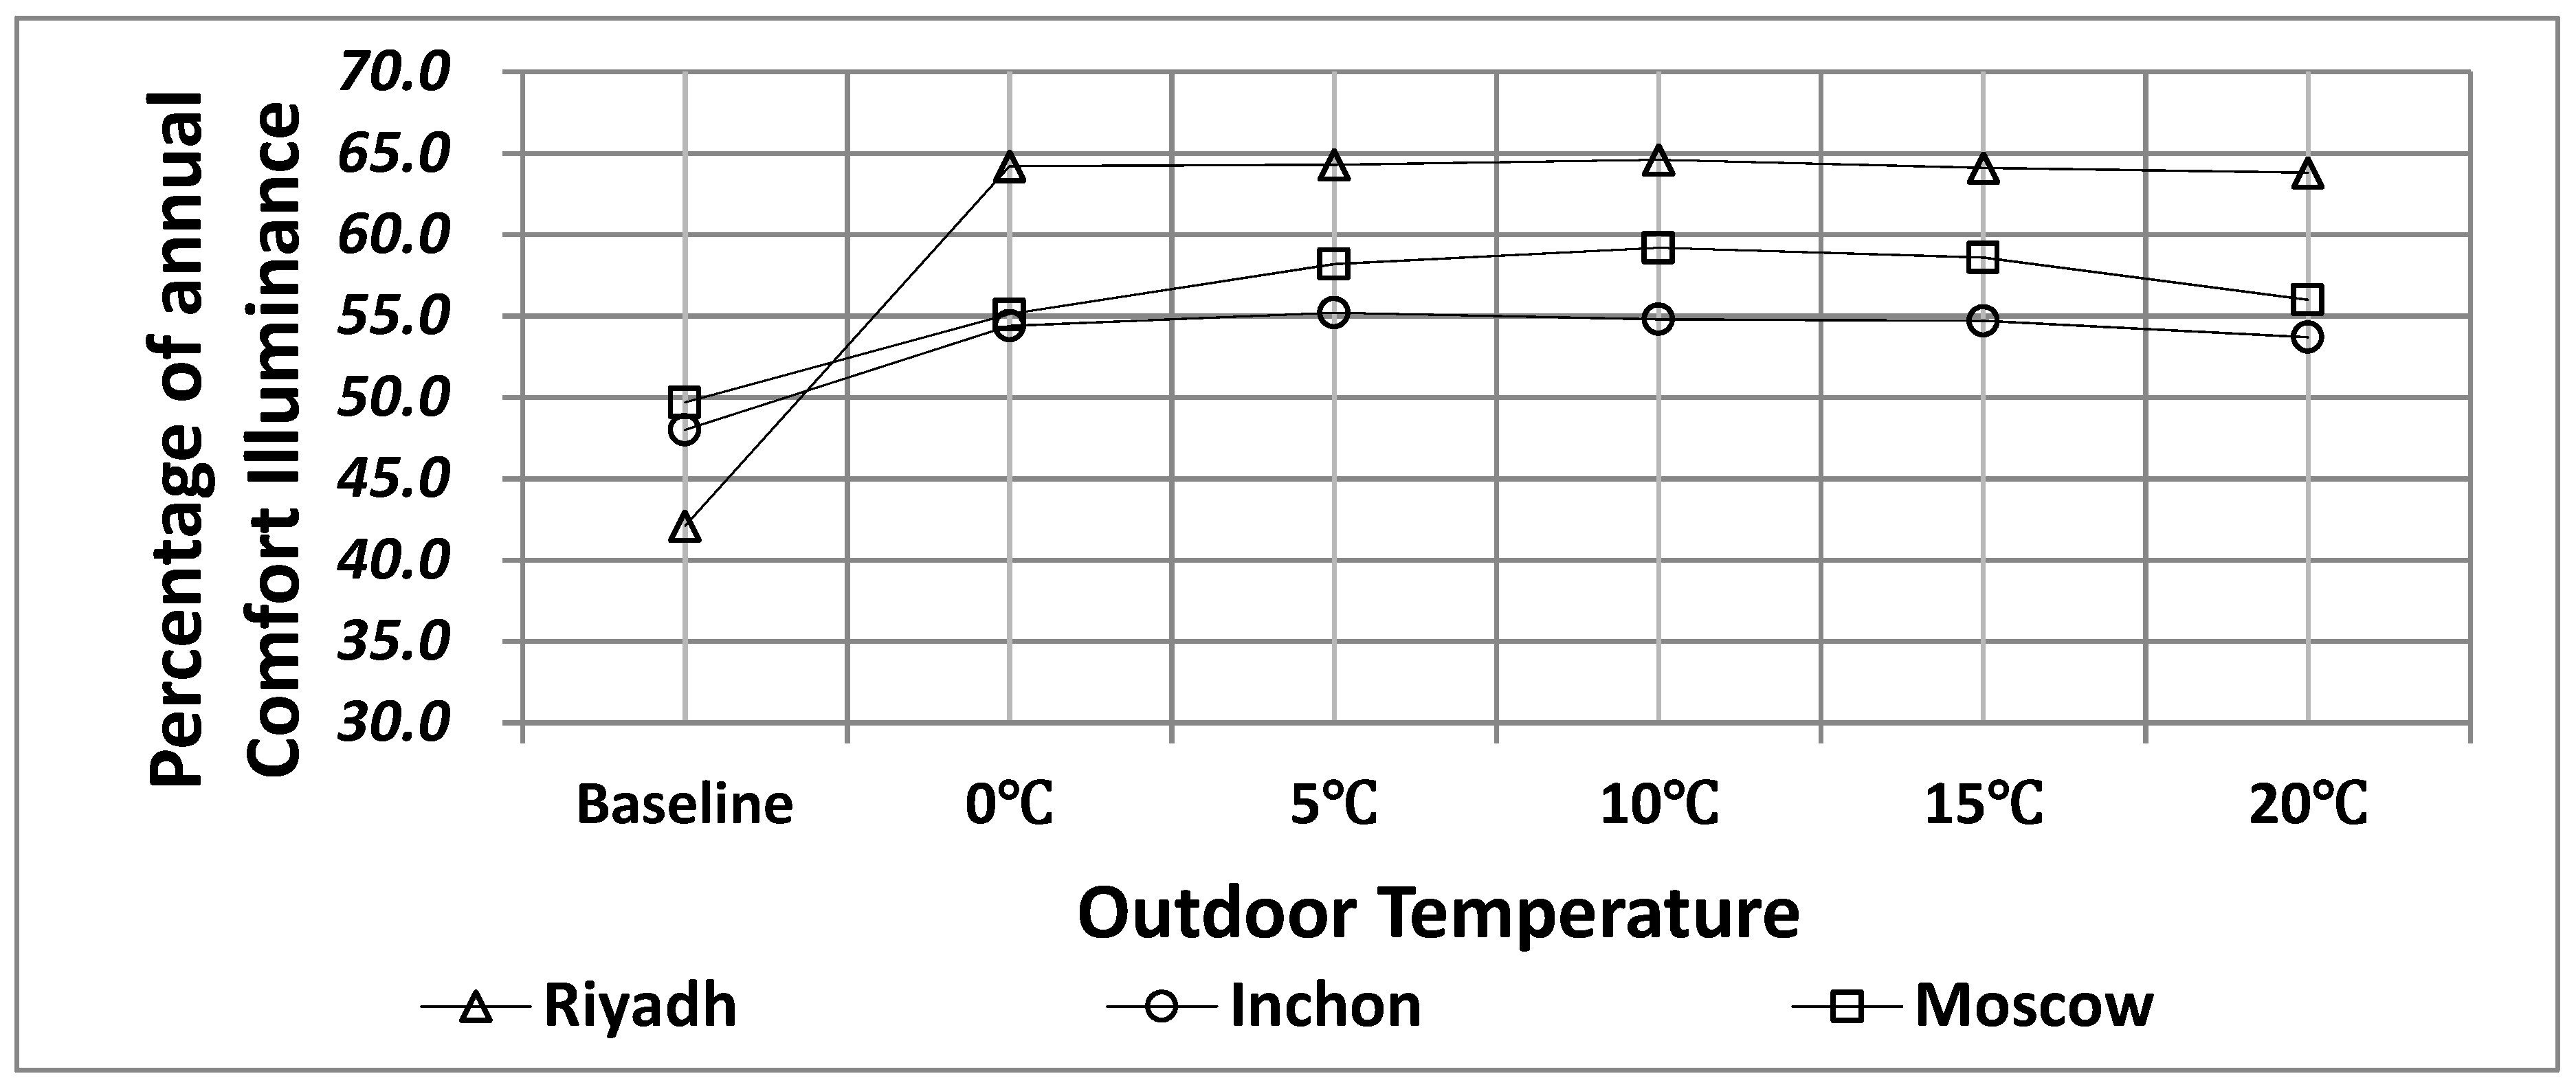
4.4. Analysis Results for Daylight Performance According to Temperature Control

Table 12, Figure 19 and Figure 20 provide the analysis results of the DGI and interior illuminance. The DGI result shows that all the temperature conditions for EC glazing outperformed the baseline. The best performance was obtained when EC glazing was controlled at 0 °C in Moscow, Inchon, and Riyadh. The higher the temperature, the more disadvantageous the condition was with respect to DGI. However, the result obtained for interior illuminance deviated from that of DGI. The performance with respect to interior illuminance was optimal at 10 °C, 5 °C, and 10 °C, for Moscow, Inchon, and Riyadh, respectively.
Analysis of the cooling, heating, and lighting energies, presented in Section 4.3, revealed that the performance for Moscow, Inchon, and Riyadh was optimal at 15 °C, 20 °C, and 0 °C, respectively. However, with respect to DGI, all three cities performed the best at 0 °C. In addition, with respect to interior luminance, Moscow, Inchon, and Riyadh displayed the best performance at 10 °C, 5 °C, and 10 °C, respectively.
As in the case of solar radiation control, comprehensive evaluation and analysis were necessary to derive an optimal control condition with respect to both the energy and lighting environments. Accordingly, in Section 4.5, EDPI was utilized to comprehensively analyze the total annual cooling, heating, and lighting energies, DGI, and interior luminance.

4.5. Derivation of Optimal Control Conditions by Comprehensively Considering Energy and Daylight Environment

Daylight performance was analyzed with respect to the cooling, heating, and lighting energies, DGI, and interior illuminance in Section 4.1, Section 4.2, Section 4.3 and Section 4.4. The results clarified the advantages and disadvantages in terms of the control conditions of EC glazing for each climate zone. However, the optimal characteristics identified thus far were varied and this prevented an optimal control method for each climate zone to be determined. Accordingly, a method for comprehensive evaluation is required. In this section, the EDPI (Integrated Energy and Daylight Performance Index), which was developed in a previous study, was used to comprehensively evaluate the performance with respect to energy and the daylight environment [19]. As shown in Equation (5), EDPI evaluates performance by obtaining percentiles from the comparison of the actual maximum and minimum values for each component of the sum of the annual cooling, heating and lighting energies, the percentage of annual DGI values below 22, and the percentage of annual interior comfort luminance.
For example, in the case of Moscow, if the percentage of the annual DGI values below 22 under the different temperature conditions was calculated by using E P D I i j , the value of component i indicated the percentage of DGI values below 22 under the different temperature and solar radiation conditions, and condition j represented every temperature and solar radiation condition. Considering the percentage of annual DGI values below 22 in Table 12, when the score for the control condition of 5 °C in Moscow was calculated, the A c t u a l   X i j   v a l u e was 87.5%, M i n n i m u m   X i j   v a l u e was 67.9%, and M a x i m u m   X i j   v a l u e was 89.6% (actual values when the solar radiation is 100 W/m2). Substituting these values into Equation (5) yielded a result of 90.4. Based on Table 13, the percentage E P D I i j of annual DGI values below 22 for the optimal temperature condition in Moscow was 90.4.
Accordingly, the E P D I i j of the sum of the annual cooling, heating, and lighting energies, the percentage of annual DGI values below 22, and that of annual comfort luminance were derived for each control condition for EC glazing in each climate zone. Then, an integrated performance evaluation became possible by calculating the mean value of data thus derived.
E D P I i j = A c t u a l   X i j   v a l u e M i n i m u m   X i j   v a l u e M a x i m u m   X i j   v a l u e M i n m u m   X i j   v a l u e × 100
The results of the EDPI analysis were as follows. First, in the case of Moscow, solar radiation of 200 W/m2 proved to be the best condition. Based on the EDPI, among the ten conditions, this condition ranked second in terms of decreasing the annual energy. With regard to the daylight environment, the condition of 200 W/m2 was ranked fourth in preventing discomfort glare and second in the percentage of annual comfort luminance. Although the condition of 200 W/m2 did not record the best score in terms of the energy and daylight environment, it proved to be the best condition by comprehensively considering complex factors and combining high scores.
In the case of Inchon, similar to Moscow, the solar radiation of 200 W/m2 was the best condition. Based on the EDPI, solar radiation of 200 W/m2 was ranked second in all the following categories: The cooling, heating, and lighting energies, the percentage of annual DGI values below 22, and the percentage of annual comfort luminance. The condition of 100 W/m2 produced the best result, that is, 100 points regarding the daylight environment but was ranked ninth regarding the annual energy among the ten conditions. The condition of 300 W/m2 was ranked first regarding the annual energy but had a low ranking with respect to the daylight environment. Accordingly, by considering the complex factors comprehensively and combining the high scores, solar radiation of 200 W/m2 was determined to ensure the best performance in Inchon.
Finally, in the case of Riyadh, unlike Moscow and Inchon, solar radiation of 100 W/m2 proved to be optimal. This solar radiation condition ranked fourth among the ten conditions in terms of decreasing annual energy. With respect to the daylight environment, solar radiation of 100 W/m2 ranked first, both in respect to the percentage of annual DGI values below 22 and the percentage of annual comfort luminance. The second best solar radiation, 200 W/m2, ranked first regarding annual energy. With respect to the daylight environment, solar radiation of 200 W/m2 ranked fifth in the percentage of annual DGI values below 22, and second in the percentage of annual comfort luminance. Although solar radiation 200 W/m2 yielded good results, the comprehensive evaluation showed that solar radiation of 100 W/m2 scored 95.4 points, whereas for 200 W/m2 the score was 82.5 points. This indicates that solar radiation of 100 W/m2 is the optimal control condition for Riyadh.
In summary, solar radiation of 200 W/m2 was optimal for Moscow and Inchon, whereas 100 W/m2 provided the best results for Riyadh.
As for the top 30% of conditions in each climate zone, solar radiation of 200 W/m2 (EDPI 79.2) was the best for Moscow, followed by 100 W/m2 (EDPI 71.9) and temperature of 10 °C (EDPI 69.3). For Inchon, solar radiation of 200 W/m2 (EDPI 78.4) was the best condition, followed by 100 W/m2 (EDPI 74.1) and 300 W/m2 (EDPI 61.2). For Riyadh, solar radiation of 100 W/m2 (EDPI 95.4) was the best condition, followed by 200 W/m2 (EDPI 82.5) and temperature of 5 °C (EDPI 80.6). In each climate zones we analyzed, the solar radiation on a vertical surface was a more effective variable in controlling EC glazing than the outdoor temperature.

5. Conclusions

In this study, Moscow in Russia, Inchon in Korea, and Riyadh in Saudi Arabia were selected as representative cities for each of three climate zones. Ten conditions for controlling EC glazing were set according to the outdoor temperature and amount of solar radiation. The optimal control condition was derived for each climate zone with respect to the cooling, heating, and lighting energies and daylight performance. The results of the analysis can be summarized as follows.
(1)
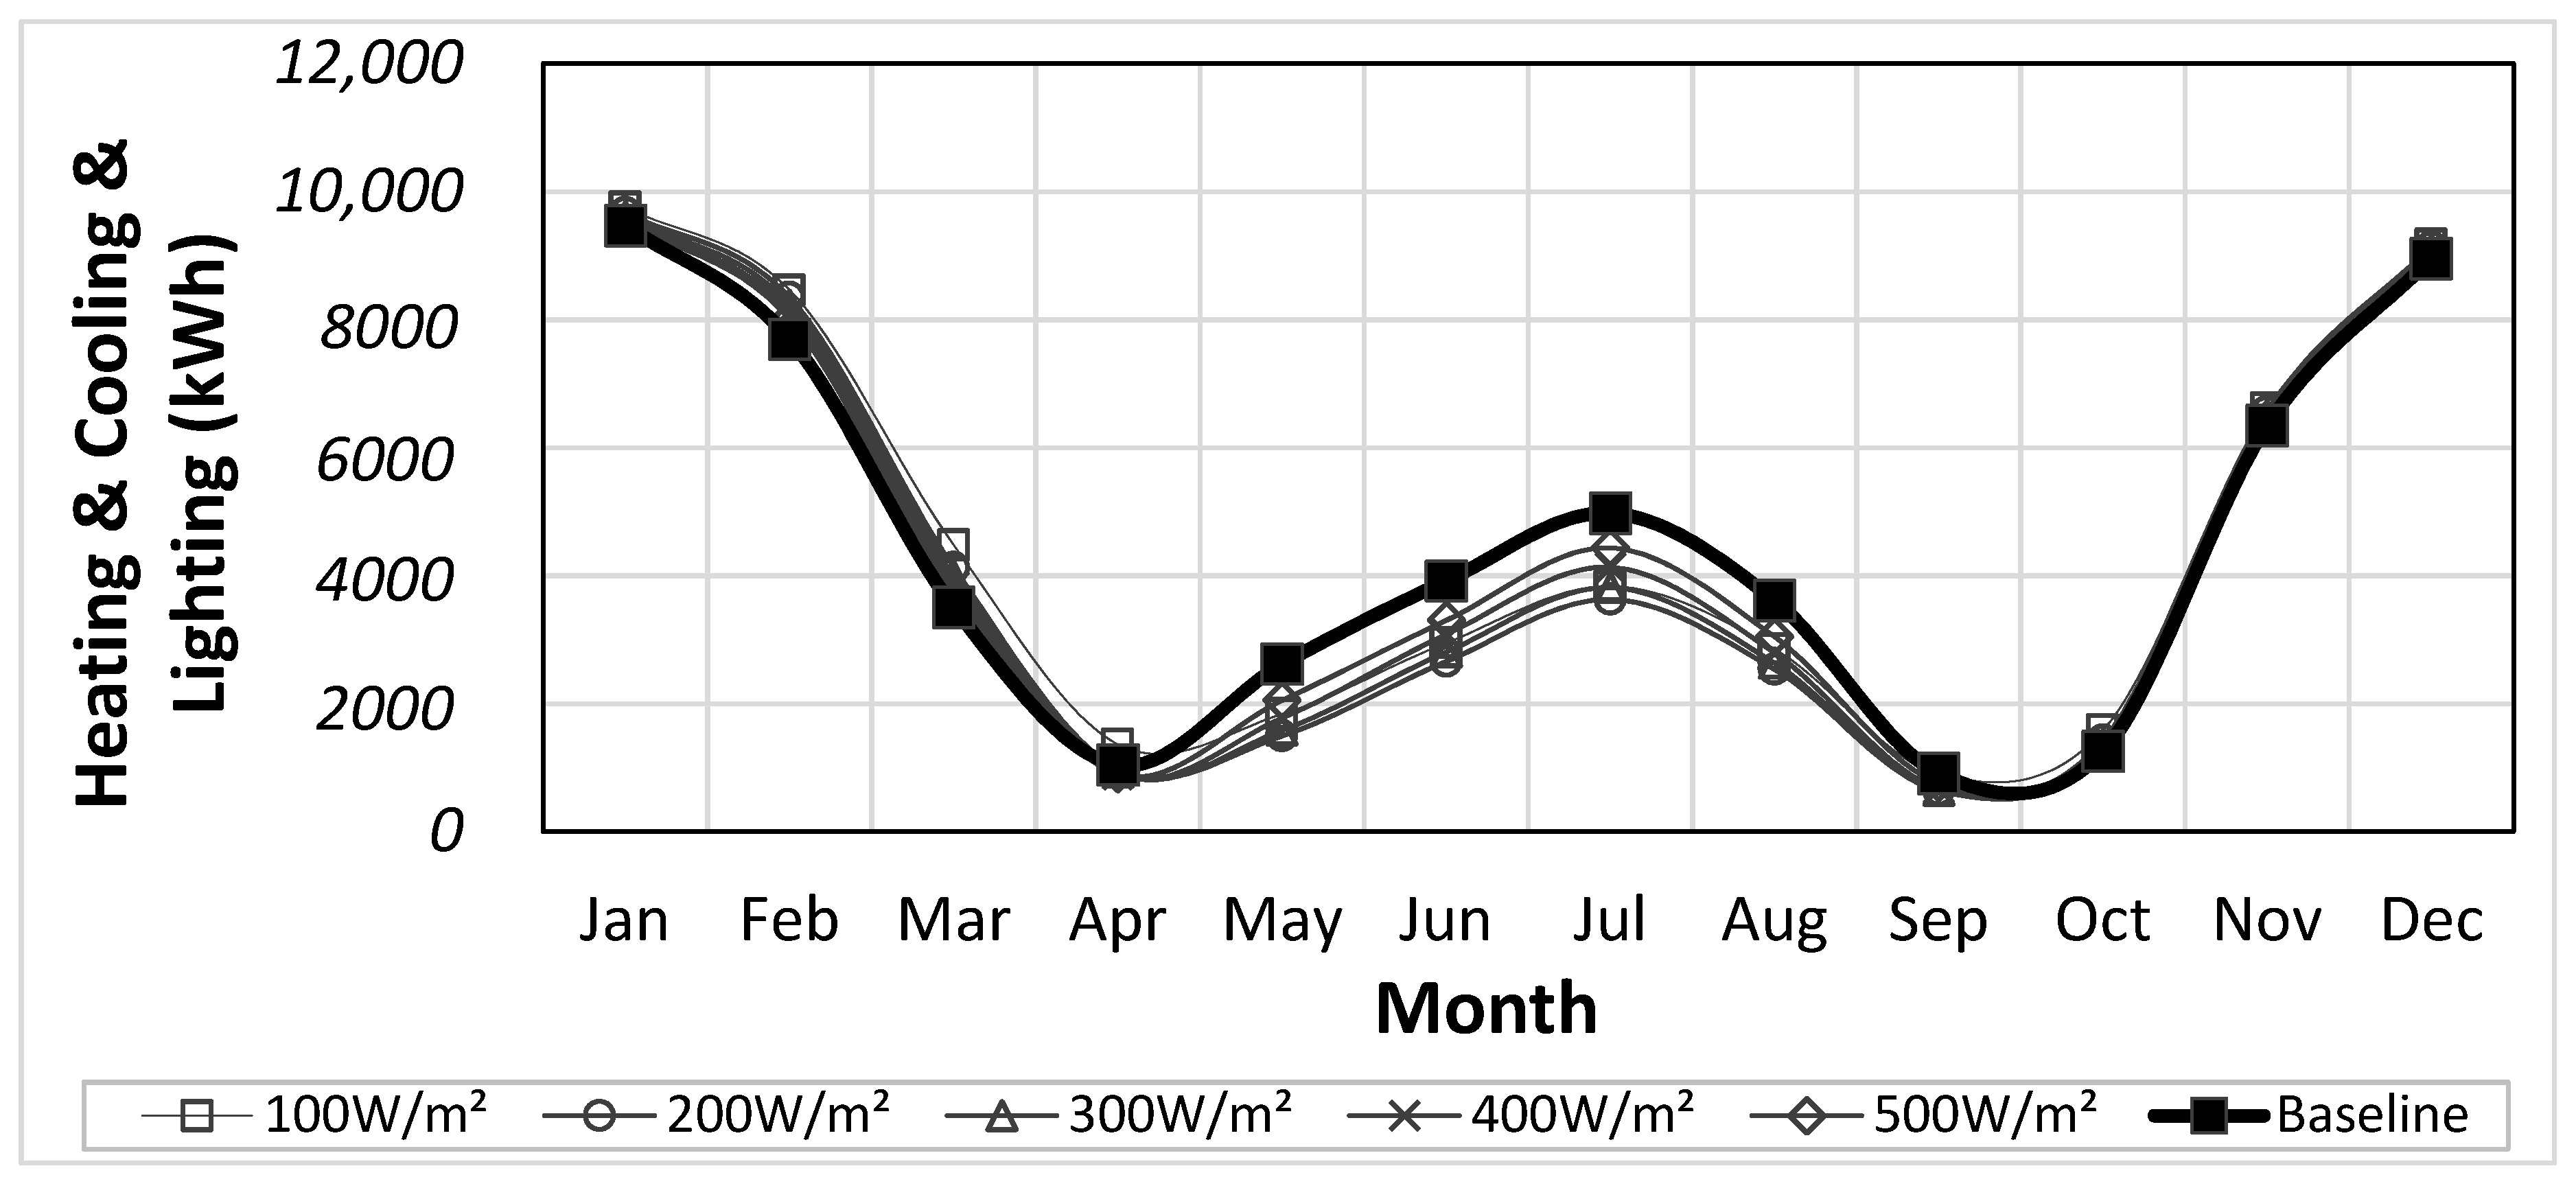
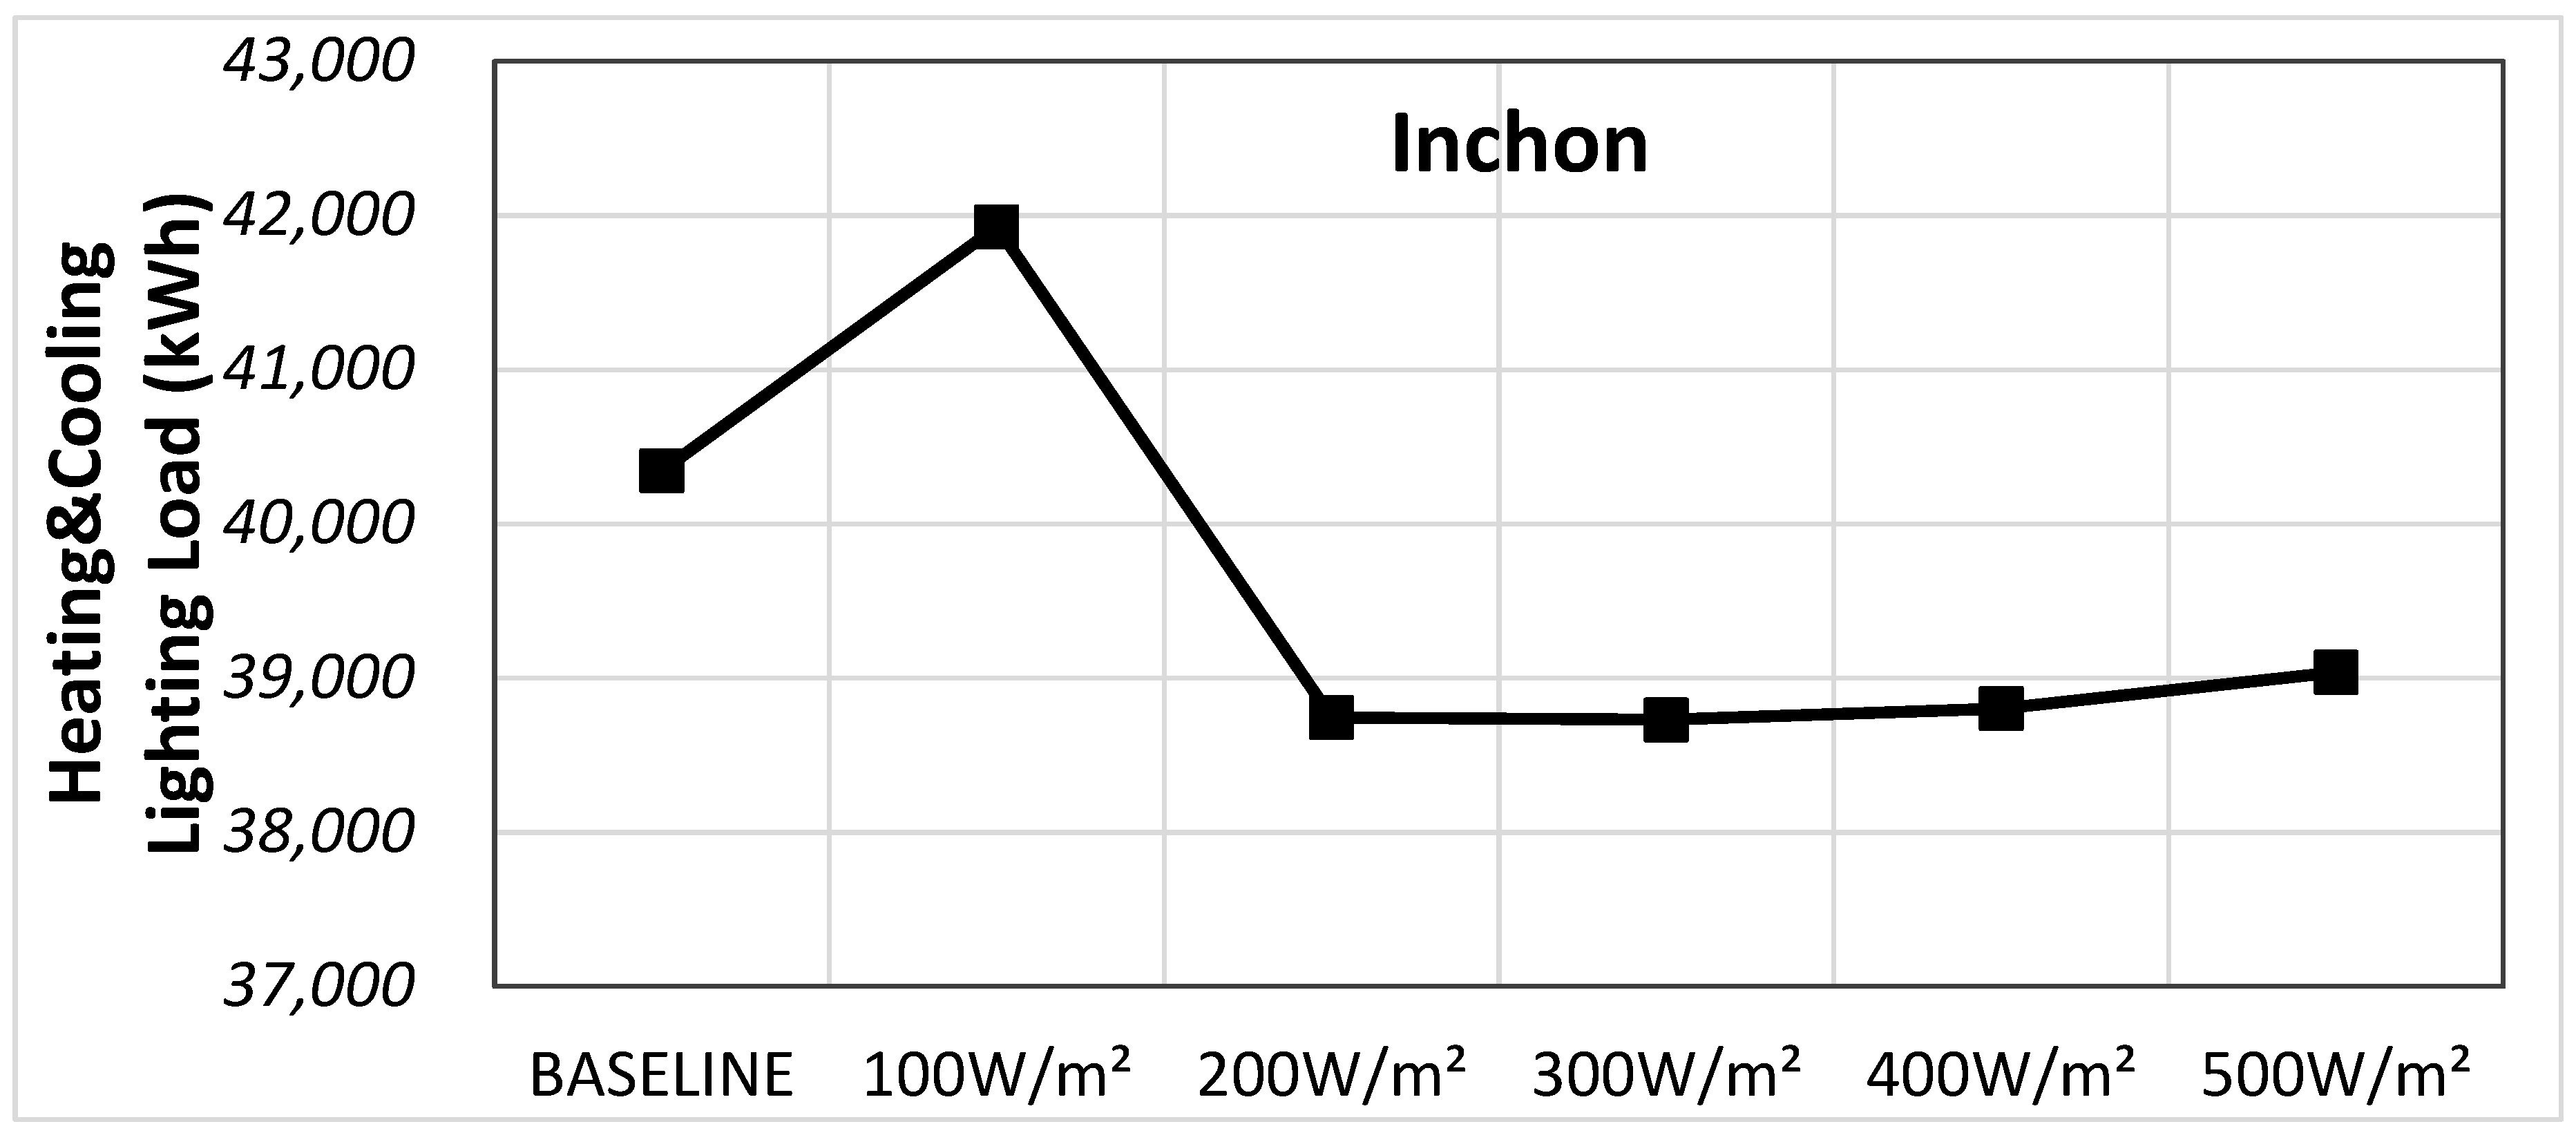
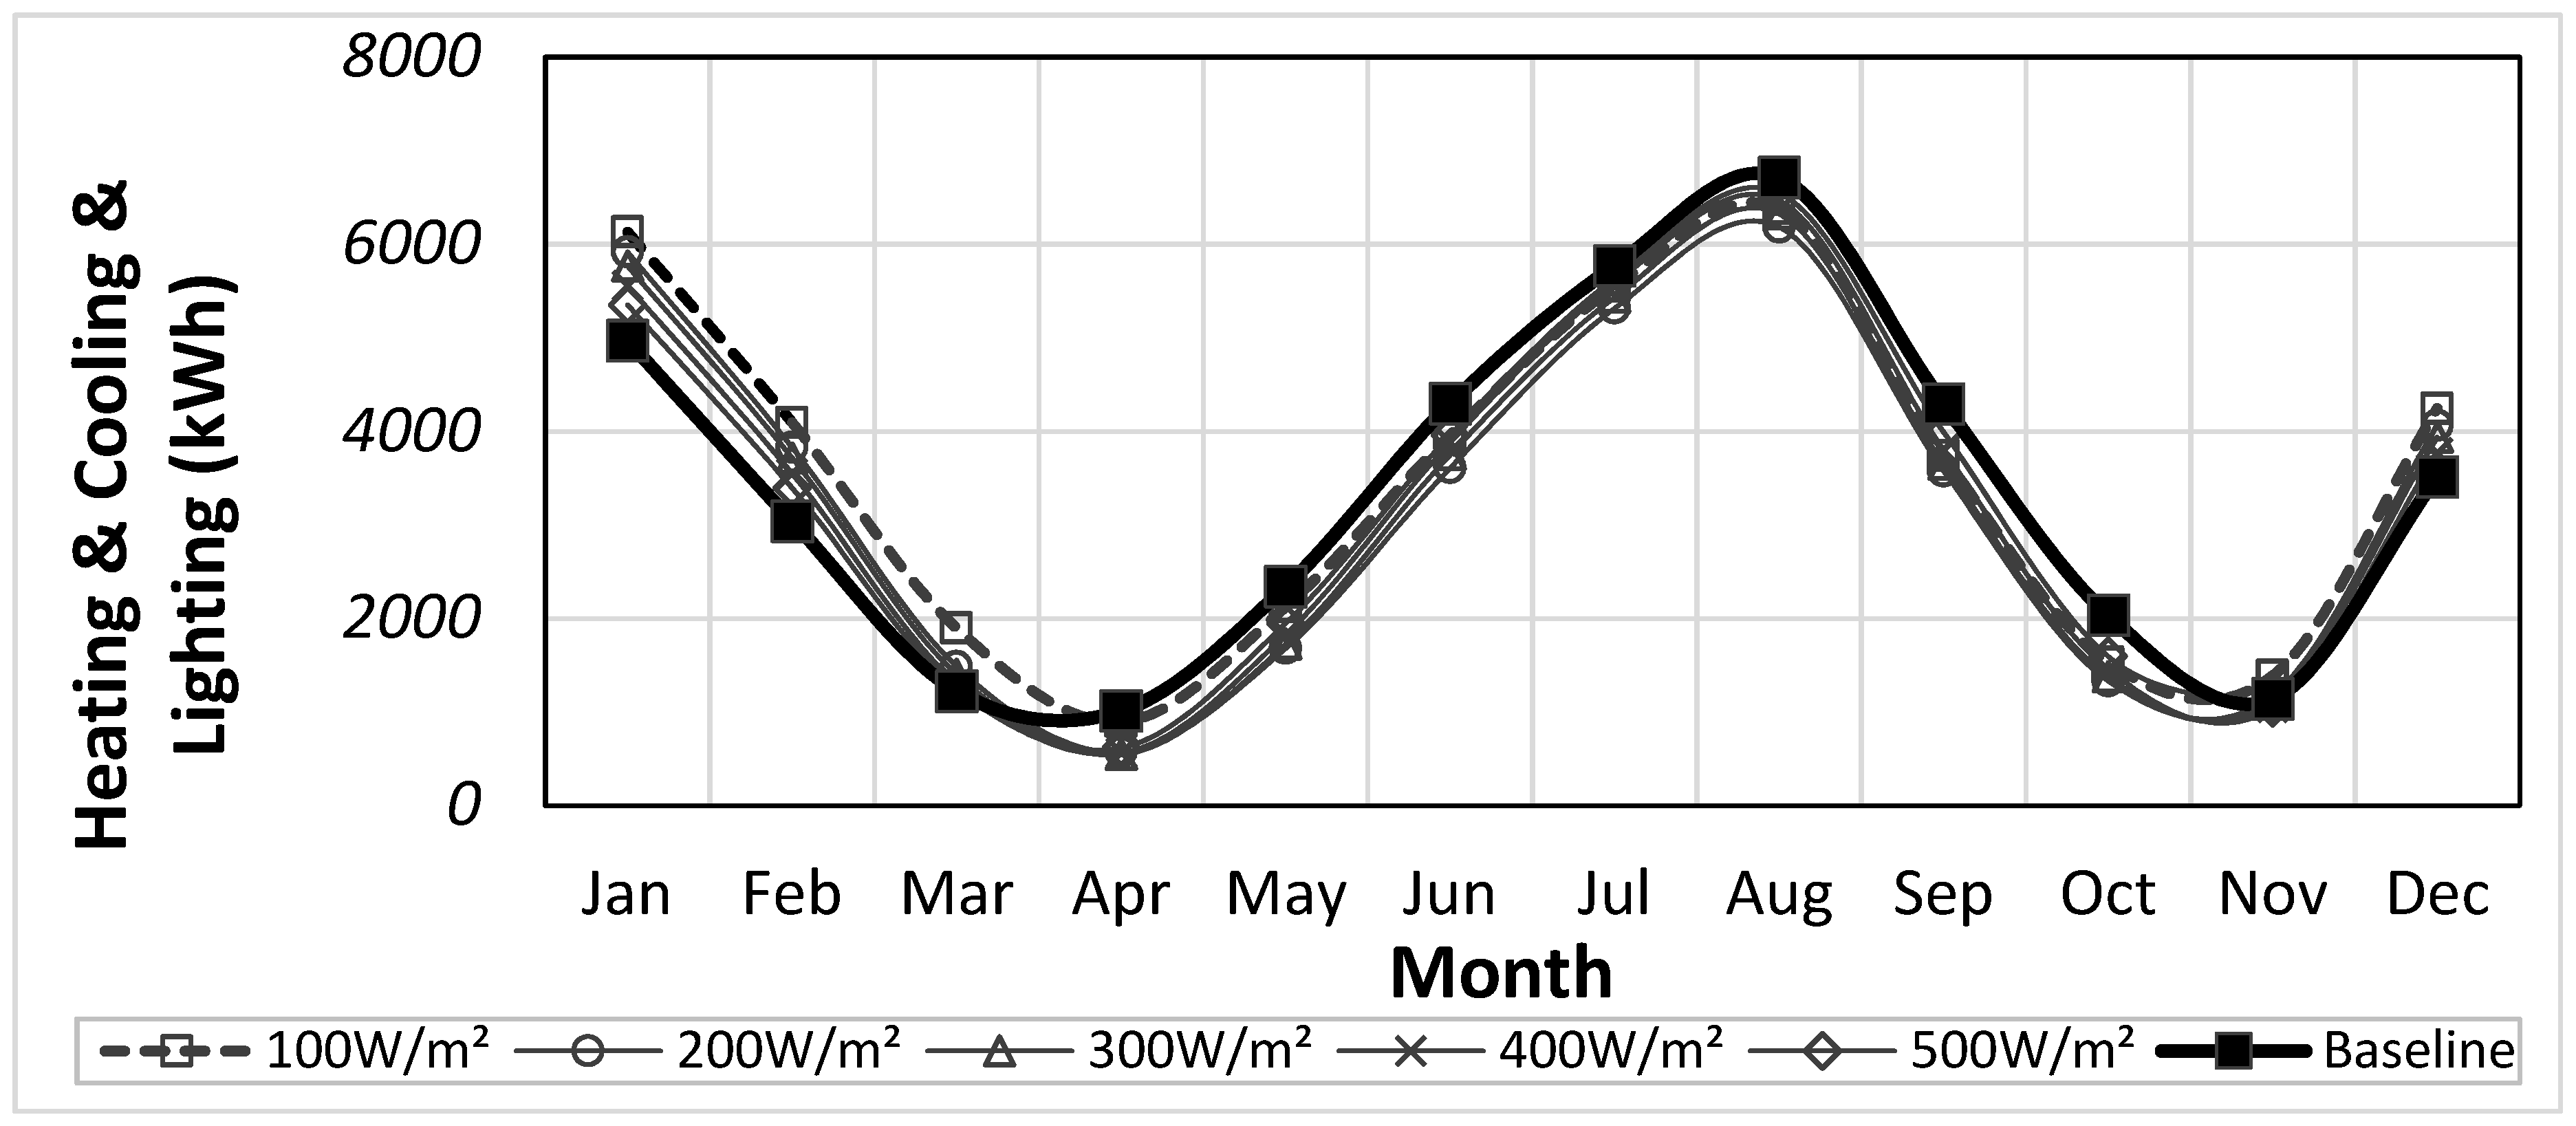
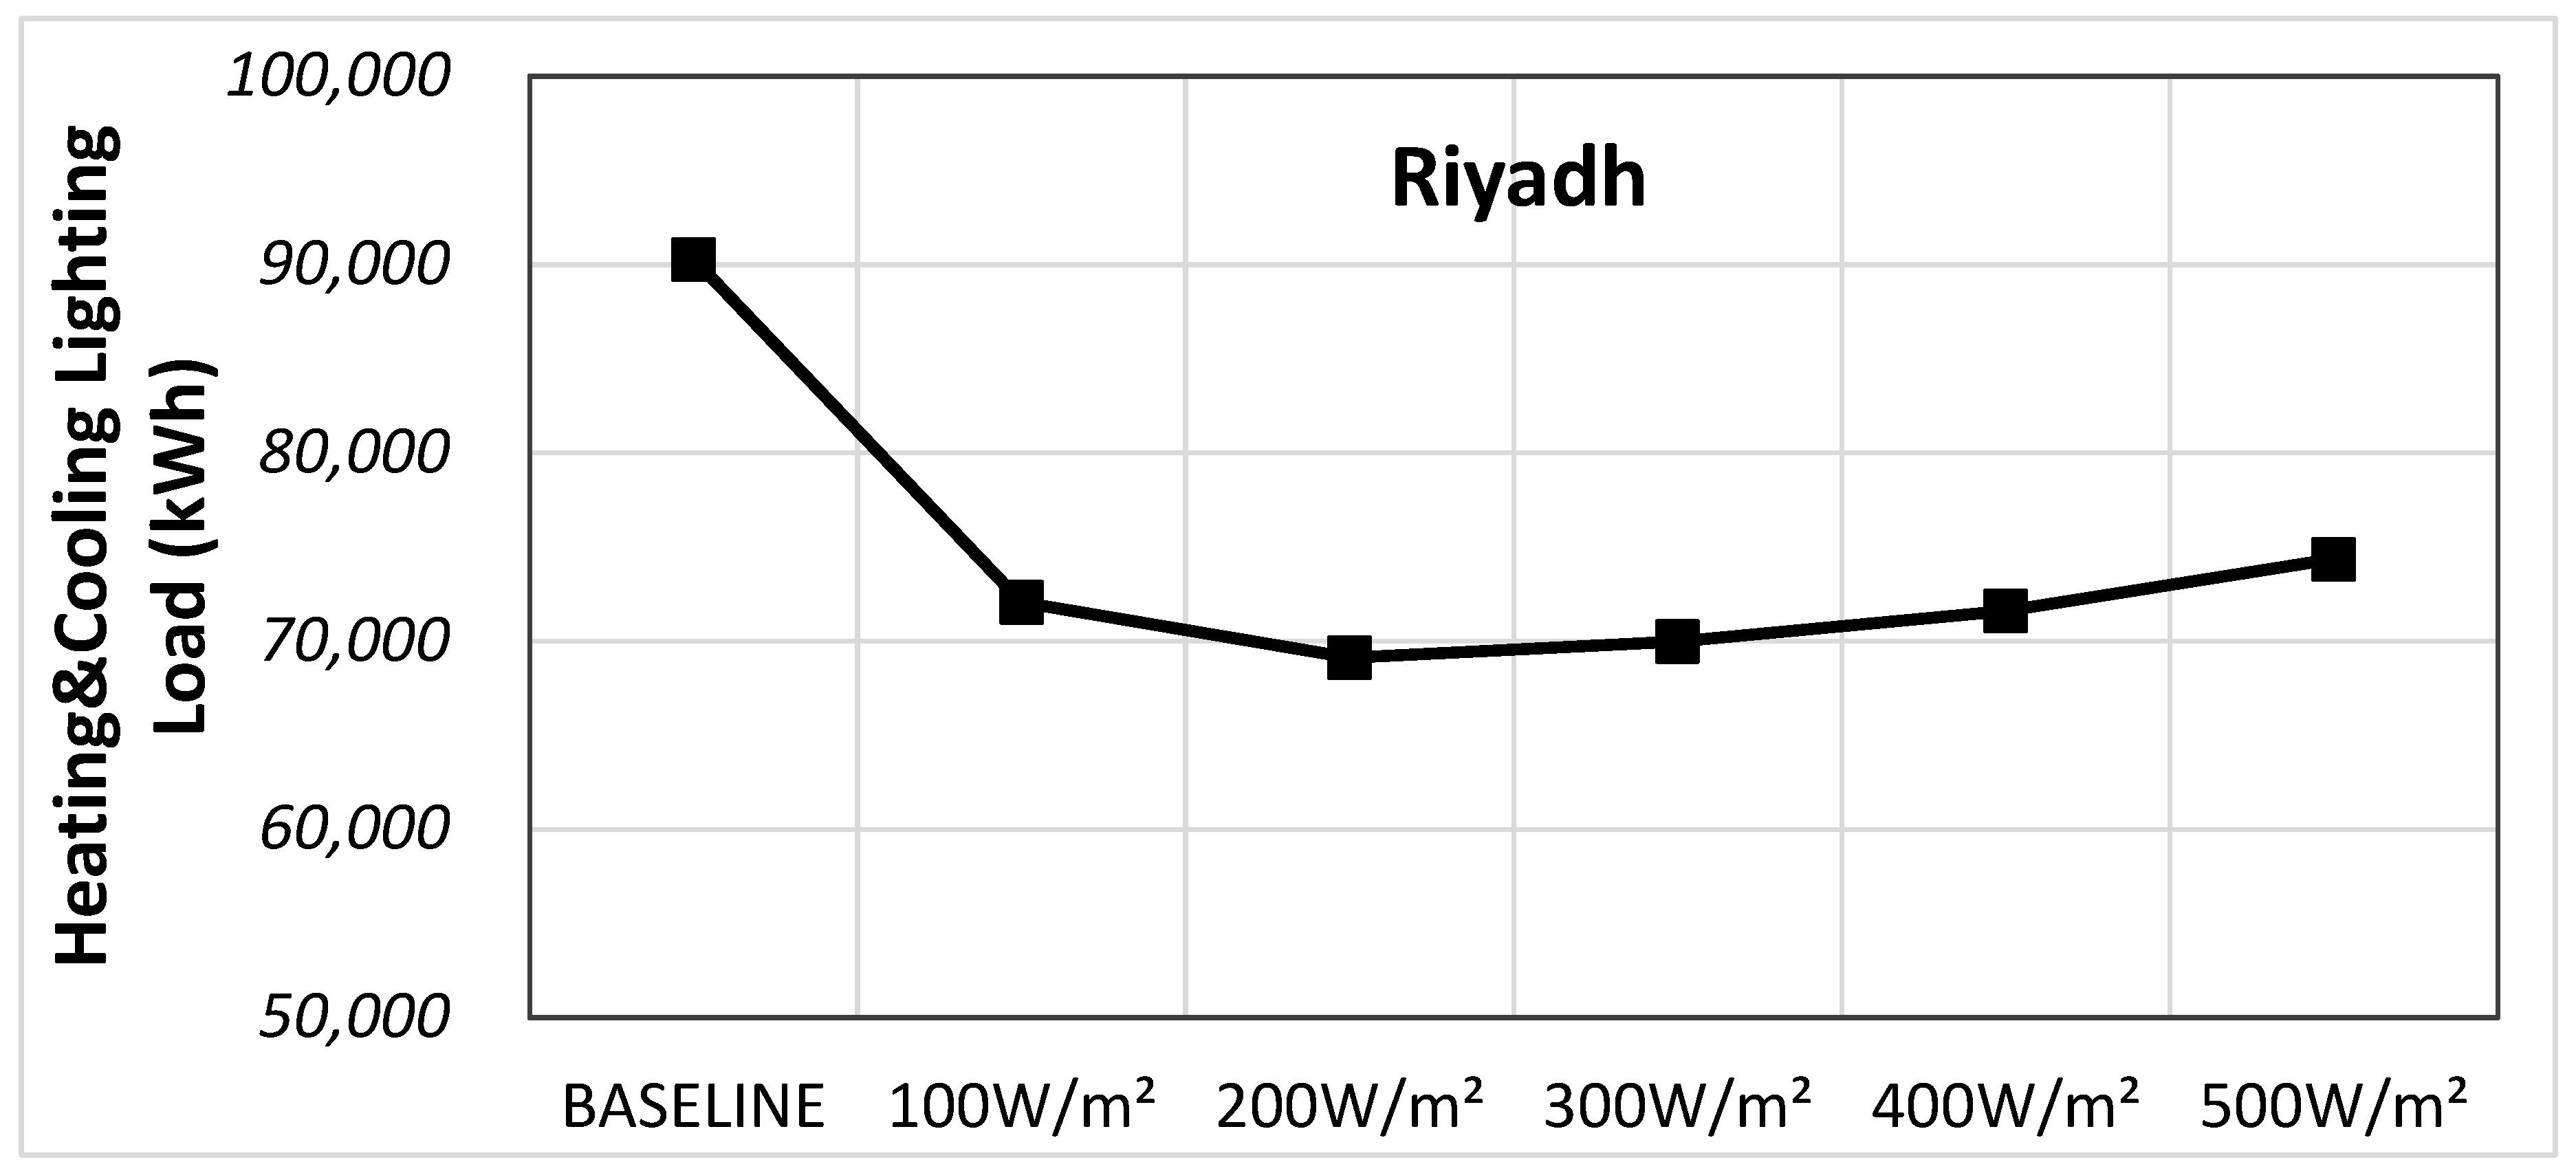
The results of the analysis of the total annual energy according to the solar radiation control for EC glazing showed that the best conditions for Moscow, Inchon, and Riyadh were 300, 300, and 200 W/m2, respectively. The annual energy decreased by 23.4% at 200 W/m2 in Riyadh, which was the best result. As for the other cities, the annual energy was decreased by 4.0% at 300 W/m2 in Inchon, and 5.8% at 300 W/m2 in Moscow.
When the daylight performance was analyzed by controlling the solar radiation for EC glazing, the percentage of annual DGI values below 22 was the highest for solar radiation of 100 W/m2 in each of the cities that were considered. Higher solar radiation was found to be more disadvantageous with respect to DGI. Analysis results of the percentage of annual comfort luminance showed that solar radiation of 100 W/m2 was the best condition for every city, which corresponded with the DGI analysis result.
(2)
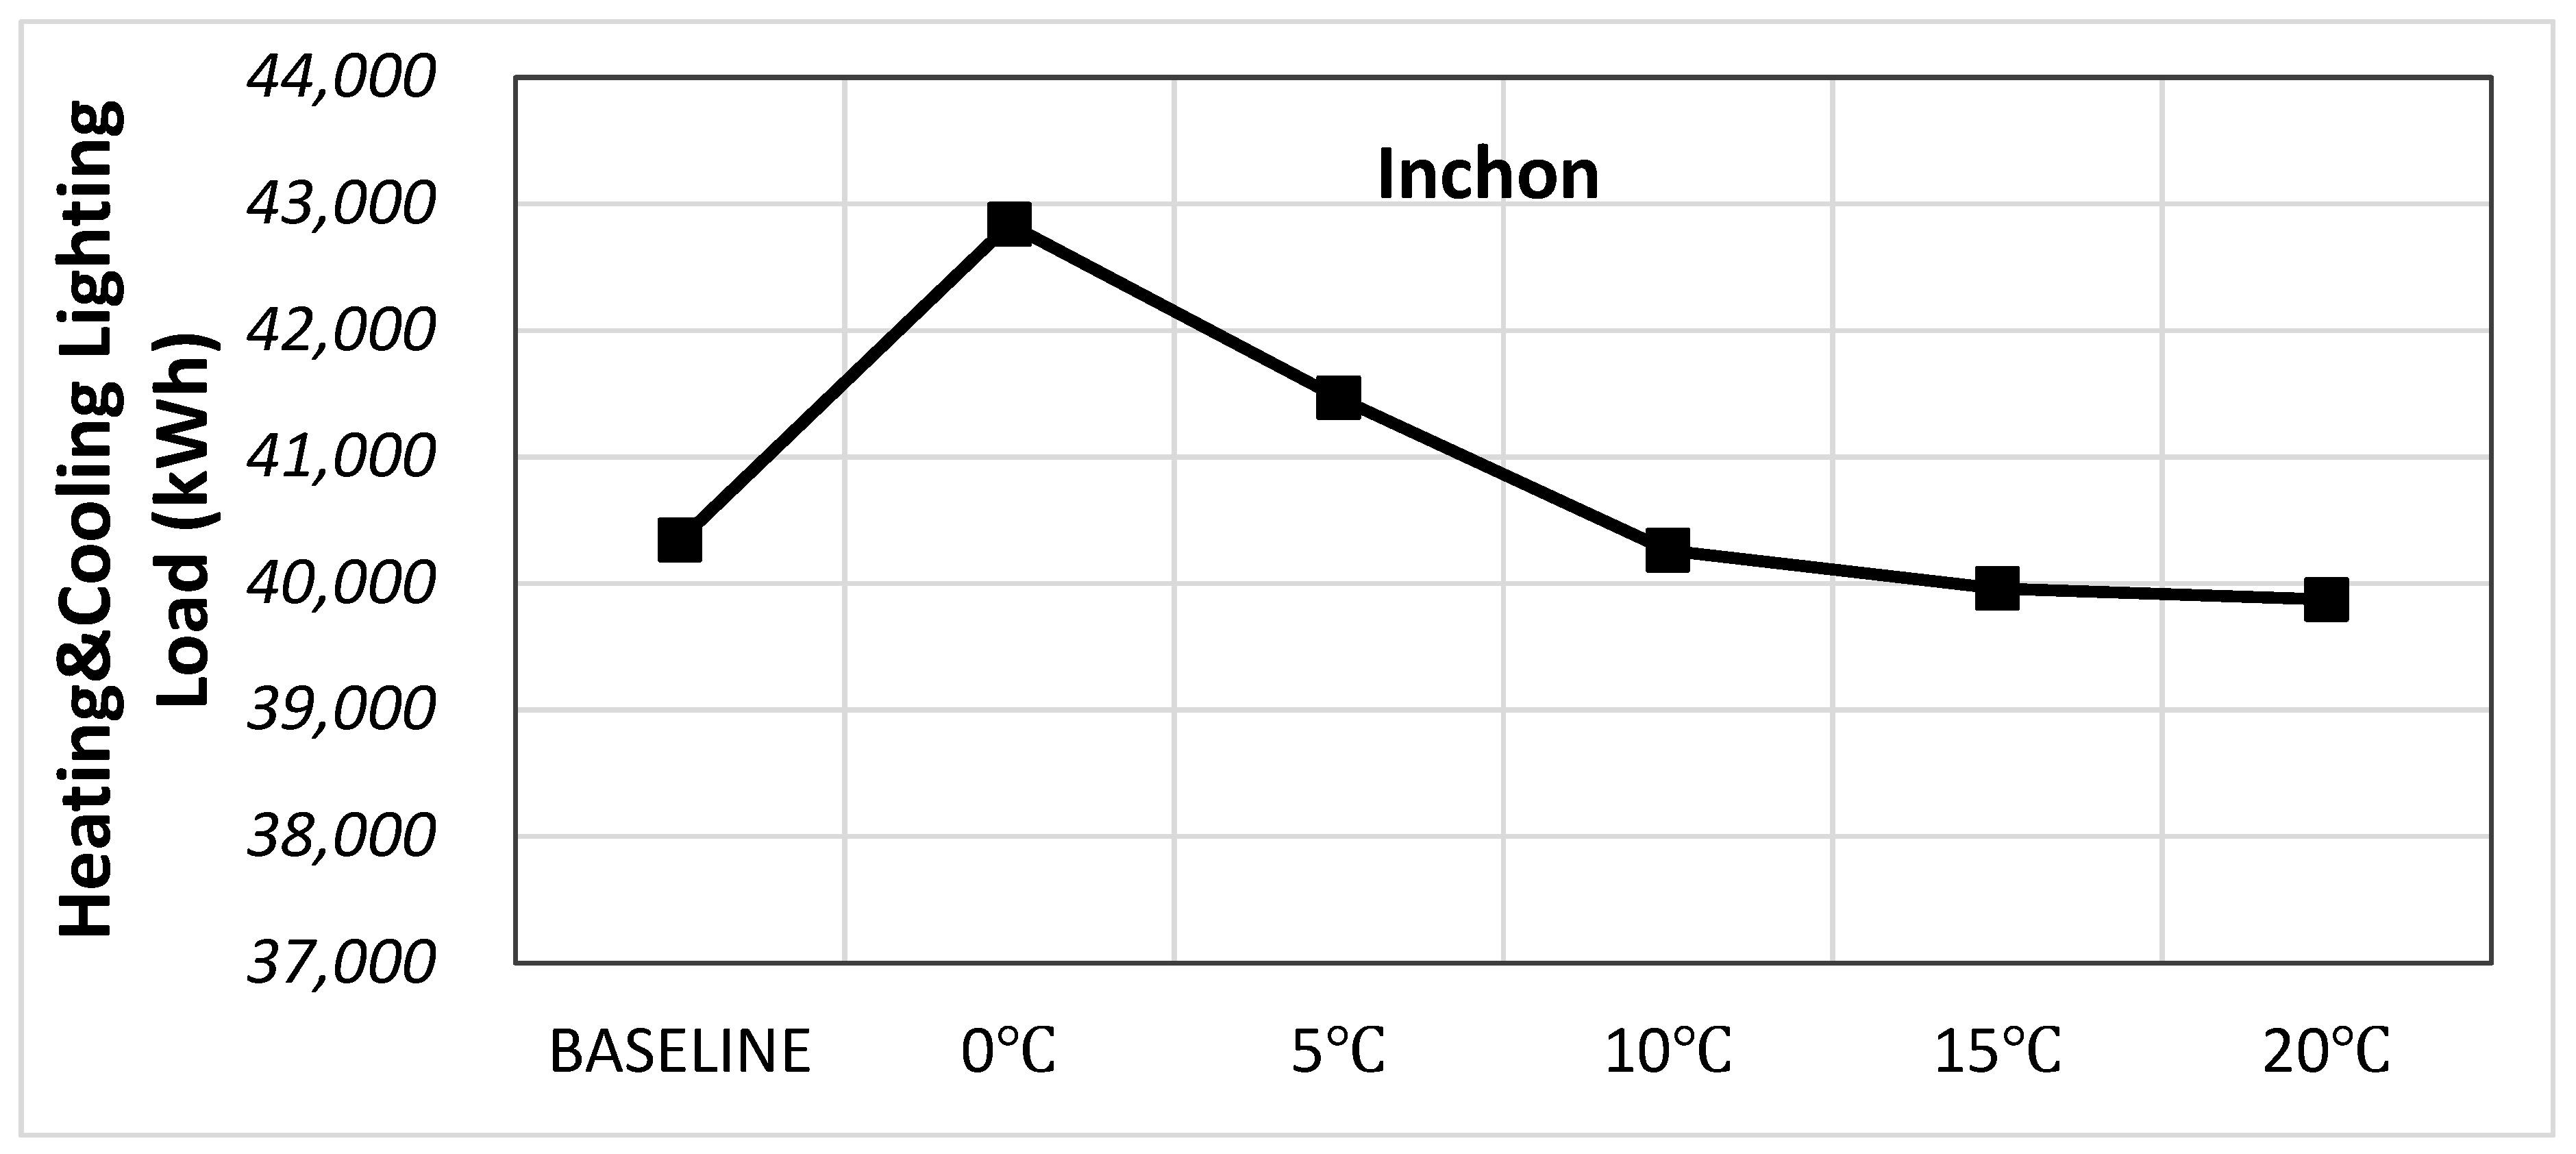
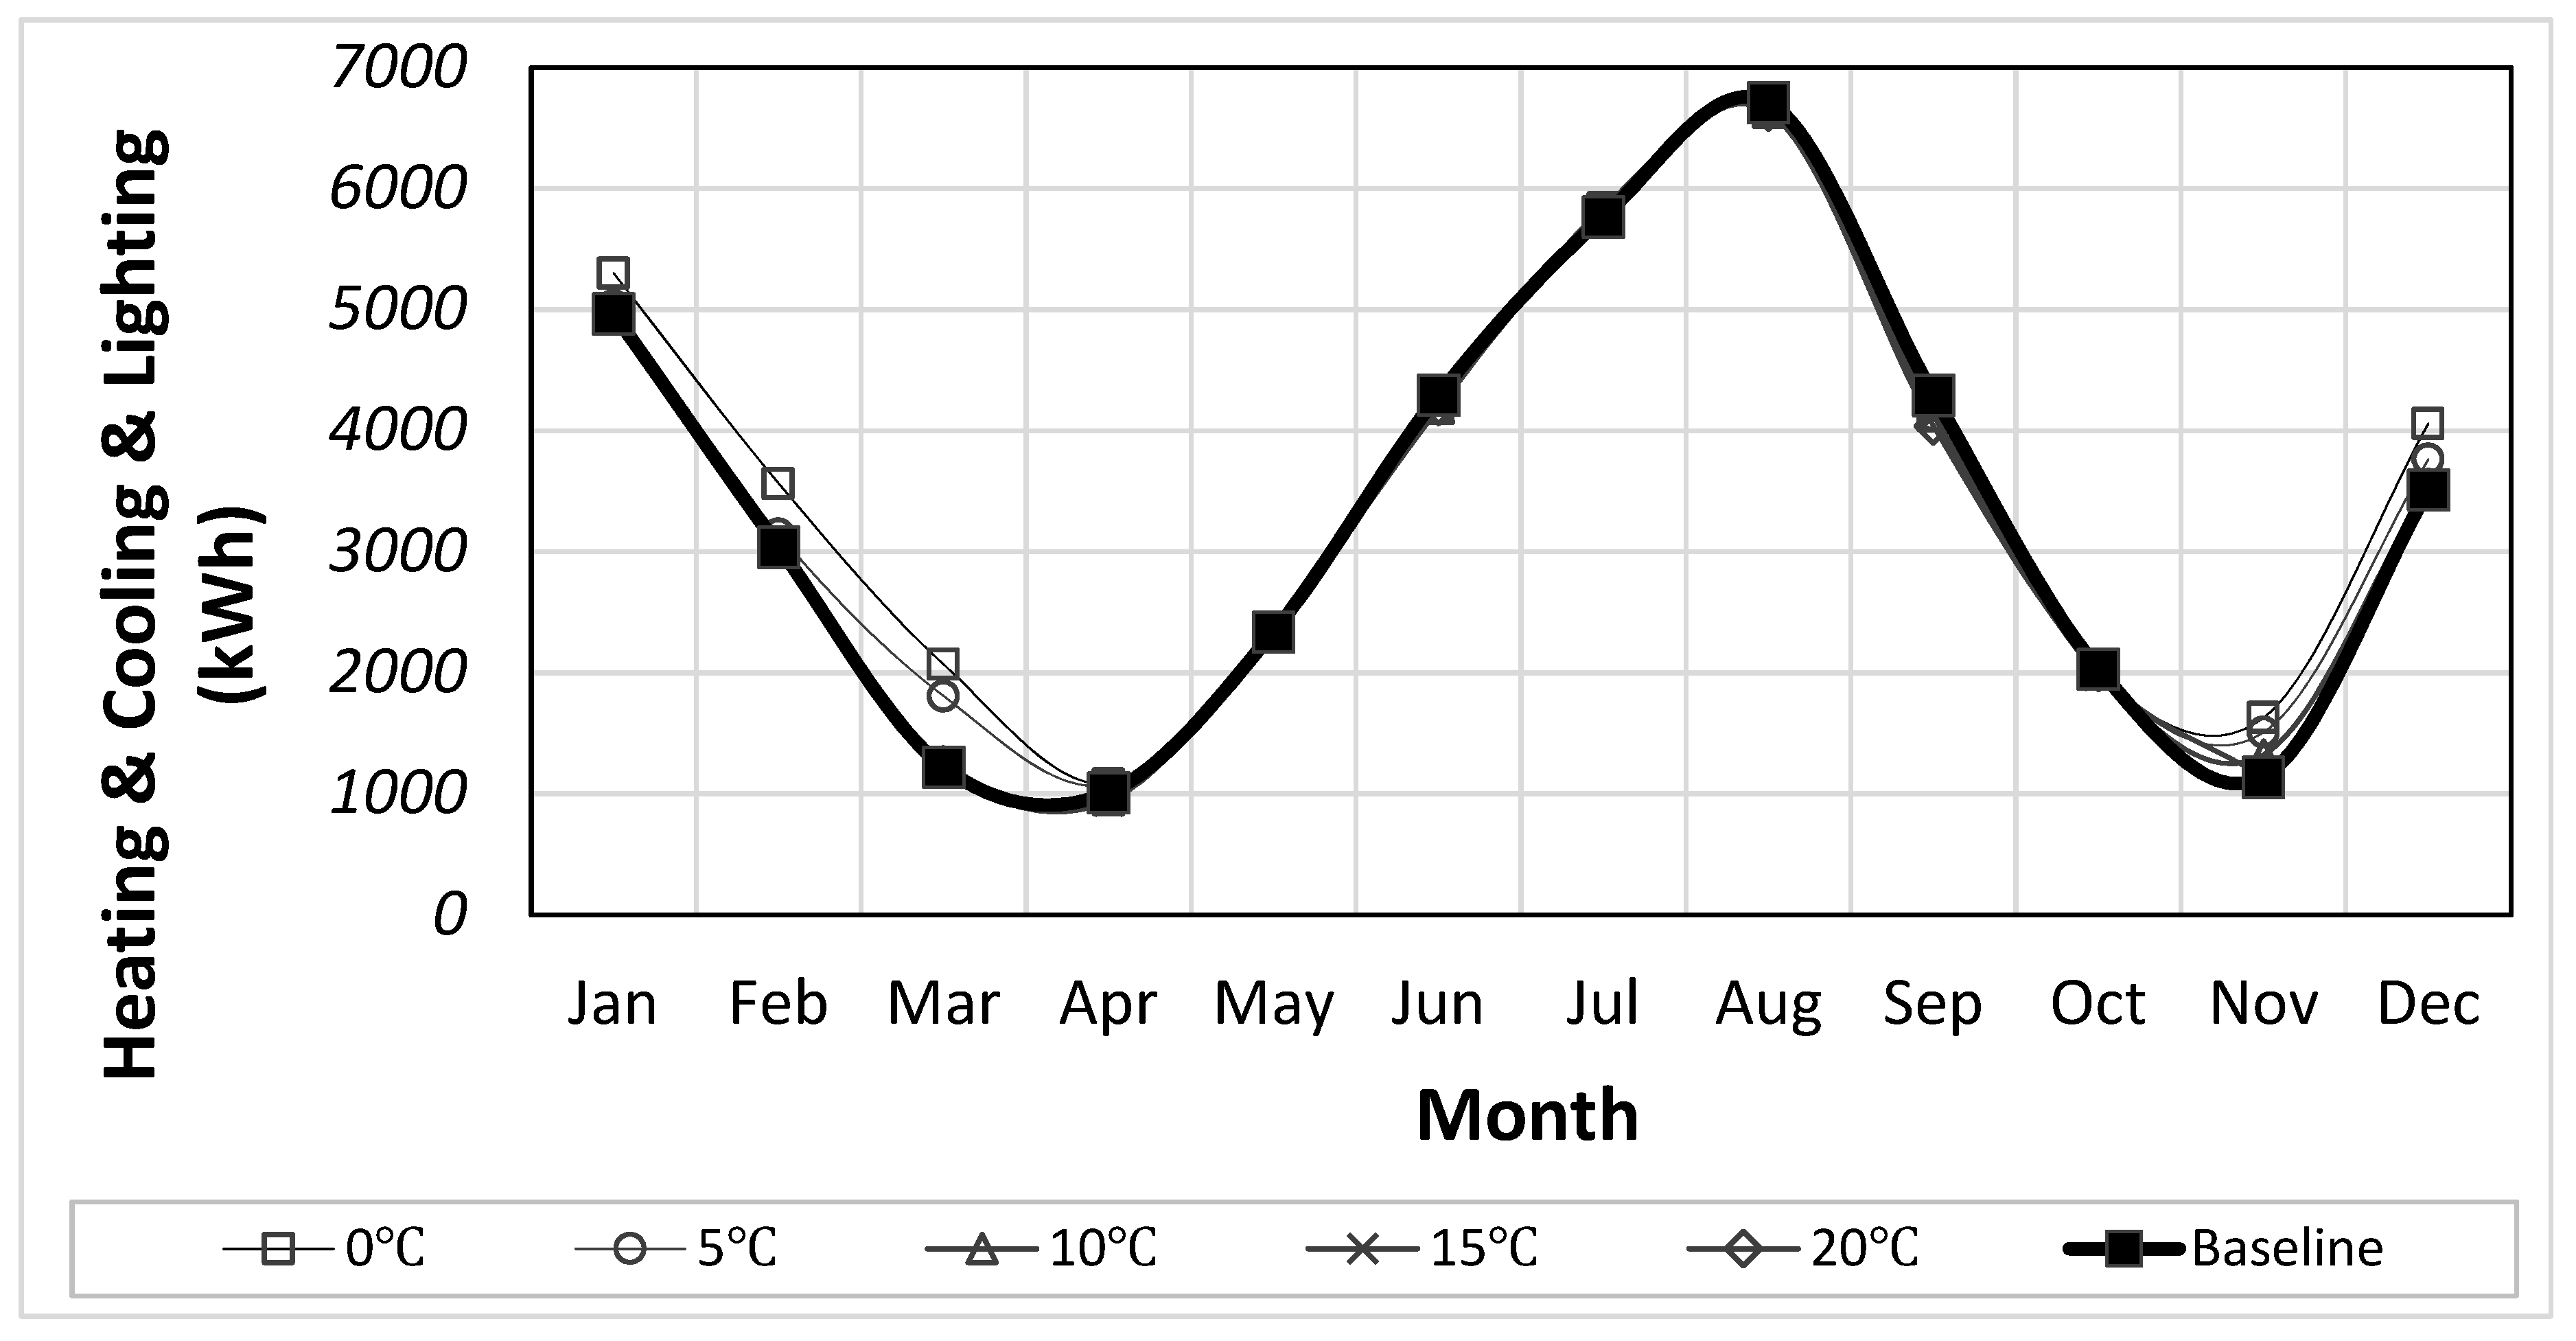
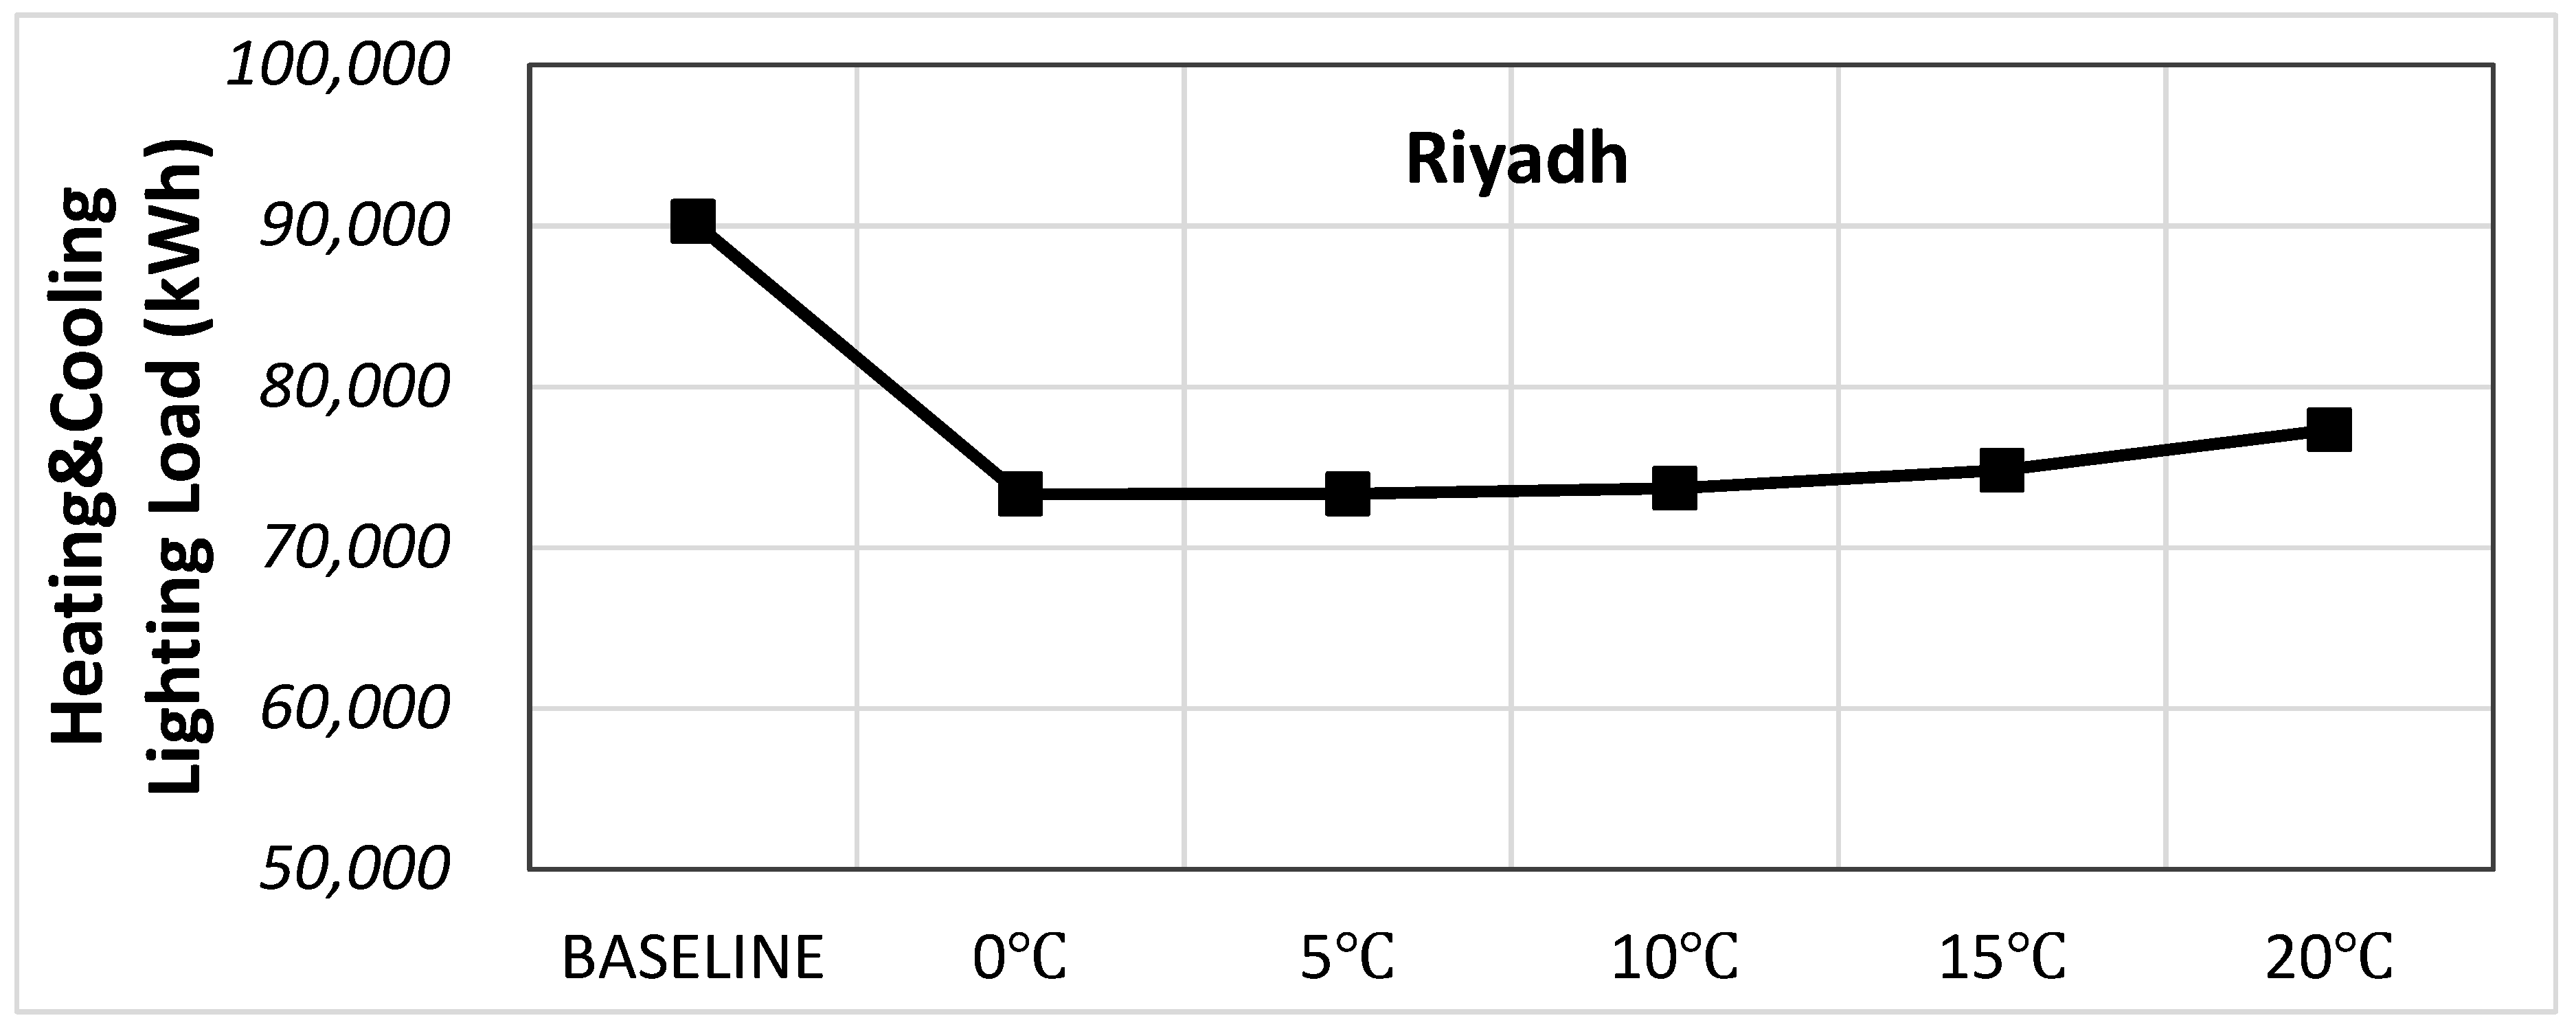
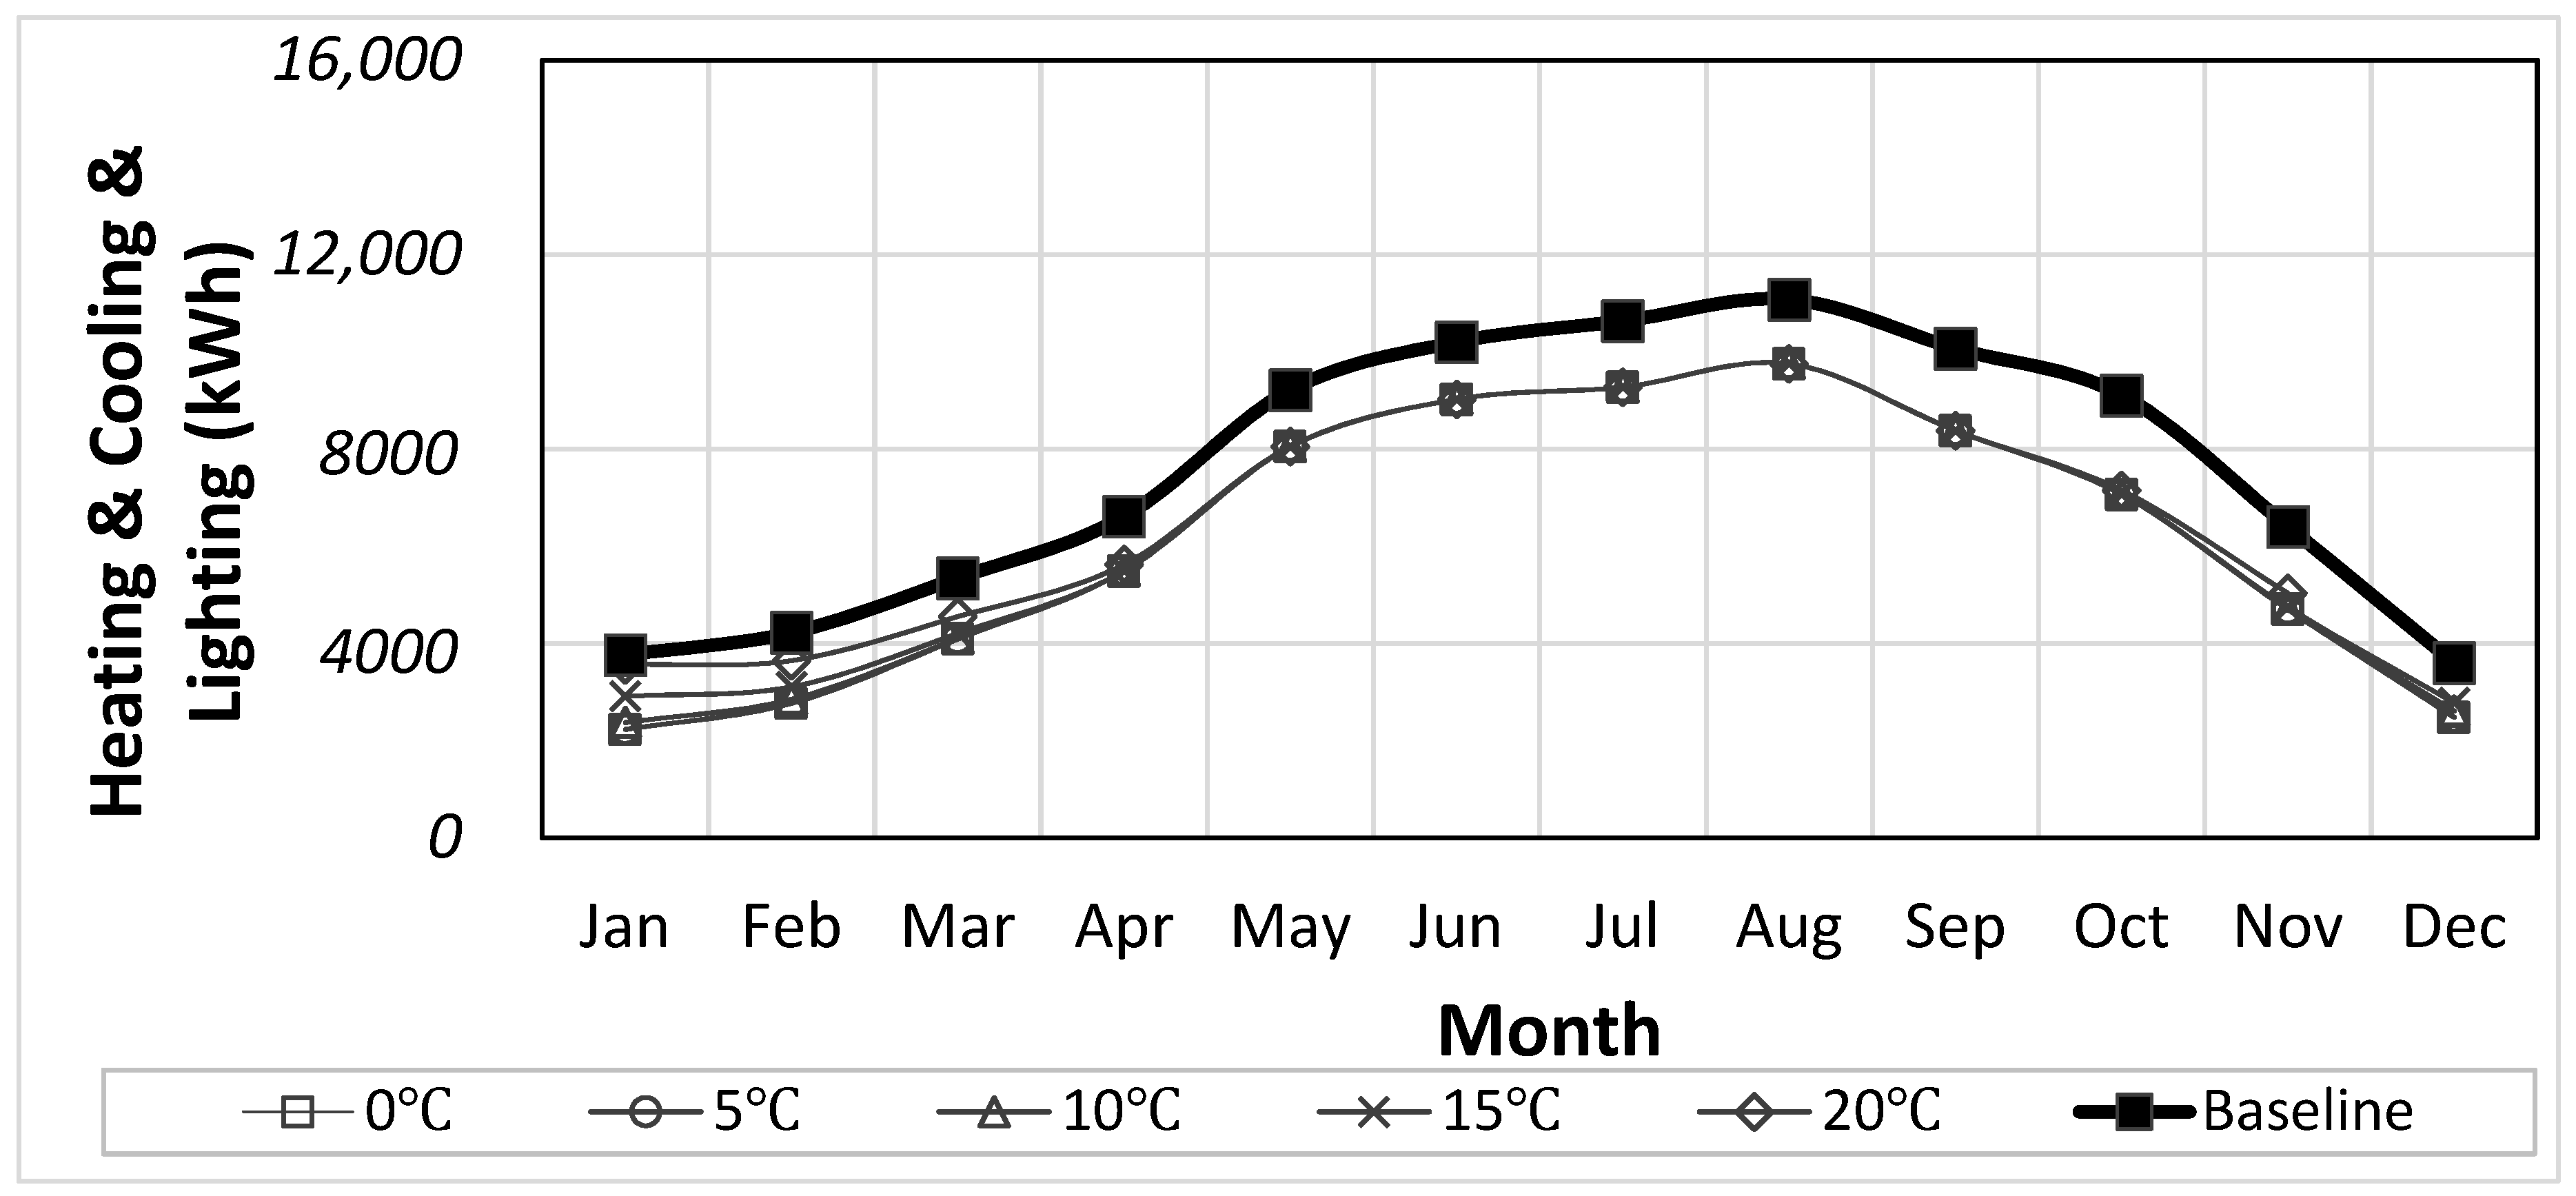
Analysis of the total annual energy according to the temperature control for EC glazing yielded the best performance at 15 °C for Moscow, 20 °C for Inchon, and 0 °C for Riyadh. In particular, Riyadh achieved an 18.8% decrease in the annual energy at 0 °C, which was the best performance overall. In the case of Inchon, the annual energy decreased by 1.2% at 20 °C, and Moscow showed a 5.8% decrease at 15 °C.
(3)
Analysis of the daylight performance according to temperature control for EC glazing showed that the percentage of annual DGI values below 22 was the highest at 0 °C in every city. However, the result obtained for interior illuminance exhibited a trend that differed from that of DGI. The performance with respect to interior illuminance for Moscow, Inchon, and Riyadh was optimal at 10 °C, 5 °C, and 10 °C, respectively.
(4)
Although the advantages and disadvantages of each control condition for EC glazing could be identified for each climate zone, an integrated method for evaluating the performance in terms of both the cooling, heating, and lighting energies and the daylight environment was required. This study utilized the EDPI to comprehensively evaluate the energy and daylight performance. The EDPI-based comprehensive analysis showed that solar radiation of 200 W/m2 was the optimal condition for Moscow and Inchon, whereas 100 W/m2 was optimal for Riyadh. As for the top 30% of conditions in each climate zone, solar radiation of 200 W/m2 was the best condition for Moscow, followed by 100 W/m2 and temperature of 10 °C. For Inchon, solar radiation of 200 W/m2 was the best condition, followed by 100 W/m2 and 300 W/m2. For Riyadh, solar radiation of 100 W/m2 was the best condition, followed by 200 W/m2 and temperature of 5 °C. Thus, in every climate zone analyzed, the solar radiation incident on a vertical surface was a more effective variable in controlling EC glazing than the outdoor temperature. Ultimately, solar radiation of 100–200 W/m2 proved to be the optimal control condition.
This study used weather data of three climate zones, constructed a single analysis model, and restricted the use of the model to an office building. As the representative climate zones were arbitrarily selected in this study, the optimal control results cannot be standardized. Apart from this, the format of the analysis model was fixed; thus, the results do not imply that the optimal control conditions identified in this study are applicable to every type of building. Accordingly, based on the results of this study, future studies on EC glazing control are planned to analyze more diverse climate zones and to use an analysis model reflecting various building forms and purposes, properties of the building envelope, and the window-to-wall ratio.

Author Contributions

All authors contributed substantially to all aspects of this article.

Funding

This research was funded by [the Ministry of Land, Infrastructure, and Transport of the Korean government] grant number [18CTAP-C142184-01 from the Technology Advancement Research Program (TARP)]. And funded by [the Ministry of Education] grant number [No. NRF-2017R1D1A1B03031335 from Basic Science Research Program through the National Research Foundation of Korea (NRF)].

Acknowledgments

This research was supported by a grant (18CTAP-C142184-01) from the Technology Advancement Research Program (TARP), funded by the Ministry of Land, Infrastructure, and Transport of the Korean government. And this research was supported by Basic Science Research Program through the National Research Foundation of Korea (NRF) funded by the Ministry of Education (No. NRF-2017R1D1A1B03031335).

Conflicts of Interest

The authors have no conflicts of interest to declare.

References

  1. Rezaei, S.D.; Shannigrahi, S.; Ramakrishna, S. A review of conventional, advanced, and smart glazing technologies and materials for improving indoor environment. Sol. Energy Mater. Sol. Cells 2017, 159, 26–51. [Google Scholar] [CrossRef]
  2. Piccolo, A.; Pennisi, A.; Simone, F. Daylighting performance of an electrochomic window in a small-scale test-cell. Sol. Energy 2009, 83, 832–844. [Google Scholar] [CrossRef]
  3. Fernandes, L.L.; Lee, E.S.; Ward, G. Lighting energy savings potential of split-pane electrochromic windows controlled for daylighting with visual comfort. Energy Build. 2013, 61, 8–20. [Google Scholar] [CrossRef] [Green Version]
  4. Rottmann, M.; Kraft, A.; Heckner, K.H.; Hausler, T.; Fischer, U.; Stenzel, H. Large-area electrochromic safety glass; switching behaviour and transmission control of solar radiation. In Proceedings of the 9th International Glass Conference on Glass Processing Days, Tampere, Finland, 17–20 June 2005. [Google Scholar]
  5. Granqvist, C.G.; Bayrak Pehlivan, I.; Niklasson, G.A. Electrochromics on a roll: Web-coating and lamination for smart windows. Surf. Coat. Technol. 2017, 6–11. [Google Scholar] [CrossRef]
  6. Costanzo, V.; Evola, G.; Marletta, L. Thermal and visual performance of real and theoretical thermochromic glazing solutions for office buildings. Sol. Energy Mater. Sol. Cells 2016, 149, 110–120. [Google Scholar] [CrossRef]
  7. Baetens, R.; Jelle, B.P.; Gustavsen, A. Properties, requirements and possibilities of smart windows for dynamic daylight and solar energy control in buildings: A state-of-the-art review. Sol. Energy Mater. Sol. Cells 2010, 94, 87–105. [Google Scholar] [CrossRef] [Green Version]
  8. Ghosh, A.; Norton, B.; Duffy, A. Daylighting performance and glare calculation of a suspended particle device switchable glazing. Sol. Energy 2016, 132, 114–128. [Google Scholar] [CrossRef]
  9. Ghosh, A.; Mallick, T.K. Evaluation of colour properties due to switching behaviour of a PDLC glazing for adaptive building integration. Renew. Energy 2018, 120, 126–133. [Google Scholar] [CrossRef]
  10. Reilly, S.; Arasteh, D.; Selkowitz, S.E. Thermal and optical analysis of switchable window glazings. Sol. Energy Mater 1991, 22, 1–14. [Google Scholar] [CrossRef] [Green Version]
  11. Lee, E.S.; Yazdanian, M.; Selkowitz, S. The Energy-Savings Potential of Electrochromic Windows in the US Commercial Buildings Sector; University of California: Oakland, CA, USA, 2004. [Google Scholar]
  12. Tavares, P.F.; Gaspar, A.R.; Martins, A.G.; Frontini, F. Evaluation of electrochromic windows impact in the energy performance of buildings in Mediterranean climates. Energy Policy 2014, 67, 68–81. [Google Scholar] [CrossRef] [Green Version]
  13. Ajaji, Y.; André, P. Thermal comfort and visual comfort in an office building equipped with smart electrochromic glazing: An experimental study. Energy Proc. 2015, 78, 2464–2469. [Google Scholar] [CrossRef]
  14. Papaefthimiou, S.; Syrrakou, E.; Yianoulis, P. Energy performance assessment of an electrochromic window. Thin Solid Films 2006, 502, 257–264. [Google Scholar] [CrossRef]
  15. Oh, M.; Roh, S.; Jang, M.; Park, J. Evaluation of heating and cooling load according to applying electrochromic glass to office building envelope in South Korea. Int. J. Sustain. Build. Technol. Urban Dev. 2018, 9, 158–169. [Google Scholar] [CrossRef]
  16. DeForest, N.; Shehabi, A.; Garcia, G.; Greenbalt, J.; Masanet, E.; Lee, E.S.; Selkowitz, S.; Milliron, D.J. Regional performance targets for transparent near-infrared switching electrochromic window glazings. Build. Environ. 2013, 61, 160–168. [Google Scholar] [CrossRef]
  17. Cannavale, G.E.; Eperon, P.; Cossari, A.; Abate, H.J.; Snaith, G.; Gigli, P. Photovoltachromic cells for building integration. Energy Environ. Sci. 2015, 8, 1578–1584. [Google Scholar] [CrossRef]
  18. HALIO Glass, Asahi Glass Co. (AGC). Available online: https://halioglass.com (accessed on 9 October 2018).
  19. Oh, M.; Tae, S.; Hwang, S. Analysis of heating and cooling loads of electrochromic glazing in high-rise residential buildings in South Korea. Sustainability 2018, 10, 1121. [Google Scholar] [CrossRef]
  20. Oh, M.; Park, J.; Roh, S.; Lee, C. Deducing the Optimal Control Method for Electrochromic Triple Glazing through an Integrated Evaluation of Building Energy and Daylight Performance. Energies 2018, 11, 2205. [Google Scholar] [CrossRef]
  21. LBNL. Available online: https://windows.lbl.gov/software/optics (accessed on 9 October 2018).
  22. LBNL. Available online: https://windows.lbl.gov/software/window (accessed on 9 October 2018).
  23. EnergyPlus. EnergyPlus Input Output Reference. The Encyclopedic Reference to EnergyPlus Input and Output. 2012. Available online: http://www.energyplus.gov (accessed on 9 October 2018).
  24. Arasteh, D.K.; Kohler, J.C.; Griffith, B.T. Draft, Modeling Windows in EnergyPlus with Only U, SHGC, and Optionally VT; Lawrence Berkeley National Laboratory Report; Lawrence Berkeley National Laboratory: Berkeley, CA, USA, 2009.
  25. Lomanowski, B.A.; Wright, J.L. Modeling fenestration with shading devices in building energy simulation: A practical approach. In Proceedings of the 11th International IBPSA Conference, Glasgow, Scotland, 27–30 July 2009. [Google Scholar]
  26. The Korean Ministry of Land, Transport and Maritime Affairs, Standard for Energy Saving Design in Buildings. 2017. Available online: http://www.molit.go.kr (accessed on 9 October 2018).
  27. EnergyPlus, EnergyPlus Engineering Reference. The Reference to EnergyPlus Calculations. 2012. Available online: http://www.energyplus.gov (accessed on 9 October 2018).
  28. ASHRAE Fundamentals Handbook; American Society of Heating, Refrigerating and Air-Conditioning Engineers, Inc.: Atlanta, GA, USA, 2009.
  29. Building Act in South Korea. Available online: http://www.law.go.kr (accessed on 11 December 2018).
  30. EnergyPlus Weather Data. Department of Energy. Available online: https://energyplus.net/weather (accessed on 9 October 2018).
  31. Hopkinson, R.G. Glare from daylighting in buildings. Appl. Ergon. 1972, 3, 206–215. [Google Scholar] [CrossRef]
  32. Korean agency for technology and standards, KS (Korean Industrial Standard) A 3011 (Recommended Levels of Illumination). Available online: https://standard.go.kr/ (accessed on 5 January 2019).
Figure 1. Research guideline and flowchart.
Sustainability 11 00287 g001
Figure 2. Schematic of transmission, reflection, and absorption of solar radiation within a multi-layer glazing system [24].
Sustainability 11 00287 g002
Figure 3. EnergyPlus Openstudio simulation model (a), and model explanation (b) [20].
Sustainability 11 00287 g003
Figure 4. Results of comparative analysis of yearly outdoor temperature for each climate zone.
Sustainability 11 00287 g004
Figure 5. Total annual cooling, heating, and lighting energies in Moscow according to solar radiation control.
Sustainability 11 00287 g005
Figure 6. Total monthly cooling, heating, and lighting energies in Moscow according to solar radiation control.
Sustainability 11 00287 g006
Figure 7. Total annual cooling, heating, and lighting energies in Inchon according to solar radiation control.
Sustainability 11 00287 g007
Figure 8. Total monthly cooling, heating and lighting energies in Inchon according to solar radiation control.
Sustainability 11 00287 g008
Figure 9. Total annual cooling, heating, and lighting energies in Riyadh according to solar radiation control.
Sustainability 11 00287 g009
Figure 10. Total monthly cooling, heating, and lighting energies in Riyadh according to solar radiation control.
Sustainability 11 00287 g010
Figure 11. Percentage of annual DGI (Daylight glare index) below 22 according to solar radiation control.
Sustainability 11 00287 g011
Figure 12. Percentage of annual comfort illuminance according to solar radiation control.
Sustainability 11 00287 g012
Figure 13. Total annual cooling, heating, and lighting energies in Moscow according as a function of temperature control.
Sustainability 11 00287 g013
Figure 14. Total monthly cooling, heating, and lighting energies according to temperature control in Moscow.
Sustainability 11 00287 g014
Figure 15. Total annual cooling, heating, and lighting energies in Inchon as a function of temperature control.
Sustainability 11 00287 g015
Figure 16. Total monthly cooling, heating, and lighting energies according to temperature control in Inchon.
Sustainability 11 00287 g016
Figure 17. Total annual cooling, heating, and lighting energies in Riyadh as a function of temperature control.
Sustainability 11 00287 g017
Figure 18. Total monthly cooling, heating, and lighting energies according to temperature control in Riyadh.
Sustainability 11 00287 g018
Figure 19. Percentage of annual DGI values below 22 according to temperature control.
Sustainability 11 00287 g019
Figure 20. Percentage of annual comfort illuminance according to temperature control.
Sustainability 11 00287 g020
Table 1. Optical properties data of EC (Electrochromic) single glazing in the clear or colored state.
DivisionEC Glass (Clear)EC Glass (Colored)
Thickness (mm)33
Solar Transmittancefront0.4810.065
back0.4810.065
Solar Reflectancefront0.2140.181
back0.1900.168
Visible Transmittancefront0.6480.120
back0.6480.120
Visible Reflectancefront0.1280.074
back0.1110.062
Front and back side emissivity0.8400.840
Conductivity (W/mK)1.0001.000
Table 2. Optical and heat insulation properties of EC double glazing.
DivisionElectrochromic Double Glazing
(6-mm EC Glass + 12-mm Air + 6-mm Low-e)
Clear ModeDarkened Mode
U-value 11.6391.639
SHGC 20.4080.127
Tvis 30.5210.096
1 Thermal transmittance; 2 Solar heat gain coefficient; 3 Visible transmittance.
Table 3. Exterior wall and glass properties of the analysis model.
DivisionMaterialsThermal & Optical Properties
Exterior wall200 mm concrete
155 t insulation
19 mm gypsum board
U-value 0.202 W/m2K
Exterior Floor105 mm insulation
200 mm concrete
U-value 0.291 W/m2K
Exterior Roof100 mm concrete
220 mm insulation
Ceiling air space
Acoustic tile
U-value 0.136 W/m2K
Glazing26 mm double glazing
(8 mm Electrochromic + 12 air + 6 mm low-e glass)
ClearDarkened
SHGC 0.408
Tvis 0.521
U-value 1.639 W/m2K
SHGC 0.127
Tvis 0.096
U-value 1.639 W/m2K
Table 4. Results of comparative analysis of weather data for each climate zone.
DivisionMoscowInchonRiyadh
Outdoor Temperature (°C)Max30.532.645.6
Min−25.0−11.74.0
Average5.511.926.2
Direct Solar Radiation (W/m2)Max873.41013.7935.3
Min---
Average74.686.7258.5
Table 5. Total annual cooling, heating, and lighting energies in Moscow according to solar radiation control.
Energy (kWh)Baseline100 W/m2200 W/m2300 W/m2400 W/m2500 W/m2
Heating32,729.335,059.334,730.334,335.533,930.033,592.6
Cooling15,149.98899.49196.99993.811,144.912,391.7
Lighting6424.09853.97273.56841.26610.26504.2
Total54,303.253,812.651,200.651,170.551,685.152,488.5
Table 6. Total annual cooling, heating, and lighting energies in Inchon according to solar radiation control.
Energy (kWh)Baseline100 W/m2200 W/m2300 W/m2400 W/m2500 W/m2
Heating10,966.113,915.513,547.113,153.412,548.412,078.9
Cooling24,608.218,912.519,410.120,301.621,261.522,102.7
Lighting4770.19099.35786.65274.84993.04855.9
Total40,344.441,927.338,743.838,729.838,803.039,037.6
Table 7. Total annual cooling, heating, and lighting energies in Riyadh according to solar radiation control.
Energy (kWh)Baseline100 W/m2200 W/m2300 W/m2400 W/m2500 W/m2
Heating0.00.90.60.40.20.0
Cooling86,239.462,334.763,139.664,756.466,827.269,896.1
Lighting4040.49727.15987.05232.94782.34461.2
Total90,279.872,062.767,127.269,989.671,609.674,357.4
Table 8. Percentage of DGI (Daylight glare index) values below 22 and comfort illuminance according to solar radiation control.
DivisionDGI below 22 (%)Daylight Illuminance 150–1500 lx (%)
MoscowInchonRiyadhMoscowInchonRiyadh
Baseline67.970.863.549.748.042.1
100 W/m289.692.291.776.777.178.1
200 W/m283.586.480.967.866.273.0
300 W/m278.080.574.260.759.165.8
400 W/m273.676.170.455.653.859.5
500 W/m270.573.167.452.250.052.5
Table 9. Total annual cooling, heating and lighting energies in Moscow as a function of temperature control.
Energy (kWh)Baseline0 °C5 °C10 °C15 °C20 °C
Heating32,729.333,391.833,062.132,784.432,734.932,730.2
Cooling15,149.98870.68893.69131.010,060.212,293.6
Lighting6424.011,600.810,517.39431.98368.77202.4
Total54,303.253,863.252,473.151,347.251,163.852,226.2
Table 10. Total annual cooling, heating, and lighting energies in Inchon as a function of temperature control.
Energy (kWh)Baseline0 °C5 °C10 °C15 °C20 °C
Heating10,966.112,080.711,443.011,035.010,967.410,966.6
Cooling24,608.219,372.019,398.219,648.820,351.821,599.7
Lighting4770.111,386.210,625.39577.98641.77306.9
Total40,344.442,838.941,466.440,261.639,960.939,873.2
Table 11. Total annual cooling, heating, and lighting energies in Riyadh as a function of temperature control.
Energy (kWh)Baseline0 °C5 °C10 °C15 °C20 °C
Heating0.01.11.10.30.00.0
Cooling86,239.462,429.162,439.862,866.764,477.867,819.5
Lighting4040.410,899.010,897.010,828.110,333.89511.3
Total90,279.873,329.173,337.973,695.174,811.677,330.8
Table 12. Percentage of DGI (Daylight glare index) values below 22 and comfort luminance range according to temperature control.
DivisionDGI under 22 (%)Daylight Illuminance 150–1500 lx (%)
MoscowInchonRiyadhMoscowInchonRiyadh
Baseline67.970.863.549.748.042.1
0 °C88.689.991.855.154.464.2
5 °C87.587.991.858.255.264.3
10 °C84.984.991.759.254.864.6
15 °C81.282.390.658.654.764.1
20 °C75.278.687.056.053.763.8
Table 13. Integrated evaluation of energy and daylight performance using EDPI (Energy and daylight performance index).
DivisionEDPIEDPI Chart
DGI below 22Percentage of Lux 150–1500 lxTotal Energy (kWh)Average
MoscowBaseline0.00.00.00.0 Sustainability 11 00287 i001
100 W/m2100.0100.015.671.9
200 W/m271.867.098.879.2
300 W/m246.840.799.862.4
400 W/m226.321.983.443.8
500 W/m211.99.357.826.3
0 °C95.520.014.043.2
5 °C90.431.558.360.0
10 °C78.535.294.269.3
15 °C61.533.0100.064.8
20 °C33.723.366.241.1
InchonBaseline0.00.060.720.2 Sustainability 11 00287 i002
100 W/m2100.0100.022.274.1
200 W/m273.062.599.778.4
300 W/m245.638.1100.061.2
400 W/m224.819.998.247.7
500 W/m210.96.992.536.8
0 °C89.622.00.037.2
5 °C80.024.733.446.0
10 °C65.923.462.750.7
15 °C53.823.070.048.9
20 °C36.319.672.242.7
RiyadhBaseline0.00.00.00.0 Sustainability 11 00287 i003
100 W/m2100.0100.086.195.4
200 W/m261.785.8100.082.5
300 W/m237.765.895.966.5
400 W/m224.548.388.353.7
500 W/m213.728.975.339.3
0 °C100.061.480.180.5
5 °C100.061.780.180.6
10 °C99.762.578.480.2
15 °C95.861.173.176.7
20 °C83.160.361.268.2

