Abstract
The assessment of coastal vulnerability to erosion is urgently needed due to increasing coastal erosion globally. Based on the coastal characteristics of the Xiamen artificial coastline, which accounts for more than 80% of the coastline in this area, this study provides an integrated approach based on a multi-criteria index. The evaluation index system of the local coastal vulnerability to the erosion of Xiamen includes 12 indexes based on natural (coastal characteristics, coastal forcing), and socio-economic factors (coastal infrastructure, disaster reduction). The spatial differentiation characteristics of the coastal vulnerability to erosion along the Xiamen coast (2018) have been quantitatively assessed with the aid of GIS (Geographic Information System) and RS (Remote Sensing) technology. The results show that the very high vulnerability, high vulnerability, medium vulnerability, low vulnerability and very low vulnerability areas of coastal erosion accounted for 4.6%, 30.5%, 51.6%, 12.5% and 0.8% of the Xiamen coast, respectively. The coastal vulnerability to erosion classes of artificial coasts is significantly higher than those of natural coasts. This difference is mainly controlled by the coastal slope and coastal buffer ability. The results of the evaluation are basically consistent with the present situation. The rationality of the index system and the applicability of the theoretical method are well explained. The evaluation model constructed in this study can be extended to other areas with high ratios of artificial coasts.
1. Introduction
Coastal zones are important areas for the socio-economic development of coastal countries, and they represent the most active and frequent areas of human activity [1]. Sixty-five percent of cities globally with populations of more than five million are located in coastal lowlands at altitudes below 10 m [2]. A coastal zone represents the confluence of the four main cycles on Earth and is highly dynamic and susceptible to natural hazards [3,4,5]. Global climate change, sea-level rise and storm surges have increased the sensitivity of coastal zones to natural disasters [6,7,8], which have made coastal erosion disasters increasingly serious [9,10,11]. Seventy percent of beaches around the world are currently being eroded [12]. From 1984 to 2015, the area of coastal erosion was approximately 28,000 km2, which is twice as large as the area of coastal zone increase [13]. Coastal erosion disasters have had an enormous impact on the socio-economic development of coastal areas, particularly in coastal areas with high population densities because these areas are low-lying and highly economically developed [14].
Vulnerability assessments are particularly important for identifying the factors that will affect the current state of the coast in the face of disasters and play important roles in coastal disaster risk reduction management and coastal planning for sustainable development [15,16]. In recent years, coastal vulnerability assessments have received widespread attention [17,18]. However, most previous studies have focused on sea level rise caused by climate change [11,19,20,21] and vulnerability assessments associated with storms [22,23], and fewer assessments have focused on the coastal vulnerability to erosion [17,24,25]. For example, most previous studies have ignored the important influence of artificial coasts on the coastal vulnerability to erosion. Furthermore, these studies have concentrated on the national and regional scales; thus, local-scale studies are lacking. From 1985 to 2015, the global coastal areas increased by 33,700 km2 [7] as a result of human activities. The development of coastal economies and facing sea-level rise will lead to sustained increases in length of artificial coast. After the construction of an artificial coast, hard structures affect coastal processes by changing the sediment budget and increasing beach erosion [26,27,28]. Therefore, the assessment of coastal vulnerability to erosion requires an understanding of the impact of artificial coast on the coastal vulnerability to erosion. Differences are observed in the selection of evaluation indexes for different study scales, and the contents and computations of the same indexes on different scales of an evaluation system vary [29,30,31,32]. There are several models can be used to assess coastal vulnerability. One of the most widely-used methods of assessing coastal vulnerability is the application of multi-criteria index to support preventive coastal management measures [33,34,35,36]. The coastal vulnerability index (CVI), which was initially described by Gornitz, Kanciruk and Gornitz [37,38], has also been widespread applied and includes adjustments for scale variables and available data. As one of the most widely used coastal management tools [39], GIS technology can provide the capabilities of spatio-temporal analysis and visual management for Integrated Coastal Zone Management (ICZM) [36,40,41]. GIS can combine both natural aspects and socio-economic aspects for consideration in a multi-criteria index system.
China has 18,000 km of mainland coastline, and its coastal areas are densely populated, economically developed, account for 13% of the land area of the coastal economic belt, contain 42% of the country’s population, and are responsible for creating more than 60% of the country’s GDP (Gross Domestic Product); thus, coastal areas play a pivotal role in China’s social and economic development [42]. The length of the coastline undergoing erosion in China is approximately 3255.3 km; sandy beach erosion is severe; and approximately 49.5% of the coastline has been eroded [19,43,44,45]. Coastal erosion has resulted in national land losses of 14.3 ha and economic losses of 350 million yuan [46]. With economic development, large amounts of artificial coasts have been constructed in economically developed and densely populated areas. In China, artificial coast accounts for approximately 60% of the Chinese coast, thus forming a “new Great Wall” [47].
Although many artificial coasts have been constructed in China, previous coastal vulnerability to erosion studies have not considered the artificial coastal influence; thus, this study combines the natural and socio-economic factors that affect the coastal vulnerability to erosion and considers new characteristics of the influence of artificial coast on the coastal vulnerability to erosion, combined with multi-source data sets (e.g., remote sensing, field measurements, big data, statistical data, etc.). A comprehensive evaluation index system of local coastal vulnerability to erosion is defined, and it is suitable for coastal areas with high ratios of artificial coasts. Xiamen is a special economic zone, and it also represents China’s first implementation of coastal zone management in a city. Due to the rapid development of the economy [48], this coast contains a large amount of artificial coast. Thus, we select Xiamen as a case to verify the coastal erosion vulnerability model presented in this study. The general conditions of the study area, the materials and methods used in the paper are presented in Section 2. In Section 3, the results of the vulnerability class of the case study are described. The characteristics and applicability of the index system, indexes influencing the class of coastal vulnerability to erosion and support for coastal zone management can be seen in Section 4. Finally, the conclusions are drawn in Section 5 respectively.
2. Materials and Methods
2.1. Study Area
Xiamen is a coastal city located in Southeast China, on the west coast of the Taiwan Strait. It has a land area of approximately 1699 km2 and a sea area of approximately 300 km2 [49]. Based on the 2017 GF-2 satellite image and field survey data (2018), the Xiamen coast is subdivided into four categories: Rocky coast, gravel coast, sandy coast and artificial coast. The artificial coast is mainly ‘hard’ coast, such as seawalls, ports and so on. The length of the Xiamen coastline (2018) is approximately 183 km, of which artificial coastline accounts for 86.6%, and it has a coastal-type distribution, as shown in Figure 1. Xiamen was established as a special economic zone in 1980, and it is one of the five special economic zones in China. Xiamen is also a densely populated city, and in 2017, it had a population of 4.0 million and a total GDP of approximately 435.2 billion yuan [50]. The average annual wind speed is 2.8 m/s; the wave direction in spring, summer and autumn is mainly S~WSW, while that in winter is mainly NE~E. The tidal type is a regular semi-diurnal tide. The average tidal range is 3.99 m [51]. With the rapid development of the economy and the overexploitation of coastal resources, the pressure placed on the Xiamen coastal zone is increasing [52,53,54]. The excessive reclamation and large amounts of seawall buildings have had a tremendous impact on the coastal environment, and the coast has suffered from severe erosion since 1980, particularly sandy coastal erosion, which has caused serious land and economic losses [51].
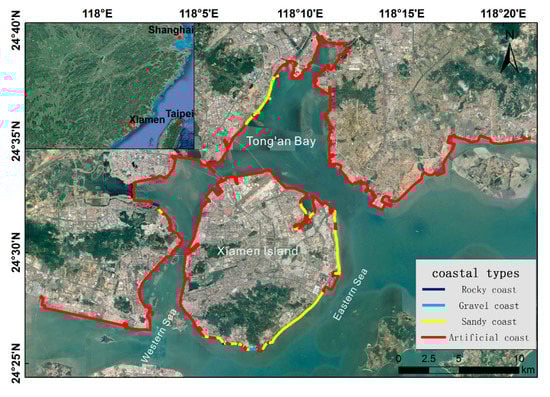
Figure 1.
Xiamen (2018) coastal-type distribution map.
2.2. Assessment Index System and Data Sources
Vulnerability refers to something bad that can but not necessarily will happen [55]. Coastal vulnerability to erosion is a spatial concept that identifies people and places that are susceptible to disturbances resulting from coastal erosion [56]. Vulnerability assessment can be divided into national, regional and local scales [30] based on the administrative districts. This study focuses on the local scale. Vulnerability at the local scale should consider factors, such as local coastal characteristics and development patterns. This scale is mainly used to serve the purposes of local coastal management. The coastal vulnerability to erosion assessment system includes both natural and socio-economic aspects (Figure 2). The natural aspect includes the internal and external characteristics of the system [30], which are coastal characteristics and coastal forcing. Based on their potential losses or resilience in the face of coastal erosion [24], the socio-economic aspect is subdivided into two parts, namely, coastal infrastructure and disaster reduction. Indexes of coastal characteristics (CC) include [30,57] coastal geomorphology, coastal elevation, coastal slope, coastal natural habitats and coastal buffer ability. Indexes of coastal forcing (CF) consist of [30] significant wave height and storms. Indexes of coastal infrastructure (CI) include [5,58,59] the values of roads, values of buildings and population activity. Indexes of disaster reduction (DR) comprise [24] fiscal revenue and GDP per capita. The index system and data sources are shown in Table 1.
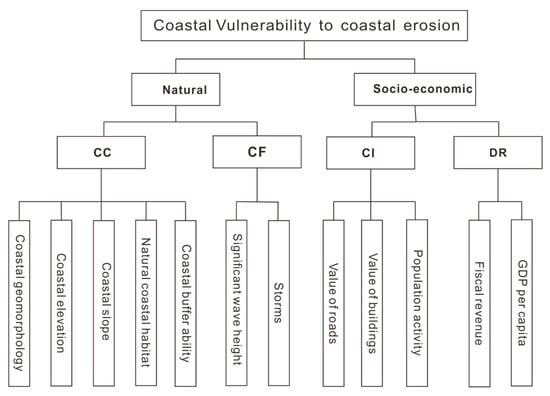
Figure 2.
Structure of coastal vulnerability to erosion.

Table 1.
Index system and data sources.
2.3. Calculation and Classification of Indexes
According to the coastal-type and coastal geomorphology, the study area is divided into 93 evaluation units alongshore. It is necessary to determine the range extending beyond the coastline that is likely to be affected by coastal erosion. This study uses this range to identify potential losses due to coastal erosion. Previous studies [57,58,61,62,63] have indicated that the range of erosion is the erosion rate multiplied by time. The average rate of coastal erosion in Xiamen is 1 m/a [51]. A 100-year coastal retreat distance is selected as the range that may be affected by coastal erosion. The range of the evaluation unit is within 100 m from the coastline landward cross-shore. The evaluation unit index value statistics presented in this study are based on this range. The definition and calculation value of each index per evaluation unit are as follows.
(1) Coastal geomorphology: Coastal geomorphology refers to the surface type of a coastal zone. Different surface types in coastal zones respond differently to coastal erosion; for example, sandy coasts are more vulnerable to erosion than rocky coasts [6,21,30,58]. The surface types of coastal zones are divided into two categories, namely, natural surface types (rocky coasts, gravel coasts and sandy coasts) and artificial surface types (seawall, port and revetment).
(2) Coastal elevation and slope: Areas at higher elevation are less likely to be eroded by inundation [64], and areas with higher slopes are less vulnerable to erosion caused by inundation [6,21,30,57,65]. ArcGIS (Geographic Information System) is used to extract the average elevation and average slope of the evaluation unit from the GDEMV2.
(3) Coastal natural habitats: Natural habitats (mangroves, coastal sand dunes) play vital roles in reducing eroded coastlines [6,24]. For example, mangroves dramatically reduce the wave height in shallow waters and decrease the intensity of wind-generated currents. In this study area, there are only two types of coastal natural habitats. According to research [64], we divide this index into three classes.
(4) Coastal buffer ability: Sediment can dissipate coastal forcing, and a greater amount of sediment corresponds to greater wave dissipation. The average elevations of the highest points of sediment on natural and artificial coastal areas can be indirectly used to determine the amount of sediment in the unit. Limited wave energy is observed along the coastline (MHWT- the mean high water spring tide). The highest measurements points for the artificial coastal sediment are shown in Figure 3a,b. If no sediment in the evaluation unit is exposed at the theoretical depth datum, the evaluation unit is considered the least amount of sediment. The rocky coast is considered to have the largest amount of sediment. The highest measurement points for muddy, sandy and gravel coastal sediment are shown in Figure 3c,d. The average elevation of the evaluation unit minus the average elevation of the natural coastline represents the MHWT. Because coastal forcing hardly occurs on the natural coastline position, a positive value indicates that the evaluation unit has a strong coastal buffer ability and a negative value indicates that the evaluation unit has a weak coastal buffer ability.
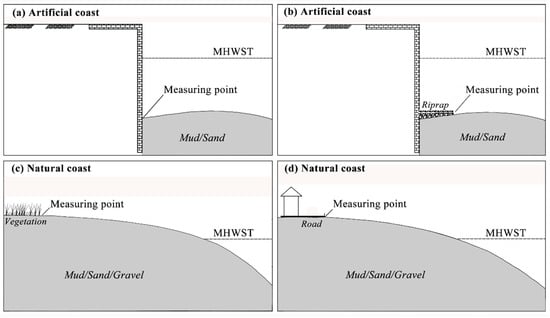
Figure 3.
Measurement positions of the highest points of sediment on artificial and natural coasts: (a) The toe (positions of the highest points of sediment) of artificial coast meets the sediment directly. The junction of the toe of the artificial coast and the sediment is the position of the highest points of sediment. (b) The toe of the artificial coast meets the riprap directly. The junction of riprap and the sediment is the position of the highest points of sediment. (c) The natural coast is in the natural condition. The junction of vegetation and the sediment is the position of the highest points of sediment. (d) The natural coast has been occupied by road or building and so on. The junction of the road (building and so on) and the sediment is the position of the highest points of sediment. Note: Figure 3a–d represent the data measurement points for the coastal buffer ability of each coastal type, Figure 3c,d include muddy coast, sandy coast and gravel coast; MHWST—mean high water spring tide.
(5) Significant wave height: When a wave transmits energy to shallow water, wave breaking causes turbulence. The components parallel to coastline cause the sediment to be transported alongshore. The vertical components of the coastline drive the sediment to cross-shore transport [31,51,66,67].
The wave energy density (energy density) or energy ratio (specific energy) [49], i.e., the average total wave energy per unit length in the spanwise direction, is defined as follows:
where is the wave energy density (j m−2); E is the total energy per unit peak width within a wavelength (J m−1); is the density of seawater (kg m−3); is the acceleration due to gravity (N kg−1); and H is the wave height, significant wave height or average wave height (m).
Accordingly, the significant wave height can be used instead of the wave energy, which indicates the influence of waves on coastal erosion. Stronger wave energy corresponds to more intense corresponding coastal erosion. The significant wave height is reconstructed by SWAN (the third-generation spectral wave model Simulating Waves Nearshore) in the surf zone. The offshore boundary conditions have been extracted from data of the buoy in the Taiwan strait from October 1, 2008 to September 30, 2009 at coordinates 24°28′59″ N and 119°17′35″ E. The wave model configuration was represented by a single computational grid with a resolution of 0.1 km by 0.1km. The coastline was considered as a closed contour and the oceanic boundaries as open contours. The bathymetric data within the computational domain has been obtained from nautical charts. Offshore portions of the domain have been complemented with data from the global coverage model ETOPO 1 [68]. The data of model validation have been obtained from the measured data at coordinates 24°25′05.1″ N and 118°06′45.1″ E. The modeled significant wave height is extracted from 5 m depth contour which parallels to the coast.
The range of significant wave height in the study area is from 0.17 m to 0.43 m. Because the variation of significant wave height in evaluation units is not particularly evident and big. As a whole, the significant wave height in evaluation units is not high. The highest height is 0.43 m which is not so serious for coastal erosion. The class of significant wave height should be divided into four classes, then the highest height should belong to the high vulnerability.
(6) Storms: Coastal erosion caused by storm surges is influenced by a variety of factors, including the water level increase, wave characteristics, direction of storm movement, storm speed and duration and tidal characteristics during the storm landing. Because the evaluation units are small, the above common evaluation indexes cannot distinguish the impact of typhoons on the evaluation unit. The impacts of a storm on a sandy coast and artificial coast are not the same. The impact of a storm on a sandy coast mainly causes the erosion of the beach, whereas the impact of a storm on an artificial coast mainly damages infrastructure. The impact of a typhoon is indirectly expressed by the potential losses to beaches and artificial coasts (assuming that different artificial coasts are needed to repair the damage caused by typhoons). The impact on the artificial coast is divided by the relative artificial coast value. The impact of a typhoon on the coast can be obtained indirectly, and the losses of rocky and gravel coasts are negligible. The relative value of the seawall unit length is set to 1 m−1, and those of the sandy coast, revetment and port are 0.1 m−1, 0.4 m−1 and 0.7 m−1, respectively. The relative value of coast is used to roughly distinguish the potential losses caused by storms. The total value is equal to the length of the evaluation unit multiplied by its relative value.
(7) Values of roads and buildings: Roads and buildings are important components of coastal infrastructure [5,58,59,69], and coastal erosion can damage roads and buildings.
This study used eCognition Developer 8.7 [70] to extract and class roads and buildings from the GF-2 raster. The roads in the study area are subdivided into four categories: Pathways, narrow roads, secondary roads and main roads. The relative value of the main road unit length is 1 m−1, and the relative values for the other classifications are 0.75 m−1, 0.5 m−1 and 0.25 m−1. Because the values of roads are so complex, the relative value of roads is used to roughly distinguish the different classes of roads. The total value of the road length is multiplied by its relative value. The treatment of building value is consistent with that of road value. Buildings are also subdivided into four categories: Fishing villages buildings (rural), warehouses, urban residents buildings and business district buildings. The relative value of the business district unit area is 1 m−2. The other classifications are 0.75 m−2, 0.5 m−2 and 0.25 m−2. Because the values of buildings are so complex, the relative value of buildings is used to roughly distinguish the different classes of buildings. The total value of the building area is multiplied by its relative value.
(8) Population activity: Population activity is a part of the coastal infrastructure [69], and greater population activity corresponds to higher vulnerability. A thermodynamic chart is created by using an acquired mobile base station to locate the number of users in a given region and rendering the map color to reflect the number of users. Based on the population activity density thermodynamic chart calculated by Baidu Big Data (https://huiyan.baidu.com/), the relative grade density of the population activity in each evaluation unit is calculated.
(9) GDP per capita and fiscal revenue: When threatened with a coastal erosion disaster, the ability to achieve social and economic disaster reduction mainly involves government investments in financial resources to achieve disaster reduction and individuals recovering in the face of disaster. These two aspects are mainly reflected in terms of fiscal revenue and GDP per capita.
The data on GDP per capita and fiscal revenue are with a low spatial resolution. In all, GDP per capita of evaluation units is relatively high, the ability to recover and cope with coastal erosion is fairish. So the class of GDP per capita could be divided into four classes, the lowest GDP per capita should belong to the high vulnerability. In all, fiscal revenue of evaluation units is relatively high, the government has the power to mitigate coastal erosion. So the class of fiscal revenue could be divided into four classes, the lowest fiscal revenue should belong to the high vulnerability.
The index classification is generally odd. Classifications performed in similar studies are generally divided into 5 classes [71,72,73]. Because of differences in data, some indexes are divided into 3 classes, whereas some are divided into four classes. The numbers 1, 2, 3, 4 and 5 have been used to indicate very low vulnerability, low vulnerability, medium vulnerability, high vulnerability and very high vulnerability, respectively. The index classification and reference sources are shown in Table 2.
Table 2.
Index classification and reference sources.
2.4. Index Data Analysis
2.4.1. Weight Calculation
The methods used to weight index systems mainly include the analytic hierarchy process (AHP), entropy weight and equal weight methods.
1. The AHP is widely used in decision making, planning and resource allocation. Here the method was used to obtain the weight vectors of the indexes as follows [24,75]:
(1) A hierarchic structure was established from bottom alternatives to top objective.
(2) A pair comparison matrix was formed by judging the relative importance of indexes in pair, the indexes of a level are compared with other indexes of the same level and their relative importance is calculated, as shown in Table 3.
Table 3.
Fundamental scale for pairwise comparisons [77].
(3) The weight vector is obtained using a linear algebraic operation, which is the principal eigenvector of the matrix; pairwise comparisons are verified to assess the accuracy and consistency of comparisons between two options. To this end, the consistency index (CI) is used as follows:
where CI is the consistency index; is the largest or principal eigenvalue of the pairwise comparison matrix, and n is the order of the matrix. When the matrix has complete compatibility, CI = 0. The larger CI is, the worse the consistency of the matrix. The consistency ratio (CR) is calculated as follows:
where RI is the average of the resulting consistency index depending on the order of the matrix [76]. When the CR is less than 0.10, the matrix has a reasonable consistency; otherwise, the matrix should be changed and the original values in the pairwise comparison matrix must be revised by the decision maker. The calculated results for the weight can be accepted once the CR is satisfactory.
2. The concept of “entropy”, which is considered the uncertainty of a system, is taken from the theoretical foundation of the modern information theory [78], it has been applied in vulnerability assessments [79].
In the assessment, the entropy of the observed data under the ith criterion can be calculated as follows:
where represents the uncertainty of observed data of one criterion with n potential intervals or statements; and is the frequency of the kth statement. If = 0, then 0 ln 0 = 0. The entropy-based weight of the ith criterion can be attained, based on the normalized entropy , as follows:
where m is the number of criteria.
3. The equal weight method means that each weight of the index is equal.
Each method has its own advantages. Based on previous studies [17,30,51,80,81], this study uses the equal weight method.
2.4.2. Calculation model
The numerical values for the four elements, two criteria and vulnerability were summed within the GIS system and the results were then normalized by calculating the results as a percentage of the maximum and minimum scores possible [30]. For example, the coastal characteristics (CC) element calculation is shown below:
Addition of CC indexes = Coastal geomorphology + Coastal elevation + Coastal slope + Coastal natural habitat + Coastal buffer ability
The results of adding the indexes ranged from 5 to 25 with a possible maximum score of 25 and a minimum of 5. The results of this first calculation were then calculated as a percentage of the range of scores possible as shown below:
CC = 100 × [(Addition of CC indexes) − 5]/20,
According to the above algorithm, the values of coastal forcing (CF), coastal infrastructure (CI), disaster reduction (DR), natural (N), socio-economic (SE) and V (Vulnerability) aspects are calculated. Their calculated formulas are as follows. The average results are divided into 5 classes, which are consistent with the index classification.
CF = 100 × [(Addition of CF indexes) − 2]/8,
CI = 100 × [(Addition of CI indexes) − 3]/12,
DR = 100 × [(Addition of DR indexes) − 2]/8,
N = 100 × [(Addition of N indexes) − 7]/28,
SE = 100 × [(Addition of SE indexes) − 5]/20,
V = 100 × [(Addition of N indexes + Addition of SE indexes − 12)/48],
3. Results
3.1. Natural Vulnerability Distribution
The classes of natural, coastal characteristics and coastal forcing vulnerability include very low vulnerability (1), low vulnerability (2), medium vulnerability (3), high vulnerability (4) and very high vulnerability (5). Natural components include two parts: Coastal characteristics and coastal forcing. Three vulnerability distributions and classes account for the entire coast, as shown in Figure 4a–c. The differences in the natural vulnerability classes between artificial and natural coasts are described as follows: The areas constituting class 5 natural vulnerability represent 28.6% of the entire coast, all of which is artificial coast. Class 1 natural vulnerability represents 0.8% of the entire coast, all of which is natural coast. The differences between the coastal characteristics of the vulnerability classes between artificial and natural coasts are as follows: Class 5 coastal characteristics vulnerability is 66% of the entire coast, representing that 61.8% of the entire coast is the artificial coast and 4.2% of the entire coast is the natural coast. The class of coastal characteristics vulnerability of 71.4% of the total artificial coast and 31.4% of the total natural coast is class 5. Class 1 coastal characteristic vulnerability is 0.8% of the entire coast, all of which is natural coast. The differences between the coastal forcing classes of artificial and natural coasts are as follows: Classes 4 and 5 of coastal forcing vulnerability are 20.1% and 17.1% of the entire coast, all of which are artificial coast, and the remaining classes of coastal forcing vulnerability exhibit small differences between artificial coasts and natural coasts. These results indicate that the overall classes of natural, coastal characteristics and coastal forcing vulnerability are higher for artificial coasts than natural coasts.
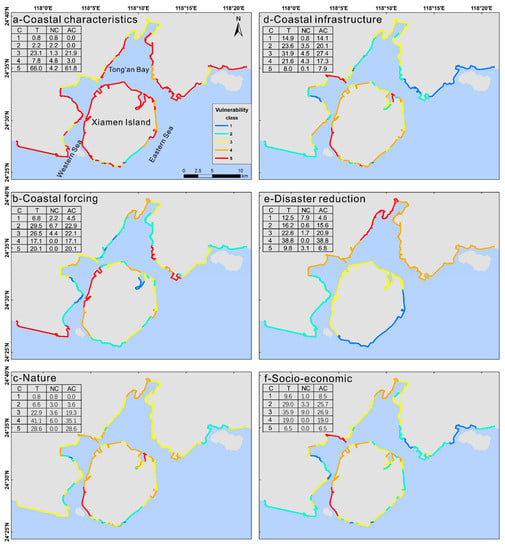
Figure 4.
Spatial distribution and proportion of coastal characteristics (a), coastal forcing (b), natural (c), coastal infrastructure (d), disaster reduction (e) and socio-economic (f) vulnerability classes. Note: C = class, T = total, NC = natural coast, AC = artificial coast.
3.2. Socio-Economic Vulnerability Distribution
The classes of socio-economic, coastal infrastructure and disaster reduction vulnerability include very low vulnerability (1), low vulnerability (2), medium vulnerability (3), high vulnerability (4) and very high vulnerability (5). Socio-economic factors include the two components of coastal infrastructure and disaster reduction. Three vulnerability distributions and classes account for the entire coast, as shown in Figure 4d–f. The differences in the socio-economic vulnerability classes between artificial and natural coasts are as follows: Classes 4 and 5 of socio-economic vulnerability are 6.5% and 19% of the entire coast, respectively, all of which are artificial coasts. The remaining classes of socio-economic vulnerability exhibit small differences between artificial and natural coasts. The differences between the coastal infrastructure vulnerability classes of artificial and natural coastal infrastructure are as follows: Class 5 coastal infrastructure vulnerability is 8% of the entire coast, and almost all of this class is artificial coast (7.9% of the entire coast). The remaining classes of coastal infrastructure vulnerability exhibit small differences between artificial and natural coasts. The differences between the disaster reduction vulnerability classes of artificial and natural coasts are very small. These results indicate that the differences in the socio-economic, coastal infrastructure and disaster reduction vulnerability classes between artificial and natural coasts are not obvious.
3.3. Distribution of Coastal Vulnerability to Erosion
The classes of coastal vulnerability to erosion include very low vulnerability (1), low vulnerability (2), medium vulnerability (3), high vulnerability (4) and very high vulnerability (5). The distributions and classes of coastal vulnerability to erosion in Xiamen are shown in Figure 5. The coastal vulnerability to erosion classes of artificial and natural coasts are as follows: The proportion of class 5 coastal vulnerability to erosion is 4.6% of the entire coast, all of which is artificial coast. The proportion of class 4 coastal vulnerability to erosion is 30.5% of the entire coast, of which almost all is artificial coast (30.4% of the entire coast). Classes 2 and 3 of coastal vulnerability to erosion exhibit small differences between artificial and natural coasts. The proportion of class 1 coastal vulnerability to erosion is 0.8% of the entire coast, all of which is natural coast. The coastal vulnerability to the erosion of Xiamen is mainly concentrated in classes 3, 4 and 5, and the sum of these three classes is 86.7% of the entire coast. The class of the artificial coast coastal vulnerability to erosion is higher than that of the natural coast overall.
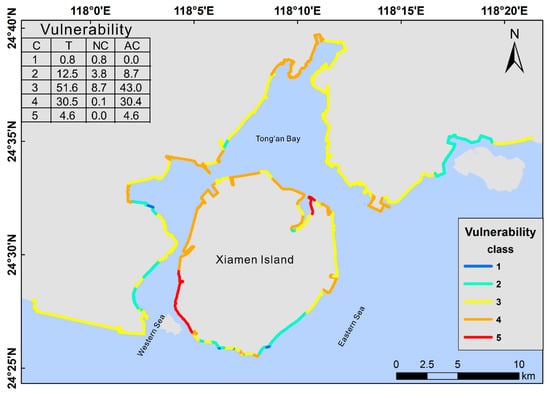
Figure 5.
Spatial distribution and proportion of Coastal vulnerability to erosion classes. Note: C = class, t = total, NC = natural coast, AC = artificial coast.
3.4. Indexes System of Coastal Vulnerability to Erosion
The classes of vulnerability include very low vulnerability (1), low vulnerability (2), medium vulnerability (3), high vulnerability (4) and very high vulnerability (5). The Xiamen coastal vulnerability to erosion assessment system is composed of 12 indexes, and it is based on the proportions of the statistical vulnerability classes of the entire Xiamen coast, of which more than 50% of coastal slopes and coastal natural habitats exhibit class 5 vulnerability; close to 50% of coastal buffer areas exhibit class 4 and 5 vulnerability; and the ratios of the other indexes of each class of vulnerability are more uniform. The class distribution ratios are shown in Figure 6.
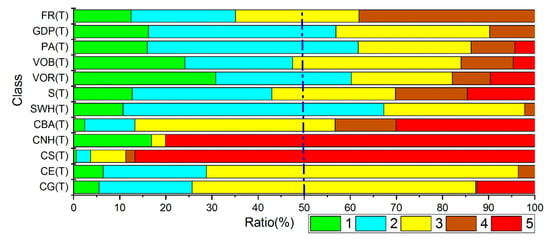
Figure 6.
Indexes of vulnerability class ratios. Note: CG = coastal geomorphology, CE = coastal elevation, CS = coastal slope, CNH = coastal natural habitat, CBA = coastal buffer ability, SWH = significant wave height, S = storms, VOR = value of roads, VOB = value of buildings, PA = population activity, GDP = GDP per capita, FR = fiscal revenue, C = class, T = total.
Based on the statistical vulnerability classes of the entire Xiamen natural and artificial coast, the vulnerability classes of the artificial coastal index are compared with those of the natural coast and divided into three categories: (1) In the coastal slope and coastal buffer ability indexes, the coastal vulnerability of the artificial coast is higher than that the natural coast, especially for the artificial coastal slope index, which exhibits class 5 vulnerability. (2) In the coastal geomorphology and coastal elevation indexes, the vulnerability of the artificial coast is lower than that of the natural coast. (3) The remaining vulnerability distribution indexes of the artificial and natural coastal classes are uniform. The indexes of the natural and artificial coastal vulnerability classes account for the total natural and artificial coastal ratios shown in Figure 7.
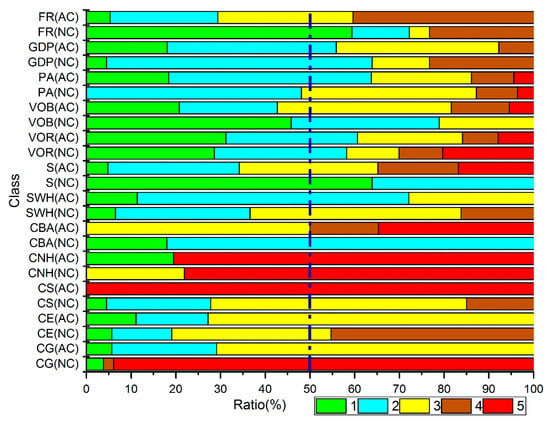
Figure 7.
Indexes of natural and artificial coastal vulnerability classes accounting for total natural and artificial coastal ratios. Note: NC = natural coast, AC = artificial coast.
4. Discussion
4.1. Characteristics and Applicability of the Index System
In China, the proportion of artificial coast relative to the entire coast is approximately 60% [47], and in Xiamen, artificial coast accounts for approximately 86.6% of the entire coast. This study uses the coastal buffer ability to reflect the state of artificial coastal erosion, which resolves the shortcomings of previous studies for the following reasons. (1) This method reflects the state of artificial coastal erosion and thus solves the problem that the speed of coastal retreat cannot represent the degree of artificial coastal erosion. (2) The parameters are simple and easy to obtain, whereas the coastal incision rate used in previous studies could reflect the state of coastal erosion, but could not be easily accessed. (3) The results directly reflect the coastal erosion state. The coastal buffer ability is the direct junction value of the artificial coast and sediment, although the change rate of the 10-m isobath can simply reflect the change in the artificial coastal incision rate. However, because the 10-m isobath is located at a distance from the coastline, its effect is worse than that of the coastal buffer ability. (4) Moreover, this index also reflects the anti-erosion capacity of the natural coast. According to the coastal geomorphology index, different artificial coastal design classifications reflect different anti-erosion abilities, and the potential loss caused by a storm is reflected by the different classifications of the artificial and natural coastal responses to the storm.
The coastal vulnerability to erosion assessment model aims to simplify numerous complex and interacting parameters and provide effective tools for coastal management, particularly in areas where the ratio of the artificial coast is high [17,82,83].
The index system for assessing the coastal vulnerability to erosion comprehensively encompasses both the natural and socio-economic aspects of coastal systems. In the index system presented in this study, the aspects of coastal geomorphology, coastal elevation, coastal slope, coastal natural habitat, significant wave height, values of roads and buildings, population activity, fiscal revenue and GDP per capita are frequently used [6,24,30,74].
This study represents a local-scale coastal vulnerability to erosion assessment; thus, the following adjustments to the index system were made. (1) The changes in tidal range and relative sea level rise in the study area are very small; thus, they cannot be used to differentiate among variations in evaluation units. (2) The extent of possible erosion effects must be determined, as according to previous studies [57,58,61,62,63], the range that may be affected by coastal erosion extends 100 m from the coastline landward. (3) Due to the low resolution of the road and building space in previous studies [30,74], this study uses eCognition Developer 8.7 to extract the GF-2 raster to obtain high-resolution data and the big data Baidu population density heat map to obtain high-resolution population activity density data. (4) The typhoon radius is larger than the study area; therefore, the indirect method is used to reflect the impact of typhoons on the coast.
It is easy to obtain data from this evaluation model. The calculation is simple and has good applicability. Most of the data in the index system are obtained by processing remote sensing images through eCognition Developer 8.7 (Trimble, Sunnyvale, CA, USA) and ArcGIS 10.4 (Environmental Systems Research Institute, Redlands, CA, USA). The field measurement data are easy to obtain, and comprehensive results are simple to calculate. However, high-spatial-resolution data are lacking in the two indexes of GDP per capita and fiscal revenue, and this gap should be improved. The storm impact index can only be used to relatively distinguish the potential impact on the evaluation unit caused by the storms. Although this index has some shortcomings, it can also roughly reflect the influence of storms. We will improve the index caused storms in a further study. The values of roads and buildings are obtained by simply calculating their relative values, and their absolute values are difficult to calculate.
4.2. Indexes Influencing the Class of Coastal Vulnerability to Erosion
An examination of the indexes influencing the classes of natural and artificial coastal vulnerability to erosion (Figure 7) shows that the natural vulnerability classes of artificial and natural coasts are significantly different. These coastal characteristics are mainly affected by the coastal slope and coastal buffer ability. The indexes affecting the vulnerability of artificial coasts are mainly concentrated in natural aspects, which are mainly affected by three coastal characteristic factors: The coastal buffer ability, coastal habitats and coastal slope. After the construction of an artificial coast, the equilibrium state of sediment is changed, which affects coastal processes and always leads to an increase in the erosion of the artificial coast [26,27,28]. Because the toe of an artificial coast will scour on a daily basis, the artificial coast will collapse under certain conditions. Landward areas from the artificial coast have a flat slope that is more vulnerable to erosion, which results in a 100% ratio of class 5 coastal slope vulnerability. In addition, the vulnerabilities of coastal natural habitats and coastal buffer areas in artificial areas are high. The construction of artificial coasts destroys the ecological environment [84,85]. The lack of natural habitats on the coast results in that proportion of class 5 vulnerability of the Xiamen artificial coastal natural habitat is 80.5% of the total artificial coast. The other component is the artificial planting of mangroves after the construction of an artificial coast. The coastal buffer ability, coastal slope and coastal natural habitats cause the total ratios of classes 4 and 5 of the vulnerability of the natural and coastal characteristics to account for 73.5% and 74.8%, respectively. Figure 7 shows that the overall coastal elevation and coastal geomorphology vulnerability on artificial coasts are lower than those on natural coasts. According to previous researches [25,64,86] on aspects of coastal geomorphology, artificial coasts are less vulnerable than natural coasts. The coastal erosion protection of the artificial coast also has advantages because a higher class of artificial coast defence corresponds to a higher coastal elevation, and higher elevation areas are not as easily affected by extreme events; however, overall, in the aspect of vulnerability of coastal characteristics, artificial coasts is higher than that of the natural coasts.
4.3. Support for Coastal Zone Management
Many roads and buildings are concentrated within 100 m from the Xiamen coastline. No distinction is observed between the coastal infrastructure vulnerability of artificial coasts and natural coasts. There are 74 of 93 evaluation units with buildings and 88 of 93 evaluation units with roads. These buildings and roads are at great risk due to coastal erosion. Indirect losses are difficult to estimate when roads are affected by coastal erosion, which causes not only road losses but also indirect losses due to road damage [87,88]. Building losses can also result in other indirect losses. Moreover, Xiamen’s economy has flourished due to development in recent years. In addition, tourism has continued to grow at a rate of 15% in the past six years, and tourism revenue exceeded 100 billion yuan in 2017 [87,88]. Due to the rapid development of the Xiamen coastal zone, there is a large amount of infrastructure within 100 m from the coastline. Standardized management needs to be implemented to reduce the losses caused by coastal erosion. New coastal development planning should avoid areas sensitive to coastal erosion and buildings should not be occupied within 100 m from the coastline.
Class 5 of the coastal vulnerability to erosion, which is all artificial coast, accounts for 4.6% of the entire coast. Class 4 of the coastal vulnerability to erosion, which is almost all artificial coast (30.4% of the entire coast), accounts for 30.5% of the entire coast. Class 1 of the coastal vulnerability to erosion, which is all natural coast, accounts for 0.8% of the entire coast. Overall, the coastal vulnerability to erosion classes of artificial coasts is higher than those of natural coasts. These differences mainly occur because artificial coastal construction causes the massive destruction of coastal habitats and the alteration of coastal processes leads to the increased erosion of artificial coasts. These characteristics lead to the high vulnerability of coasts and potential risks of hard defence erosion. Ecological means, such as ecological seawalls (i.e., mangroves), which can dissipate wave energy, and beach nourishment, which can restore the natural properties of beaches [89], can reduce the coastal vulnerability to erosion.
5. Conclusions
Based on the characteristics of artificial coasts and the local coastal vulnerability to erosion, this study constructs a holistic local coastal vulnerability to erosion assessment index system that includes two natural and socio-economic aspects. A new index (coastal buffer ability) and previously existing indexes were used to assess the coastal vulnerability to erosion in Xiamen. The evaluation results were displayed using the GIS approach. The following main conclusions are obtained.
(1) The evaluation results show that the coastline of Xiamen is characterized by very low, low, medium, high and very high classes of coastal vulnerability to erosion. The classes of coastal vulnerability to erosion are mainly medium, high and very high. The very high coastal vulnerability to erosion class, which is all artificial coast, accounts for 4.6% of the entire coast. The very low coastal vulnerability to erosion class, which is all natural coast, accounts for 0.8% of the entire coast. Overall, the coastal vulnerability to erosion classes of artificial coast is higher than those of natural coast.
(2) These results indicate that the differences between vulnerability classes of artificial and natural coasts are mainly natural and coastal characteristics aspects. The coastal buffer capacity, coastal natural habitat and coastal slope are the core factors leading to the differences between the vulnerability classes of natural and artificial coasts. Because the high and very high coastal vulnerability to erosion classes of the artificial coast account for more than half of the entire coast, hard defence is risky. These coastal zones could be protected by ecological measures. The Xiamen coastal zone is highly developed. The coast has a large amount of infrastructure, which is at great risk due to coastal erosion.
(3) The results of coastal vulnerability to erosion are shown on ArcGIS maps, and they are basically in line with those observed in reality. These maps also can also be used by government administrators, local populations and other stakeholders to improve and design new coastal management policies to protect the coastal zone. The local coastal vulnerability to erosion assessment index system presented here provides a simple and convenient approach for coastal disaster risk reduction management and coastal planning for sustainable development, and can it be applied to the assessment of local coastal vulnerability to erosion in areas with high proportions of artificial coasts.
Author Contributions
Z.-T.Z. conceived, designed and performed the designs and drafted this paper, C.C., H.-S.Q., G.L. helped performed the field measurements, F.C., S.-L.C., D.-Q.G. and A.-P.F. reviewed and edited this paper.
Funding
This research was funded by the National Key Research and Development Program of China (No. 2017YFC0405503), the National Natural Science Foundation of China (NSFC) (No. U1706214), projects Marine Geological Hazard Investigation and Research (908-01-ZH2) and Coastal Erosion Assessment and Control (908-02-03-04).
Acknowledgments
We thank Huimei Cao, Jixiang Zheng, Jun Zhu for field survey and data processing. We thank American Journal Experts (AJE) for English language editing. This manuscript was edited for the English language by American Journal Experts (AJE). We thank Dr. Jiayi Fang for reviewing and editing this paper. We would also thank the reviewers for their insightful and constructive comments.
Conflicts of Interest
The authors declare no conflict of interest.
References
- Nicholls, R.J.; Wong, P.P.; Burkett, V.; Codignotto, J.; Hay, J.; McLean, R.; Ragoonaden, S.; Woodroffe, C.D.; Abuodha, P.; Arblaster, J. Coastal systems and low-lying areas. 2007. [Google Scholar]
- McGranahan, G.; Balk, D.; Anderson, B. The rising tide: Assessing the risks of climate change and human settlements in low elevation coastal zones. Environ. Urban 2007, 19, 17–37. [Google Scholar] [CrossRef]
- Masselink, G.; Hughes, M.G. An Introduction to Coastal Processes and Geomorphology; Routledge: Abingdon-on-Thames, UK, 2014. [Google Scholar]
- Lins-de-Barros, F.M. Integrated coastal vulnerability assessment: A methodology for coastal cities management integrating socioeconomic, physical and environmental dimensions—Case study of Regido dos Lagos, Rio de Janeiro, Brazil. Ocean Coast. Manag. 2017, 149, 1–11. [Google Scholar] [CrossRef]
- Kantamaneni, K.; Phillips, M.; Thomas, T.; Jenkins, R. Assessing coastal vulnerability: Development of a combined physical and economic index. Ocean Coast. Manag. 2018, 158, 164–175. [Google Scholar] [CrossRef]
- Arkema, K.K.; Guannel, G.; Verutes, G.; Wood, S.A.; Guerry, A.; Ruckelshaus, M.; Kareiva, P.; Lacayo, M.; Silver, J.M. Coastal habitats shield people and property from sea-level rise and storms. Nat. Clim. Chang. 2013, 3, 913. [Google Scholar] [CrossRef]
- Donchyts, G.; Baart, F.; Winsemius, H.; Gorelick, N.; Kwadijk, J.; van de Giesen, N. Earth’s surface water change over the past 30 years. Nat. Clim. Chang. 2016, 6, 810. [Google Scholar] [CrossRef]
- Shepard, C.C.; Agostini, V.N.; Gilmer, B.; Allen, T.; Stone, J.; Brooks, W.; Beck, M.W. Assessing future risk: Quantifying the effects of sea level rise on storm surge risk for the southern shores of Long Island, New York. Nat. Hazards 2011, 60, 727–745. [Google Scholar] [CrossRef]
- Leatherman, S.P.; Zhang, K.; Douglas, B.C. Sea level rise shown to drive coastal erosion. Eos Trans. Am. Geophys. Union 2000, 81, 55–57. [Google Scholar] [CrossRef]
- Masselink, G.; Russell, P. Impacts of climate change on coastal erosion. MCCIP Sci. Rev. 2013, 2013, 71–86. [Google Scholar]
- Zhang, K.; Douglas, B.C.; Leatherman, S.P. Global warming and coastal erosion. Clim. Chang. 2004, 64, 41–58. [Google Scholar] [CrossRef]
- Bird, E. Coastline Changes. A Global Review; Wiley: Hoboken, NJ, USA, 1985. [Google Scholar]
- Mentaschi, L.; Vousdoukas, M.I.; Pekel, J.-F.; Voukouvalas, E.; Feyen, L. Global long-term observations of coastal erosion and accretion. Sci. Rep. 2018, 8, 12876. [Google Scholar] [CrossRef]
- Hinkel, J.; Nicholls, R.J.; Vafeidis, A.T.; Tol, R.S.J.; Avagianou, T. Assessing risk of and adaptation to sea-level rise in the European Union: An application of diva. Mitig. Adapt. Strateg. Glob. Chang. 2010, 15, 703–719. [Google Scholar] [CrossRef]
- Mujabar, P.S.; Chandrasekar, N. Coastal erosion hazard and vulnerability assessment for southern coastal Tamil Nadu of India by using remote sensing and gis. Nat. Hazards 2013, 69, 1295–1314. [Google Scholar] [CrossRef]
- Parthasarathy, A.; Natesan, U. Coastal vulnerability assessment: A case study on erosion and coastal change along Tuticorin, Gulf of Mannar. Nat. Hazards 2015, 75, 1713–1729. [Google Scholar] [CrossRef]
- Alexandrakis, G.; Poulos, S. An holistic approach to beach erosion vulnerability assessment. Sci. Rep. 2014, 4, 6078. [Google Scholar] [CrossRef] [PubMed]
- Nel, R.; Campbell, E.E.; Harris, L.; Hauser, L.; Schoeman, D.S.; McLachlan, A.; du Preez, D.R.; Bezuidenhout, K.; Schlacher, T.A. The status of sandy beach science: Past trends, progress, and possible futures. Estuar. Coast. Shelf Sci. 2014, 150, 1–10. [Google Scholar] [CrossRef]
- Cai, F.; Su, X.; Liu, J.; Li, B.; Lei, G. Coastal erosion in China under the condition of global climate change and measures for its prevention. Prog. Nat. Sci. 2009, 19, 415–426. [Google Scholar] [CrossRef]
- Theuerkauf, E.J.; Rodriguez, A.B.; Fegley, S.R.; Luettich, R.A. Sea level anomalies exacerbate beach erosion. Geophys. Res. Lett. 2014, 41, 5139–5147. [Google Scholar] [CrossRef]
- Zanetti, V.; de Sousa Junior, W.; De Freitas, D. A climate change vulnerability index and case study in a Brazilian coastal city. Sustainability 2016, 8, 811. [Google Scholar] [CrossRef]
- Hinkel, J.; Nicholls, R.J.; Tol, R.S.J.; Wang, Z.B.; Hamilton, J.M.; Boot, G.; Vafeidis, A.T.; McFadden, L.; Ganopolski, A.; Klein, R.J.T. A global analysis of erosion of sandy beaches and sea-level rise: An application of diva. Glob. Planet. Chang. 2013, 111, 150–158. [Google Scholar] [CrossRef]
- Sousa, P.H.G.O.; Siegle, E.; Tessler, M.G. Vulnerability assessment of massaguaçú beach (SE Brazil). Ocean Coast. Manag. 2013, 77, 24–30. [Google Scholar] [CrossRef]
- Luo, S.; Wang, H.; Cai, F. An integrated risk assessment of coastal erosion based on fuzzy set theory along Fujian coast, southeast China. Ocean Coast. Manag. 2013, 84, 68–76. [Google Scholar] [CrossRef]
- Tahri, M.; Maanan, M.; Maanan, M.; Bouksim, H.; Hakdaoui, M. Using fuzzy analytic hierarchy process multi-criteria and automatic computation to analyse coastal vulnerability. Prog. Phys. Geogr. 2017, 41, 268–285. [Google Scholar] [CrossRef]
- Anthony, E.J. Natural and artificial shores of the French Riviera: An analysis of their interrelationship. J. Coast. Res. 1994, 10, 48–58. [Google Scholar]
- Bernatchez, P.; Fraser, C. Evolution of coastal defence structures and consequences for beach width trends, Québec, Canada. J. Coast. Res. 2012, 28, 1550–1566. [Google Scholar] [CrossRef]
- Luo, S.; Cai, F.; Liu, H.; Lei, G.; Qi, H.; Su, X. Adaptive measures adopted for risk reduction of coastal erosion in the People’s Republic of China. Ocean Coast. Manag. 2015, 103, 134–145. [Google Scholar] [CrossRef]
- Kienberger, S.; Blaschke, T.; Zaidi, R.Z. A framework for spatio-temporal scales and concepts from different disciplines: The ‘vulnerability cube’. Nat. Hazards 2012, 68, 1343–1369. [Google Scholar] [CrossRef]
- McLaughlin, S.; Cooper, J.A.G. A multi-scale coastal vulnerability index: A tool for coastal managers? Environ. Hazards 2010, 9, 233–248. [Google Scholar] [CrossRef]
- Di Luccio, D.; Benassai, G.; Di Paola, G.; Rosskopf, C.; Mucerino, L.; Montella, R.; Contestabile, P. Monitoring and modelling coastal vulnerability and mitigation proposal for an archaeological site (Kaulonia, Southern Italy). Sustainability 2018, 10, 2017. [Google Scholar] [CrossRef]
- He, B.-J.; Zhao, D.-X.; Zhu, J.; Darko, A.; Gou, Z.-H. Promoting and implementing urban sustainability in china: An integration of sustainable initiatives at different urban scales. Habitat Int. 2018, 82, 83–93. [Google Scholar] [CrossRef]
- Nguyen, T.T.X.; Bonetti, J.; Rogers, K.; Woodroffe, C.D. Indicator-based assessment of climate-change impacts on coasts: A review of concepts, methodological approaches and vulnerability indices. Ocean Coast. Manag. 2016, 123, 18–43. [Google Scholar] [CrossRef]
- Garcia-Ayllon, S. Long-term gis analysis of seaside impacts associated to infrastructures and urbanization and spatial correlation with coastal vulnerability in a mediterranean area. Water 2018, 10, 1642. [Google Scholar] [CrossRef]
- Fitton, J.M.; Hansom, J.D.; Rennie, A.F. A national coastal erosion susceptibility model for Scotland. Ocean Coast. Manag. 2016, 132, 80–89. [Google Scholar] [CrossRef]
- Ashraful Islam, M.; Mitra, D.; Dewan, A.; Akhter, S.H. Coastal multi-hazard vulnerability assessment along the Ganges deltaic coast of Bangladesh—A geospatial approach. Ocean Coast. Manag. 2016, 127, 1–15. [Google Scholar] [CrossRef]
- Gornitz, V.; Kanciruk, P. Assessment of Global Coastal Hazards from Sea Level Rise; Oak Ridge National Lab.: Oak Ridge, TN, USA, 1989.
- Gornitz, V. Global coastal hazards from future sea level rise. Palaeogeogr. Palaeoclimatol. Palaeoecol. 1991, 89, 379–398. [Google Scholar] [CrossRef]
- Tribbia, J.; Moser, S.C. More than information: What coastal managers need to plan for climate change. Environ. Sci. Policy 2008, 11, 315–328. [Google Scholar] [CrossRef]
- Bonetti, J.; da Fontoura Klein, A.H.; Muler, M.; De Luca, C.B.; da Silva, G.V.; Toldo, E.E.; González, M. Spatial and numerical methodologies on coastal erosion and flooding risk assessment. In Coastal Hazards; Finkl, C.W., Ed.; Springer: Dordrecht, The Netherlands, 2013; pp. 423–442. [Google Scholar]
- Tintoré, J.; Medina, R.; Gómez-Pujol, L.; Orfila, A.; Vizoso, G. Integrated and interdisciplinary scientific approach to coastal management. Ocean Coast. Manag. 2009, 52, 493–505. [Google Scholar] [CrossRef]
- Fang, J.; Liu, W.; Yang, S.; Brown, S.; Nicholls, R.J.; Hinkel, J.; Shi, X.; Shi, P. Spatial-temporal changes of coastal and marine disasters risks and impacts in mainland China. Ocean Coast. Manag. 2017, 139, 125–140. [Google Scholar] [CrossRef]
- Cheng, R. Coastal erosion and protection measures in China. J. Soil Water Conserv. 2000, 14, 44–47. [Google Scholar]
- Xia, D.; Wang, W. Coastal erosion in China. Acta Geogr. Sin. 1993, 48, 468–476. [Google Scholar]
- Ji, Z. The characteristics of coastal erosion and cause of erosion. J. Nat. Disasters 1996, 5, 65–75. [Google Scholar]
- SOA. China Maritime Disaster Bulletin; China Ocean Press: Beijing, China, 2017. [Google Scholar]
- Ma, Z.; Melville, D.S.; Liu, J.; Chen, Y.; Yang, H.; Ren, W.; Zhang, Z.; Piersma, T.; Li, B. Rethinking China’s new great wall. Science 2014, 346, 912–914. [Google Scholar] [CrossRef] [PubMed]
- Su, M.; Peng, B. Integrating values of ecosystem services into decision making in coastal management in xiamen. Ocean Coast. Manag. 2018. [Google Scholar] [CrossRef]
- Ma, D.; Fang, Q.; Liao, S. Applying the ocean health index framework to the city level: A case study of Xiamen, China. Ecol. Indic. 2016, 66, 281–290. [Google Scholar] [CrossRef]
- XCSB. Yearbook of Xiamen Special Economic Zone in 2018; China Statistics Press: Beijing, China, 2018.
- TIO SOA. Coastal Erosion Assessment and Control: Assessment System and Model of Coastal Erosion; TIO SOA: Xiamen, China, 2010; p. 178. [Google Scholar]
- Thia-Eng, C.; Yu, H.; Guoqiang, C. From sectoral to integrated coastal management: A case in Xiamen, China. Ocean Coast. Manag. 1997, 37, 233–251. [Google Scholar] [CrossRef]
- Xu, T.; Zhang, M.; Gao, L.; Yang, B.; Shi, L. Development and application of a comprehensive ecological risk assessment indicator system in Xiamen, China. Int. J. Sustain. Dev. World Ecol. 2018, 25, 468–476. [Google Scholar] [CrossRef]
- Xue, X.; Hong, H.; Charles, A.T. Cumulative environmental impacts and integrated coastal management: The case of Xiamen, China. J. Environ. Manag. 2004, 71, 271–283. [Google Scholar] [CrossRef] [PubMed]
- Marchand, M. Modelling Coastal Vulnerability: Design and Evaluation of a Vulnerability Model for Tropical Storms and Floods; IOS Press: Amsterdam, The Netherlands, 2009; Volume 5. [Google Scholar]
- Bevacqua, A.; Yu, D.; Zhang, Y. Coastal vulnerability: Evolving concepts in understanding vulnerable people and places. Environ. Sci. Policy 2018, 82, 19–29. [Google Scholar] [CrossRef]
- Kantamaneni, K.; Du, X.; Aher, S.; Singh, R. Building blocks: A quantitative approach for evaluating coastal vulnerability. Water 2017, 9, 905. [Google Scholar] [CrossRef]
- Fraser, C.; Bernatchez, P.; Dugas, S. Development of a GIS coastal land-use planning tool for coastal erosion adaptation based on the exposure of buildings and infrastructure to coastal erosion, Québec, Canada. Geomat. Nat. Hazards Risk 2017, 8, 1103–1125. [Google Scholar] [CrossRef]
- Guneralp, B.; Guneralp, I.; Castillo, C.R.; Filippi, A.M. Land change in the Mission-Aransas Coastal region, Texas: Implications for coastal vulnerability and protected areas. Sustainability 2013, 5, 4247–4267. [Google Scholar] [CrossRef]
- FPSB. Yearbook of Fujian Province in 2017; China Statistics Press: Beijing, China, 2017.
- Denner, K.; Phillips, M.R.; Jenkins, R.E.; Thomas, T. A coastal vulnerability and environmental risk assessment of Loughor Estuary, South Wales. Ocean Coast. Manag. 2015, 116, 478–490. [Google Scholar] [CrossRef]
- Liquete, C.; Zulian, G.; Delgado, I.; Stips, A.; Maes, J. Assessment of coastal protection as an ecosystem service in Europe. Ecol. Indic. 2013, 30, 205–217. [Google Scholar] [CrossRef]
- Williams, A.T.; Rangel-Buitrago, N.; Pranzini, E.; Anfuso, G. The management of coastal erosion. Ocean Coast. Manag. 2018, 156, 4–20. [Google Scholar] [CrossRef]
- Tallis, H.; Ricketts, T.; Guerry, A.; Wood, S.; Sharp, R.; Nelson, E.; Ennaanay, D.; Wolny, S.; Olwero, N.; Vigerstol, K. Invest 2.3.0 User’s Guide: Integrated Valuation of Ecosystem Services and Tradeoffs; The Natural Capital Project; Stanford University: Stanford, CA, USA, 2011. [Google Scholar]
- Li, X.; Zhou, Y.X.; Tian, B.; Kuang, R.Y.; Wang, L.H. Gis-based methodology for erosion risk assessment of the muddy coast in the Yangtze Delta. Ocean Coast. Manag. 2015, 108, 97–108. [Google Scholar] [CrossRef]
- Cai, F.; Cao, H.-M.; Su, X.-Z.; Dong, X.X. Analysis on morphodynamics of sandy beaches in South China. J. Coast. Res. 2007, 23, 236–246. [Google Scholar]
- USACE. The Coastal Engineering Manual (CEM), Water Wave Mechanics, Chapter 1, Part II. 2008. Available online: http://www.a-jacks.com/coastal/generalinfo/cem/PartII_CoastalHydrodynamics/II-1_Water_Wave_Mechanics.pdf (accessed on 27 November 2018).
- Amante, C. Etopo1 1 Arc-Minute Global Relief Model: Procedures, Data Sources and Analysis. 2009. Available online: http://www. ngdc.noaa.gov/mgg/global/global.html (accessed on 20 October 2018).
- Kantamaneni, K. Coastal infrastructure vulnerability: An integrated assessment model. Nat. Hazards 2016, 84, 139–154. [Google Scholar] [CrossRef]
- Trimble. eCognition Developer 8.7 Reference Book; Trimble: Munich Germany, 2011. [Google Scholar]
- Gornitz, V. Vulnerability of the east coast, USA to future sea level rise. J. Coast. Res. 1990, 1, 201–237. [Google Scholar]
- Peña-Alonso, C.; Fraile-Jurado, P.; Hernández-Calvento, L.; Pérez-Chacón, E.; Ariza, E. Measuring geomorphological vulnerability on beaches using a set of indicators (gvi): A tool for management. J. Environ. Manag. 2017, 204, 230–245. [Google Scholar] [CrossRef]
- Serafim, M.B.; Siegle, E.; Corsi, A.C.; Bonetti, J. Coastal vulnerability to wave impacts using a multi-criteria index: Santa Catarina (Brazil). J. Environ. Manag. 2019, 230, 21–32. [Google Scholar] [CrossRef]
- Tedim, F.; Garcin, M.; Vinchon, C.; Carvalho, S.; Desramaut, N.; Rohmer, J. Chapter 7—Comprehensive vulnerability assessment of forest fires and coastal erosion: Evidences from case-study analysis in Portugal. In Assessment of Vulnerability to Natural Hazards; Birkmann, J., Kienberger, S., Alexander, D.E., Eds.; Elsevier: Amsterdam, The Netherlands, 2014; pp. 149–177. [Google Scholar]
- Saaty, R.W. The analytic hierarchy process—What it is and how it is used. Math. Model. 1987, 9, 161–176. [Google Scholar] [CrossRef]
- Saaty, T.L. A scaling method for priorities in hierarchical structures. J. Math. Psychol. 1977, 15, 234–281. [Google Scholar] [CrossRef]
- Saaty, T.L. Rank from comparisons and from ratings in the analytic hierarchy/network processes. Eur. J. Oper. Res. 2006, 168, 557–570. [Google Scholar] [CrossRef]
- Shannon, C.E. A mathematical theory of communication. Bell Syst. Tech. J. 1948, 27, 379–423. [Google Scholar] [CrossRef]
- Zhang, X.; Wang, C.; Li, E.; Xu, C. Assessment model of ecoenvironmental vulnerability based on improved entropy weight method. Sci. World J. 2014, 2014, 797814. [Google Scholar] [CrossRef] [PubMed]
- Chi, Y.; Zheng, W.; Shi, H.; Sun, J.; Fu, Z. Spatial heterogeneity of estuarine wetland ecosystem health influenced by complex natural and anthropogenic factors. Sci. Total Environ. 2018, 634, 1445–1462. [Google Scholar] [CrossRef] [PubMed]
- McLaughlin, S.; McKenna, J.; Cooper, J.A.G. Socio-economic data in coastal vulnerability indices: Constraints and opportunities. J. Coast. Res. 2002, 36, 487–497. [Google Scholar] [CrossRef]
- Bagdanavičiūtė, I.; Kelpšaitė, L.; Soomere, T. Multi-criteria evaluation approach to coastal vulnerability index development in micro-tidal low-lying areas. Ocean Coast. Manag. 2015, 104, 124–135. [Google Scholar] [CrossRef]
- Satta, A.; Snoussi, M.; Puddu, M.; Flayou, L.; Hout, R. An index-based method to assess risks of climate-related hazards in coastal zones: The case of Tetouan. Estuar. Coast. Shelf Sci. 2016, 175, 93–105. [Google Scholar] [CrossRef]
- Huang, Y.; Zhang, T.; Wu, W.T.; Zhou, Y.X.; Tian, B. Rapid risk assessment of wetland degradation and loss in low-lying coastal zone of Shanghai, China. Hum. Ecol. Risk Assess. 2017, 23, 82–97. [Google Scholar] [CrossRef]
- Wu, W.; Yang, Z.; Tian, B.; Huang, Y.; Zhou, Y.; Zhang, T. Impacts of coastal reclamation on wetlands: Loss, resilience, and sustainable management. Estuar. Coast. Shelf Sci. 2018, 210, 153–161. [Google Scholar] [CrossRef]
- Maanan, M.; Maanan, M.; Rueff, H.; Adouk, N.; Zourarah, B.; Rhinane, H. Assess the human and environmental vulnerability for coastal hazard by using a multi-criteria decision analysis. Hum. Ecol. Risk Assess. Int. J. 2018, 24, 1642–1658. [Google Scholar] [CrossRef]
- Dawson, D.; Shaw, J.; Roland Gehrels, W. Sea-level rise impacts on transport infrastructure: The notorious case of the coastal railway line at Dawlish, England. J. Transp. Geogr. 2016, 51, 97–109. [Google Scholar] [CrossRef]
- Fitton, J.M.; Hansom, J.D.; Rennie, A.F. A method for modelling coastal erosion risk: The example of Scotland. Nat. Hazards 2018, 91, 931–961. [Google Scholar] [CrossRef]
- Luo, S.; Liu, Y.; Jin, R.; Zhang, J.; Wei, W. A guide to coastal management: Benefits and lessons learned of beach nourishment practices in china over the past two decades. Ocean Coast. Manag. 2016, 134, 207–215. [Google Scholar] [CrossRef]
© 2018 by the authors. Licensee MDPI, Basel, Switzerland. This article is an open access article distributed under the terms and conditions of the Creative Commons Attribution (CC BY) license (http://creativecommons.org/licenses/by/4.0/).