Concept Paper

Walkable Environments and Healthy Urban Moves: Urban Context Features Assessment Framework Experienced in Milan

1
Dipartimento di Architettura, Ingegneria delle Costruzioni e Ambiente Costruito, Politecnico di Milano, 20133 Milan, Italy
2
Dipartimento di Scienze Mediche, Chirurgiche e Sperimentali, Università degli Studi di Sassari, 07100 Sassari, Italy
3
Dipartimento di Ingegneria Civile Edile e Ambientale, Sapienza Università di Roma, 00184 Rome, Italy
*
Authors to whom correspondence should be addressed.
Sustainability 2019, 11(10), 2778; https://doi.org/10.3390/su11102778
Submission received: 3 March 2019 / Revised: 30 April 2019 / Accepted: 8 May 2019 / Published: 15 May 2019
(This article belongs to the Special Issue Walkable living environments)

Abstract

:
Recent studies in public health have focused on determining the influences of the built environment on the population’s physical and mental health status. In order to promote active transport and physical activity, considered favorable behavior for the prevention non-communicable diseases (NCDs) such as obesity, it is necessary to reduce the negative effects of the built environment and develop positive ones, such as, for example, a walkable urban space. The aim of the research is to define a city’s walkability assessment framework capable of highlighting points of strength and weakness in its urban environment. All of the aspects that have a direct influence (evidence-based) on fostering the adoption of healthy lifestyles or promoting active transport as a strategy to increase the level of physical activity due to the existence of daily urban travel should be considered. After conducting a literature review aimed at identifying all of the existing assessment tools, 20 research studies were examined in detail. The new evaluation method arises from the comparison and critical selection of the various qualitative–quantitative indicators found, integrated into a multi-criteria analysis structure of dual-scale survey, with reference to walkability and paying attention to those indicators that have implications on health promotion. The new assessment framework, named Milano Walkability Measurement (MWM), is applicable in different urban contexts and was tested in two different areas of Milan. The Macro dimension (i.e., Density, Diversity, and Design criteria) refers to the urban scale and examines the city from a top view. It describes quantitatively the overall urban factors (urban area size equal to 1.5 Km2; typology of data: archival). The Micro dimension (i.e., Usefulness, Safeness, Comfort, and Aesthetics criteria) investigates the city at the street scale level. It describes qualitatively features of the outdoor spaces (road length of about 500/700 mt; typology of data: observational). Finally, the framework was weighted by comparison with a panel of experts. The expected results were reflected in the design recommendations based on the collected qualitative-quantitative data. The developed assessment method brings innovative criteria such as the multi-scaling assessment phase (Macro and Micro) and the ability to take into consideration aspects that according to the literature have relationships with health promotion linked to the improvement of a healthy lifestyle, related to daily active transportation choices. The design recommendations are useful both to policy-makers, to make evidence-based specific choices, and to designers, to understand what aspects of the urban environment must be improved or implemented in order to promote a walkable city.

1. Introduction

This research is related to the Urban Health discipline and it aims to investigate the existing correlations between the urban environment and the level of cyclist and pedestrian accessibility of citeis, in favor of an increase in active transportation choices [1].
Physical activity (PA) has held a key role in this research since the “Toronto Charter for Physical Activity: A Global Call for Action” was established in 2010. This defines the importance of PA since it “promotes wellbeing, physical and mental health, prevents disease […] Communities supporting health-enhancing physical activity, in a variety of accessible and affordable ways, across different settings and throughout life, can achieve many of these benefits” [2]. This definition emphasizes the importance of PA in the pursuit of individual we-llbeing and health, especially in relation to the transition of chronic diseases’ risk factors, which have shifted over time from traditional risks—mainly from domestic and indoor causes—to modern risks (e.g., sedentary lifestyles and obesity). Physical inactivity is included in common modifiable risk factors of chronic diseases [3]. Kohl et al. [4] argue that PA should be a primary target for public health policy for disease prevention and health promotion, since physical inactivity is the fourth leading cause of death worldwide. Furthermore, available data suggest that 31% of the world’s population is not meeting the minimum recommendations for PA and that in 2009 the prevalence of inactivity was 17% [5]. These recommendations are provided by the World Health Organization (WHO), defined for the different phases of life, and aimed at disease prevention, as an instrument providing directions for national health policies and for healthcare systems.
For instance, adults aged 18–64 should partake in at least 150 min of moderate–intensive aerobic PA throughout the week [6]. In addition to the correlations between PA and health, the other aspect to consider concerns the impact of the urban environment on the encouragement of active behaviour, and consequently, a healthier lifestyle. In fact, the built environment is an important factor that contributes to the persistence of inequalities in health [7,8]. This argument has been linked to the increase in the urban population which currently accounts for 54% of the global population and which may rise to 70% by 2050 [9].
Walking is a strongly recommended form of physical activity, not only for its recognized benefits in terms of the physical health of the individual, but also because it represents an environmentally friendly transport option, suitable for every age group. Walking is a low-impact, free activity, as well as being the most sustainable transportation option from an environmental point of view [10,11].
Conversely, vehicular traffic, in addition to being one of the main pollution sources in our cities, represents one of the major risk factors for accidents involving various categories of users, including pedestrians [12,13]. It immediately appears clear that one of the reasons why citizens avoid walking routinely is given by the lack of security regarding their safety; accordingly, improving pedestrian safety in the urban environment could support a more active lifestyle, leading to a decrease in incidence and mortality associated with chronic disorders [14,15,16,17,18,19,20,21,22,23,24,25,26].
The link between urban forms, increased physical activity, and health benefits has been clearly demonstrated [27,28]. Several studies have shown that the behavior of pedestrians and the choice of route are also influenced by the qualities of urban design [29,30].
In these terms, the urban environment plays an important role in fulfilling WHO’s recommendations, since it could encourage people to be more active by its design features. These evidence-based notions, demonstrating the correlation between urban environment characteristics and health, are difficult to achieve, since they require a deeper analysis of the positive or negative effects urban spaces have directly on population health, such as longitudinal studies. However, there is a good availability of reviews and studies analyzing the influence of different environmental aspects in direct relation to their impact on health [31,32]. The main categories and conditions of the urban environment influencing health are: density (including transport and food environment), land use mix (including green spaces and building use), and urban design (concerning aesthetics, safety, and cleanliness of the neighborhoods) [33,34,35,36]. The strengthening of each of these categories has been linked to an improvement in population well-being or to a promotion of more active behaviors [37,38,39,40,41,42,43].
In this scenario, the role of city planners and policy-makers becomes essential in fostering the adoption of healthy behavior [44], especially that which concerns the urban environment’s predisposition to become an active part of the processes of health promotion and disease prevention [45], encouraging the choice of active and sustainable transport modes. Active transport is a concept fully represented by the term walkability [27,46,47,48,49]. The term “walkable” refers to a place suitable for walking, that can be traveled, crossed, and covered by walking or cycling. Nevertheless, these notions are unable to cover the entire scope of the topic, which is related to a wider and multi-thematic field that embodies several different issues of people’s behavior and lifestyle in the environment in which they live [50]. Thus, all of the urban environment’s features that are related to walkability acquire importance in the process of the analysis of urban contexts, in order to evaluate the grade of accessibility for pedestrians and cyclists to the city and the underpinning of active transport [51]. These features become crucial in the analysis of big cities like Milan, since it is afflicted by high car dependency. In fact, in 2012, 60% of all movements within the municipality were made by private cars and the average distance covered within the city was 4 km (easily accessible by bike) [52].
Environmental factors related to the urban context that underpin walkability, thus healthier behaviours, are both qualitative and quantitative. Consequently, this research aims to formulate a qualitiative–quantitative method able to embody the theme without omitting either of these two aspects [53].
For these reasons, the final purpose of the research is to develop an evidence-based assessment framework to evaluate cyclist–pedestrian accessibility, in order to analyze the urban environment in relation to walkability, providing objective outcomes to address policy-makers, fostering alternative bottom-up design practices and enhancing the urban factors encouraging active behaviours.

2. The Milan Walkability Measurement (MWM)

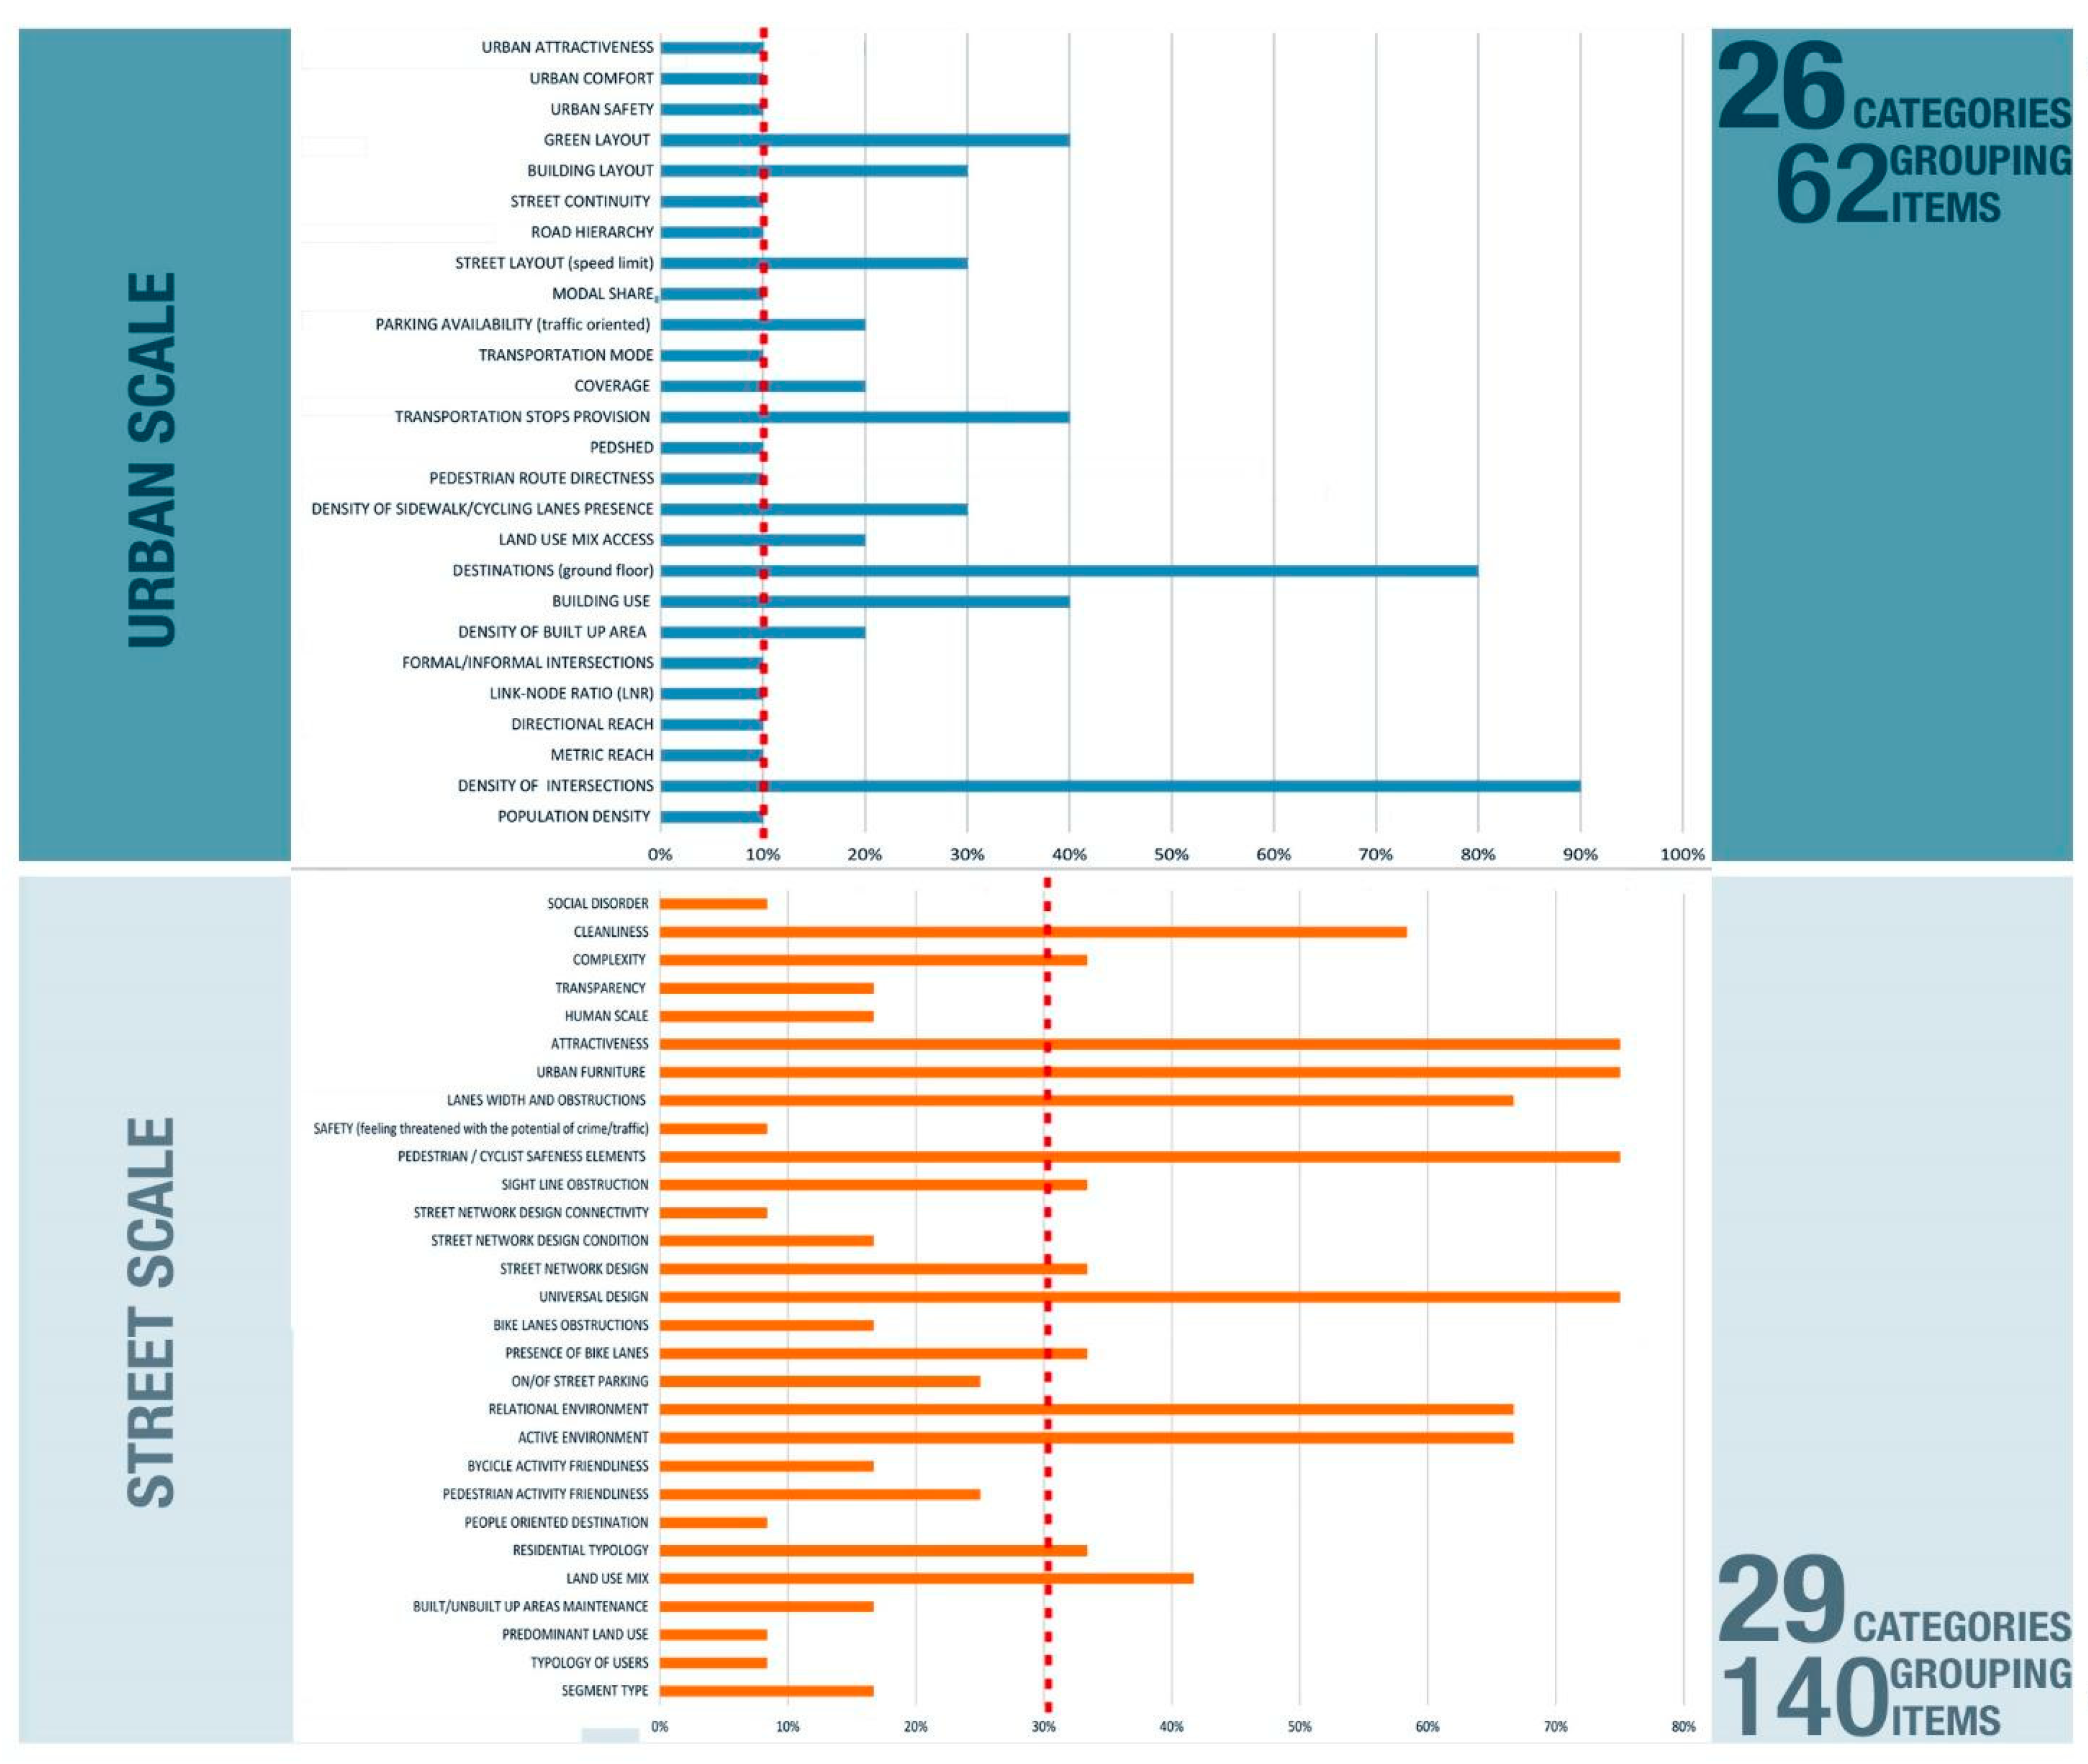
2.1. Literature Overview

A scientific approach is needed to deal with complex problems that include multiple factors of various natures (both qualitative and quantitative), which refer to different scales (urban area and street level). The research methodology was based on the construction of a theoretical background, ending with the drafting of a literature review aimed at finding tools and items to evaluate urban factors related to walkability, and to be included in the structure of the new proposed framework. The literature search, using PubMed, provided 88 papers, to be added to eight coming from grey literature. The first exclusion criteria “not relevant title” returned 40 papers in addition to the eight from the scientific literature searches. These 48 papers were reviewed by analyzing their abstracts in order to exclude all publications that did not match the purpose of the research, supplying 22 papers. Finally, these 22 papers were reviewed on the basis of their complete text, returning a selection of 17 papers, which provide tools investigating and evaluating the urban environment in relation to walkability, for a final total of 20 different tools (Table 1).
Table 1 shows the 20 different tools observed which can be classified in:
-
Perceived tools (Neighborhood Environment Walkability Survey—NEWS);
-
Both perceived and observational tools (Pedestrian Environment Data Scan Tool—PEDS, Neighborhood Audit Instrument—PIN3, Sidewalk Assessment Tool—SAT, Systematic Pedestrian and Cycling Environmental Scan—SPACES, Systematic Social Observation of Public Spaces—SSO);
-
Observational tools (China Urban Built Environment Scan Tool—CUBEST, Analytic Audit Tool—AAT, Active Neighborhood Checklist—ANC, Neighborhood Active Living Potential—NALP, Physical Activity Resource Assessment—PARA, Walking Suitability Index of the Territory—T-WSI);
-
Both observational and archival tools (Walkability for Health framework—WfH, Quality of Pedestrian Level of Service—Q-PLOS, Linking Objectively Measured Physical Activity with Objectively Measured Urban Form);
-
Archival tools (Walkability Index—WAI, Walk Score, Physical Activity and the Rejuvenation of Connswater—PARC Study).
Each tool contains indicators of analysis of the built environment and they have been divided into two groups. Firstly, in relation to the referring scale level: MACRO (area scale tools) and Micro (street level tools). The Macro dimension refers to the urban scale and looks at the city with a top view, quantitatively describing the overall urban factors. Conversely, the Micro dimension investigates the city at the street scale level, qualitatively describing the outdoor spaces features, according to the city users’ perception. Then, each parameter, analyzing a quality or feature of an urban element, was compared with other similar items in order to determine if it was possible to gather the items together, generating a new category. Those items, evaluating a specific characteristic of the urban environment, were included individually, without grouping them into categories. This method allows reducing the number of items, avoiding the input of all indicators present in each tool, which creates an overlap.
Furthermore, after completing the clustering table, it was possible to calculate the frequency of these items, drafting a table of presence for each scale level within the totality of the analyzed tools. The aim of these charts was to define which indicators of the entire pool were more frequently mentioned and how it was possible to hierarchize them. The selection of the items was made by computing the frequency and then defining a cut-off that separates the included items from the excluded ones. This range was calculated both for Macro and Micro level parameters (Figure 1), each one related to the reference scale.

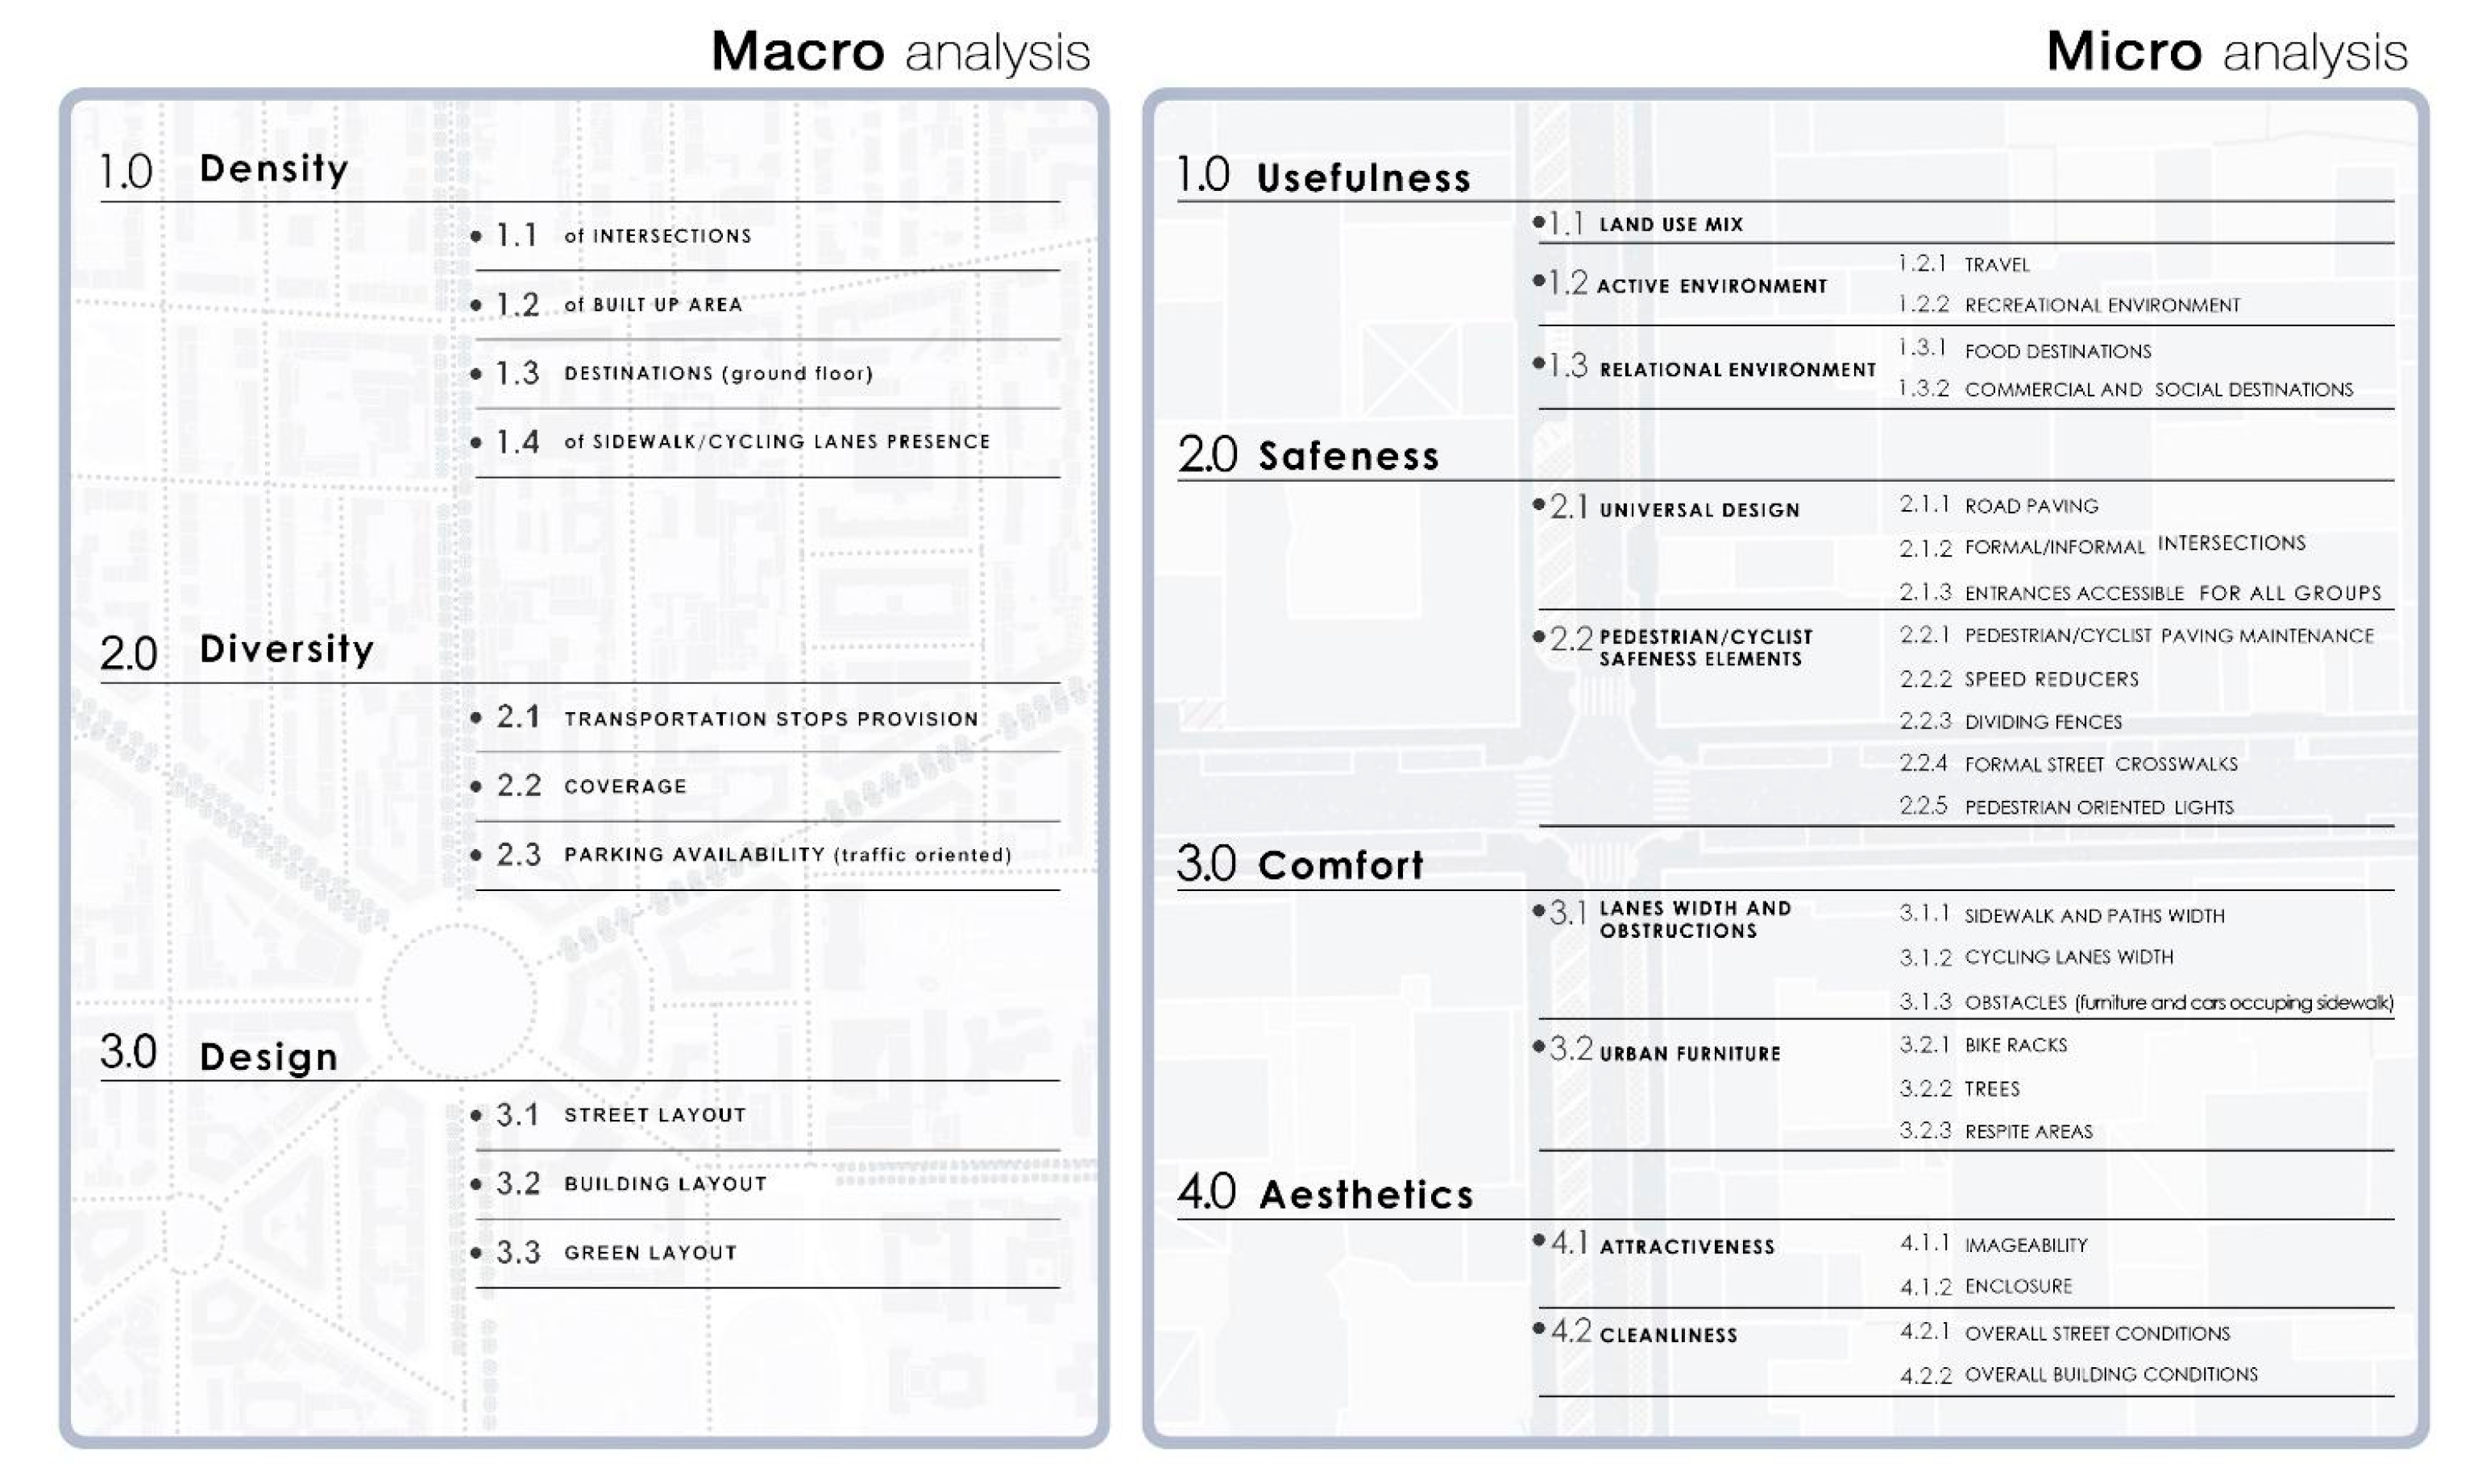
2.2. The Milan Walkable Measurement Assessment Framework

The scientific background provided by the literature review allowed building the new method structure (Figure 2), which is necessarily tree-articulated given the inclusion of a large number of factors. The new assessment framework, the Milan Walkability Measurement (MWM), is innovative because it investigates both scales of the city, Macro and Micro, addressing the urban features for the promotion of a healthier behavior of the population.
The Macro analysis is quantitatively related to urban planning and is divided into three criteria:
-
Density: which analyzes quantitatively the urban factors that underpin walkability in terms of connectivity, and the urban characteristics that can increase the pedestrian flow reducing distances between destinations;
-
Diversity: which analyzes the offer of accessibility of public transport stops, including their coverage in terms of reachable area within no more than a 10-min walk;
-
Design: which analyzes the urban morphology and design, including the street hierarchy, the built fabric typology and the presence of green along the streets.
The Micro analysis is qualitatively related to the urban and street design and is divided into four criteria:
-
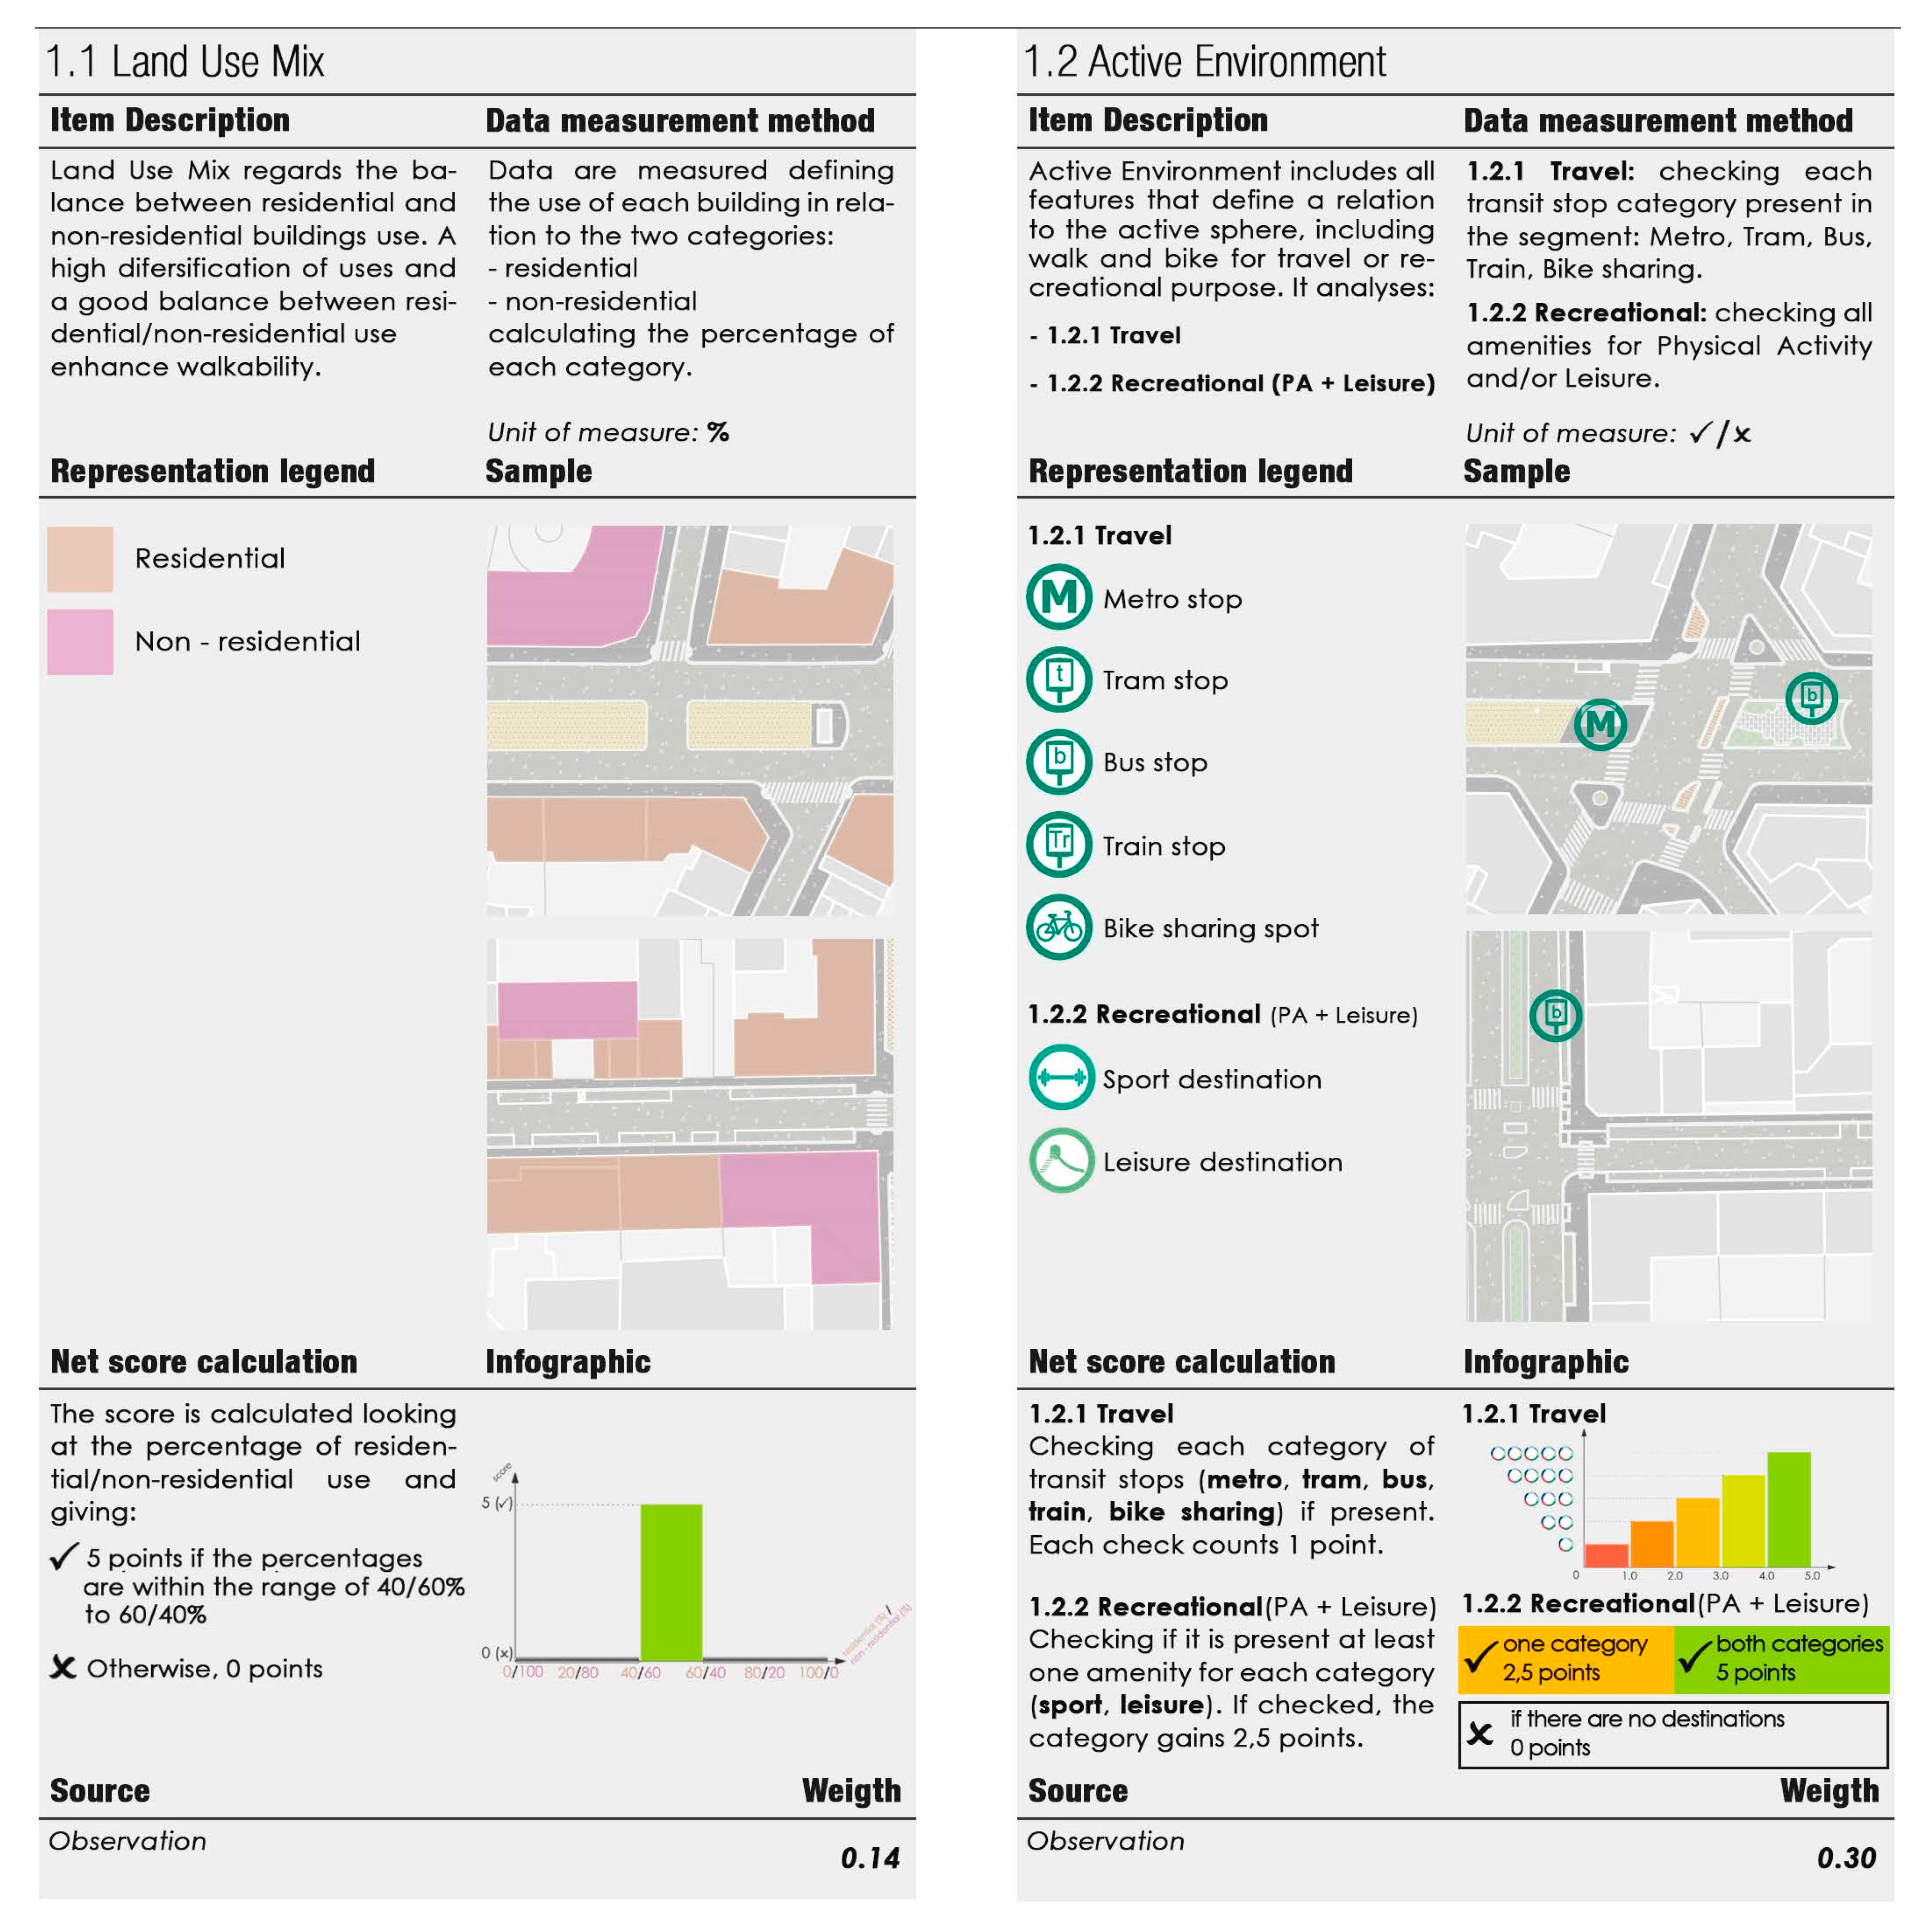
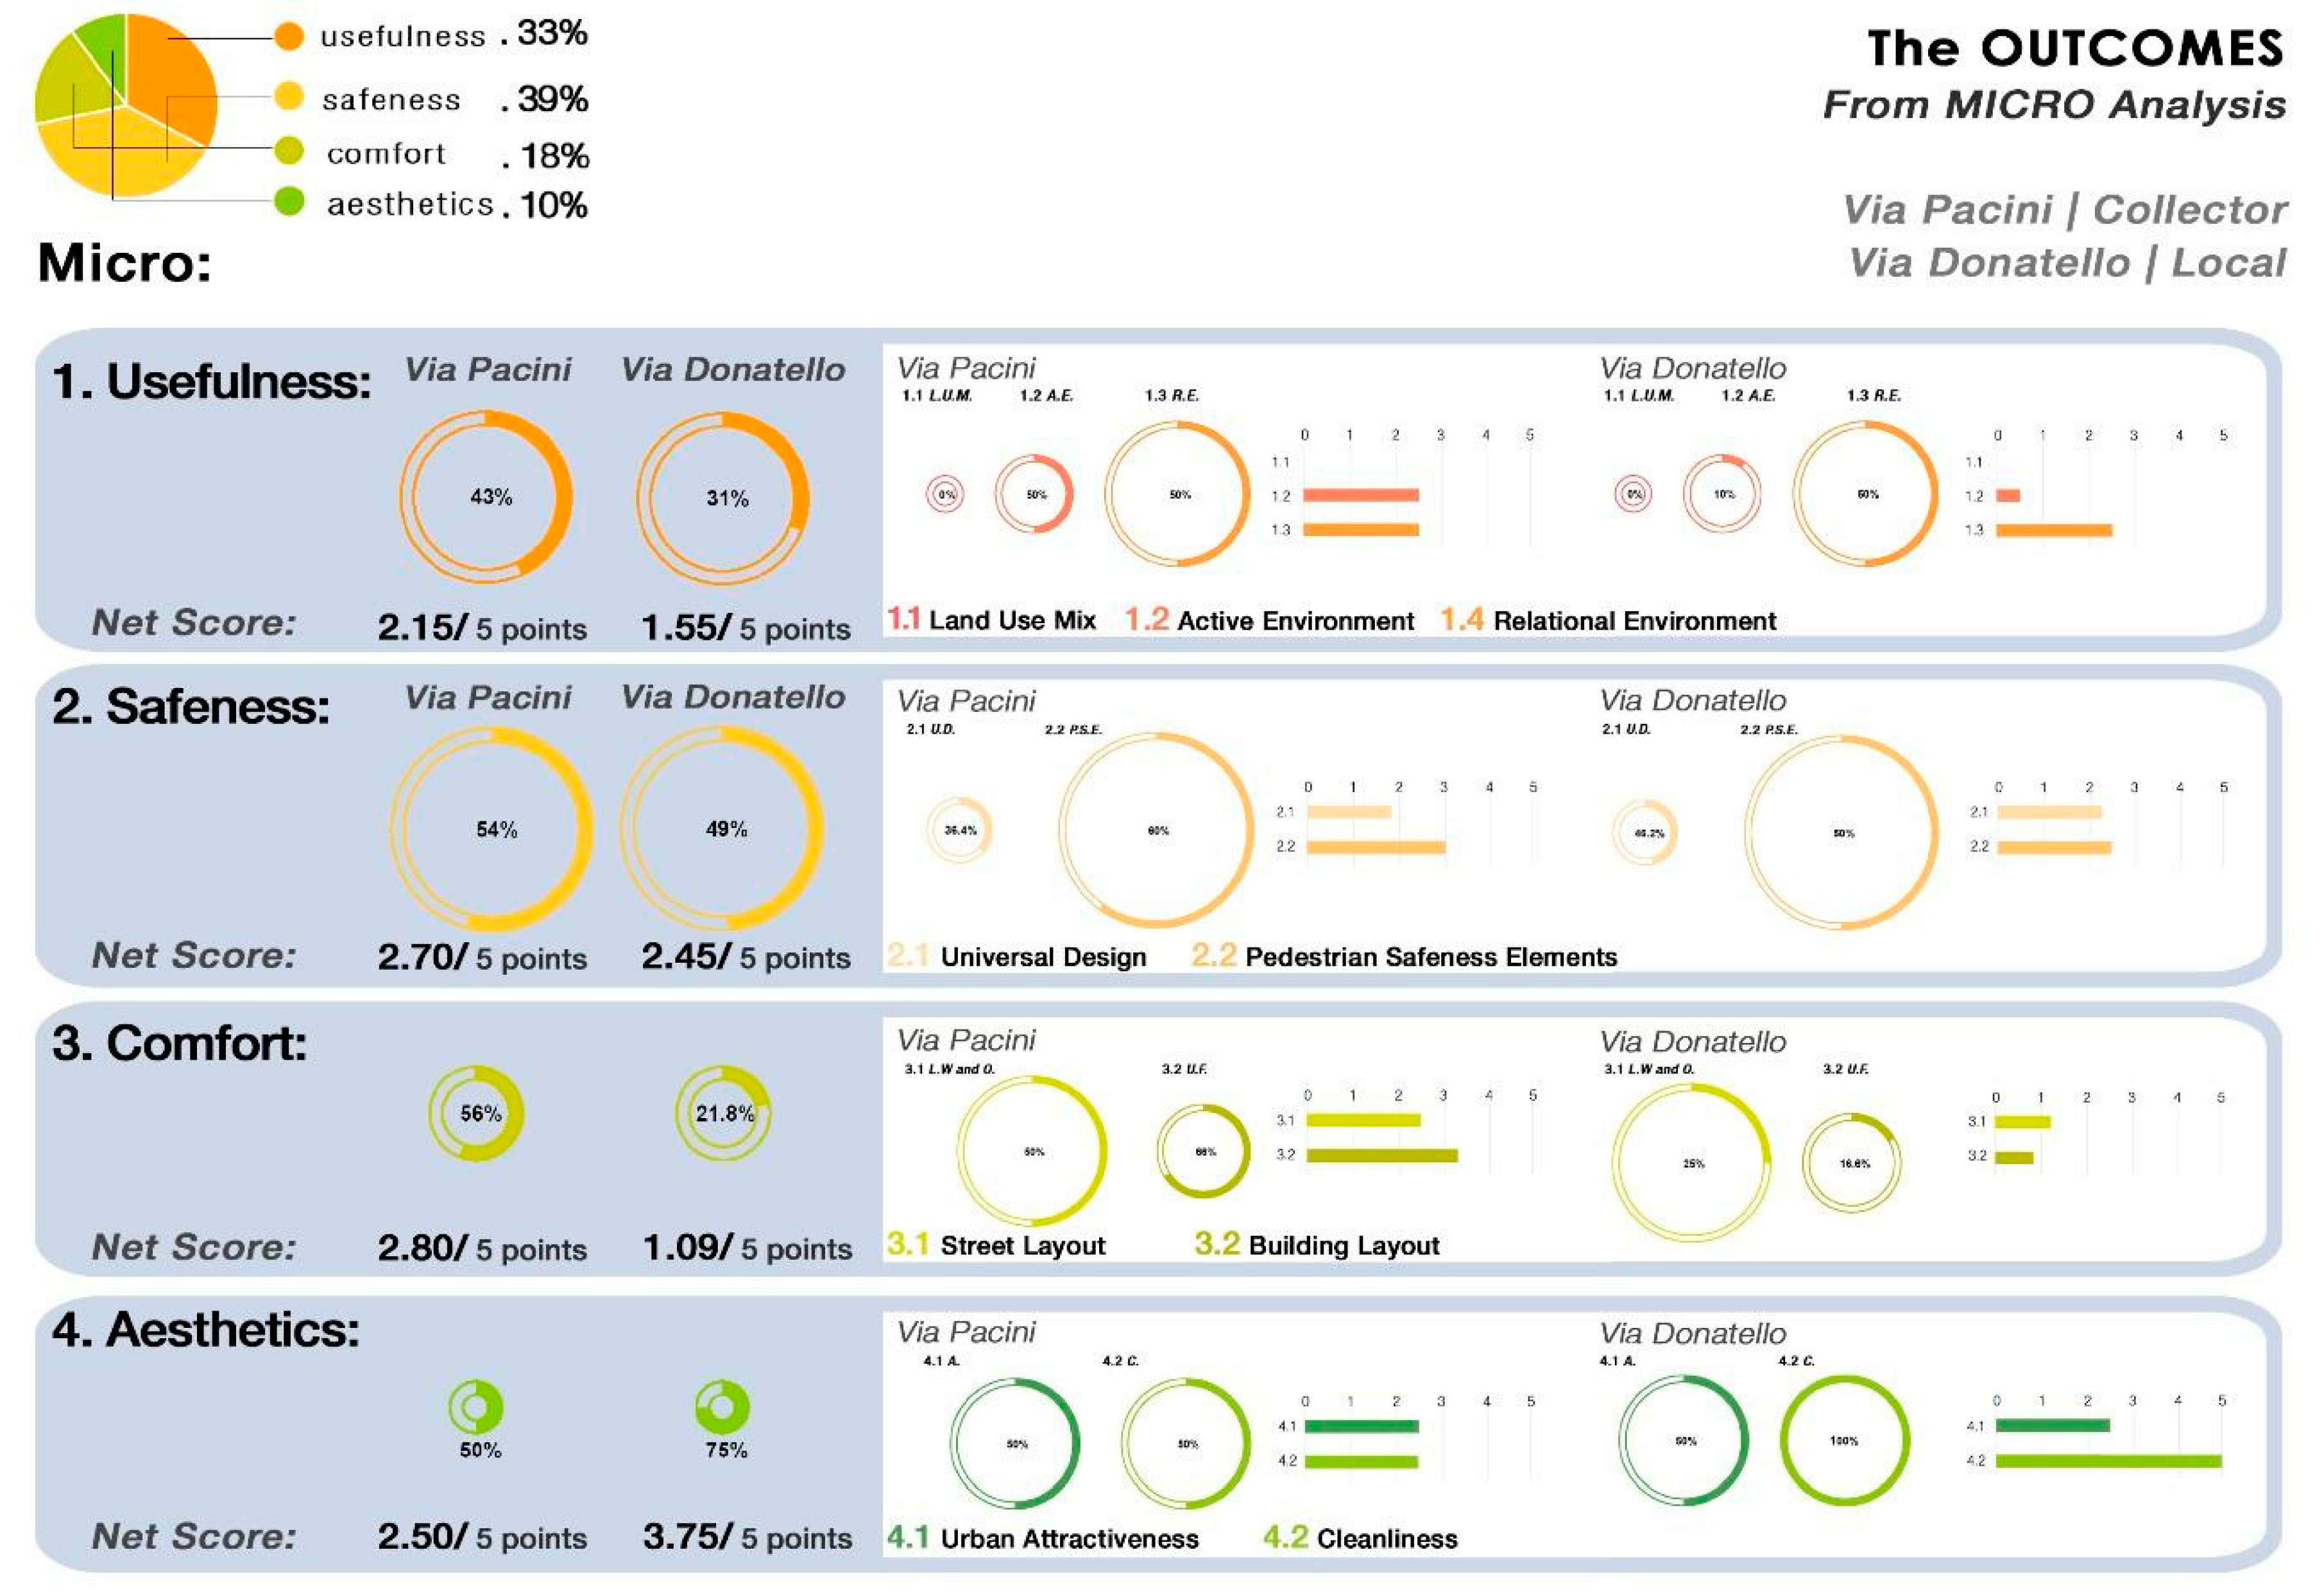
Usefulness: which quantifies the offer of features and destinations along the analyzed streets, dividing them in relation to the reference categories that enhance active and healthy behaviour;
-
Safeness: which looks at the elements of the urban environment that strengthen the feeling of safety of pedestrians and cyclists, analyzing both the quality of the street and pedestrian connectedness and the quality of the urban safety elements and furniture;
-
Comfort: which analyzes all of the characteristics of the street able to increase the degree of comfort for both pedestrians and cyclists, including a quantitative measure and a qualitative evaluation;
-
Aesthetics: which investigates the characteristics of the street that, relating to the human scale, increase the urban attractiveness generating an environment suitable for walking and cycling.
On completion of the data collection phase and grouping of all items into different categories and indicated hierarchies for both Macro and Micro phases, the goal was to assign different values and degree of importance to each item [54]. The weights and values of each indicator are essential for the final urban environment evaluation. To achieve the final goal, each level of the hierarchy must be weighted. For this reason, the need to combine in a meaningful way different dimensions measured on different scales (one for each considered criteria) is crucial to the construction of a composite index. Considering the associations between the objective features, the perceived conditions and the consistent number of items selected, we decided to assign weights to combine the hierarchy tree weighting with the opinions of a pool of experts, composed of 12 professionals and academic figures in urban planning and transportation issues, architecture, urban design, together with physicians and epidemiologists, representing the cross-disciplinary and medical skills working in public Health agencies. Since the structure is complex and requires a detailed process in order to be analyzed, the methodology that will be used to obtain experts’ judgments is the pairwise comparison, a direct mode of comparison between two items. This methodology is used in the analytic hierarchy process, developed by T. Saaty [55,56]. The pool of experts was interviewed using various questionnaires to express their preference comparing, two by two, the defined indicators. The questionnaires consisted of about 10 direct comparisons in terms of importance between single criteria and sub-criteria (items) taken into consideration, with reference to the urban factors that influence the cycle-pedestrian accessibility of the city. Once the answers were collected, the mean was computed and it was possible to extract a single weight for each indicator (Figure 3).

3. Testing the Walkability Assessment Method in Milan, Italy

The assessment framework was tested in a real context in the city of Milan. For this purpose, the operative stage starts with the selection of the pilot area, following a list of criteria.

3.1. Area Selection

To select the area of interest, different neighborhoods of the metropolitan context were studied, paying attention to the coherence between the urban characteristics and the purpose of the research. Criteria analyzed regarding the area are:
  • it must have a surface of approximately 1.5 km2;
  • it should include important urban elements, such as plazas, main streets, public transport stops, green spaces, etc.;
  • it has to contain the locality and the collector (which will be evaluated by the Micro analysis).
The neighborhood selected for the Macro application is Città Studi and the area investigated spanned from Lambrate Fs. Station (Piazza Bottini) to Piazzale Loreto, which measured 1654 km2.

3.2. Collector and Locality Selection

After selecting the area on which to perform the measurement, it was necessary to select a locality and a collector street to approach the Micro analysis, the second phase of the new assessment method focused on the street level. Criteria analyzed were:
  • segments within 300 m from an underground public transport stop or train station;
  • segments with highly mixed land use;
  • segments with on-street parking (along the street as a buffer between the street and pedestrians);
  • the segment must be between 400 and 600 m long, according to the length of the streets evaluated by the tools analyzed within the systematic review.
As for the area selection, in the locality and the collector selection, the transformation dynamics expected were considered [57]. The Locality chosen following the selection criteria was Via Donatello, while the collector was Via Pacini. As mentioned above, in both streets new cycling lanes were planned, and their layout characteristics modified.

3.3. Seven Records for Seven Criteria

Once the contexts selection process was closed, seven records were elaborated (three for the Macro sphere and four for the Micro). The purpose of each record was to summarize the fundamental information relating to each item and sub-item useful for data collection/measurement/calculation.

3.4. Collection of Data and Record Tables

The operative stage of MWM tool can properly begin following the indications provided in the seven Records which include the “data measurement method”. As far as the Macro Analysis was concerned, data were provided by town plans and by open source databases. Regarding Micro analysis, the precondition was the observational character of the phase, and for this reason it was possible to assert that an on-site survey was necessary. This evaluation was about measuring the physical features of the built environment in both locality and collector streets (Figure 4).

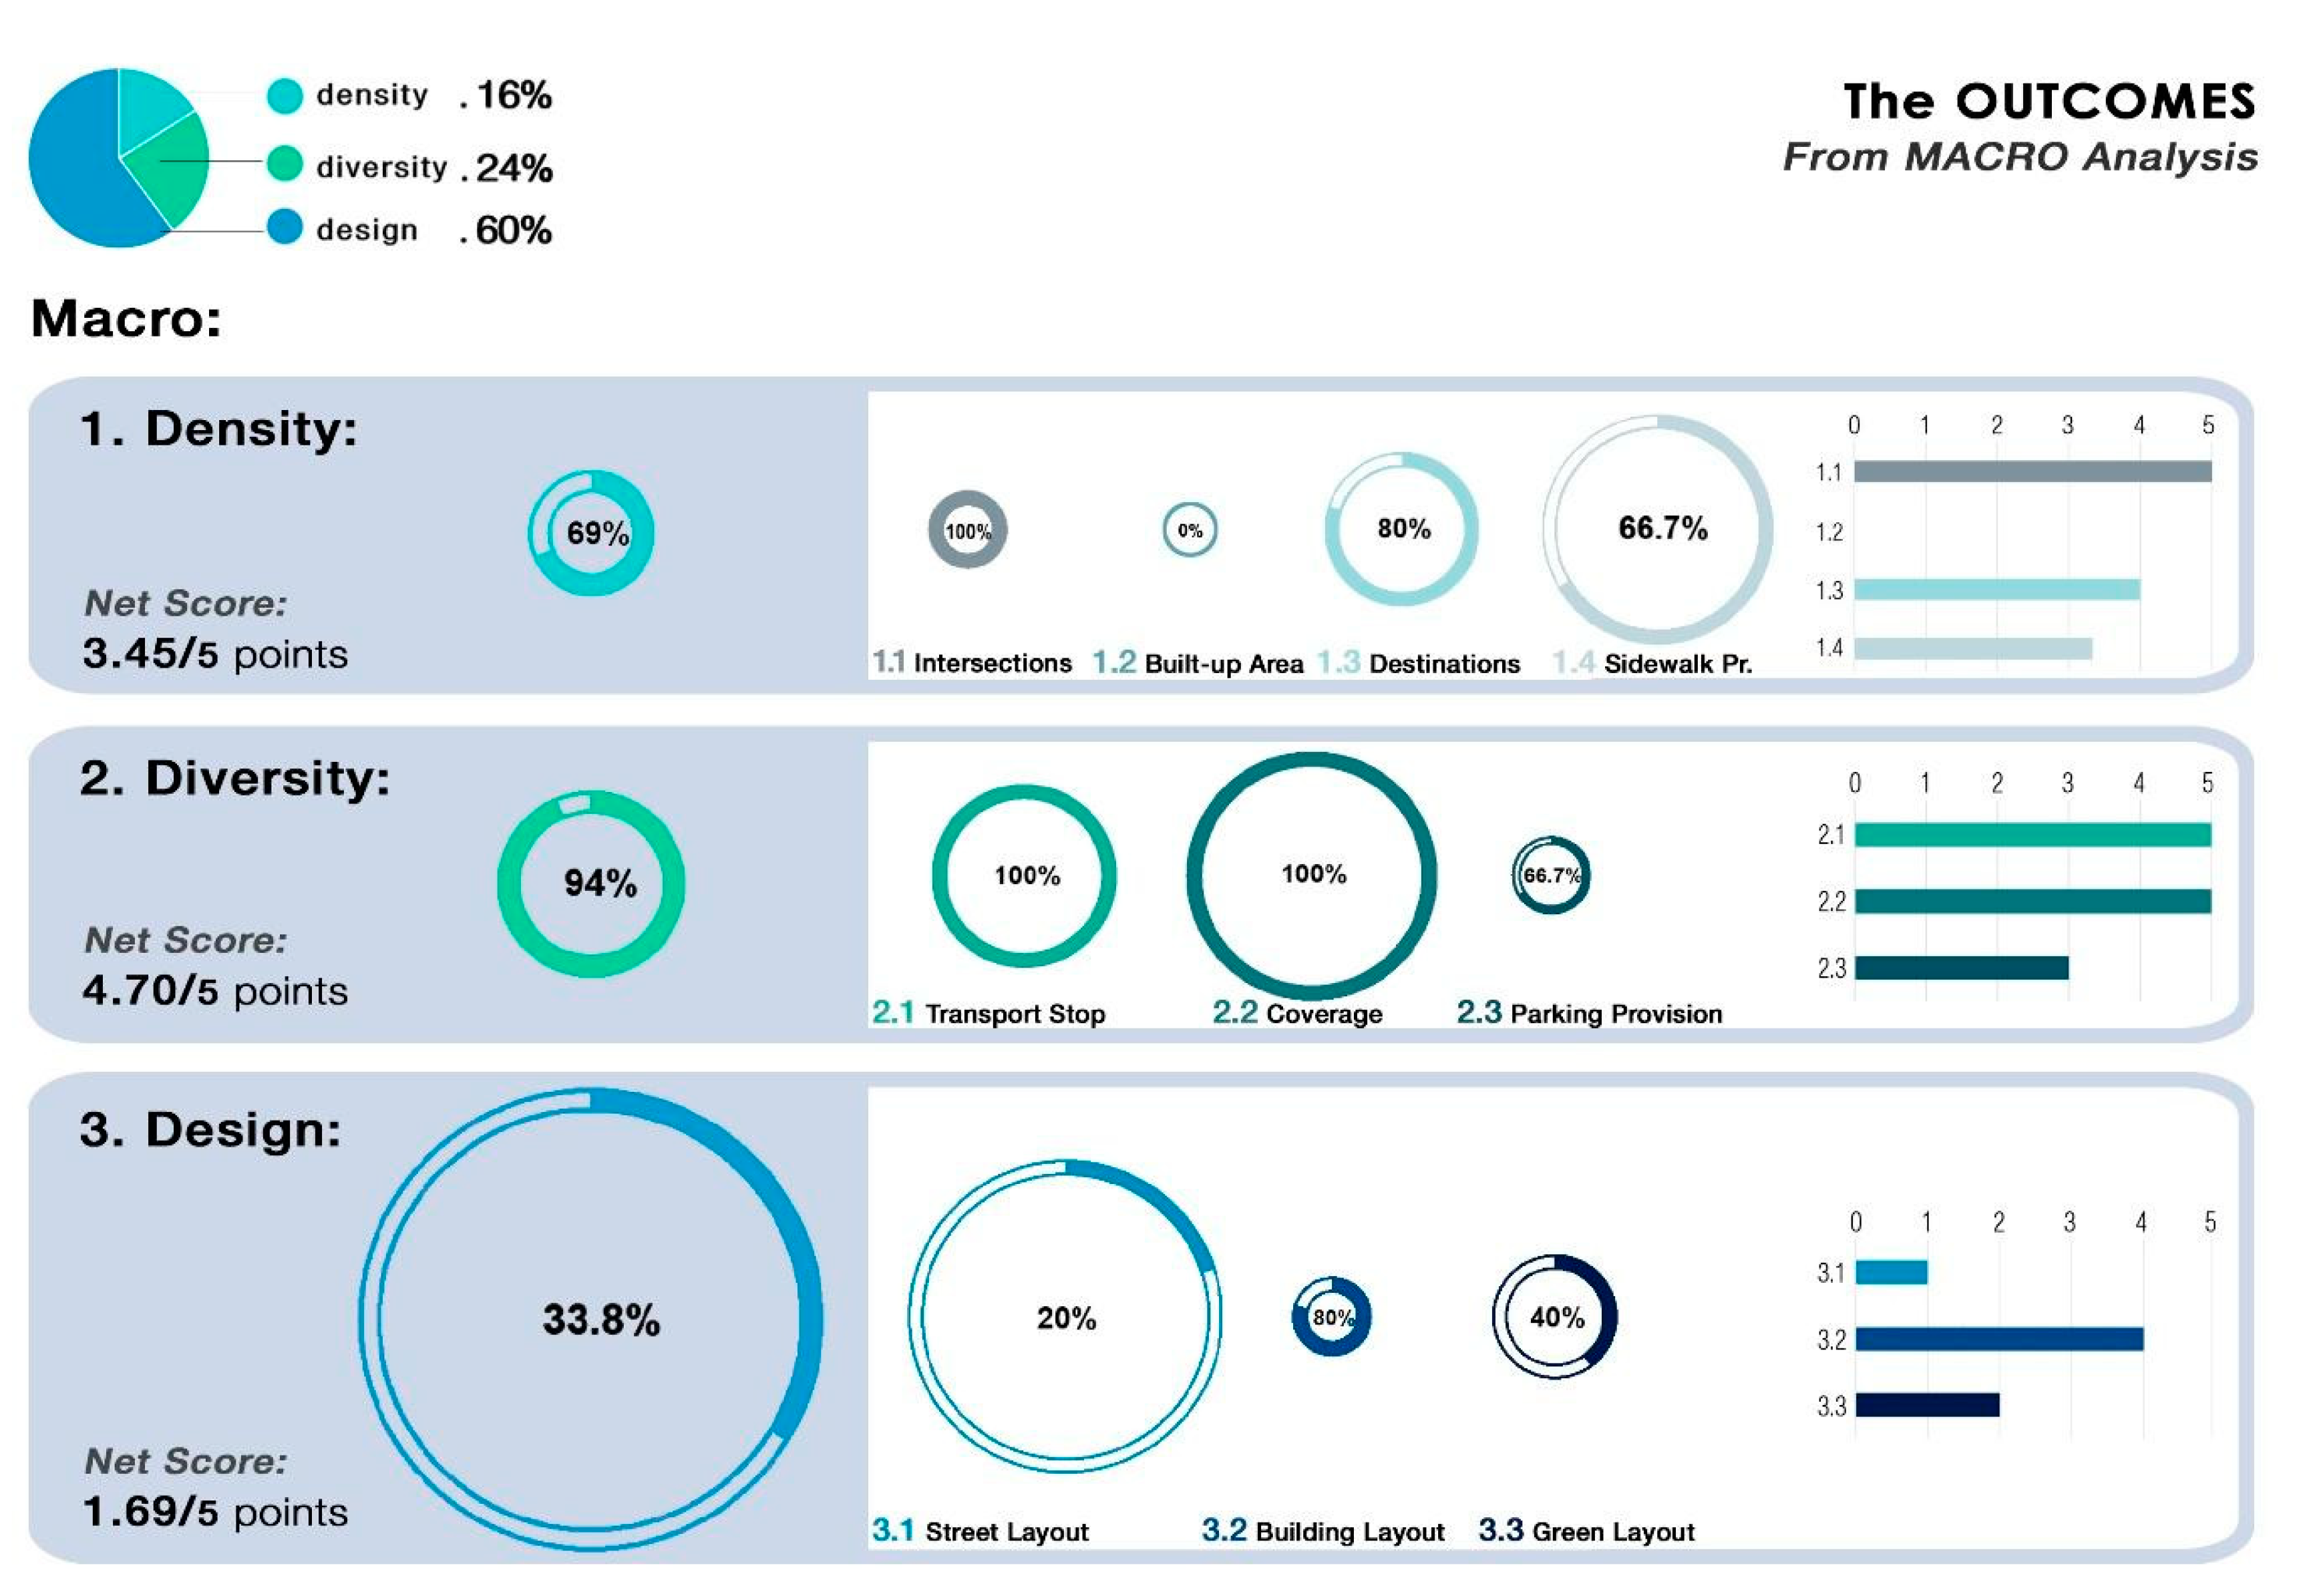
3.5. Outcomes and Final Assessment

Given the conclusion of the analysis, it was possible to analyze information reported in the summarizing tables, with the addition of weight connotation previously assigned by the group of experts. for each criterion, a complete table was provided, in which all of the characteristics were investigated. Each criterion table will be followed by a description of the outcomes. In order to be readable and comprehensible, the scores were represented graphically.

4. Discussion

4.1. Final Macro Assessment

Formulating a final assessment for the Macro Analysis (Figure 5) allows the identification of each analyzed indicator, which represents the best characteristic for underpinning walkability in quantitative terms. The definition of the final score for each criterion aids the understanding of weaknesses and intervention priorities but does not give any information on the qualitative condition of the urbanity, leaving this issue to the Micro analysis. Furthermore, the final Macro assessment can be used to give planning directions to policy-makers for two main purposes. Focusing on Città Studi Area and one criterion score at the time, it is possible to assert that Density (3.45 out of 5 points) depicts an urban condition with appropriated dimensions of the block, guaranteeing possibilities in the diversification of routes. A high degree of appropriateness could be discovered in ground floor destinations, both for quantity and placement. The global intermediate score of Density is mostly related to a low presence of sidewalk and cycling lanes (3.33/5 points). As for the Diversity criteria, the offer of transport modes mapped is high and their displacement is adequate (4.70/5 points). Both Density and Diversity depict good urban features conditions in supporting walkability. Design criterion, the most influential (0.6/1) within the macro dimension, gains the lowest net score (1.69/5 points), affected by the lack of streets with a 30 km/h speed limit and having linear green areas only in the principal axes of the neighborhood. Finally, a conclusive weighted net score for the entire dimension of Macro was attested on 2.69/5 points. Nevertheless, Density and Diversity presented a good score, and Design majorly affected the final rate.

4.2. Final Micro Assessment

The Micro analysis outcomes consist in a quantitative representation of a quality-based assessment (Figure 6). The first aim of this phase was to provide direct guidelines for street design implementation. The evaluation of the four criteria allows discovering which items present weaknesses in terms of the pedestrian environment, thus defining which types of intervention are necessary to improve the street quality. While the Macro analysis was able to provide directions in the prioritized settings for urban planning, the Micro covered the entire panorama of variables included in the pedestrian environment, which means a complete review of the current street conditions and the definition of both priorities and specific design actions.
Looking at the two streets analyzed, regarding Via Pacini (collector) final assessment, it was possible to state that the four criteria achieved poor results. Likewise, Via Donatello (local) obtained low scores, especially in Comfort (1.09 points) and Usefulness (1.55 points).
The most influential criterion was Safeness (weight 0.39/1), and in both streets it achieved a medium value. The reasons relate to: the lack of elements capable of reducing the car-oriented nature of the street network; the number of entrances inaccessible to disabled people; and the absence of pedestrian safety elements, such as protective furniture to prevent vehicles from parking on the sidewalks or to work as a buffer between the latter and the road. These characteristics are widespread in the Milanese context, even though it is widely demonstrated that the relocation of parking lots, as well as the reduction of the carriageway width, including removable elements (planters, roadblocks, cones, etc.), are easy-to-adopt measures Moreover, some urban characteristics, such as the presence of a buffer space between pedestrians and vehicular traffic, are clearly associated with an increased risk in pedestrian injury [13].
Usefulness is the second criterion in terms of priority. The most problematic score can be noticed in Via Donatello, which achieved only 1.55/5 points because of the low levels of mixed land use and accessibility to public transport. As well as the local, Via Pacini suffers from the imbalance between residential and non-residential uses. In fact, the street loses its “two-way” character from day to night. Nevertheless, the collector enjoys better accessibility to the public transport network, enhancing the active environment.
As far Usefulness is concerned, Via Donatello’s Comfort obtained a low score, the worst in the Micro dimension (1.09 out of 5 points). The weaknesses were identified by the lack of urban furniture, which includes neither bike racks nor trees, even though the dimension would be able to host them. Moreover, there are only private resting areas, which in addition to scooters parked on the sidewalk, reduce the size of the latter and decrease walking comfort. The same situation may be noticed in Via Pacini, on whose sidewalks there are even cars, decreasing the value of an otherwise good score (2.8 out of 5 points).
Finally, Aesthetics was the criterion with the lowest weight (0.1/1 within the Micro dimension). Via Pacini achieved a medium value because of the overall poor condition of the buildings, affected by graffiti that spoil the facades. In conclusion, the total Micro score of Via Pacini was equal to 2.51 points, while Via Donatello had 2.05 points. The two scores highlight a poor situation for both the Collector and the Local.
The potentiality in the final Micro assessment with the MWM method was its application to evaluate the level of improvement of a forecasting project on the streets. As regards the improvement of the commercial axis of Via Pacini, it is possible to suggest an implementation of the Usefulness score, increasing the value from 2.15 to 2.9 points. On the other hand, the addition of the cycling lane improves the comfort of the street, increasing the score from 2.8 points to 3.35.
Regarding Via Donatello, the forecast project would improve both comfort and safeness. The first criterion was enhanced by the addition of the cycling lane, increasing the score from 1.09 points to 1.84. The addition of elements and speed reducers to deal with the vehicular predominance improves the Safeness, which underlies a raise of the final Safeness score, from 2.45 to 3.96 points.
Both final scores of the Micro dimension increased their values. Via Pacini showed an improvement of 35.2% in Usefulness and 20% in Comfort, increasing the final score from 2.51 to 2.86 points. At the same time, Via Donatello obtained an improvement of 60% in Safeness and 65% in Comfort, increasing the final score from 2.05 to 2.76 points.
Before drawing conclusions, we would like to underline that the developed framework presents some aspects to be improved, implemented, and validated. Not all the types of data needed were available on the principal open source platforms, especially in case of Italy and in the specific context of Milano where data at the micro scale are not always available and usable. For example, the poor presence of organized, detailed, and open access databases makes it difficult to find health population status data which would be useful to create significant relations for future epidemiological studies. In these terms, with regard to the Macro dimension, the data gathering stage could be more “user-friendly” by replacing manual collection with open source GIS platforms.
In addition, the challenging observational character of the Micro dimension could be strengthened by audits and questionnaires or the development of user generating contents tools such as a smartphone app directed to citizens with the aim of involving them in data collection. In this case, the provision of a user-friendly guide which explains in detail how to select and classify information will be fundamental in order to avoid the subjectivity of data gathering.
Finally, as this was the first experience with the MWM, the next steps will be focused on calibrating the assessment method with more rigorous definition of weights to assign to urban context features in order to guarantee the reliability and replicability of the method.

5. Conclusions

According to the WHO, modern cities must deal with three major health problems: infectious and acute diseases, non-communicable diseases, and accidents linked to the safety of cycle–pedestrian accessibility and mobility. In order to face this challenge, proper planning and organization of the urban environment is pivotal in Italy, as well as in Europe and worldwide, and it is thus crucial to consider cities as “enhancers” of outdoor living conditions, as well as urban and public health.
Urban environments influence the livability of the city, both for health and people’s behaviour, encouraging or discouraging the latter to be active, improving the ability of individuals to strive against an unhealthier lifestyle. The elements that compose the urban environment relate themselves to several factors, which can promote walkability. Making cities more walkable and cyclable means to improve the physical factors—as buildings features, land use mix, densities, street design—in order to create a more convenient, safe, comfortable, and attractive space to walk and ride.
Policy-makers, organizations, stakeholders, and municipalities are the main subjects to direct the evidence-based results of the analysis, providing them a general reference frame able to show the state-of-the-art status and suggesting the first required steps for interventions. Furthermore, the aim of the instrument should be to generate a conscious image of the current scenario, allowing these characters to be aware of the general condition of the urban environment.
As argued elsewhere, although national and international entities suggest performing regular physical activity to prevent NCDs, it is difficult to put into effect this suggestion, particularly if the urban neighborhood lacks green areas, sports facilities or a context inviting users to walk or cycle [58].
The research emphasizes the correlations between the built environment and walkability, evaluating its level and highlighting the weaknesses that need to be improved in terms of cyclist and pedestrian accessibility and of urban quality. In this way, priority aspects of those built environments could be assessed, in order to be taken into consideration when programming potential future transformations aimed at encouraging, indirectly, active behavior of its citizens [59,60].
The relation that exists between the urban features and their level of pedestrian-friendliness is evidence-based, and the method can assess both qualitative and quantitative aspects within the complexity of the city environment.
An important added-value of the MWM assessment framework is the double perspective in which it looks at the city. Two scales (Macro and Micro) were analyzed and further validated in the Milanese context. Furthermore, while in this phase of theoretical acquisition a large part of the articles investigated were perceived (questionnaire-based); the MWM method is established on the solidity of evidence of the urban environment and not only on basic descriptions. Referring to its objective character, the MWM framework could be adapted to other contexts simply by modifying the parameters of comparison, such as averages and limits imposed by the municipality. Once the scoring system has been set and sheets dedicated to the data-harvesting prepared, the typology of data needs to be collected could be available on principal open source platforms. In this way, especially in our case of Milan where GIS data are not always available and usable, data gathering could be a homogeneous process, thus avoiding inconsistencies. For this reason, the data gathering stage could be more “user-friendly” by replacing their manual collection of Macro dimension data from open source platforms with obtaining them from GIS services. In addition, the challenging observational character of the Micro dimension could be replaced by audits and questionnaires or the development of a smartphone app that interviews citizens about aforementioned fields of research.
The purpose of this research was the development of an evidence-based method [61]. The implementation of the assessment framework, relating to a survey or an interview to submit to the inhabitants, could be a starting point if the research continues, and certainly, an interesting addition in order to accomplish longitudinal studies and gather data on the city of Milan. The best future opportunity, in either implementation or non-implementation cases, is the multiple application of the assessment framework in diverse Milanese contexts. This could be a double validation of the method since many applications allow implementing or streamlining its structure based on different features found in diverse contexts. Finally, the effort is worthwhile, since this research field progressively plays a fundamental role in the planning processes of the city [62,63], in which we all live, defining a wide consciousness reflecting the plural correlation between psychological and physiological well-being, healthier behaviors, and active lifestyles with the livability and sustainability of the city.

Author Contributions

Conceptualization, A.R., M.B., M.D. and D.D.; Data curation, A.R. and M.B.; Supervision, S.C. and D.D.; Writing-original draft, A.R., M.B., M.D., L.A., A.A., P.C., D.D. and S.C.; Writing-review and editing, A.R. and M.D.

Funding

This research received no external funding.

Acknowledgments

Architects Roberto Bertani and Serena Casarini, who gave a crucial contribution through their Master’s Degree research in Architecture at Politecnico di Milano and their experience at Technische Universität Berlin (TUB), supervised by Dipl.-Ing. Architekt MScPH Alvaro Valera Sosa.

Conflicts of Interest

The authors declare no conflict of interest.

References

  1. Capolongo, S.; Buffoli, M.; Rebecchi, A.; Di Gregori, V. Attività fisica quale strategia per la promozione della salute urbana. Sistema Salute 2015, 59, 220–227. [Google Scholar]
  2. Global Advocacy Council for Physical Activity, International Society for Physical Activity and Health. The Toronto Charter for Physical Activity: A Global Call to Action. May 20, 2010. Available online: www.globalpa.org.uk (accessed on 13 May 2019).
  3. World Health Organization. Preventing Chronic Diseases: A Vital Investment; WHO Global Report; World Health Organization: Geneva, Switzerland, 2005; p. 48. [Google Scholar]
  4. Kohl, H.W.; Craig, C.L.; Lambert, E.V.; Inoue, S.; Alkandari, J.R.; Leetongin, G.; Kahlmeier, S.; Lancet Physical Activity Series Working Group. The pandemic of physical inactivity: Local action for public health. Lancet 2012, 380, 294–305. [Google Scholar] [CrossRef]
  5. World Health Organisation. Global Health Risks: Mortality and Burden of Disease Attributable to Selected Major Risks; World Health Organization: Geneva, Switzerland, 2009; p. 18. [Google Scholar]
  6. World Health Organisation. Global Recommendations on Physical Activity for Health; WHO Press: Geneva, Switzerland, 2010; p. 20. [Google Scholar]
  7. Glasgow Centre for Population Health. The Built Environment and Health: An Evidence Review; Glasgow Centre for Population Health: Glasgow, UK, 2013; p. 14. [Google Scholar]
  8. Arghittu, A.; Dettori, M.; Masia, M.D.; Azara, A.; Dempsey, E.; Castiglia, P. Social deprivation indices and anti-influenza vaccine coverage in the Sardinian elderly population, Italy, with a focus on the Sassari municipality. J. Prev. Med. Hyg. 2018, 59 (Suppl. 2), E45–E50. [Google Scholar] [PubMed]
  9. Urban health post-2015. Lancet 2015, 385, 745. [CrossRef]
  10. Hickman, R.; Banister, D. Transport, Climate Change and the City; Routledge: London, UK, 2014. [Google Scholar]
  11. Frank, L.D.; Sallis, J.F.; Conway, T.L.; Chapman, J.E.; Saelens, B.E.; Bachman, W. Many pathways from land use to health: Associations between neighborhood walkability and active transportation, body mass index, and air quality. J. Am. Plan. Assoc. 2006, 72, 75–87. [Google Scholar] [CrossRef]
  12. Litman, T. Transportation Cost and Benefit Analysis; Victoria Transport Policy Institute: Victoria, BC, Canada, 2009. [Google Scholar]
  13. Congiu, T.; Sotgiu, G.; Castiglia, P.; Azara, A.; Piana, A.; Saderi, L.; Dettori, M. Built Environment Features and Pedestrian Accidents: An Italian Retrospective Study. Sustainability 2019, 11, 1064. [Google Scholar] [CrossRef]
  14. Hovell, M.F.; Sallis, J.F.; Hofstetter, C.R.; Spry, V.M.; Faucher, P.; Caspersen, C.J. Identifying correlates of walking for exercise: An epidemiologic prerequisite for physical activity promotion. Prev. Med. 1989, 18, 856–866. [Google Scholar] [CrossRef]
  15. Ballor, L.D.; Keesey, R. A meta-analysis of the factors affecting exercise-induced changes in body mass, fat mass and fat-free mass in males and females. Int. J. Obes. 1991, 15, 717–726. [Google Scholar] [PubMed]
  16. Siegel, P.Z.; Brackbill, R.M.; Heath, G.W. The epidemiology of walking for exercise: Implications for promoting activity among sedentary groups. Am. J. Public Health 1995, 85, 706–710. [Google Scholar] [CrossRef]
  17. Phillips, W.T.; Pruitt, L.A.; King, A.C. Lifestyle Activity. Sports Med. 1996, 22, 1–7. [Google Scholar] [CrossRef] [PubMed]
  18. Hakim, A.A.; Petrovitch, H.; Burchfiel, C.M.; Ross, G.W.; Rodriguez, B.L.; White, L.R.; Yano, K.; Curb, J.D.; Abbott, R.D. Effects of Walking on Mortality among Nonsmoking Retired Men. N. Engl. J. Med. 1998, 338, 94–99. [Google Scholar] [CrossRef]
  19. Dunn, A.L.; Marcus, B.H.; Kampert, J.B.; Garcia, M.E.; Kohl, H.W.; Blair, S.N. Comparison of lifestyle and structured interventions to increase physical activity and cardiorespiratory fitness: A randomized trial. J. Am. Med. Assoc. 1999. [Google Scholar] [CrossRef]
  20. Manson, J.E.; Hu, F.B.; Rich-Edwards, J.W.; Colditz, G.A.; Stampfer, M.J.; Willett, W.C.; Speizer, F.E.; Hennekens, C.H. A Prospective Study of Walking as Compared with Vigorous Exercise in the Prevention of Coronary Heart Disease in Women. N. Engl. J. Med. 1999, 341, 650–658. [Google Scholar] [CrossRef] [PubMed] [Green Version]
  21. Brownson, R.C.; Housemann, R.A.; Brown, D.R.; Jackson-Thompson, J.; King, A.C.; Malone, B.R.; Sallis, J.F. Promoting physical activity in rural communities. Am. J. Prev. Med. 2000, 18, 235–241. [Google Scholar] [CrossRef]
  22. Bedimo-Rung, A.L.; Mowen, A.J.; Cohen, D.A. The significance of parks to physical activity and public health. Am. J. Prev. Med. 2005, 28, 159–168. [Google Scholar] [CrossRef] [PubMed]
  23. Sallis, J.F.; Bowles, H.R.; Bauman, A.; Ainsworth, B.E.; Bull, F.C.; Craig, C.L.; Sjöström, M.; De Bourdeaudhuij, I.; Lefevre, J.; Matsudo, V.; et al. Neighborhood Environments and Physical Activity Among Adults in 11 Countries. Am. J. Prev. Med. 2009, 36, 484–490. [Google Scholar] [CrossRef] [PubMed] [Green Version]
  24. Sallis, J.F.; Floyd, M.F.; Rodríguez, D.A.; Saelens, B.E. Role of built environments in physical activity, obesity, and cardiovascular disease. Circulation 2012, 125, 729–737. [Google Scholar] [CrossRef] [PubMed]
  25. D’Alessandro, D.; Arletti, S.; Azara, A.; Buffoli, M.; Capasso, L.; Cappuccitti, A.; Casuccio, A.; Cecchini, A.; Costa, G.; De, A.M.M. Strategies for Disease Prevention and Health Promotion in Urban Areas: The Erice 50 Charter. Ann. Ig. 2017, 29, 481–493. [Google Scholar] [PubMed]
  26. Capolongo, S.; Rebecchi, A.; Dettori, M.; Appolloni, L.; Azara, A.; Buffoli, M.; Capasso, L.; Casuccio, A.; Oliveri Conti, G.; D’Amico, A.; et al. Healthy Design and Urban Planning Strategies, Actions, and Policy to Achieve Salutogenic Cities. Int. J. Environ. Res. Public Health 2018, 15, 2698. [Google Scholar] [CrossRef]
  27. World Health Organization. Towards More Physical Activity in Cities Transforming Public Spaces to Promote Physical Activity—A Key Contributor to Achieving the Sustainable Development Goals in Europe; BMC Public Health: Copenaghen, Denmark, 2017. [Google Scholar]
  28. Saelens, B.E.; Sallis, J.F.; Frank, L.D. Environmental correlates of walking and cycling: Findings from the transportation, urban design, and planning literatures. Ann. Behav. Med. 2003, 25, 80–91. [Google Scholar] [CrossRef] [PubMed]
  29. Ewing, R.; Handy, S. Measuring the Unmeasurable: Urban Design Qualities Related to Walkability. J. Urban Des. 2009, 14, 65–84. [Google Scholar] [CrossRef]
  30. Gelh, J. Cities for People; Island Press: Washington, DC, USA, 2010. [Google Scholar]
  31. Ewing, R.; Cervero, R. Travel and the Built Environment: A Meta-Analysis. J. Am. Plan. Assoc. 2010, 76, 265–294. [Google Scholar] [CrossRef]
  32. Ewing, R.; Handy, S.; Brownson, R.; Clemente, O.; Winston, E. Identifying and Measuring Urban Design Qualities Related to Walkability. J. Phys. Act. 2006, 3 (Suppl. 1), S232–S240. [Google Scholar] [CrossRef]
  33. Capolongo, S. Qualità Urbana, Stili di Vita, Salute. Indicazioni Progettuali per il Benessere; Hoepli: Milano, Italy, October 2009. [Google Scholar]
  34. Green SOAP. A Calculation Model for Improving Outdoor Air Quality in Urban Contexts and Evaluating the Benefits to the Population’s Health Status. In Integrated Evaluation for the Management of Contemporary Cities; Buffoli, M., Rebecchi, A., Gola, M., Favotto, A., Procopio, G.P., Capolongo, S., Eds.; Springer: Cham, Switzerland, 2018; pp. 453–467, Print ISBN: 978-3-319-78270-6. Online ISBN: 978-3-319-78271-3. [Google Scholar] [CrossRef]
  35. Croucher, K.; Wallace, A.; Duffy, S. The Influence of Land Use Mix, Density and Urban Design on Health: A Critical Literature Review; The University of York: York, UK, 2012; pp. 3–25. [Google Scholar]
  36. Active Living Research. Promoting Activity-Friendly Communities; Active Living Research: San Diego, CA, USA, 2015; pp. 3–7. [Google Scholar]
  37. Health Development Agency. Making the Case: Improving Health through Transport; Health Development Agency: London, UK, 2005. [Google Scholar]
  38. Sallis, J.F.; Glanz, K. Physical activity and food environments: Solutions to the obesity epidemic. Milbank Q. 2009, 87, 123–154. [Google Scholar] [CrossRef] [PubMed]
  39. Heath, G.; Brownson, R.C.; Kruger, J.; Miles, R.; Powell, K.E.; Ramsey, L.T.; Task Force on Community Preventive Services. The effectiveness of urban design and land use and transport policies and practices to increase physical activity: A systematic review. J. Phys. Act. Health 2006, 3 (Suppl. 1), S55–S76. [Google Scholar] [CrossRef]
  40. Croucher, K.L.; Myers, L. The Health Impacts of Urban Green Spaces: A Literature Review; Centre for Housing Policy, University of York: York, UK, 2008. [Google Scholar]
  41. McCormack, G.; Giles-Corti, B.; Lange, A.; Smith, T.; Martin, K.; Pikora, T. An update of recent evidence of the relationship between objective and self-report measures of the physical environment and physical activity behaviors. J. Sci. Med. Sport 2004, 7, 81–92. [Google Scholar] [CrossRef]
  42. Foster, S.; Giles-Corti, B. The built environment, neighborhood crime and constrained physical activity: An exploration of inconsistent findings. Prev. Med. 2008, 47, 241–251. [Google Scholar] [CrossRef]
  43. Semenza, J.; Krishnasamy, P. Design of a health-promoting neighborhood intervention. Health Promot. Pract. 2007, 8, 243–256. [Google Scholar] [CrossRef] [PubMed]
  44. Capolongo, S.; Buffoli, M.; Oppio, A. How to assess the effects of urban plans on environment and health. Territorio 2015, 73, 145–151. [Google Scholar]
  45. Capasso, L.; Faggioli, A.; Rebecchi, A.; Capolongo, S.; Gaeta, M.; Appolloni, L.; De Martino, A.; D’Alessandro, D. Aspetti igienico-sanitari in ambito urbanistico: Conflittualitaà nelle norme urbanistiche nazionali e locali in tema di sanitaà pubblica. Epidemiol. Prev. 2018, 42, 60–64. [Google Scholar] [CrossRef]
  46. Lavey, J.; Hill, J. What Is Walkability? 2 February 2014. Available online: http://communitybuilders.org/walkability/ (accessed on 13 May 2019).
  47. Lo, R.H. Walkability: What is it? J. Urban. 2009, 2, 145–166. [Google Scholar] [CrossRef]
  48. Forsyth, A. What is a walkable place? The walkability debate in urban design. Urban Des. Int. 2015, 20, 274–292. [Google Scholar] [CrossRef] [Green Version]
  49. Vale, D.S.; Saraiva, M.; Pereira, M. Active accessibility: A review of operational measures of walking and cycling accessibility. J. Transp. Land Use 2016, 9, 209–235. [Google Scholar] [CrossRef]
  50. Coppola, L.; Ripamonti, E.; Cereda, D.; Gelmi, G.; Pirrone, L.; Rebecchi, A. 2015–2018 Regional Prevention Plan of Lombardy (Northern Italy) and sedentary prevention: A cross-sectional strategy to develop evidence-based programmes. Epidemiol. Prev. 2016, 40, 243–248. [Google Scholar] [CrossRef] [PubMed]
  51. Rebecchi, A.; Boati, L.; Oppio, A.; Buffoli, M.; Capolongo, S. Measuring the expected increase in cycling in the city of Milan and evaluating the positive effects on the population’s health status: A Community-Based Urban Planning experience. Ann. Ig. 2016, 28, 381–391. [Google Scholar] [CrossRef]
  52. Eurostat Urban Audit 2012. Available online: https://ec.europa.eu/eurostat/web/gisco/geodata/reference-data/administrative-units-statistical-units/urban-audit (accessed on 13 May 2019).
  53. Capolongo, S.; Lemaire, N.; Oppio, A.; Buffoli, M.; Roue Le Gall, A. Action planning for healthy cities: The role of multi-criteria analysis, developed in Italy and France, for assessing health performances in land-use plans and urban development projects. Epidemiol. Prev. 2016, 40, 257–264. [Google Scholar] [CrossRef] [PubMed]
  54. Saaty, R.W. The Analytic Hierarchy Process—What it is and how it is used. Math. Model. 1987, 9, 161–176. [Google Scholar] [CrossRef]
  55. Saaty, T.L. Decision making with the analytic hierarchy process. Int. J. Serv. Sci. 2008, 1, 83–98. [Google Scholar] [CrossRef]
  56. Oppio, A.; Buffoli, M.; Dell’Ovo, M.; Capolongo, S. Addressing decisions about new hospitals’ siting: A multidimensional evaluation approach. Ann. Ist. Super Sanità 2016, 52, 78–87. [Google Scholar] [PubMed]
  57. Relazione Generale e Catalogo della Ricognizione Dell’offerta dei Servizi, PGT_Piano dei Serviz; Allegato n. 3 (Le 88 schede NIL); Assessorato allo Sviluppo del Territorio: Milano, Italy, 2010; p. 9.
  58. D’Alessandro, D.; Appolloni, L.; Capasso, L. How wakable is the city? Application of the walking Suitability Index of the Territory (T-WSI) to the city of Rieti (Lazio Region, Central Italy). Epidemiol. Prev. 2016, 40, 237–242. [Google Scholar] [PubMed]
  59. D’Alessandro, D.; Buffoli, M.; Capasso, L.; Fara, G.M.; Rebecchi, A.; Capolongo, S. Green areas and public health: Improving wellbeing and physical activity in the urban context. Epidemiol. Prev. 2015, 39, 8–13. [Google Scholar] [PubMed]
  60. Fehr, R.; Capolongo, S. Healing environment and urban health. Epidemiol. Prev. 2016, 40, 151–152. [Google Scholar] [CrossRef]
  61. Oppio, A.; Bottero, M.; Giordano, G.; Arcidiacono, A. A multi-methodological evaluation approach for assessing the impact of neighbourhood quality on public health. Epidemiol. Prev. 2016, 40, 249–256. [Google Scholar] [PubMed]
  62. D’Alessandro, D.; Appolloni, L.; Capasso, L. Public Health and urban planning: A powerful alliance to be enhanced in Italy. Ann. Ig. 2017, 29, 452–463. [Google Scholar]
  63. D’Alessandro, D.; Assenso, M.; Appolloni, L.; Cappuccitti, A. The Walking Suitability Index of the Territory (T-WSI): A new tool to evaluate urban neighborhood walkability. Ann. Ig. 2015, 27, 678–687. [Google Scholar]
Figure 1. Frequency distribution of parameters in the reviewed literature and cut-off level for the selection of Macro and Micro parameters.
Sustainability 11 02778 g001
Figure 2. Milan Walkability Measurement structure.
Sustainability 11 02778 g002
Figure 3. Priorities assigned by experts to criteria and their related items.
Sustainability 11 02778 g003
Figure 4. Examples of the analytical tables of records.
Sustainability 11 02778 g004
Figure 5. Macro final assessment: Macro scores are represented graphically using pie charts, potential circles, and histograms.
Sustainability 11 02778 g005
Figure 6. Final Micro assessment: Micro scores are represented graphically using pie charts, potential circles, and histograms.
Sustainability 11 02778 g006
Table 1. Literature overview results.
ARTICLESAUTHORSJOURNALNAME OF TOOLS
1Developing a research and practice tool to measure walkability: a demonstration project.Giles-Corti, B. (McCaughey VicHealth Centre for Community Wellbeing, School of Population and Global Health, The University of Melbourne–Australia) et al.Health Promot J Austr. 2014 Dec; 25(3):160–6. doi:10.1071/HE14050.Walkability Index (WAI)
2Correlates of walking for transportation and use of public transportation among adults in St Louis, Missouri, 2012.Zwald, ML. (Prevention Research Center in St Louis, Brown School, Washington University in St Louis–St Louis) et al.Prev Chronic Dis. 2014 Jul 3; 11:E112. doi:10.5888/pcd11.140125.International Physical Activity Questionnaires (IPAQ)
Neighborhood Environment Walkability Survey (NEWS)
3Walkability is only part of the story: walking for transportation in Stuttgart, Germany.Reyer, M (Department of Sport and Exercise Science, Chair Exercise and Health Sciences, University of Stuttgart–Germany) et al.Int J Environ Res Public Health. 2014 May 30; 11(6):5849–65. doi:10.3390/ijerph110605849.Walkability Index (WAI)
Walk Score
4Perceived neighborhood environmental attributes associated with adults’ transport-related walking and cycling: Findings from the USA, Australia and Belgium.Van Dyck, D. (Department of Movement and Sport Sciences, Ghent University–Belgium) et al.Int J Behav Nutr Phys Act. 2012 Jun 12; 9:70. doi:10.1186/1479-5868-9-70.IPAQ
NEWS
5Walk score™ as a global estimate of neighborhood walkability.Carr, LJ. (Centers for Behavioral and Preventive Medicine, The Miriam Hospital, Warren Alpert Medical School at Brown University, Rhode Island–USA) et al.Am J Prev Med. 2010 Nov; 39(5):460–3. doi:10.1016/j.amepre.2010.07.007.Walk Score
6Bicycle use for transport in an Australian and a Belgian city: associations with built-environment attributes.Owen, N. (Cancer Prevention Research Centre, School of Population Health, The University of Queensland, Herston–Australia) et al.J Urban Health. 2010 Mar; 87(2):189–198. doi:10.1007/s11524-009-9424-x.IPAQ
7Neighborhood Environment Walkability Scale: validity and development of a short form.Cerin, E. (Institute of Human Performance, The University of Hong Kong, Hong Kong-China) et al. Med Sci Sports Exerc. 2006 Sep; 38(9):1682–91.IPAQ
NEWS
8The Association between walking and perceived environment in Chinese community residents: a cross-sectional study.Jia, Y. (School of Public Health, Key Lab of Public Health Safety of the Ministry of Education, Fudan University, Shanghai–China) et al.PLoS One. 2014 Feb 27;9(2):e90078. doi:10.1371/journal.pone.0090078. eCollection 2014.IPAQ
Neighborhood Environment Walkability Scale-Abbreviated (NEWS-A)
9Sharing good NEWS across the world: developing comparable scores across 12 countries for the Neighborhood Environment Walkability Scale (NEWS).Cerin, E. (Institute of Human Performance, The University of Hong Kong, Hong Kong–China) et al.BMC Public Health. 2013 Apr 8; 13:309. doi:10.1186/1471-2458-13-309.NEWS/NEWS-A
10Neighborhood Environment Walkability Scale for Youth (NEWS-Y): reliability and relationship with physical activity.Rosenberg, D. (Joint Doctoral Program in Clinical Psychology, San Diego State University and University of California, San Diego–USA) et al.Prev Med. 2009 Aug-Sep; 49(2–3):213–8. doi:10.1016/j.ypmed.2009.07.011. Epub 2009 Jul 24.Neighborhood Environment Walkability Scale-Youth (NEWS-Y)
11Residents’ perceptions of walkability attributes in objectively different neighbourhoods: a pilot study.Leslie, E. (Cancer Prevention Research Centre, School of Population Health, The University of Queensland, Brisbane–Australia) et al.Health Place. 2005 Sep; 11(3):227–36.NEWS
12Objective assessment of urban built environment related to physical activity-development, reliability and validity of the China Urban Built Environment Scan Tool (CUBEST).Su, M. (Department of Epidemiology and Biostatistics, School of Public Health, Peking University, Beijing–China) et al.BMC Public Health. 2014 Feb 4; 14:109. doi:10.1186/1471-2458-14-109.China Urban Built Environment Scan Tool (CUBEST)
Analytic Audit Tool (AAT)
Active Neighborhood Checklist (ANC)
Neighborhood Active Living Potential (NALP)
Pedestrian Environment Data Scan Tool (PEDS)
Physical Activity Resource Assessment (PARA)
Neighborhood Audit Instrument (PIN3)
Sidewalk Assessment Tool (SAT)
Systematic Pedestrian And Cycling Environmental Scan (SPaCES)
Systematic Social Observation Of Public Spaces: A New Look at Disorder in Urban Neighborhoods (SSOPS)
13Connectivity and physical activity: using footpath networks to measure the walkability of built environments.Geraint, E. (School of Planning, Architecture and Civil Engineering, Queen’s University, Belfast–Northern Ireland) et al.Environment and Planning B: Urban Analytics and City Science, Oct 2015. doi:10.1177/0265813515610672.The Park Study
14Q-PLOS, developing an alternative walking index. A method based on urban design quality.Talavera, Garcia R. (Department of Urban and Spatial Planning, University of Granada–Spain) et al.Cities, Volume 45, June 2015, Pages 7–17. doi:10.1016/j.cities.2015.03.003.Quality of Pedestrian Level of Service (Q-PLOS)
15Alberta Health Services’ Built Environment Indicators Review: Summary Report.Fraser, N. (Health Status Assessment, Population and Public Health, Alberta Health Srevice) et al.Grey Literature (report)Using Built Environment Characteristics to Predict Walking for Exercise (UBEPW)
Linking Objectively Measured Physical Activity with Objectively Measured Urban Form
16A longitudinal analysis of the influence of the neighborhood built environment on walking for transportation: the RESIDE study.Knuiman, MW.Am J Epidemiol. 2014 Sep 1; 180(5):453–61. doi:10.1093/aje/kwu171. Epub 2014 Aug 11.The Reside Study
17The Walking Suitability Index of the Territory (T-WSI): a new tool to evaluate urban neighborhood walkability.D’Alessandro, D (Department of Civil Building Environmental Engineering, Sapienza University of Rome–Italy) et al.Ann Ig. 2015 Jul-Aug; 27(4):678–87. doi:10.7416/ai.2015.2059.The Walking Suitability Index Of The Territory (T-WSI)

