Article

Do Bus Rapid Transit Systems Improve Accessibility to Job Opportunities for the Poor? The Case of Lima, Peru

1
Lecturer Development Planning Unit, University College London, London WC1H 9EZ, UK
2
Inter-American Development Bank, Washington, DC 20577, USA
3
Louis Berger, 96 Morton St, New York, NY 10014, USA
*
Authors to whom correspondence should be addressed.
Sustainability 2019, 11(10), 2795; https://doi.org/10.3390/su11102795
Submission received: 12 March 2019 / Revised: 9 May 2019 / Accepted: 10 May 2019 / Published: 16 May 2019
(This article belongs to the Special Issue Accessibility and Transportation Equity)

Abstract

:
Investments in public transit infrastructure in Latin America and the Caribbean often aim to reduce spatial and social inequalities by improving accessibility to jobs and other opportunities for vulnerable populations. One of the central goals of Lima’s Bus Rapid Transit (BRT) project was to connect low-income populations living in the peripheries to jobs in the city center, a policy objective that has not yet been evaluated. Building on secondary datasets of employment, household socio-demographics and origin–destination surveys before and after the BRT began operations, this paper examines the contribution of Lima’s BRT system to accessibility to employment in the city, particularly for low-income public transit users. We estimated the effects on potential accessibility to employment, comparing impacts on lower versus higher income populations, and assessed the changes in location-based accessibility to employment before (2004) and after implementation (2012) for treatment and comparison groups. We found that the BRT line reduced travel times for commuters to reach jobs, in comparison with traditional public transport in the city. However, the coverage of the BRT declines in areas with high concentrations of poor populations, limiting the equitability of accessibility improvements. The analysis by socioeconomic sub-groups found positive effects of the BRT system on accessibility for the higher income areas. Relative to the control group, accessibility increased in the 10-km boundary area of the BRT by 0.01, a seven percent increase relative to the treatment baseline accessibility index in the higher socioeconomic (SES) areas of the city. In contrast, in the areas with high concentrations of lower SES populations, the double difference estimate indicated an 11 percent decrease relative to the baseline accessibility index (0.09). We build on case-specific findings and international literature to reflect on policy avenues to include the poor in the mobility benefits of BRT systems. These measures include targeted fare subsidies for low-income groups, fare integration with other forms of public transport that reduce the cost of transfers, and the increase of coverage of the BRT through the integration of stations with non-motorized infrastructure.

1. Introduction

Rapid urbanization in Latin American cities coupled with a fragmented planning and policies to manage such growth has led to several transport development challenges including increased traffic congestion and air pollution, and the proliferation of urban sprawl and informal settlements difficult to serve with public transport systems [1]. The share of the population in Latin America living in urban areas increased from 40% to around 80% from 1950 to 2014 and is expected to increase to 90% by 2050 [1]. Increased demand for centrally located land associated with rapid urbanization has, in-turn, pushed lower income populations to move to the outskirts of cities in search of affordable housing, leading to patterns of urban growth that tends to be sprawling, informal, and lacking in adequate transport infrastructure services. This in turn has led to an increase in both time and monetary costs associated with transportation for the poor.
By being farther from the city center, lower income citizens tend to experience longer travel times due to larger distances to job and other activity centers, poor local coverage of public transport that leads to long walking times to reach bus stops and transit stations, traffic congestion, and more transfers. In addition, these populations often suffer the highest burdens related to negative transport externalities in cities, including higher exposure to pollution and risk of traffic accidents [2,3]. Together these factors exacerbate the already low level of access to jobs and other economic opportunities and increase social and economic exclusion among the poor.
In this paper, we assess the extent to which Lima’s Bus Rapid Transit (BRT) system increased access to employment measuring potential accessibility and the spatial distribution of opportunities in the city. Rapid transit bus systems are often touted as efficient, cost-effective, public transport solutions for cities facing mobility challenges associated with rapid urbanization and motorization, particularly in cities of the Global South [4,5,6,7]. Designed to emulate several features of rail-based systems, BRT systems tend to have significantly lower capital and operating costs and usually have much shorter start-up times on average vis-à-vis rail-based systems [1,4,5,6,7]. Implemented in various cities across Latin America, searching to restructure transport networks to improve operational inefficiency and address large levels of informality in public transport services, these systems typically aim to increase overall mobility while also reducing negative externalities such as traffic accidents and emissions of local and global pollutants. Additionally, they often seek to improve mobility and access to jobs, goods, and services for the poor [1,8,9].
Reduced travel times to reach destinations as a result of investments in faster and more efficient public transport is theorized to increase access to previously inaccessible job markets for isolated social groups living within the area of influence of the system, thereby increasing the likelihood of formal employment, increased income, and potential accumulation of assets [10,11]. Although a wide body of research exists surrounding the general impacts of BRT systems, there is little research on the extent to which these systems improve accessibility among low-income populations, and what policy measures are needed to improve the distributional outcomes of such transit investments, particularly in the developing country context. Thus, this study contributes to a gap in the literature on the accessibility benefits of BRT systems for socially vulnerable populations, providing empirical evidence on the case of Lima, Peru, a large and rapidly growing capital city in Latin America. This is the first study to discuss the contributions and limitations of single-corridor investments in the context of high levels of de-regulation and informality of the public transport sector and a lack of a systemic reconfiguration of the public transport supply in the city.
First, utilizing data on employment, socio-economic status, and other demographic variables at the household level before and after the BRT system, we assess the effects on accessibility to employment for lower income groups. We hypothesize that reduced travel times for Lima’s urban poor living near BRT stations and feeder lines associated with the project may increase access to a wider array of opportunities and jobs and lead to an overall reduction of generalized costs of travel, which may alleviate time poverty and increase rates of employment amongst those living within the areas of influence of the system. To test this hypothesis, we analyze the spatial distribution of opportunities for employment in Lima and how these patterns are influenced by land-use and other features of the city. Next, we explore the changes in potential accessibility to employment opportunities attributable to the BRT in low-income areas of Lima. Finally, we discuss policies to improve the distributional outcomes, and thus the inclusion of the poor in mobility benefits of BRT system investments by increasing the understanding of factors that contribute or impede access to employment via mass transit. The results of this analysis offer lessons and recommendations for future urban transport projects aimed at improving mobility and accessibility for the urban poor. This research is also relevant in a global policy context in which accessibility has been recognized as an essential part of sustainable and inclusive development, as reflected by the United Nations Sustainable Development Goals for 2030 (11.2) of providing “access to safe, affordable, accessible, and sustainable transport systems for all” with a specific focus on the needs of those in vulnerable situations.
We found that the BRT line reduced travel times to reach jobs amongst populations living within walking distance of the system; however, the limited coverage of the BRT in areas with high concentrations of poor populations led to a concentration of these accessibility benefits to higher income areas. Our scenario analysis of the accessibility gains in the system suggests larger reductions in travel times for longer trips from outlying areas, which are often made by the poor. However, given that the system is the first of several planned lines, it carries a small fraction of the total city’s public transit demand, limiting the role of the system in containing an otherwise general increase in travel costs for work trips by public transport over the study period.
The study case of Lima contributes to current debates around the effectiveness of BRT investments with limited scope and social and physical coverage of the system. In contrast to other cases covered in the literature on impacts of BRT systems, such as in Colombian, Brazilian, and Mexican cities, it also provides an analysis of a unique context in which high levels of informal employment and mixed-use of residential land contribute to a more decentralized distribution of economic activities.
This paper is structured as follows. The next section summarizes the literature on (i) issues surrounding poverty and urban transport in the Latin American and Caribbean region, (ii) the concept of and related research on BRT systems, (iii) definitions of accessibility and studies measuring the distributional effects public transit investments (including BRTs) on job accessibility, and (iv) background information about the metropolitan area of Lima and details on the BRT project. Section 3 and Section 4 provide details on the data sources and the empirical strategy utilized to estimate the accessibility impacts. Section 5 and Section 6 present the results and analysis of the findings and Section 7 concludes with a discussion on the implications and policy recommendations that unfold from the research findings.

2. Literature Review

2.1. Poverty and Urban Transport in the Latin American and Caribbean Region

Economic poverty remains a pressing issue in the Latin America and the Caribbean region. Although over 72 million people in region have transitioned out of poverty and nearly 94 million have joined the middle class, since 2003, 42% of the region’s population (140 million) still live in economic poverty, while nearly 67 million people are below the poverty line of US $2.5 per day. In Latin American cities, poverty tends to be concentrated in peripheral areas far from jobs and other economic activities. This spatial segregation of the poor from skill-appropriate job centers has been theorized to decrease the affordability of job search and access, and thus increases unemployment [10]. Reduced access to a wider job market may, in turn, contribute to the persistence of poverty by reinforcing the restrictions on the availability of resources and disposable income for household travel.
People experiencing economic poverty often must make tradeoffs in the allocation of limited disposable income for transport and other essential needs, which can significantly reduce their mobility and accessibility to employment, education, and other relevant social and cultural opportunities [11,12,13,14]. This may hinder their ability to accumulate enough assets to overcome poverty. As low-income populations are often captive users of public transport or rely on non-motorized travel (because of affordability barriers to access transit or private vehicles), travel expenditures can consume 30% or more of daily wages of the poor, adding to the already high travel time costs, which in some cases can exceed two hours [14].
Higher travel expenditures and long travel times can also often lead to immobility and social exclusion among vulnerable members of poor households, as resources are prioritized to pay for work or income generating trips. For example, while bus users spend on average 58.8 min per trip, car users in the region spend on average 25.5 min per trip [15]. In addition, transit users buying up to 50 tickets per month can spend up to 20% of their income, while car users tend to spend on average below 10% [8,9,10,11,12]. These longer and more expensive trips can result in time deprivation for opportunities such as higher education, as well as leisure, and in some cases, social interactions [5]. The poor, in fact, tend to sacrifice trips, with the majority in the cities of developing countries making on average between one-fifth and one-third fewer trips per capita than the non-poor [7,8,16]. This can reduce available resources among non-working household members for travel, who may also suffer from acute time poverty, since they assume more household responsibilities such as home making and caring for children and the elderly [16].
Gaps in infrastructure supply and quality can also exasperate the barriers created by spatial gaps between housing and jobs. Although there are approximately 245,000 km of road available for circulation in metropolitan areas of Latin America (17 km/km2), their quality is precarious in most cities [17]. In addition, public transport modes tend to have lower priority in the allocation of road space [17], with between 98% and 99% of total road space in cities of Latin America being dedicated to private vehicles and scant provision of exclusive roads for pedestrian circulation, which in the region represents only 0.4% of built infrastructure [17]. Higher quality road infrastructure in good condition and preferential pedestrian and cyclist spaces tend to be concentrated in and around the central business districts (CBDs) of different metropolises and higher income neighborhoods, while most of the damaged and unsurfaced roads are in low-income (and often peripheral) areas [17,18].

2.2. Accessibility: Policy Relevance, Concepts, Measurement, and the Links with Social Exclusion

The new agenda for sustainable development recognizes the transformative role of cities as catalysts for the development of not only more sustainable societies, but ones that can be more inclusive and resilient [19]. Such an agenda does not only recognize the role of cities in human development, but also the role of transport in urban development, social equity, and inclusion. The increasing attention to accessibility and the analysis of transport interventions from this perspective have given rise to new metrics and perspectives of accessibility that highlight that not all people are in the same position to travel and take advantage of the opportunities cities offer for employment, education, leisure, and social interactions [19]. Within this agenda, the term social exclusion, while still heavily reliant on income measures, also acknowledges that there may be other barriers which make it difficult for people to participate fully in society [20]. These barriers may include a lack of employment, suitable housing, education, health care, and transport [13].
Measuring accessibility can be a key factor in equity analysis, for example when evaluating the distribution of access benefits of new transport systems across income or spatial groups [21,22,23,24]. Its measurement requires robust definitions of accessibly and adequate data to measure the characteristics and expected benefits of such interventions. Definitions of accessibility in the literature vary widely. Nearly all accessibility definitions and measurements consider the potential range of interactions within transportation networks and the spatial and economic constraints of movement within an urban area [25,26,27,28]. Other definitions include the ease of reaching areas of activities within a given transport system, ref. [25] and the overall benefits provided by a given transport system [25]. Hansen [25] was one of the first to look at accessibility as the bridge between transport and land-use. In 1973, Wachs and Kumagai [27] identified the need for accessibility indicators to measure inequalities in physical mobility as major contributors to social and economic inequalities. Finally, recent studies have applied analyses such as Lorenz Curves and the Palma Ratio to accessibility distributions, producing evidence on the gaps between social and economic groups in access to employment and other essential opportunities [29,30,31,32,33,34].
Framing the concept at different scales, from the individual to neighborhoods and communities, van Wee, Geurs and Chorus [35] identify four components of accessibility: land-use, transportation, temporal, and individual. The interaction between these components is argued, in turn, to influence access. For instance, the distribution of activities in space (land-use) is a determining factor in travel demand (transport), and it can also produce time constraints (temporal) and influence people’s opportunities (individual). The linkages between better connectivity brought about by investments in transport infrastructure (transport), the subsequent consolidation of land uses, and changes in land market (accessibility surplus), can act together to influence the distribution of activities and travel costs along the land-use, transport, and individual components of accessibility fostering significant changes in access to social and economic opportunities available in cities [35]. The individual component may interact with other determinants of accessibility, in turn, affecting the subjective interpretation and valuation of the variables considered in transport disutility, preferences for activities and the availability of time for specific activities.
Various measures of accessibility have been developed to assess these potential interactions between the cost of travel and opportunities [26,27,28]. Infrastructure-related measures link the effects of transport infrastructure and services, considering the coverage of infrastructure, density, and land-use, on the connectivity of people to places and activities [35]. Activity-related measures account for land-uses and the locations of opportunities, estimating the number of activities that can be reached within a given range of travel cost. Gravity measures are a variation of location-based accessibility [36] and are calculated using estimates of generalized costs to travel from origin-zones to all other zones of the area of study, weighting each zone by its overall attractiveness in terms of the number of jobs, stores, schools or other opportunities. Measures of accessibility to employment are significantly affected when competition factors, understood as the matching between abilities, education, and experience between an individual and a given job position, are incorporated in the estimation of accessibility indicators [35].
Several studies have examined the relationships of transport investments and accessibility with a focus on equity in Latin American cities, finding that transport access is highly unequal among socioeconomic groups [22,37,38]. Bocarejo and Oviedo [22] found that for the city of Bogotá, high-income populations had potential access to one or more employment positions per inhabitant at costs equal or below their preferred expenditure, while the poor had access to 0.2 to 0.5 jobs per inhabitant even when expending more than their desired budgets for time and money to invest in transportation. Another study found that low-income homemakers and employed women in Recife, Brazil, walk up to 2 km for accessing shopping, 1.2 km for education, 1.5 km for health care, and 4.3 km for work [36]. In Montevideo, Uruguay, Hernandez and Rossel [38] found that long waiting times for public transport and high tariffs prevent low-income families from accessing adequate health care for their children, and that peripheral households tended to trade-off distance for cost in choosing where to address their health care needs.

2.3. BRT: Characteristics and Research on Their Social Benefits

Rapid transit bus systems encompass a variety of operational and infrastructure measures that when well-coordinated, can provide rapid transit service like that of metro systems. Basic elements of a full BRT system include: (i) a dedicated right of way (often aligned in the center of the road), (ii) intersection treatments such as bus signal prioritization and the prohibition of left-hand turns by private vehicles to minimize conflicts with mixed traffic and delays at intersections, and (iii) off-board fare collection systems and level platform boarding, to facilitate boarding, alighting, and access for disabled passengers and passengers with strollers or shopping carts, while also reducing delays associated with on-boarding and off-boarding passengers. They also often utilize modern low-emission vehicles and intelligent transportation systems to reduce pollution, monitor and optimize bus operations, and inform passengers of next bus arrival times [4].
A common BRT business model used in Latin American and Caribbean (LAC) cities includes three components of publicly managed through public–private partnerships: (i) the infrastructure, (ii) the bus operations, and (iii) the fare collection. These latter two costs are usually paid in-part, or in full, from the tariff revenues generated by the BRT operations [4]. Under this arrangement, the role of the public sector is to ensure that service responds to local objectives and that the private sector has the incentives to improve cost-efficiency and provide high-quality service. Alternative models include those in which the public sector has an increased role or in which services are completely publicly owned and operated. A range of system approaches have been implemented in LAC, from single isolated corridors, to planned incremental reform of the entire system in stages, to large scale reorganization of entire systems at once (Santiago, Chile).
In some cases, in terms of both an infrastructure and operations, BRT systems can achieve significantly improved service quality, and higher average speeds and capacities than conventional bus systems [4]. Average speeds of systems range from 18 to 28 km/hour (compared with 7–14 km/hour for a conventional bus). They also can potentially reduce tailpipe emissions of local and global pollutants when accompanied by appropriately designed fleet modernization programs [2] and to reduce traffic accidents [3] through improvements in street geometry and design (e.g., inclusion of medians that serve as points of pedestrian refuge and reductions in left-hand turns), driver training and monitoring, and improvements to the organization and flow of traffic.
The effects of BRT systems on equity in cities in the global south have been documented in several past studies [12,13,14,39,40,41,42,43]. The findings in this literature suggest that while the systems often reduce travel times and costs and increase accessibility for low-income groups, the bulk of these benefits are often accrued among the middle class. The benefits to the poor are curtailed by insufficient spatial coverage, as most trunk routes are initially deployed along high-volume corridors in and near city centers, where they tend to serve older, better-off neighborhoods. For example, the first phases of the Masivo Integrado de Occidente (MIO) BRT system of Santiago de Cali (Colombia) covered only 9% of city districts, located mostly in the central parts of the city, and skewing benefits in favor of the middle and upper-middle income groups [42,43]. In addition, fare policies frequently do not take into consideration affordability of the new systems for lower income groups, and the reorganization of existing transport services and restructuring of routes and fares associated with the implementation of BRT systems can limit the distribution of travel efficiency benefits to lower income households, particularly that these households tend to live in outlying areas with poor quality or no feeder services [15,39,42]. These studies have found that the enhancement of pro-poor benefits requires targeted policies such as integration with other transit, targeted fare subsidies, and the provision of affordable housing near stations.
Several studies have estimated impacts of BRT systems on access to work opportunities in Latin American and other cities [11,30,44,45,46,47,48,49,50,51]. These authors estimate the distribution of benefits in terms of the reduction in travel times associated with improved transport systems across different areas in a city and the effects on access of low income or vulnerable populations to employment centers. Other studies have examined how employment outcomes and distance or access to urban transport systems are correlated, finding that proximity to a system is correlated with lower levels of unemployment [44] or with a lower probability of being informally employed [45]. Martinez et al. [46] analyzed the impacts of urban transport systems investments in Lima (i.e., including both a metro line and the BRT trunk), on employment outcomes for women versus men, finding large effects for women, which may be attributed to the greater security women feel while traveling in these improved systems in addition to travel time savings. Scholl et al. [47] study the impact of the BRT system (trunk and feeder lines) on informal employment in Lima, finding positive impacts on labor outcomes concentrated on individuals living close to the trunk line, and no impacts on individuals living in outlying areas served by the feeders. No studies to date have examined the distributional impact of the Lima BRT on accessibility in terms of travel time and costs for lower versus higher income areas.

2.4. The Metropolitan Area of Lima and Its BRT System

Lima, the capital of Peru, is one of the fastest growing urban areas in Latin America. Its population of slightly above 9.9 million represents about one-third of the population of the country [1]. The city includes the urban population of the provinces of Lima and Callao. Between 2007 and 2012, Lima’s population increased by 11%. General trends of economic growth in Lima and Peru have led to a relatively stable increase in individual income since 2007. The distribution of socio-economic groups reflects historic development patterns of Lima. New rural migrants typically settled in the urban periphery, while the middle-class and elites moved to the city center [52]. Today, Lima’s low-income populations still live mainly in the periphery of the city in the northern and southern cones, while high-income populations are concentrated in the central and south-central areas of the city.
The 2007 Population Census classification system includes five strata of socio-economic status (SES) based upon consumption measures, where populations in stratum A correspond to the highest SES group, and stratum E corresponds to the lowest SES group. For the purposes of this paper, we refer to high-income as strata A and B, and poor and extreme poor as strata D and E, respectively. Forty-two percent of the extreme poor (stratum E) and 19% of the poor population (stratum D) live at least 9 km from the city center. The extreme poor also frequently live in informal settlements characterized by a general lack of infrastructure and public services [51,52]. Many lower SES neighborhoods are outside the immediate area of coverage of the mass transit lines in the north and west of the city.
Labor informality rates, although declining in recent years, are high in Lima, Peru. In 2014, 11.5 million Peruvians (72.8%) were directly or indirectly involved in informal employment, with 8.8 million (55.9%) working within the informal sector and 2.7 million (17.0%) working as informal workers in the formal sector [51]. Informal workers are defined as: (i) unpaid family workers in firms with less than five employees; (ii) independent workers in the informal sector (running small, non-registered private sector firms); and (iii) dependent workers who work in non-registered (with the tax authority) private sector firms, or whose employers do not contribute to the pension system [51]. A formal firm is defined as firms registered with the tax authority and carry accounting books, or with more than five employees. Informal workers tend to earn lower wages, enjoy fewer employment benefits such as health care and retirement programs, and have lower job stability.
Lower-income groups in the city tend to have longer travel times and higher comparative rates of public transit use. They have lower per capita vehicle ownership rates and make the largest share of their daily trips on foot—28% of trips in stratum D and 35% in stratum E—followed by trips on traditional buses [37]. Public transit services in the traditional system encompass a mix of formal and informal supply. Approximately 30% of public transit services are categorized as informal (or unregulated), which is associated with poor service quality as well as high levels of traffic accidents and air pollution [52].
Lima’s BRT project, “El Metropolitano,” was the first line of a city-wide mass transit solution planned for the city. The trunk corridor comprises 28.6 km of segregated busway connecting the northern and southern areas of Lima with the financial district, major universities, and the city’s historic downtown [1]. The line also integrates feeder routes that extend up to 14 km and connect the two terminals with the surrounding and primarily low-income neighborhoods in the north and south. Several services including four regular services that stop at each station, eight express, and two super-express services that skip stations via passing lanes to provide faster service between high-demand stations operate via the north–south corridor. In addition, 20 feeder routes originate at each of the two trunk line terminals (Figure 1).
Inaugurated in 2010, the Metropolitano was the first of several Bus Rapid Transit lines planned as part of the Metropolitan Lima Urban Transport Program [1]. This program intended to transform the city’s chaotic transport system, by increasing overall mobility, providing an efficient public transport service between the most populous areas of the city to important employment center, and reducing the social and environmental costs of transport. The system operates principally along Avenida Tupac Amaru and along the center of the Via Express highway. With thirty-eight stations spanning 12 Lima districts, it connects lower-income neighborhoods in the northern and southern cones of the city, with the financial district, major universities, and the historic downtown. It also includes several travel-time saving features including 28.6 km of dedicated busway along the trunk (see Figure 1), level passenger boarding, enabled by raised-platform buses, pre-boarding fare collection, an electronic card payment system, and high-capacity articulated buses.
In addition to reducing travel times along the corridor, one of the key objectives of the project was to connect low-income populations living in the far-flung outreaches of the sprawling and congested metropolitan area to jobs in the center. Prior to the opening of the line, the corridor, and city was plagued by an oversupply of polluting and unregulated minivan transit providers, leading to lengthy commutes of up to 2 h in each direction for those living in the periphery. Travel time savings of the system were significant, with the average trip time from one end of the trunk line to from an average 55 min to 35 min along the BRT trunk corridor [1]. Although prior research on the system has found that the system carries a fair number of lower income groups, coverage in areas in extreme poverty is limited. Nevertheless, the poor and extreme poor tend to use the system for longer trips and to reach work or education.
The system opened with only 22% of the planned articulated buses and five feeder routes in operation due in part to low demand and unfinished infrastructure [39,53]. A year and half later (mid-2012), only 64% of the trunk line fleet was operating. Reforms that impacted service quality and demand, such as the reorganization of existing bus routes and removing direct competitors from the corridor were also significantly delayed. Moreover, the tariff policy was restructured several times to attract more demand from the feeder areas.
Despite the initial implementation challenges, the system has improved over time, expanding the fleet of buses and the number of feeder lines and seeing substantial corresponding increases in passenger demand. Ridership grew from just under 200,000 passengers per day in the first year to over 600,000 per day in 2016 [39]. By 2013 it also achieved its design goal of 60% of ridership of lower and middle socioeconomic strata; however, the share of ridership by poor and very poor (43%) people is lower than that from the middle class (57%). Although usage by the extreme poor is lower than the poor and middle class, a recent study of the system found that BRT is much more likely (12.4 percentage points more) to be used among lower income groups when making a trip for work or education purposes, indicating that users are willing to pay more for income (or future income) generating trips.

3. Data

We estimate the impacts of BRT systems on access to work utilizing available data on economic activities, socio-economic status, and other demographic variables at the household level or at the smallest geographic level available before and after the BRT system. We utilize data from the 2004 and 2012 Lima Metropolitan travel surveys [49,50], which includes geo-referencing coordinates on the location of surveyed households which allows the estimation of the distance of households to the nearest BRT station, and the 2008 Economic Census from the National Institute of Statistics and Information (INEI, in its Spanish Acronym), which contains information on 1.43 million jobs in Lima, distributed in over 358,000 (formal) firms. According to the INEI, the Economic Census only accounts for formally constituted firms. Databases of informal employment were not available at a representative scale for the city level.
The travel survey data include detailed household surveys on household characteristics, travel patterns, including stated travel times and monetary costs, employment status in 2004, before the BRT for the Lima–Callao Metropolitan area, and after the BRT began operating (July of 2010). Data from the economic census enable a general analysis of the spatial distribution of the formal job market in Lima, which will be used as a proxy for the distribution of the overall employment supply. Although data on informal job locations are not available, it may serve as a proxy for informal activities, as the literature suggests a high correlation between locations of informal activities and large clusters of formal opportunities [51]. As job location information is available only for the year 2008, an analysis of the evolution of the job market throughout Lima is not possible. Finally, we map the locations of opportunities and services in the city relative to housing locations using geocoded data from Lima’s Plan Metropolitano para Lima y el Callao-PLAM-2035.

4. Methodology

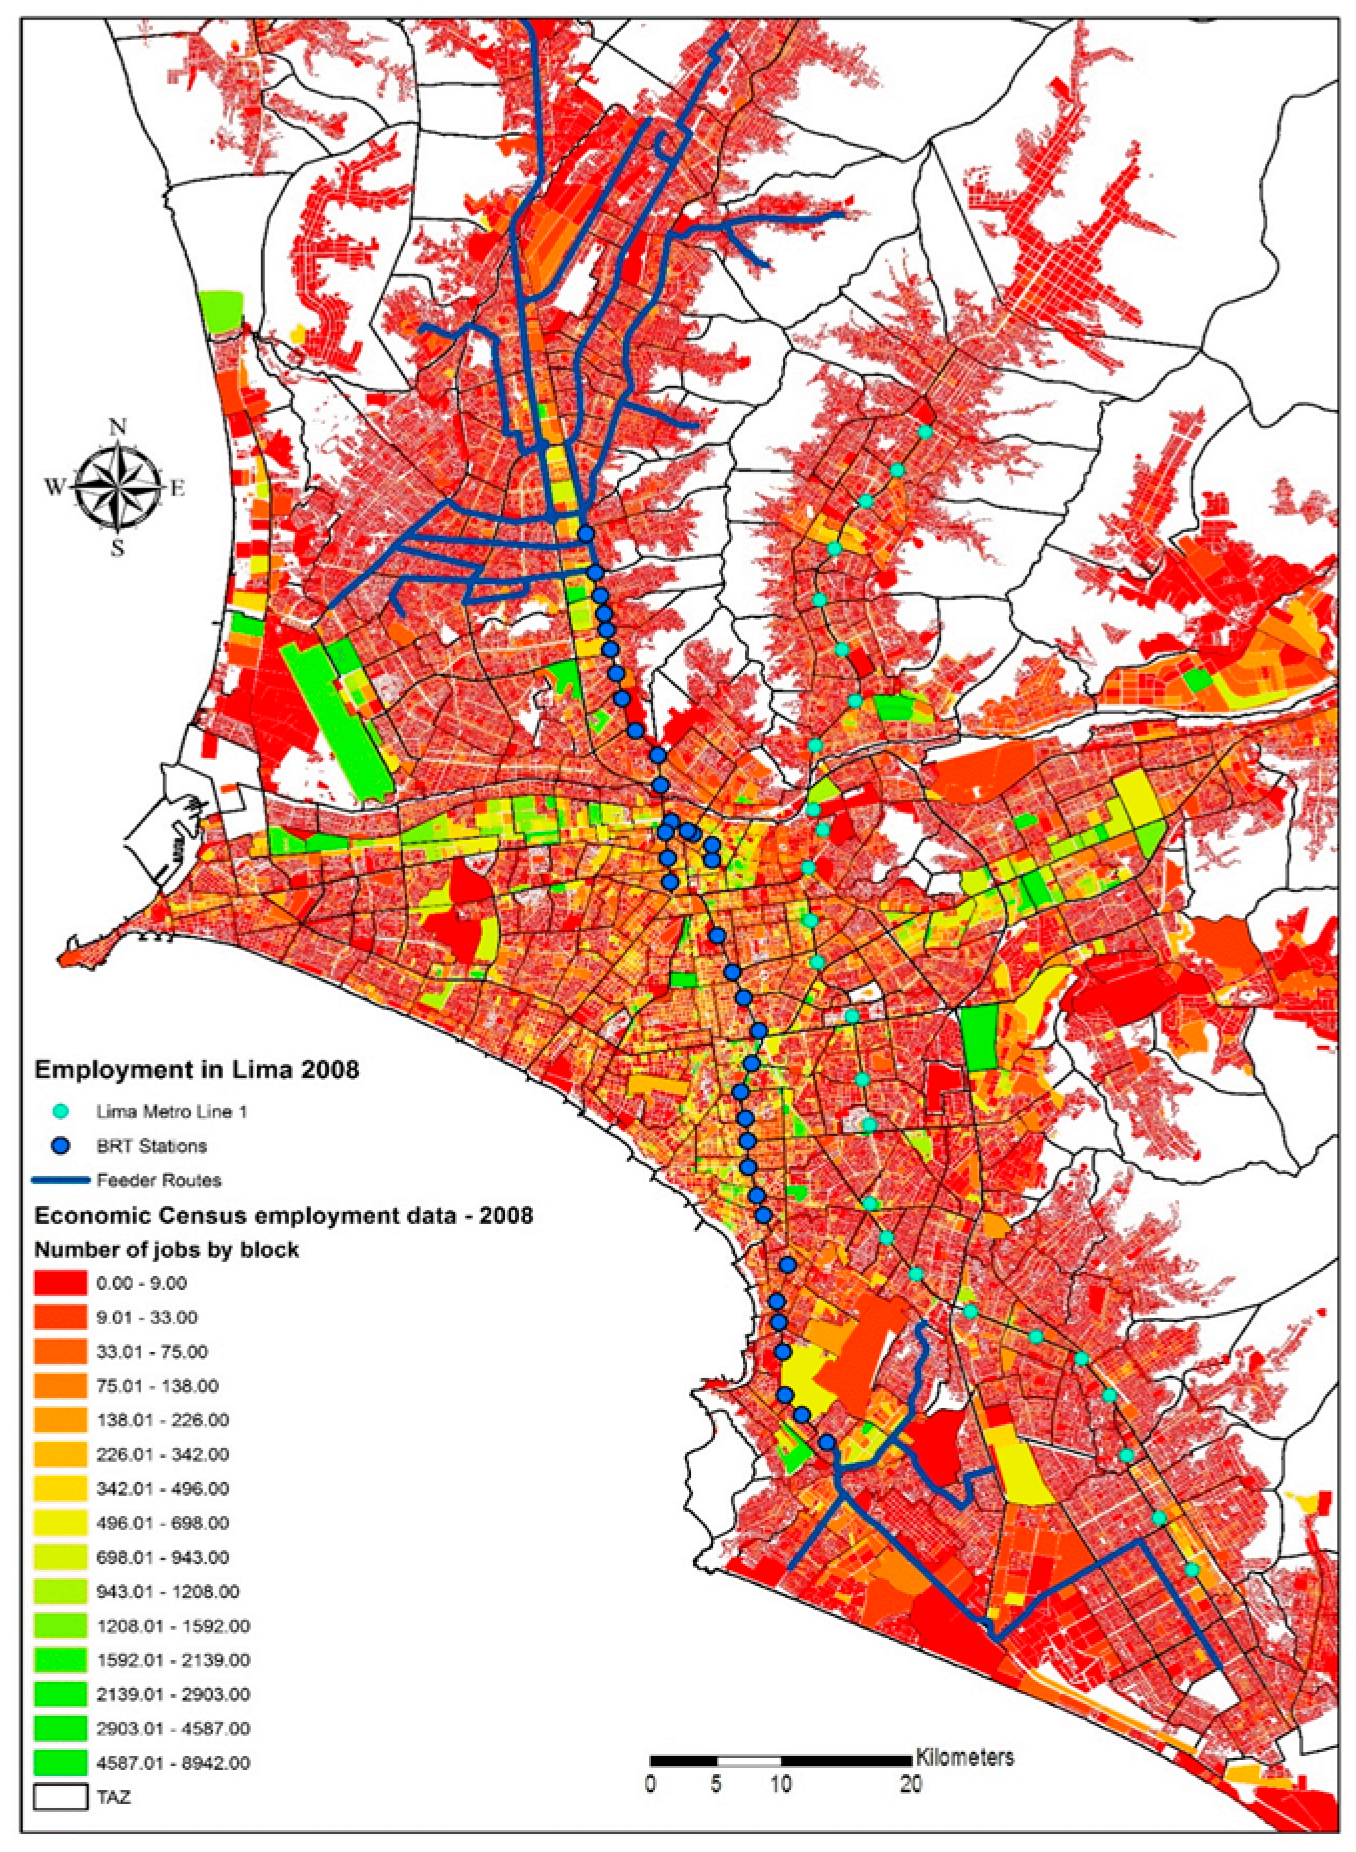
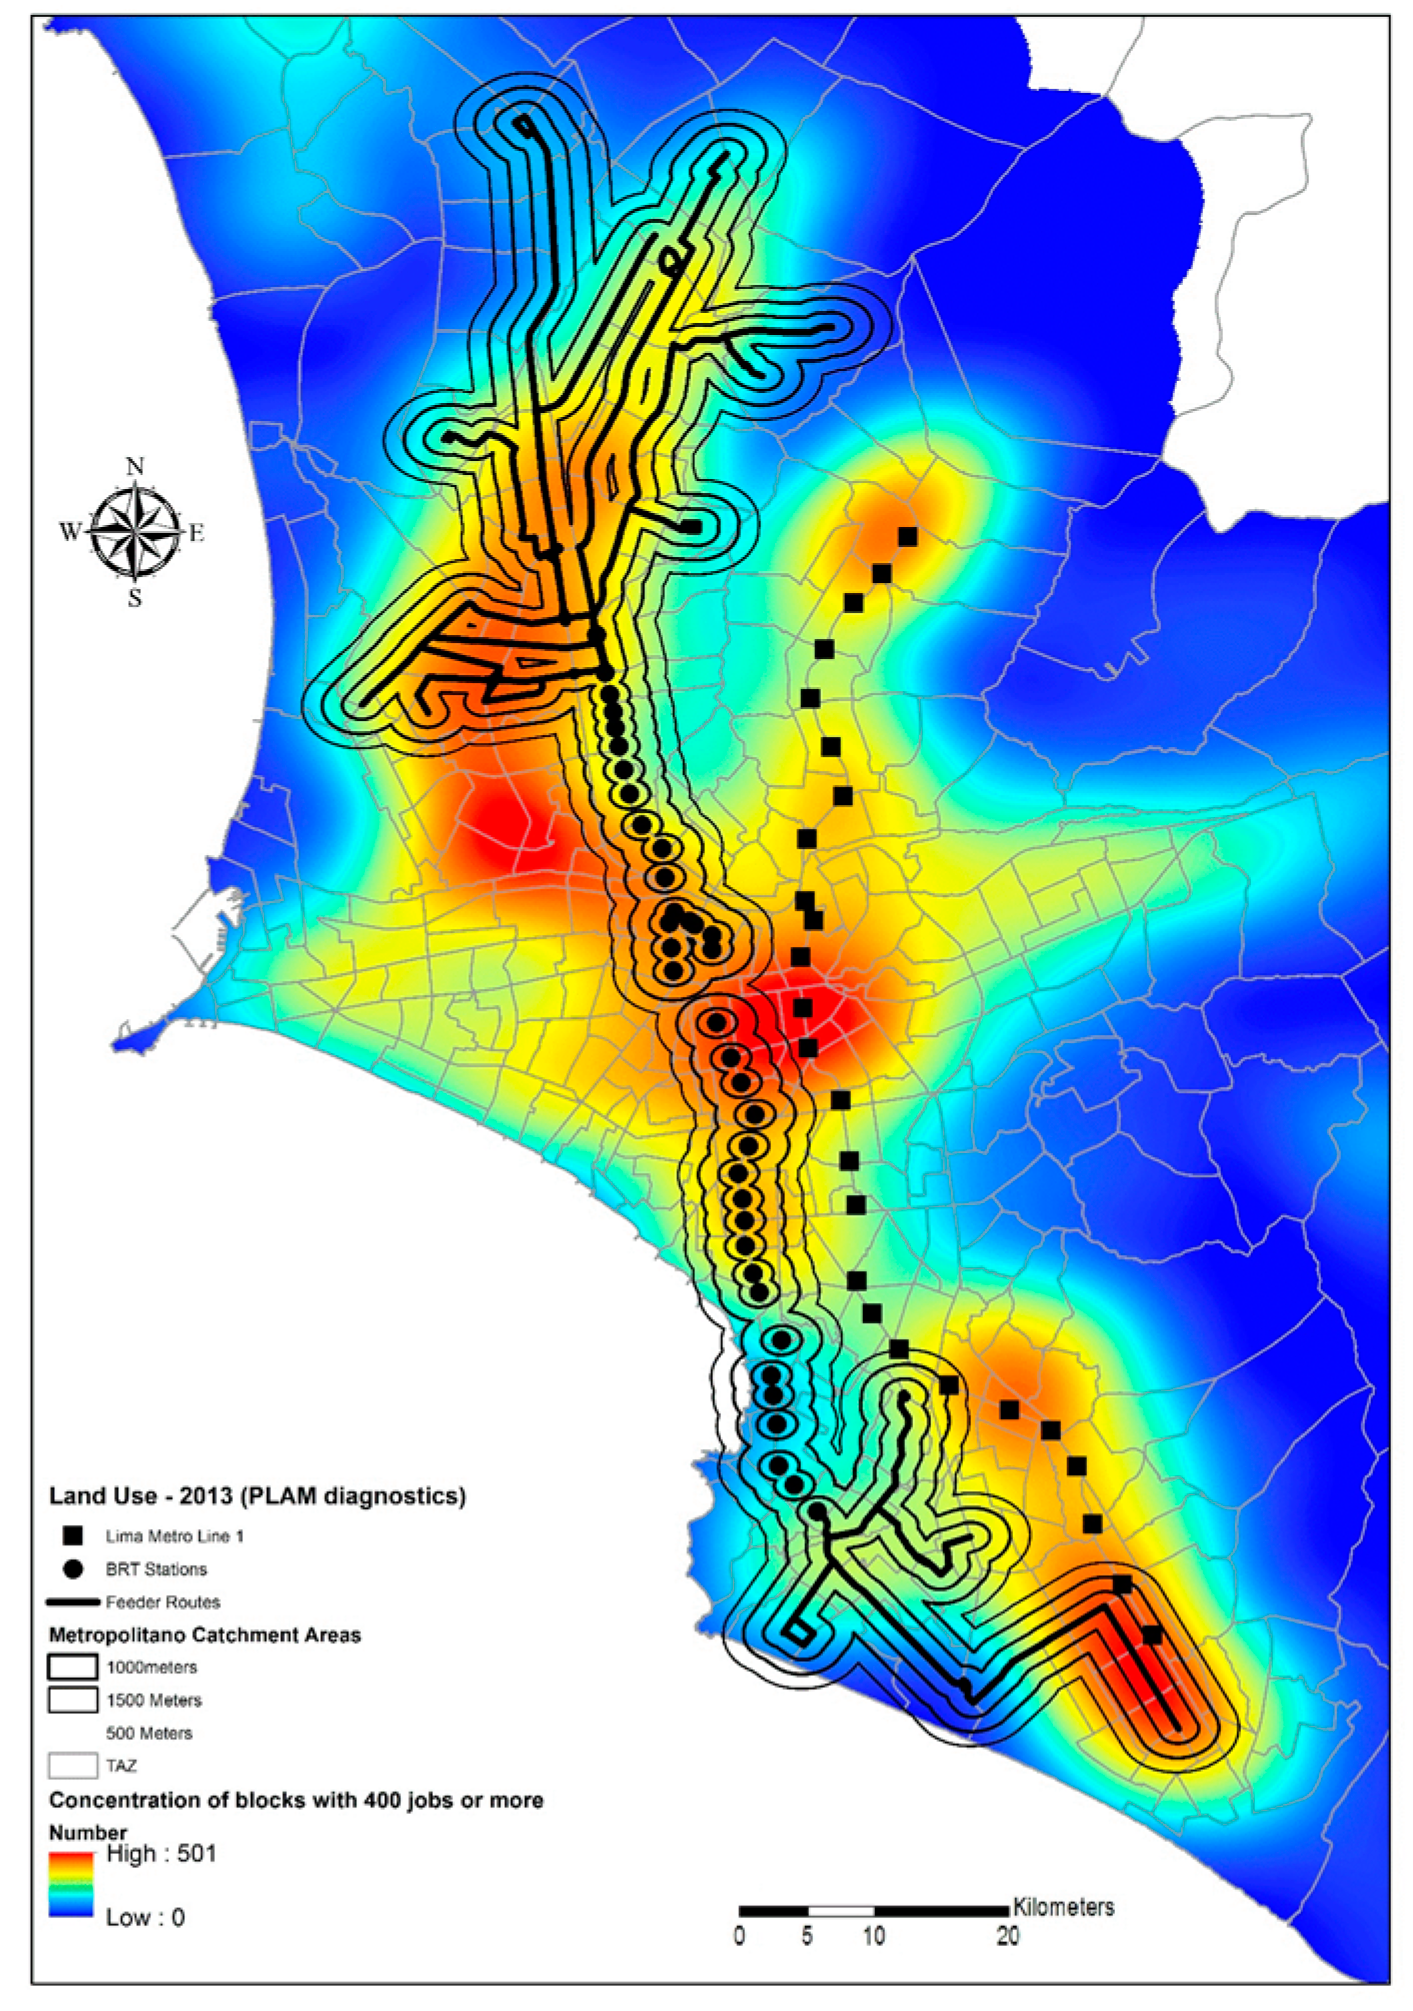
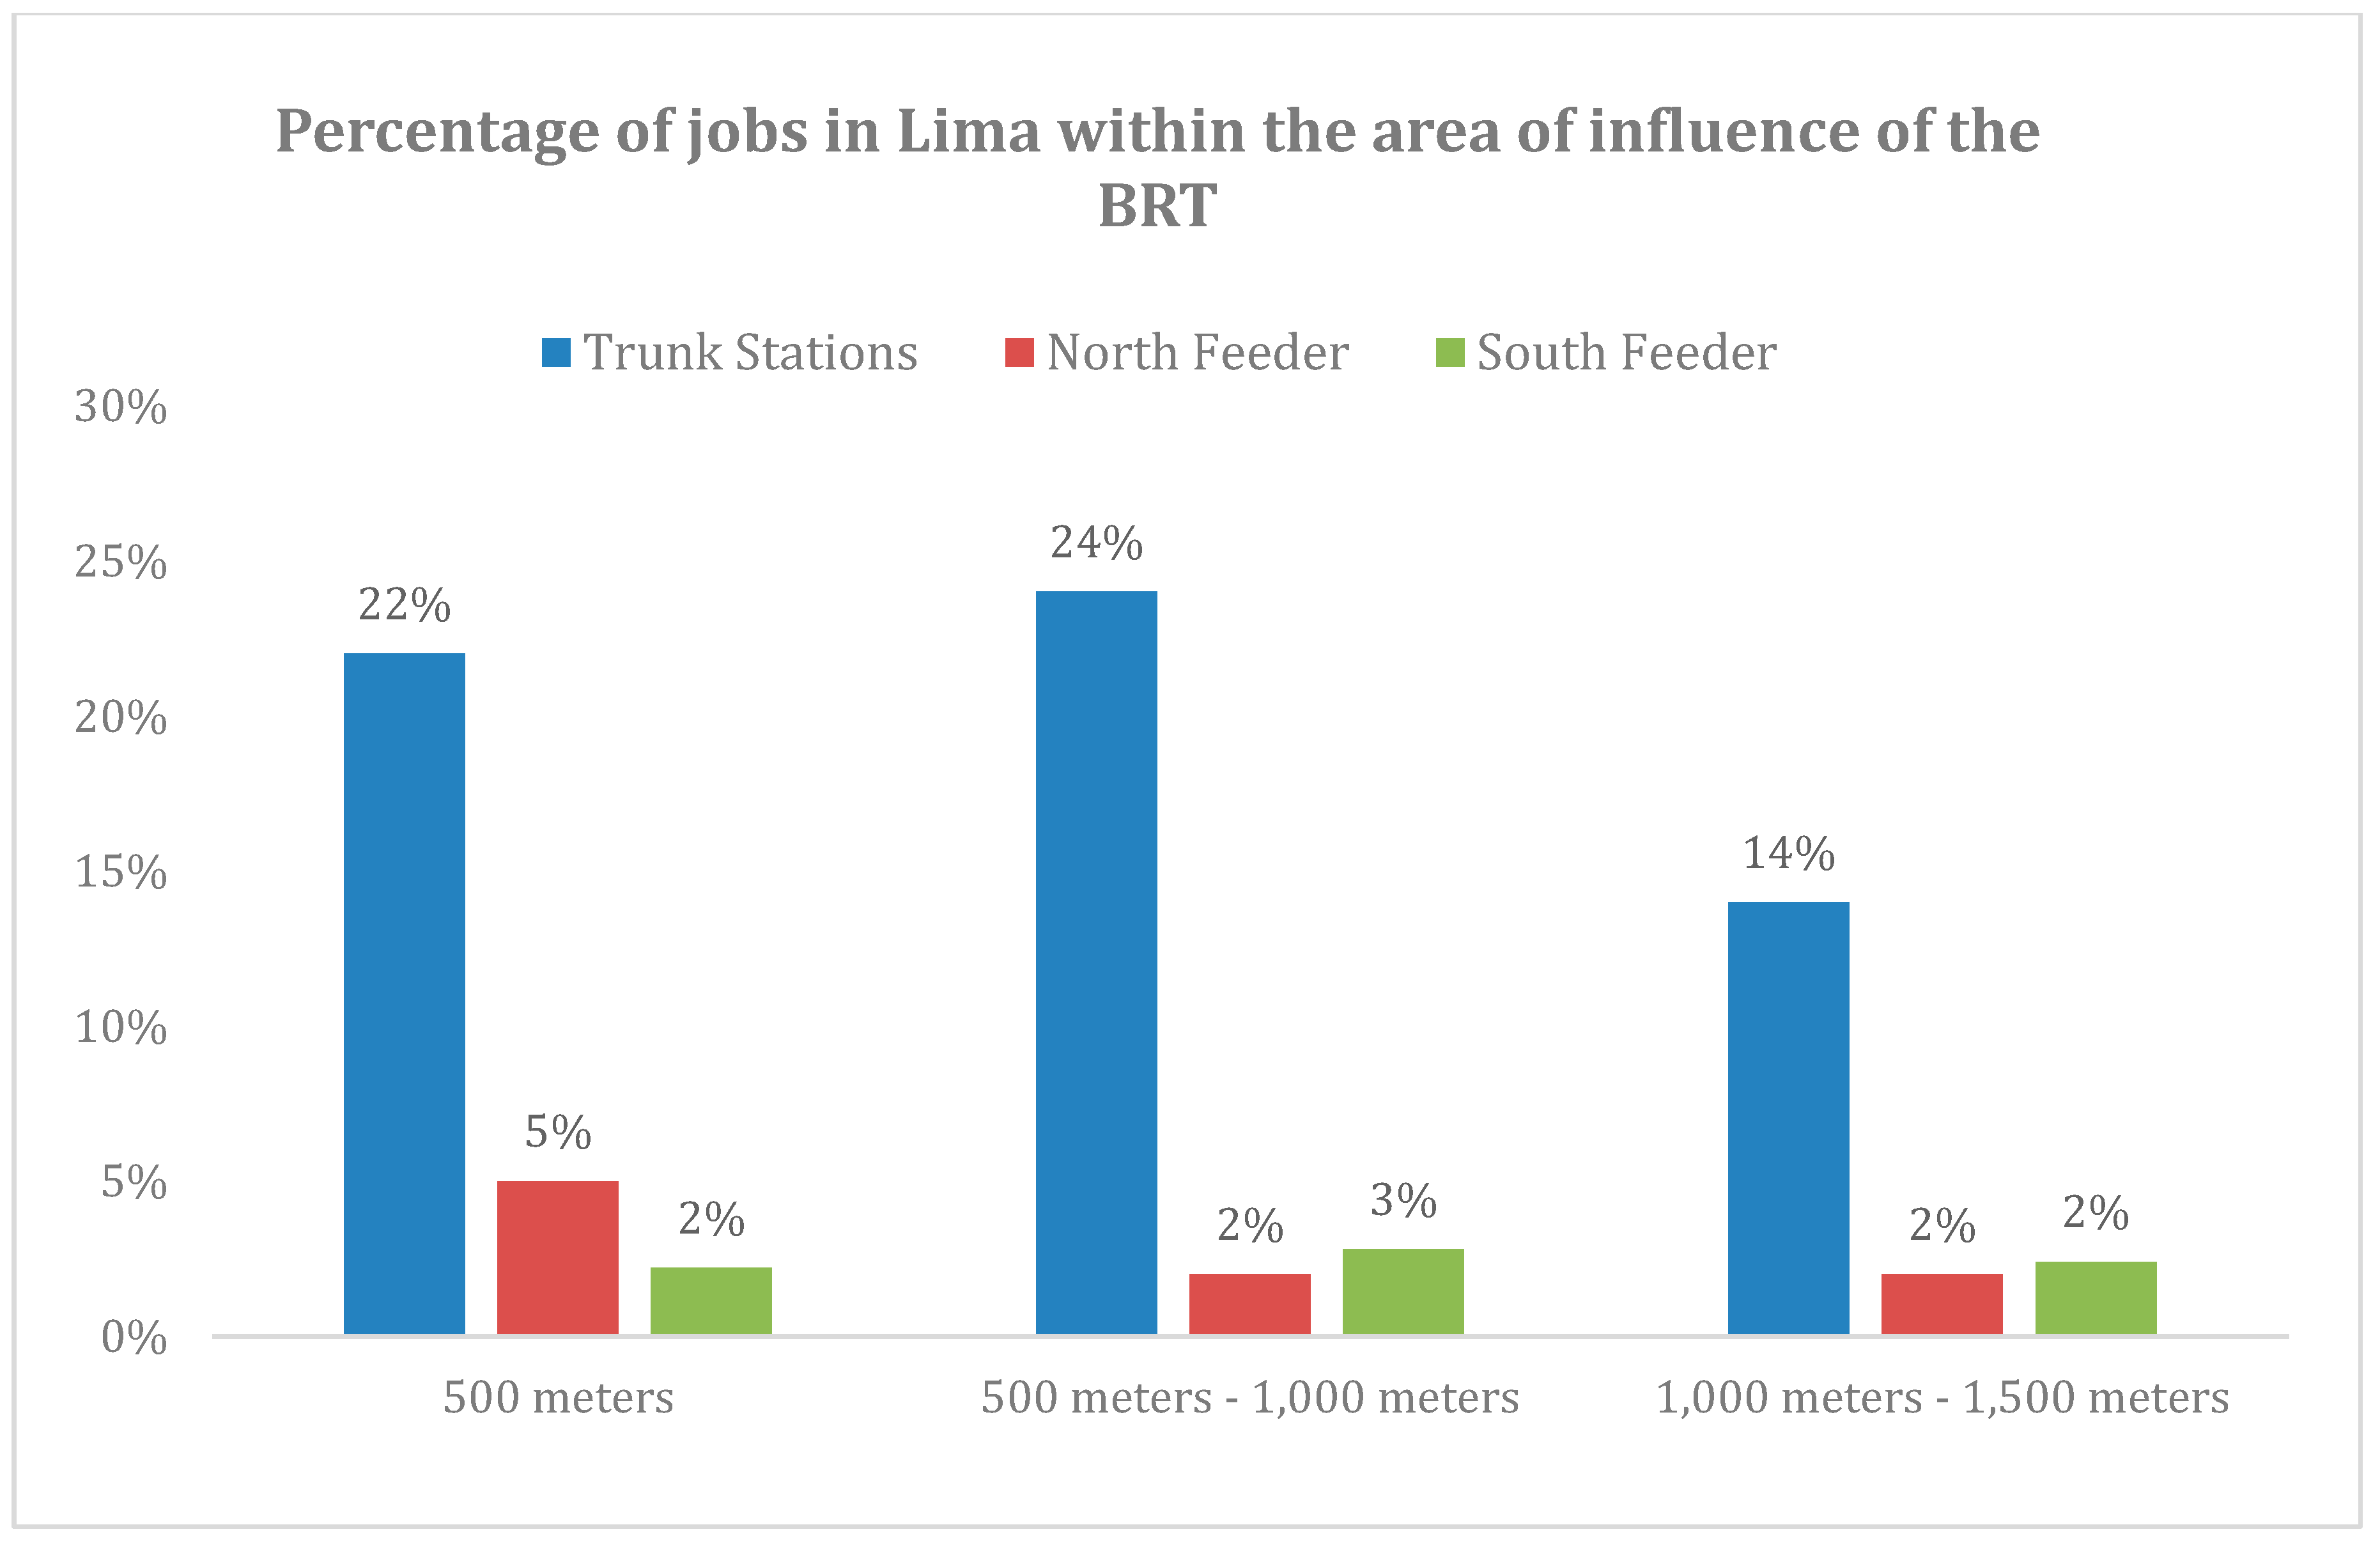
We used a three-step method to measure accessibility changes associated with the BRT investment in Lima that included the characterization of individuals and opportunities, and an estimation of potential accessibility. First, to examine how the configuration of land-use and transportation infrastructure in Lima impact accessibility, we conducted a spatial analysis of the coverage of employment as a percentage of the total land-use areas in the city within four catchment areas of the BRT. Utilizing the 2008 economic census, we produced a heatmap showing the geographic clustering of job concentrations in Lima (400 jobs or more). Four buffers were defined for this analysis to have a better understanding of land-use changes with increasing distances from the mass transit lines. The defined distances are 500 m (equivalent to approximately 5–10 min walking), 1000 m, and 1500 m (equivalent to 15–20 min walking).
Next, the impacts of the BRT on accessibility to employment for socially and transport-disadvantaged groups compared to non-disadvantaged groups were estimated. Specifically, two approaches for the estimation of location-based accessibility to employment were considered: distance decay function and potential (gravity) accessibility. As the research was concerned with the evolution of accessibility to employment attributable to the Metropolitano, indicators were estimated and compared between two years (2004 and 2012) and between control and treatment groups.
Our accessibility measure was based upon an origin-based distance decay function, following the approach suggested by Bocarejo and Oviedo [22]. This method considers the distance to jobs, weighted by the attributes of a location—in this case measured in terms of their supply of opportunities—and estimates the potential accessibility to opportunities from a zone (i) to all other areas (j), considering that fewer or farther opportunities are less attractive or more difficult to reach. We compared the measure in areas with and without access to the Metropolitano and control for changes in travel patterns, economic growth, and spatial re-configuration of opportunities by maintaining employment constant in the baseline year and assessing only those trips for which there was information before and after implementation of the system.
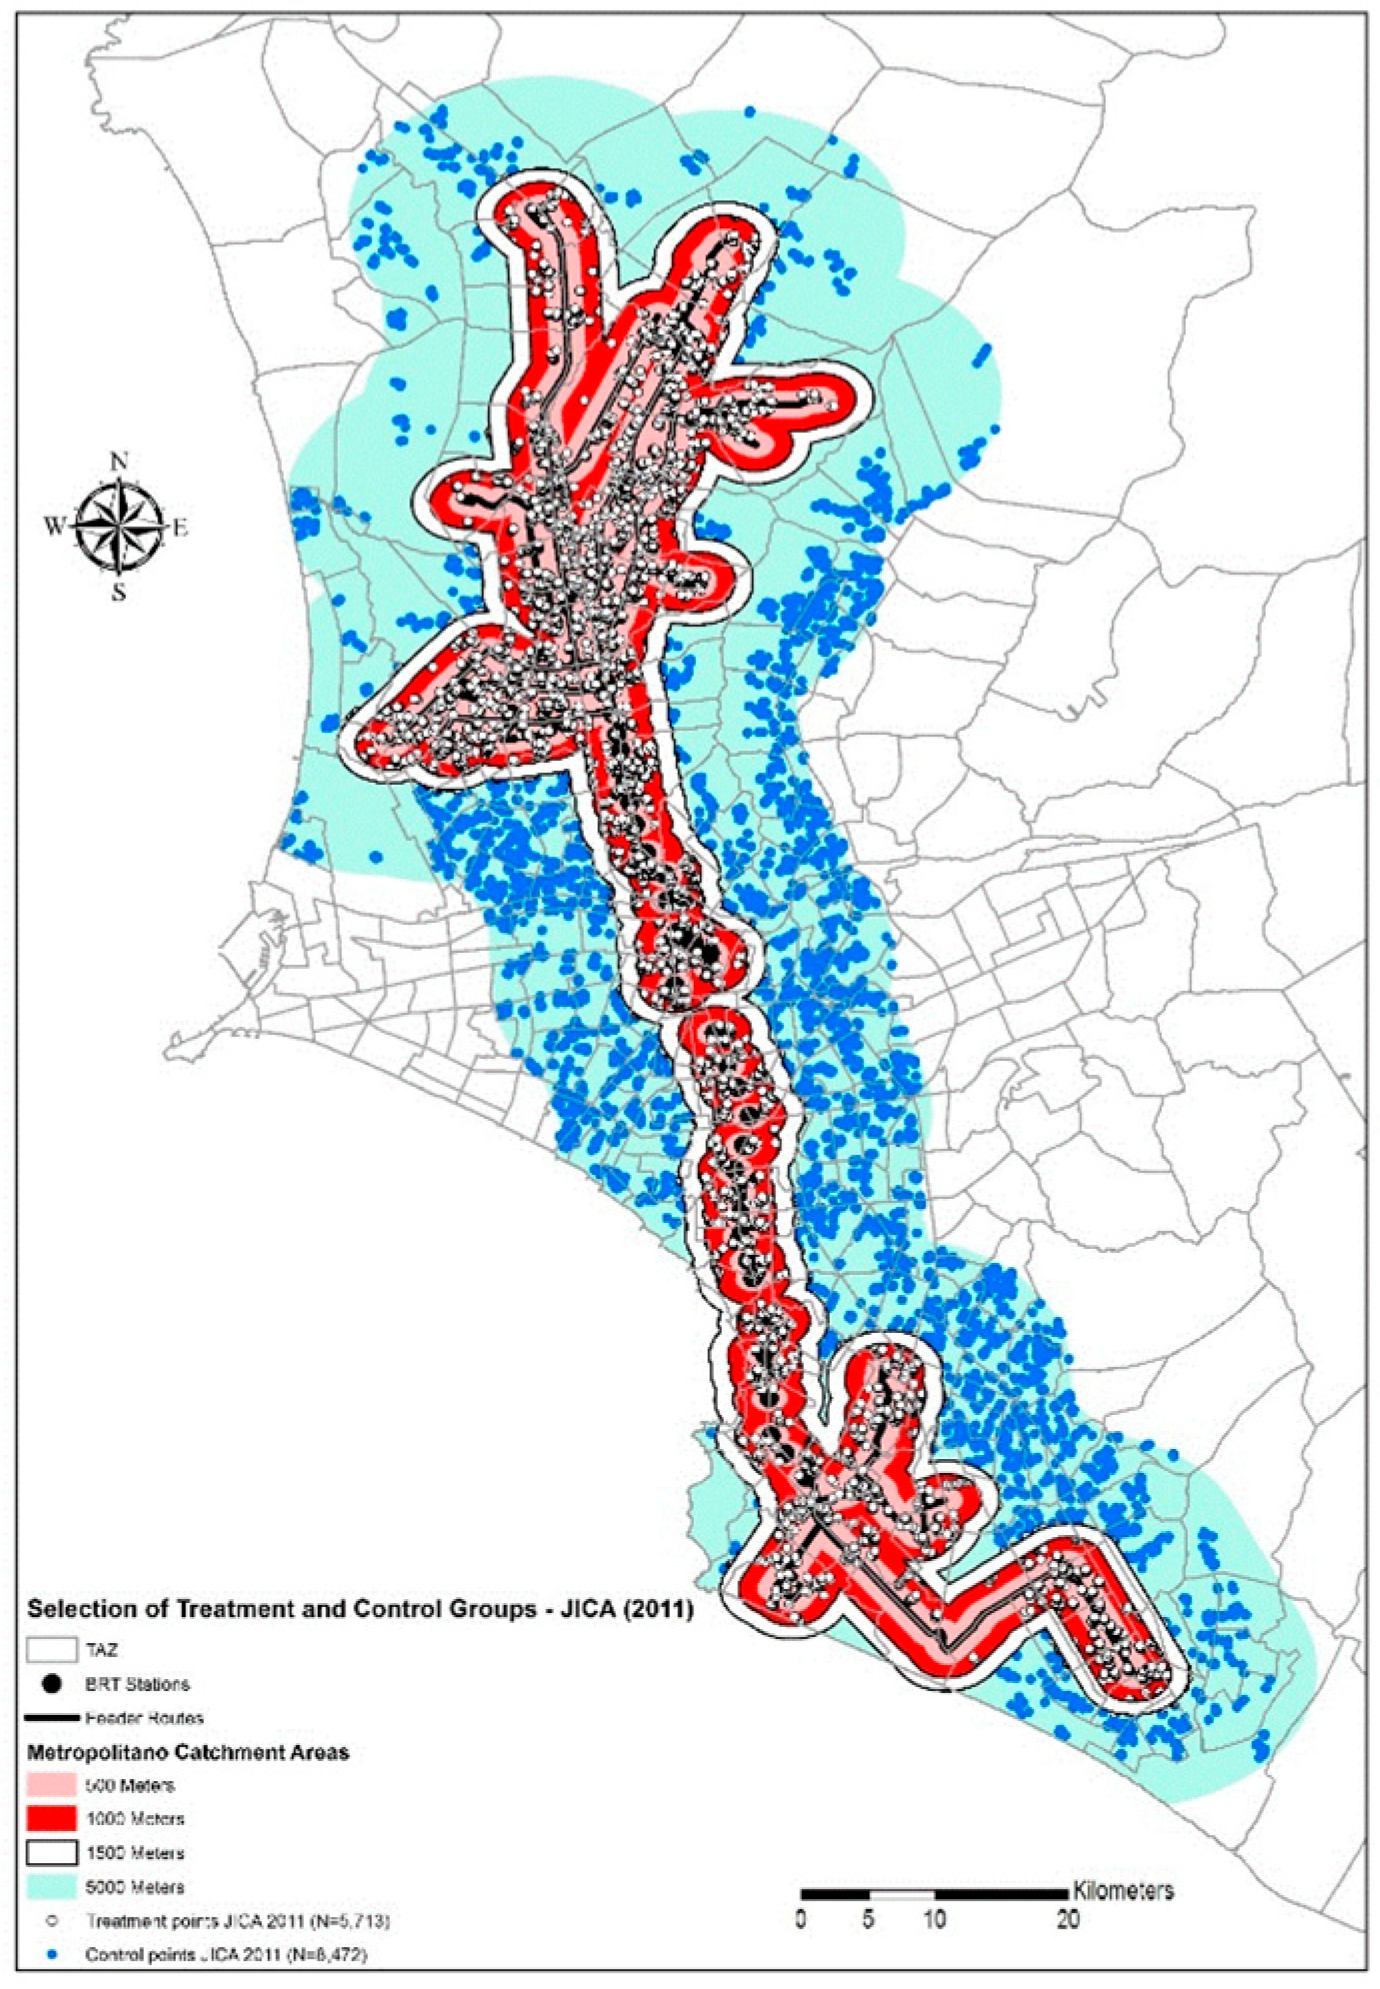
Treatment areas are defined as areas within 1000 m and 1500 m, approximately 15–20 min walking distance, of the BRT system. Our analysis of the 2012 travel survey data walk access times showed that 99% of passengers walk no more than 20 min and 90% walk 12 min or less to reach the BRT system. The coverage areas for determining groups of treatment and control were not only consistent with observed walking patterns for accessing public transport but were consistent with spatial disaggregation of the household travel survey for Lima, which allows to geolocate each data point selected for the analysis. This controls for the consistency between the buffers and size of aggregated zoning in traditional household travel surveys. The accessibility indicator for public transit trips for a given area, where accessibility increases in direct proportion to the number of opportunities and decays exponentially with generalized travel costs to reach those opportunities, is as follows [22]:
A i m =   j O j e ( β i m · C i j m )
where A i m is the total potential accessibility from travel analysis zone i using a given public transport mode, m, to all other zones j; Oj represents the number of employment opportunities in each destination zone j, and Cijm is the generalized travel cost between zones i and j for mode m, and βim is a calibration parameter by origin zone and transport mode m. The term generalized travel costs, Cijm, expressed in minutes, can be decomposed as follows:
C i j m = t i j m + c i j m V O T
where tijm is the reported travel time in minutes and cijm is reported monetary cost between i and j by transport mode m in Peruvian New Soles (PNS); VOT is the estimated average value of time for commuting trips in PNS per minute by socio-economic stratum [49]. Monetary cost, c i j m , is divided by the value of time. The accessibility impedance for mode m between each origin destination pair can be expressed as the ratio of the total number of work trips between zones i and j by mode m to the total jobs in zone j as a function of generalized travel costs:
A i j m / O j =   e ( β i m · C i j m )
We estimated the βim parameters for the accessibility measure, Equation (1), for each year (before and after the BRT was implemented) in the treatment and control areas by regressing the log of accessibility impedance as expressed by the left-hand side of Equation (3), for work trips using public transit [30] on generalized travel costs:
L o g ( A i j m / O j ) =   β o β i m   · ( t i j m + c i j m V O T ) + e i j
Employment opportunities (Oj) in each traffic analysis zone were held constant (in 2008) to control for potential changes in the job market in Lima and the accessibility index was divided by population of the origin zone to compare the relative difference in accessibility between different zones of the city or specific social groups. This normalization improves the comparability of accessibility figures, as even relatively large absolute numbers of potentially accessible opportunities in relation to the rest of the city may be lower than the actual demand in a given zone for activities such as working and studying and can be an indicator of accessibility deficits.
Only data on trips for which there was information before and after implementation of the system were used. Differences in estimates were compared among lower and higher socio-economic groups before and after the system’s implementation. Treatment areas included all data points for the Japan International Cooperation Agency (JICA) databases located between 0 and 1000 m from the Metropolitano trunk stations or feeder lines. We assigned to the control areas all data points in the travel survey (JICA) databases that fell between 1500 and 5000 m from the BRT (
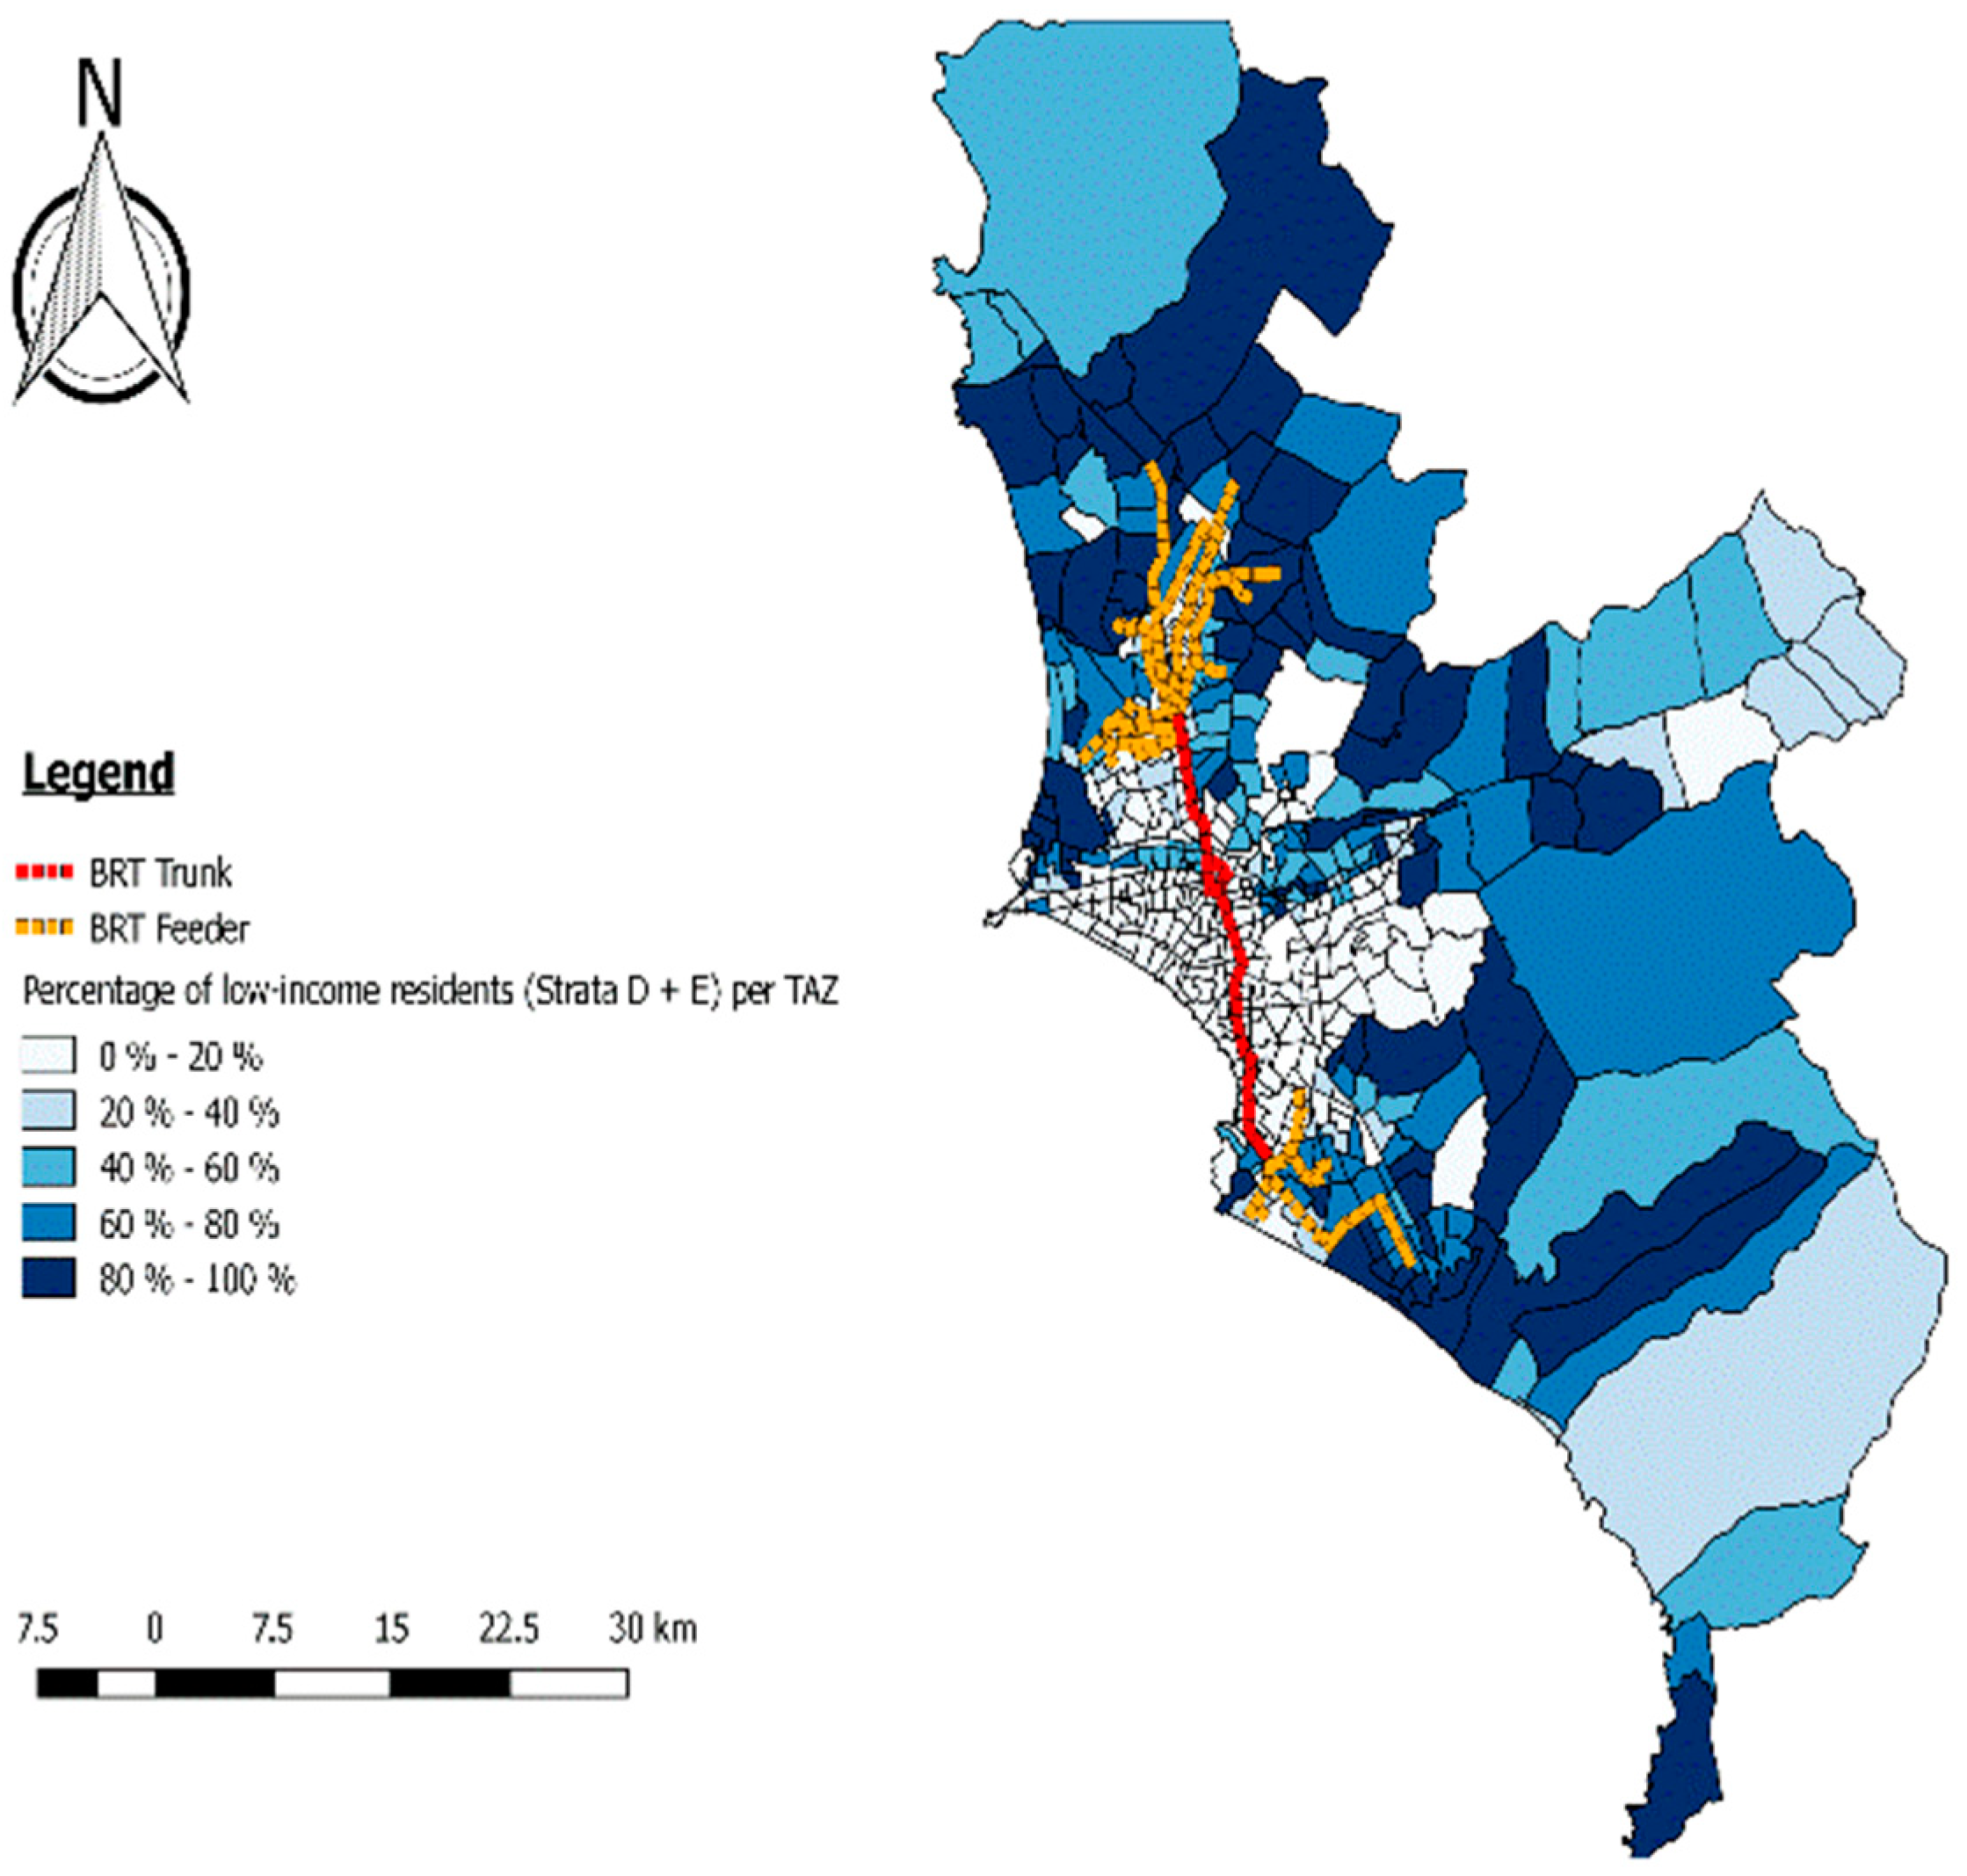
Figure 2). Low-SES areas in the data source were identified by cross-referencing the geo-referenced data of the travel survey with the shapefile of socioeconomic strata by census block from INEI. Low-SES were those households that fell within a census block with a stratum of D or E.
The estimates of the impedance parameters were applied to the travel costs in the same origin–destination pairs for work trips by public transit in the JICA databases for 2004 and 2012 for treatment and control groups. The impedance parameters for treatment and control groups differed by 4%, showing a marginally higher negative effect of changes in the generalized cost of travel in the control group. This is coherent with previous studies that suggest better-off areas tend to have a lower marginal response to changes in travel costs, either due to higher purchasing power or to closer proximity to job centers [30,31,54,55,56,57,58,59,60,61,62,63,64].
Because of differences in the sample size for the JICA survey between the two years, the number of common origin-destination (O-D) pairs available for the accessibility estimations was reduced in comparison with the original sample used for the ordinary least squares (OLS) regression used to estimate baseline accessibility parameters. The effective sample of O-D pairs for the analysis was 6585 O-D pairs for the treatment group and 3257 O-D pairs for the control group in both samples of 2004 and 2012. Sample sizes were considerably reduced when segmenting by feeder and trunk catchment areas, rendering the samples sizes too small for a reliable regression, particularly in the control group. For treatment, the trunk and feeder samples were 4610 and 1976 O-D pairs, respectively, while for the control group samples there were 2606 and 651 O-D pairs for trunk and feeder areas, respectively.
Recall that the accessibility index is an exponential combination of travel costs and system demand, and therefore, cannot be scaled up linearly to project changes for a doubling of ridership. However, we estimated a scenario where public transport trips between origin–destination pairs were served by Metropolitano in the database, with the assumption that riders within the area of influence of the system chose the BRT over other forms of public transport.
More specifically, to isolate the effects of the Metropolitano on travel conditions, we carried out an additional analysis comparing only the O-D pairs in 2004 with those with trips involving Metropolitano in 2012. This comparison leads to an analysis of travel conditions to the same destinations, allowing us to compare access characteristics between BRT users and non-users to the same opportunities. The number of common origin-destination pairs available for the accessibility estimations in the Metropolitano-only scenario was reduced to 224 O-D pairs for the treatment group and 154 O-D pairs for the control group. Travel costs and times in Metropolitano between origins and destinations were replaced for trips covering the same pairs by other forms of public transport. For instance, travel costs of trips in the treatment and control groups closer to the feeder cones would incorporate the additional resources and time required to transfer from feeder to trunk services.

5. Results

Employment Access

Figure 1 shows that most of the low-income population in the area of influence of the BRT were only covered by its feeder lines, while a large share of poorer neighborhoods farther from the city center had no access to the system (Figure 1). In 2013, 7.6% of the population was classified as stratum E (roughly half the share in 2007 of 16.4%), 30.3% stratum D (compared with 34% in 2007), 38.4% stratum C, 18.5% stratum B, and 5.2% stratum A. Some of the highest concentrations of the population from Strata D and E are in the districts of Puente Piedra, Comas, and Carabayllo in the north; Villa El Salvador, Villa María del Triunfo, Lurín, and Pachacamác in the south; Ate and Lurigancho to the east; and Callao to the west. Also notable is a consistent increase in poorer residents in areas far from concentrations of productive land.
Figure 3 shows the distribution of employment in Lima and a heatmap of large job suppliers (400 jobs or more) throughout the city. Most of the job supply in the city is provided by small businesses distributed throughout the city (consistent with a land-use pattern dominated by mixed housing), with larger employers (400 jobs or more) located in areas with high concentrations of industrial land-use and pockets of large businesses along some of the main transportation links in the city.
Over half (54%) of jobs were concentrated in middle to high-income areas, or middle to upper socioeconomic status (strata B and C), while 19% were in areas characterized as lower income (stratum D), 25% in predominately extremely poor areas (stratum E), and 2% in wealthier areas (stratum A).
The heatmap analysis of employment distribution in the city is consistent with the analysis of land-use in the city discussed above (See Figure 4). The 1500 m catchment area around the Metropolitano network, which covers approximately 35 percent of total land surface area in Lima, encompasses many of Lima’s employment hotspots, providing connectivity to nearly 80% of formal jobs in the INEI’s economic census (2008) within 1500 m of its trunk stations and feeder routes. The trunk-line stations alone cover 60% of employment within the buffer (see Figure 5). The close links between coverage of the BRT system and the main employment clusters in Lima point towards potential positive effects in access to employment for public transit users living near the system. This may also reinforce already consolidated high-value areas in the city, contributing to centralization of economic opportunities and increase in land values around the BRT stations. This analysis of the BRT’s impact on access to jobs has two limitations. As information is available only for the year 2008, a detailed analysis of the evolution of the job market throughout Lima was not possible for this paper. In addition, data on information that would enable the analysis of the skills and training requirements for formal jobs within the system’s catchment and potential (mis-)matches with skills and training of people in strata D and E was not available.

6. Accessibility Analysis Results

Table 1 shows summary statistics of work-related trips in public transit in 2004, six years prior to the opening of the BRT line. Work trips within walking distance to the BRT (or the treatment area) were characterized by lower average travel times but higher monetary costs in comparison with both the city’s average and that of trips originating from the control areas, implying increased access (in terms of travel times) to employment in the treatment group before implementation of the Metropolitano. However, higher monetary costs may indicate an increased willingness to trade-off economic costs for shorter travel times and be related to the clustering of more formal jobs close to major transportation infrastructure.
The scatter plot of estimated accessibility index and generalized travel costs for each origin–destination pair in the baseline year (2004) reveals a curve that is consistent with distance decay functions found in previous studies on the subject (Figure 6). We next regressed the ratio of job-related trips to total jobs on the generalized travel cost for work trips by public transit in the baseline year as discussed above. The estimate of the parameter (−1.025) on general travel cost was statistically significant at the 1% level (Figure 7). This initial estimation, although not used for the accessibility analysis between groups of analysis, is a relevant first step in determining the appropriateness of the distance decay function for representing Lima’s conditions. Moreover, the model estimate had high explanatory power (R2 = 0.72).
Baseline information for Lima was also used to identify general accessibility patterns by socioeconomic stratum before the project. Strata D and E had higher generalized costs and lower accessibility indices, while mid-strata, such as C, had lower travel costs and comparatively higher accessibility indices (Figure 6). Conversely, data points with higher values of accessibility correspond primarily to more well-off socio-economic groups, strata A and B. These observed accessibility indices show a consistent tendency with past studies—that lower income groups tend to have higher travel expenditure and lower accessibility indices [22,30,57,58].
Comparisons of the estimates of accessibility curves by treatment and control groups showed a steeper curve in the control group, and thus more dramatic changes in accessibility with smaller changes in travel costs. Conceptually, Figure 6 shows that higher travel costs imply lower accessibility levels and that there were high correlations between income, travel expenditure, and location relative to centers of employment. The two groups showed a similar distribution of travel costs and observed ratios of jobs accessed to jobs offered at different destination zones, with slightly higher mean generalized travel costs in the treatment group (8% higher) and no significantly different accessibility indices (Table 2). The general trends observable in both groups were consistent with the patterns observed in the aggregated sample and the literature (see References [14,30,41]).
The impedance parameters for treatment and control groups differed by 4%, showing a marginally higher negative effect of changes in the generalized cost of travel in the control group. This is coherent with previous studies that suggest better-off areas tend to have a lower marginal response to changes in travel costs, either due to higher purchasing power or to closer proximity to job centers [30,41,56].
Table 3 and Table 4 show tests of differences in mean travel costs and time between income levels and year for the control and treatment groups for work trips. Work trips via public transit in the treatment area in the year 2004, prior to the BRT line opening, were slightly shorter but more expensive in comparison with those originating from the control area. The share of users of the Metropolitano in the sample was comparatively low compared with other public transit alternatives in the year of the survey. According to the JICA survey for 2012, the BRT accounted only for 3.6% of trips in public transport and 2.7% of all trips in the city; however, since the treatment and control groups were much closer to the area of influence of the BRT, the percentage of trips in Metropolitano was comparatively higher in the study sample. In the treatment group, out of the total number of work trips by public transit, over 9% involved the Metropolitano in at least one stage of the trip, while in the control group only 5% of work trips involved the BRT in combination with other forms of public transport.
Increases in travel costs and times were observed in both the treatment and control areas. Most of the increase was related to increases in the economic costs between 2004 and 2012. Travel times increased slightly, but insignificantly for the lower income group, and more markedly amongst the higher income group, particularly in the control area. The marginal changes in reported travel times in the JICA survey of 2012 compared to those in 2004 suggest there have not been significant changes in travel conditions by public transport (Table 3). In addition, statistically significant differences were only detectable amongst the higher income group. Increases in traffic and other network-related variables not measured in this study may have dampened gains in travel time associated with the introduction of the Metropolitano. This is likely compounded by the small percentage of the demand being served by the system in 2012, as mentioned above.
After the introduction of the Metropolitano, the largest percentage increase in monetary costs amongst those in the treatment area were incurred by higher income public transport users. Reported costs increased by 0.71 PNS, or 27% in 2012 relative to 2004 for this group (Table 4). In comparison, higher income transit users in the control group saw a rise of 8.8% in monetary expenditures. In contrast, although lower income groups paid more overall in monetary expenditures for work trips in public transit compared to the higher income groups, for the low-income treatment groups monetary costs increased (by 13.9%), but considerably less in percentage terms, than among those in the control area, who experienced a much larger percentage increase (26.2%) in travel costs. The costs presented in Table 5 are those reported by survey respondents in the JICA database for the two years of analysis.
This could be attributable to the fare structure of the Metropolitano compared to other forms of public transport in Lima. The Metropolitano has a higher fare for the trunk services than other forms of public transport, although the integrated fare when using the feeder routes in combination with the trunk is comparatively cheaper than two or more transfers in traditional public transit. In addition, the introduction of the system led to the restructuring of some public transport routes, which may have led to some lower-income users of traditional public transport to require more transfers for longer trips, hence, increasing the travel costs, particularly for those in the control areas where public transit services charge by trip distance. However, the restructuring of the competing informal operators was delayed for political reasons and took place gradually over time, and therefore, impacts on transfers may not have been significant in 2012.
As shown in Table 5, baseline accessibility indices were highly similar in the treatment and control groups. The accessibility indices decreased in both the treatment and control areas and for both SES groups over the study period. The high-SES subgroup experienced a larger and statistically significant decrease in accessibility overall compared to lower SES populations, however, it declined substantially less, by 22 percent, in the treatment area than in the control, where it declined by 29 percent. Overall, the BRT appears to have counteracted declines in accessibility among higher SES transit users living within 1 km of the system.
The combined effect of both longer and more expensive work trips in 2012 in comparison with the baseline led to a decrease in potential accessibility to jobs in both the treatment and control areas and for both SES groups. The changes in accessibility can be attributed primarily to increases in monetary travel costs; travel time in the two periods of analysis increased only slightly, while monetary travel costs increased more dramatically (Table 5). The t-tests of differences in mean accessibility indices showed that higher SES transit users in the control group experienced the highest accessibility losses (29%); in comparison, accessibility declined by 22 percent for the same SES group in the treatment group. In contrast, the lower SES groups in the control area experienced the lowest loss of accessibility (15%), while in the treatment area, accessibility declined even more significantly by 19%.
The analysis of differences-in-differences within SES sub-groups suggests a positive effect of the Metropolitano in potential accessibility in the higher SES group. Relative to the control group, accessibility increased in the 1-km boundary area of the BRT by 0.01, a 7% increase relative to the treatment baseline accessibility index. In other words, while accessibility declined, it declined seven percent less so in the area of the BRT area of influence compared to the control group. In contrast, in the lower-SES group, the double difference was −0.01, representing an 11% decrease in accessibility relative to the baseline index of 0.09 in the treatment area. Statistical power was higher for the higher income sub-groups, as they represent a larger percentage of the sample (81% in treatment and 85% in control). However, as shown in Table 5, these results were not statistically significant.
Examining the changes in travel time in the treatment versus control groups among lower SES commuters, the results appear to be driven by larger increases in travel times in the treatment area versus the control areas. Increases in travel times for the poor within the treatment area could be related to lower BRT ridership among the poor as found in a prior study [38]. Longer travel times could also be related to the restructuring of traditional bus operators in the area of influence of the system. Such restructuring of routes of the traditional transit operators could imply longer travel times for the same trips. In addition, since the tariff was not yet integrated at the time of the survey, it would be more expensive for a lower SES rider coming from the periphery to a feeder and trunk trip, relative to a trip on a traditional public transit mode, potentially discouraging low-SES riders from using the system and a continued reliance on competing modes. Moreover, as the coverage of the system has higher coverage for the transport analysis zones (TAZs) characterized as primarily middle class (stratum C) and above, it provides connectivity to employment hotspots, and has higher tariffs that can be better absorbed by populations with higher purchasing power.
Despite overall increases in travel expenditure, the results imply improved accessibility for higher SES TAZs in the treatment zones than for those of poorer strata in the same group, calling into question the contribution of the Metropolitano to the mobility and inclusion of the poor at the time of the survey. Although these results should be interpreted with caution as at the time of the survey the system had not yet reached its projected ridership levels, had fewer feeders and trunk line buses in operation than planned, and had a tariff structure that made the feeder system considerably more expensive than it is today.
The results suggest changes in travel conditions for the groups in the area of influence of the Metropolitano did not have a positive effect on accessibility compared to the baseline year for lower income groups, at least in the year 2012. These results are influenced not only by the changes in travel attributes, but the elasticities of different SES groups to changes in both time and cost. The estimation of the generalized travel costs reflects that time has a different negative effect over accessibility for different socio demographic groups, with higher-income users being those that experience higher reductions in accessibility due to higher travel times, which is consistent with previous research (see References [27,31,42]). Both the aggregated and disaggregated accessibility estimations reflect variations in socioeconomic characteristics and the relative weight of travel time in the impedance function. In general, households living in areas closer to the trunk line of the Metropolitano near the city center tend to be within the higher socioeconomic stratum. Higher SES travelers tend to have less tolerance for longer travel times and higher willingness to pay economically to reduce travel duration, compared to lower-SES groups, and therefore, are usually more likely to benefit more directly from investments in mass transit systems, where speed and efficiency are relevant design features. However, in the case of the Lima BRT, although trips within the system saved time, these benefits seem to be outweighed by the increase in costs and travel times associated with the rise in congestion and waiting times for other modes.
These findings can also be partly explained by a limited share of the transport demand under study served by the BRT system. As ridership was less than half of what was projected and half the ridership in 2016 (over 600,000 per day), in the initial stages of the system’s operation, the Metropolitano seems to have played a palliative rather than transformative role in reducing the travel costs to work of transit users within its area of influence by the year (2012) of the travel survey used for this study. However, it is important to note that 2012 may be too early to detect the full impacts. The Metropolitano had 404,202 validations a day in mid-2012, two-thirds of the expected ridership that was projected and that was observed in 2016.
Figure 8 shows the ratio of total accessibility in 2012 as a function of changes in the percentage of trips to work served by the Metropolitano and the total accessibility in a scenario where 100% of the trips are served by other forms of public transit. As shown below, the combined accessibility gains when 10% of the demand in the treatment area use BRT and 90% use other public transit are marginally higher than the total accessibility in a scenario where collective transit serves all the travel demand of destinations covered by the Metropolitano. In the control area, this is only achieved after replacing travel attributes of 30% the demand of other public transport with the features of the BRT. With a 60% substitution in demand, the accessibility in the treatment group would be 10% higher than the accessibility in the baseline scenario. The additional distance to the system and more limited coverage in the control area may explain these trends as higher costs of accessing the BRT produce losses in accessibility compared with other transit alternatives. Nevertheless, considering the increase in travel costs between 2005 and 2012, and the results observed in Figure 8, even marginal gains in accessibility in this scenario have a positive effect in comparison to the control group (assuming all transit users in this group used other public transit options).
Despite that, accessibility in the control groups was 86% of the accessibility in 2004 under a scenario of 100% substitution, this would still be nearly 7% higher than the accessibility if users continued traveling only by other forms of public transit. This is a relevant finding in terms of policy and planning of the system, as it supports the need to increase ridership, the supply of high-quality formal public transit such as the BRT system, and to provide incentives for substitution of trips in traditional forms of transit for trips in the BRT, particularly for those trips directed to destinations in the area of influence of the system. However, the limitations of these benefits are circumscribed to specific areas of the city, and as shown in the employment and land-use analysis, specific types of opportunities.

7. Discussion and Conclusions

Our analysis explores the underlying components of accessibility to employment related to the development of Lima’s Metropolitano system from a social inclusion perspective. In relation to land-use and coverage of opportunities, results suggest that the Metropolitano achieved positive results in relation to physical coverage and improvements in travel conditions within its area of influence with differential effects by socioeconomic group. One of the main considerations in transport policy from a social perspective is the issue of affordability, which the results suggest worsened over time for both SES groups throughout the city. In terms of the BRT area of influence, larger increases in monetary costs were observed for higher SES areas in the treatment group (relative to the control group), while lower SES areas, starting from an already high expenditure base, experienced relatively less increases in the BRT area of influence compared to the control group. The fare structure in 2012, which while integrated within the BRT system itself, was more expensive the other public transit modes and not integrated with these modes. This is likely to have had an increase on total travel costs for public transit users, limiting the ability of the poor to afford travel and possibly exasperating social exclusion. Results from Lima are consistent with literature suggesting regressive effects of BRT systems for the poor by means of social fragmentation and lower affordability [30,39,42].
The layout of the Metropolitano network was planned to serve one of the highest demand corridors of the city, and as such, it naturally coincides with the areas of high concentration of formal opportunities and economically productive land-uses in the city. Thus, the system increases the connectivity of already high-value areas in the city, leading to a self-reinforcing cycle of concentration of opportunities in high-value areas. This trend has been observed with similar experiences in other cities implementing BRT systems, such as in the cases of Bogotá, Mexico City, Johannesburg, and Quito, often with negative consequences for social equity [7,8,9,12,13,15,30]. Traditional transport planning principles underpinning the development of BRT may contribute to the consolidation of already monocentric urban structures and the increase in carrying capacity of public transport in high-demand corridors, that together strengthen patterns of unidirectional travel from the peripheries to the city center and concentrate land values and development in the same areas of the city.
Despite having only one trunk line, the BRT system in Lima provides an extended coverage of the city from north to south and is aligned with a significant share of formal job opportunities in the city. In addition, the system has one of the longest feeder networks in the region, increasing considerably the coverage of the system in areas otherwise served only by paratransit modes that have variable distance-based fares and no physical or fare integration. The comparison between potential accessibility analysis for both the total demand for work trips by public transit and the Metropolitano-only scenario shows the contribution to improved travel conditions the system can provide throughout its area of influence. Moreover, lower SES users, who tend to make longer trips from the periphery, may benefit from the reductions in travel times (of over 23%) in the BRT.
However, the number of low-SES users that can benefit from making those trips seems to represent only a limited share of the demand as the limited coverage of the Metropolitano in zones with high concentrations of poor and extremely poor populations restrict most of its connectivity benefits to middle- and higher-SES residents closer to the BRT infrastructure. The reduced coverage in comparison to other areas in the city in the lowest socio-economic areas is a significant constraint for achieving wider social inclusion. In addition, the marked division between the degree of accessibility provided by the BRT and traditional public transport in the city suggests a disadvantage in travel conditions for users of traditional transit. Such disadvantage is reflected by the aggregated accessibility analysis within constraints of limited ridership at the time of collection of the data.
Given the low ridership reflected by the 2012 OD survey, the Metropolitano seems, up until this point, to have stemmed the tide of an otherwise generalized increase in travel costs for work trips by public transport. This suggests the need for increased integration between mass transit and other forms of public transport to extend benefits in travel time reductions to other destinations in the city. Examples of integrated fare collection and complementary operational designs incorporating mass and collective transport systems in the region such as Bogotá, Santiago, and Cali have shown that increasing coverage can be compatible with a reduction in transfer costs and commuting fares. In the case of Lima, consideration should also be given to differentiated fares for lower-income residents in the city that enable better access at more affordable prices [7,8,9,11,13,32]. Recent examples in the literature suggest that alleviating travel costs for longer trips for the poor can enable better physical access a higher disposable income for low-SES users [8,31,32].
Our analysis reflects the impacts on the potential access to formal job opportunities without considering skills matching due to limitations in the availability of information about employment for the analysis. This, in combination with the year of ex-post data, early in the system’s implementation, for this analysis, are important limitations of the study that restrict scaling up and the proposal of specific cross-sectorial policies for improving access to employment. These available data reflect an urban spatial and social segregation that produces economic exclusion for those worse-off. In addition, considering the land-use patterns and concentration of formal employment around the Metropolitano, as well as the high number of productive housing, actual job accessibility benefits may be limited to those in higher SES brackets. However, due to the limited data on jobs, the effect of the BRT on firm creation and location of employment centers could not be analyzed within the scope of this paper.
Future research should consider how the BRT systems may affect firms, and thus job locations and the potential role for complementary land-use strategies that support accessibility of opportunities with various skills requirements in lower-SES areas, particularly those not yet covered by the mass transit system. To achieve this, new datasets need to be explored that enable the incorporation of skills matching in accessibility metrics and the estimation of travel demand from different socioeconomic groups, to contrast the main areas where low-SES users need to travel to access jobs with the levels of access the BRT provides to those areas.
The integration of transit infrastructure with the formal-informal continuum, observable in housing, transport supply, and employment in Lima, is needed to enable asset accumulation and access to income-generating opportunities. Essential actions to increase of potential benefits of the BRT for the poor include linking new social housing developments with existing or planned BRT and rail infrastructure, the increasing in the coverage of the network via the integration with no-motorized travel, and incorporating accessibility to informal and unskilled job opportunities into the priorities for of transit investments. In this vein, the creation of dedicated and quality spaces around the stations for informal commerce, relocation of informal activities, and incentives for small firms’ development in proximity to the BRT, in line with the concept of TOD, are relatively low-cost actions that can increase the social and economic benefits of the infrastructure investments already in place.
The case of Lima holds valuable lessons for cities facing similar challenges. Scaling up the potential accessibility benefits of the Metropolitano and other corridor-centered urban transport projects in cities in the global south requires not only transport-related interventions, but also integrated policies in the land-use and employment sectors that support access by low-SES populations to the opportunities in the areas that have become more accessible after the implementation of the system. One of the main considerations in transport policy from a social perspective is the issue of affordability. The results of this study also call for the consideration of targeted tariff subsidies for lower income groups to the system. From a policy perspective, it is necessary to acknowledge the potential social value of public transit investments such as BRT, in the context of their integration with the structure of the city and consideration of socially differentiated needs. If access to efficient transit is approached as a social policy, it may be possible to devise new avenues for improving access to the system supported by results such as the ones in the Metropolitano-only scenario. The potential for transport and land-use integration and the complementary operation of paratransit and formal and informal forms of public transport to serve as viable strategies for increasing coverage and accessibility are key areas for future urban policy research and experimentation in searching solutions tailored for global south contexts.

Author Contributions

Research design: D.O. and L.S.; research and data analysis: D.O. and L.S.; paper write up: L.S., D.O. and L.P.; data cleaning, data formatting, maps, and literature review: D.O., M.I. and L.P.

Funding

The Inter-American Development Bank (IDB) provided funding for this project through the ESW RG-E1502. The opinions expressed in this paper are those of the authors and do not necessarily reflect the views of the IDB, IDB Invest, their Boards of Directors, or the countries they represent.

Acknowledgments

The authors would like to thank an anonymous reviewer for useful comments on an earlier draft of the paper, and Oscar Mitnik (IDB) and Patricia Yanez (IDB) for their helpful comments and suggestions during the development of this research project and comments from the anonymous reviewers and Joao Sarolli (IDB) on earlier drafts of this paper. We also want to thank Orlando Sabogal for his support on data management and calculations for the accessibility analysis and Rafael Capristan (IDB) for his support with meetings and interviews with relevant government authorities and in procuring access to key data for this research.

Conflicts of Interest

The authors declare no conflict of interest. The funders had no role in the design of the study; in the collection, analyses, or interpretation of data; in the writing of the manuscript, or in the decision to publish the results.

References

  1. Scholl, L.; Guerrero, A.; Quintanilla, O.; Celse L’Hoste, M. Comparative Case Studies of Three IDB-Supported Urban Transport Projects; Inter-American Development Bank: Washington, DC, USA, 2015. [Google Scholar]
  2. Schipper, L.; Deakin, E.; McAndrews, C.; Scholl, L.; Frick, K.T. Considering Climate Change in Latin American and Caribbean Urban Transportation: Concepts, Applications, and Cases; University of California: Berkeley, CA, USA, 2009. [Google Scholar]
  3. Duduta, N.; Adriazola, C.; Wass, C.; Hidalgo, D.; Lindau, L. Traffic Safety on Bus Corridors: Guidelines for Integrating Pedestrian and Traffic Safety into the Planning, Design and Operation of BRT, Busways and Bus Lanes; EMBARQ, World Resources Institute: Washington, DC, USA, 2012. [Google Scholar]
  4. Wright, L.; Hook, W. Bus Rapid Transit Planning Guide; Institute of Transportation and Development: New York, NY, USA, 2007. [Google Scholar]
  5. Rodríguez, D.A.; Mojica, C.H. Capitalization of BRT network expansions effects into prices of non-expansion areas. Transp. Res. Part A Policy Pract. 2009, 43, 560–571. [Google Scholar] [CrossRef]
  6. Deng, T.; Nelson, J.D. Recent Developments in Bus Rapid Transit: A Review of the Literature. Transp. Rev. 2011, 31, 69–96. [Google Scholar] [CrossRef]
  7. Bocarejo, J.P.; Portilla, I.; Meléndez, D. Social fragmentation as a consequence of implementing a Bus Rapid Transit system in the city of Bogotá. Urban Stud. 2016, 53, 1617–1634. [Google Scholar] [CrossRef]
  8. Hidalgo, D.; Yepes, T. Are Bus Rapid Transit Systems Effective in Poverty Reduction?—Experience of Bogotá’s TransMilenio and Lessons for Other Cities. In Proceedings of the 84th TRB Annual Meeting, Washington, DC, USA, 9–13 January 2005. [Google Scholar]
  9. Linovski, O.; Baker, D.M.; Manaugh, K. Equity in practice? Evaluations of equity in planning for bus rapid transit. Transp. Res. Part A Policy Pract. 2018, 113, 75–87. [Google Scholar] [CrossRef]
  10. Kain, J.F. The spatial mismatch hypothesis: Three decades later. Housing. Policy Debate 1992, 3, 371–460. [Google Scholar] [CrossRef]
  11. Boisjoly, G.; Moreno-Monroy, A.I.; El-Geneidy, A. Informality and accessibility to jobs by public transit: Evidence from the São Paulo Metropolitan Region. J. Transp. Geography. 2017, 64, 89–96. [Google Scholar] [CrossRef]
  12. Zolnik, E.J.; Malik, A.; Irvin-Erickson, Y. Who benefits from bus rapid transit? Evidence from the Metro Bus System (MBS) in Lahore. J. Transp. Geogr. 2018, 71, 139–149. [Google Scholar] [CrossRef]
  13. Venter, C.; Jennings, G.; Hidalgo, D.; Valderrama Pineda, A.F. The equity impacts of bus rapid transit: A review of the evidence and implications for sustainable transport. Int. J. Sustain. Transp. 2018, 12, 140–152. [Google Scholar] [CrossRef]
  14. Van Wee, B.; Geurs, K. Discussing equity and social exclusion in accessibility evaluations. Eur. J. Transp. Infrastruct. Res. 2011, 11, 350–367. [Google Scholar] [CrossRef]
  15. Combs, T.S. Examining changes in travel patterns among lower wealth households after BRT investment in Bogotá, Colombia. J. Transp. Geogr. 2017, 60, 11–20. [Google Scholar] [CrossRef]
  16. CAF. Desarrollo Urbano y Movilidad en Americe Latina. Panama. 2012. Available online: https://www.caf.com/media/4203/desarrollourbano_y_movilidad_americalatina.pdf (accessed on 1 March 2019).
  17. Kaltheier, R.M. Urban Transport and Poverty in Developing Countries: Analysis and Options for Transport Policy and Planning; Deutsche Gesellschaft für Technische Zusammenarbeit GmbH (GTZ): Eschborn, Germany, 2002. [Google Scholar]
  18. Gakenheimer, R. Urban mobility in the developing world. Transp. Res. Part A Policy Pract. 1999, 33, 671–689. [Google Scholar]
  19. UNCRD-IDB. Sustainable Transport Survey FTS Latin America. 2012. Available online: http://www.uncrdlac.org/fts (accessed on 3 March 2019).
  20. Stanley, J.; Lucas, K. Social exclusion: What can public transport offer? Res. Transp. Econ. 2008, 22, 36–40. [Google Scholar] [CrossRef]
  21. UNDP. Sustainable Development Goals (SDGs) | UNDP. 2016. Available online: http://www.undp.org/content/undp/en/home/sdgoverview/post-2015-development-agenda.html. (accessed on 5 February 2019).
  22. Bocarejo, J.P.; Oviedo, D.R. Transport accessibility and social inequities: A tool for identification of mobility needs and evaluation of transport investments. J. Transp. Geogr. 2012, 24, 142–154. [Google Scholar] [CrossRef]
  23. Fan, Y. The Planners’ War against Spatial Mismatch: Lessons Learned and Ways Forward. J. Plan. Lit. 2012, 27, 153–169. [Google Scholar] [CrossRef]
  24. Manaugh, K.; El-Geneidy, A.M. What makes travel ‘local’? Defining and understanding local travel behavior. J. Transp. Land Use 2012, 5, 15–27. [Google Scholar]
  25. Hansen, W.G. How accessibility shapes land use. J. Am. Inst. Plan. 1959, 25, 73–76. [Google Scholar] [CrossRef]
  26. Dalvi, M.Q.; Martin, K.M. The measurement of accessibility: Some preliminary results. Transportation 1976, 5, 17–42. [Google Scholar] [CrossRef]
  27. Geurs, K.T.; Ritsema van Eck, J.R. Accessibility Measures: Review and Applications. Evaluation of Accessibility Impacts of Land-Use Transportation Scenarios, and Related Social and Economic Impact; National Institute for Public Health and the Environment: Ultrecht, The Netherlands, 2001. [Google Scholar]
  28. Páez, A.; Scott, D.M.; Morency, C. Measuring accessibility: Positive and normative implementations of various accessibility indicators. J. Transp. Geogr. 2012, 25, 141–153. [Google Scholar] [CrossRef]
  29. Wachs, M.; Kumagai, T.G. Physical accessibility as a social indicator. Socio-Econ. Plan. Sci. 1973, 7, 437–456. [Google Scholar] [CrossRef]
  30. Guzman, L.A.; Oviedo, D.; Rivera, C. Assessing equity in transport accessibility to work and study: The Bogotá region. J. Transp. Geogr. 2017, 58, 236–246. [Google Scholar] [CrossRef]
  31. Guzman, L.A.; Oviedo, D. Accessibility, affordability and equity: Assessing ‘pro-poor’ public transport subsidies in Bogotá. Transp. Policy 2018, 68, 37–51. [Google Scholar] [CrossRef]
  32. Falavigna, C.; Hernandez, D. Assessing inequalities on public transport affordability in two Latin American cities: Montevideo (Uruguay) and Córdoba (Argentina). Transp. Policy 2016, 45, 145–155. [Google Scholar] [CrossRef]
  33. van Wee, B.; Geurs, K.; Chorus, C. Information, communication, travel behavior and accessibility. J. Transp. Land Use 2013, 6, 1–16. [Google Scholar]
  34. Ortuzar, J.D.D.; Willumsen, L.G. Modelling Transport, 4th ed.; John Wiley & Sons, Ltd.: Hoboken, NJ, USA, 2011. [Google Scholar] [CrossRef]
  35. van Wee, B.; Hagoort, M.; Annema, J.A. Accessibility measures with competition. J. Transp. Geogr. 2001, 9, 199–208. [Google Scholar] [CrossRef]
  36. Geurs, K.T.; Van Wee, B. Accessibility Evaluation of Land-Use and Transport Strategies: Review and Research Directions. J. Transp. Geogr. 2004, 12, 127–140. [Google Scholar] [CrossRef]
  37. Hernandez, D.; Rossel, C. Inequality and access to social services in Latin America: Space–time constraints of child health checkups and prenatal care in Montevideo. J. Transp. Geogr. 2015, 44, 24–32. [Google Scholar] [CrossRef]
  38. Scholl, L.; Bouillon, C.P.; Oviedo, D.; Corsetto, L.; Jansson, M. Urban Transport and Poverty: Mobility and Accessibility Effects of IDB-Supported BRT Systems in Cali and Lima (RPRT); Inter-American Development Bank: Washington, DC, USA, 2016. [Google Scholar]
  39. Guzman, L.; Oviedo, D.; Cardona, R. Accessibility Changes: Analysis of the Integrated Public Transport System of Bogotá. Sustainability 2018, 10, 3958. [Google Scholar] [CrossRef]
  40. Bocarejo, J.P.; Portilla, I.J.; Velásquez, J.M.; Cruz, M.N.; Peña, A.; Oviedo, D.R. An innovative transit system and its impact on low income users: The case of the Metrocable in Medellín. J. Transp. Geogr. 2014, 39, 49–61. [Google Scholar] [CrossRef]
  41. Jaramillo, C.; Lizárraga, C.; Grindlay, A.L. Spatial disparity in transport social needs and public transport provision in Santiago de Cali (Colombia). J. Transp. Geogr. 2012, 24, 340–357. [Google Scholar] [CrossRef]
  42. Delmelle, E.C.; Casas, I. Evaluating the spatial equity of bus rapid transit-based accessibility patterns in a developing country: The case of Cali, Colombia. Transp. Policy 2012, 20, 36–46. [Google Scholar] [CrossRef]
  43. Sanchez, T.W. The connection between public transit and employment: The cases of Portland and Atlanta. J. Am. Plan. Assoc. 1999, 65, 284–296. [Google Scholar] [CrossRef]
  44. Oviedo-Dávila, N. Does Proximity to Massive Transport Systems Reduce the Probability of Being Informally Employed? Evidence from Bogota; The London School of Economics and Political Science (LSE): London, UK, 2017. [Google Scholar]
  45. Martinez, D.; Mitnik, O.; Oviedo, D.; Scholl, L.; Yañez-Pagans, P. Connecting to Opportunity? The Role of Public Transport in Promoting Women’s Employment in Lima; Inter-American Development Bank: Washington, DC, USA, 2018. [Google Scholar]
  46. Scholl, L.; Martinez, D.; Mitnik, O.A.; Oviedo, D.; Yañez-Pagans, P. A Rapid Road to Employment? The Impacts of a Bus Rapid Transit System in Lima; Inter-American Development Bank: Washington, DC, USA, 2018. [Google Scholar]
  47. Sabatini, F. Social Segregation of Space in Latin American Cities; Institute of Urban and Territorial Studies; Blue Series N” 35; Pontificia Universidad Católica de Chile: Santiago, Chile, 2003. [Google Scholar]
  48. Japan International Cooperation Agency. The Master Plan for Lima and Callao Metropolitan Area Urban Transportation in the Republic of Peru; Japan International Cooperation Agency (JICA): Lima, Peru, 2005.
  49. Nippon Koei, C.O. Final Report: Data Collection Survey on Urban Transport for Lima and Callao Metropolitan Area; Japan International Cooperation Agency (JICA) and Ministry of Transport and Communications: Lima, Peru, 2013.
  50. Centro Nacional de Planificación Estratégico (CEPLAN). Informal Economy in Peru: Current Situation and Prospects; Advanced Research Series 8: Lima, Peru, 2016.
  51. Bielich Salazar, C. of the Penny: A Look toward Public Transport in the Metropolitan Area of Lima. 2009. Available online: http://repositorio.iep.org.pe/handle/IEP/310 (accessed on 14 May 2019).
  52. Protransporte. Institutional Operational Plan for 2014. 2014. Available online: http://www.protransporte.gob.pe/attachments/article/11/resolucion-220-APROBACION-POI-2014.pdf (accessed on 14 May 2019).
  53. Instituto Nacional de Estadística e Informática (INEI). Available online: https://www.inei.gob.pe/prensa/noticias/cerca-de-10-millones-de-personas-viven-en-lima-metropolitana-8818/ (accessed on 20 January 2018).
  54. Jeekel, H. Inclusive Transport: Fighting Involuntary Transport Disadvantage; Elsevier: Amsterdam, The Netherlands, 2019. [Google Scholar]
  55. Oviedo Hernandez, D.; Titheridge, H. Mobilities of the periphery: Informality, access and social exclusion in the urban fringe in Colombia. J. Transp. Geogr. 2015, 55, 152–164. [Google Scholar] [CrossRef]
  56. Cervero, R. Transport Infrastructure and the Environment in the Global South: Sustainable Mobility and Urbanism. J. Reg. City Plan. 2014, 25, 174–191. [Google Scholar] [CrossRef] [Green Version]
  57. Hidalgo, D.; Huizenga, C. Implementation of sustainable urban transport in Latin America. Res. Transp. Econ. 2013, 40, 66–77. [Google Scholar] [CrossRef]
  58. UN-HABITAT. The State of the World’s Cities: Prosperity of Cities, the UN Habitat. 2012. Available online: https://sustainabledevelopment.un.org/content/documents/745habitat.pdf (accessed on 28 February 2019).
  59. Ben-Akiva, M.; Lerman, S.R. Disaggregate travel and mobility-choice models and measures of accessibility. In Behavioural Travel Modelling; Croom Helm: Andover, UK, 1979. [Google Scholar]
  60. Maia, M.L.; Lucas, K.; Marinho, G.; Santos, E.; de Lima, J.H. Access to the Brazilian City—From the perspectives of low-income residents in Recife. J. Transp. Geogr. 2016, 55, 132–141. [Google Scholar] [CrossRef] [Green Version]
  61. UN-HABITAT. Planning and Design for Sustainable Urban Mobility: Global Report on Human Settlements; Taylor & Francis: New York, NY, USA, 2013. [Google Scholar]
  62. Calderón, J. The formalization of property in Peru 2001–2002: The case of Lima. Habitat Int. 2004, 28, 289–300. [Google Scholar] [CrossRef]
  63. National Center for Strategic Planning—CPLAN. Multi-Year Strategic Plan for Employment and Job Promotion (2017–2021). Peru. 2016. Available online: https://www.ceplan.gob.pe/documentos_/plan-estrategico-sectorial-multianual-pesem-trabajo-y-promocion-del-empleo-2017-2021/#ixzz58W9XDg5x (accessed on 14 May 2019).
  64. National Institute of Statistics and Informatics (INEI). National Economic Census 2008. Available online: http://webinei.inei.gob.pe/anda_inei/index.php/catalog/267 (accessed on 14 May 2019).
Figure 1. Percentage of low-income residents per transport analysis zone (TAZ). Source: JICA and INEI data, 2007.
Sustainability 11 02795 g001
Figure 2. Selection of treatment and control areas. Source: JICA, 2007, OD survey data and Protransporte, 2015.
Sustainability 11 02795 g002
Figure 3. Distribution of jobs along the bus rapid transit (BRT) system, 2008.
Sustainability 11 02795 g003
Figure 4. Distribution of employment in Lima and heatmap of businesses with higher job supply—Lima, 2008. Source: Census data [64].
Sustainability 11 02795 g004
Figure 5. Employment concentration in BRT catchment areas. Source: Census data [64].
Sustainability 11 02795 g005
Figure 6. Fitted line: accessibility index (ratio of jobs accessed to jobs available) as a function of generalized travel costs by socioeconomic stratum (full sample model)—Lima, 2004. Source: JICA data, 2005.
Sustainability 11 02795 g006
Figure 7. Potential accessibility ratio versus percentage of trips in the BRT, 2012 (Metropolitano only sub-sample) Source: OD survey data from JICA (2012) and Peruvian Economic Census Data (2008).
Sustainability 11 02795 g007
Figure 8. Potential accessibility for users of public transit versus percentage of trips in BRT, 2012 (Metropolitano only sub-sample). Source: OD survey data from JICA 2004 and 2012.
Sustainability 11 02795 g008
Table 1. Average travel costs and sample sizes for work trips in public transit—Lima, 2004.
SampleMean Travel Time (Minutes)Standard Deviation (SD) Travel Time (Minutes)Mean Generalized Travel Cost (PNS *)SD Generalized Travel Cost (PNS)N Origin–Destination Pairs
City *43.122.82.72.13358
Control42.121.32.72.51447
Treatment43.923.92.61.61911
Calculations include all observations from the control group, treatment group, and others. * Peruvian Nuevo Sol (PNS). Source: Origin destination (OD) survey data from JICA 2004 and 2012.
Table 2. Estimation results for the accessibility index impedance parameter (generalized travel cost)—samples by groups of interest model.
Accessibility Index β i m Standard Errort-ValueNAdjusted R-Squared
Full sample−1.0250.006−18413,2500.720
Control group−1.0140.009−12032570.684
Treatment group−0.9790.010−9265680.720
Note: the accessibility index is the ratio of jobs accessed to jobs available. Source: OD survey data from JICA, 2004.
Table 3. Differences in mean travel times (minutes) between socioeconomic groups for treatment and control.
Group20042012NDifference%Confidence Interval
Treatment
High SES43.946.512452.65.90%(−0.15; 5.36)
Low SES48.5506661.53.10%(−3.21; 3.45)
Control
High SES4447.48873.47.60%(1.53; 5.17)
Low SES47.847.97390.10.20%(−3.21; −3.45)
Source: OD survey data from JICA, 2004 and 2012.
Table 4. Differences in mean monetary costs (2004 PNS) of travel by socioeconomic groups and treatment and control.
Group20042012NDifference%Confidence Intervalp-Value
Treatment
High SES2.593.3012450.7127.4%(0.53; 0.89)0.00
Low SES3.123.556660.4313.9%(0.03; 0.84)0.03
Control
High SES2.863.118870.258.80%(0.57; 0.81)0.00
Low SES2.863.607390.7426.2%(0.28; 1.21)0.00
Source: OD survey data from JICA 2004 and 2012.
Table 5. Differences in mean accessibility indices by socioeconomic and treatment and control groups.
Group20042012NDifference%Confidence Intervalp-Value
Treatment
High SES0.140.111245−0.03−22%(−0.05; −0.01)0
Low SES0.090.07666−0.02−19%(−0.04; 0.00)0.08
Control
High SES0.140.1887−0.04−29%(−0.05; −0.03)0
Low SES0.090.08739−0.01−15%(−0.03; −0.00)0.09
Difference in Difference
High SES 0.017.00%(−0.06; 0.02)0.2
Low SES −0.01−11%(−0.07; 0.01)0.26
Source: OD survey data from JICA, 2004 and 2012.

